EP0072330A2 - Pressure measuring system with ultrasonic wave - Google Patents
Pressure measuring system with ultrasonic wave Download PDFInfo
- Publication number
- EP0072330A2 EP0072330A2 EP82401503A EP82401503A EP0072330A2 EP 0072330 A2 EP0072330 A2 EP 0072330A2 EP 82401503 A EP82401503 A EP 82401503A EP 82401503 A EP82401503 A EP 82401503A EP 0072330 A2 EP0072330 A2 EP 0072330A2
- Authority
- EP
- European Patent Office
- Prior art keywords
- pressure
- ultrasonic wave
- measuring
- bubbles
- wave
- Prior art date
- Legal status (The legal status is an assumption and is not a legal conclusion. Google has not performed a legal analysis and makes no representation as to the accuracy of the status listed.)
- Granted
Links
Images


Classifications
-
- A—HUMAN NECESSITIES
- A61—MEDICAL OR VETERINARY SCIENCE; HYGIENE
- A61B—DIAGNOSIS; SURGERY; IDENTIFICATION
- A61B8/00—Diagnosis using ultrasonic, sonic or infrasonic waves
- A61B8/48—Diagnostic techniques
- A61B8/481—Diagnostic techniques involving the use of contrast agent, e.g. microbubbles introduced into the bloodstream
-
- G—PHYSICS
- G01—MEASURING; TESTING
- G01L—MEASURING FORCE, STRESS, TORQUE, WORK, MECHANICAL POWER, MECHANICAL EFFICIENCY, OR FLUID PRESSURE
- G01L11/00—Measuring steady or quasi-steady pressure of a fluid or a fluent solid material by means not provided for in group G01L7/00 or G01L9/00
- G01L11/04—Measuring steady or quasi-steady pressure of a fluid or a fluent solid material by means not provided for in group G01L7/00 or G01L9/00 by acoustic means
-
- G—PHYSICS
- G01—MEASURING; TESTING
- G01S—RADIO DIRECTION-FINDING; RADIO NAVIGATION; DETERMINING DISTANCE OR VELOCITY BY USE OF RADIO WAVES; LOCATING OR PRESENCE-DETECTING BY USE OF THE REFLECTION OR RERADIATION OF RADIO WAVES; ANALOGOUS ARRANGEMENTS USING OTHER WAVES
- G01S15/00—Systems using the reflection or reradiation of acoustic waves, e.g. sonar systems
- G01S15/88—Sonar systems specially adapted for specific applications
- G01S15/89—Sonar systems specially adapted for specific applications for mapping or imaging
- G01S15/8906—Short-range imaging systems; Acoustic microscope systems using pulse-echo techniques
- G01S15/8979—Combined Doppler and pulse-echo imaging systems
-
- G—PHYSICS
- G01—MEASURING; TESTING
- G01S—RADIO DIRECTION-FINDING; RADIO NAVIGATION; DETERMINING DISTANCE OR VELOCITY BY USE OF RADIO WAVES; LOCATING OR PRESENCE-DETECTING BY USE OF THE REFLECTION OR RERADIATION OF RADIO WAVES; ANALOGOUS ARRANGEMENTS USING OTHER WAVES
- G01S7/00—Details of systems according to groups G01S13/00, G01S15/00, G01S17/00
- G01S7/52—Details of systems according to groups G01S13/00, G01S15/00, G01S17/00 of systems according to group G01S15/00
- G01S7/52017—Details of systems according to groups G01S13/00, G01S15/00, G01S17/00 of systems according to group G01S15/00 particularly adapted to short-range imaging
- G01S7/52023—Details of receivers
- G01S7/52036—Details of receivers using analysis of echo signal for target characterisation
- G01S7/52038—Details of receivers using analysis of echo signal for target characterisation involving non-linear properties of the propagation medium or of the reflective target
-
- G—PHYSICS
- G01—MEASURING; TESTING
- G01N—INVESTIGATING OR ANALYSING MATERIALS BY DETERMINING THEIR CHEMICAL OR PHYSICAL PROPERTIES
- G01N2291/00—Indexing codes associated with group G01N29/00
- G01N2291/02—Indexing codes associated with the analysed material
- G01N2291/028—Material parameters
- G01N2291/02872—Pressure
Definitions
- the present invention relates to a liquid pressure measuring system, particularly to a system for non-destructively measuring with ultrasonic wave from outside a blood pressure, for example, in the heart of a living body or a pressure of flowing liquid used in an ordinary chemical industry showing particularly high temperature and pressure, high probability of chemical reaction or existence of solid particles or fibres, etc. in case it is difficult to insert a pressure gauge directly into a measuring object.
- the catheter equipping a pressure sensor has been inserted into the blood vessels or heart in order to measure a blood pressure, however this method is accompanied by such a disadvantage as not only giving pain to a body but also giving a risk to a life by unexpected misoperation or infection of bacterium, etc. It is also widely known acoustically to detect blockade of blood flow in the arm or start of pulsation by winding the air tube around the arm and changing the air pressure. This method, however, can be applied to the arms and legs but cannot be used for measurement of internal organs such as the heart.
- an object of the present invention to provide a method of non-destructively measuring a pressure of a desired region within a substance from outside.
- an ultrasonic wave is applied to the desired region within a substance in view of generating bubbles within the liquid existing at said region during the negative pressure cycle and thereafter generation of bubbles is detected by harmonic or subharmonic ultrasonic wave accompanying such bubbles and/or by the echo of another ultrasonic wave of higher frequency applied to said region.
- an ultrasonic wave means a sound wave of a frequency higher than the audible frequency (16 kHz or higher).
- an ultrasonic wave is deemed to include both the audible sound wave and the ultrasonic wave in the above mentioned sense.
- the present invention utilizes the so-called phenomenon of cavitation where the gas and/or water content melted or absorbed in the blood, lymph and cell liquid etc. existing in the heart, blood vessel or organs of a human body are isolated or vaporized by the negative pressure of an ultrasonic wave applied externally, to generate micro bubble nuclei and then grow up to large bubbles.
- the bubble generating pressure is a function of the ambient pressure (about 1 atm on the ground or sea level), the temperature, the frequency of the ultrasonic wave applied and the condition whether it is a progressive wave or a standing wave. It also depends on the fact that the liquid to be measured has sufficiently degassed or on the contrary has been exposed to or has absorbed the gas sufficiently.
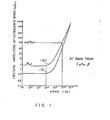
- Fig.1 shows the measurement of the critical amplitude of an ultrasonic wave for generating bubbles under an ambient pressure of I atm and the room temperature, (a) with water sufficiently degassed and (b) with water sufficiently aerated.
- the horizontal axis indicates the frequency, while the longitudinal axis indicates the sound pressure (amplitude).
- the profile changes around the frequency zone of about 10 4 to 10 Hz.
- the critical pressure for generating bubbles does not depend on the frequency, but largely depends on the frequency at 10 5 Hz or higher. This indicates that a time duration of about 10 -4 second is necessary for formation of nuclei and growth of bubbles.
- the nuclei bubbles are outstandingly different from the liquid in the acoustic impedance and give intensive reflection and scattering.
- the nuclei bubbles are generally equivalent or smaller than a wavelength, in the frequency range from 1M to 10 MHz and generate a Rayleigh scattering. Its energy is proportional to the square of frequency. Therefore, the higher the frequency, the higher the sensitivity.
- the ultrasonic wave is however exponentially attenuated as it is transmitted into a living body and its attenuation coefficient is almost proportional to the frequency. In case the frequency is high, the ultrasonic wave is as much attenuated during forward and backward transmission for the detection of nuclei bubbles at the deeper region of the human body. Therefore, the ultrasonic wave of 1MHz to 10MHz is suitable for detection of bubbles within a human body.
- the reflected waves can be discriminated easily in case of measuring a blood pressure within the heart of large blood vessels because the reflected wave from blood is weak whereas an intensive reflected wave appears due to the bubble generation. In contradistinction thereto it is difficult to discriminate the bubble generation if an intensive reflected wave from the structural tissues coexists at the region, such as the part near the blood vessel wall, small blood vessel, lymph vessel and tissue fluid. However even in such a case, if the liquid is flowing, the reflected wave has the Doppler shift due to the flow of nuclei bubbles.
- An embodiment of the present invention provides a system of eliminating reflection from the structural organs by extracting such Doppler shift and of detecting bubble generation with Doppler signal and also provides, as a result, highly sensitive measurement. This system realizes simultaneously the measurement of both flow rate and pressure, resulting in the effect of obtaining highly accurate and detailed data.
- a method of sweeping the pressure can be selected freely but it is easiest to utilize a sine wave.
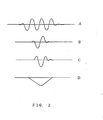
- the continuous wave A or the burst wavesB shown in Fig.2, or the pulse wave C shown in Fig.2 can be used.
- a wider band width is necessary in the sequence of A, B and C around the center frequency f.
- the center frequency f it is desirable to set the center frequency f to a value, for example, 10 kHz from Fig.1 because the nuclei bubble generating pressure can be lowered.
- the high sensitivity nuclei bubble detection of the present invention allows use of a higher frequency as the ultrasonic wave for nuclei bubble generation but it is desirable that the attenuation within a human body can be ignored and consequently it is desirable to select the frequency to 1000 kHz or less.
- Attenuation by tissues is of the order of I db/MHz.cm and therefore attenuation becomes 0.2 db when the ultrasonic wave of 10 kHz is applied to a depth of 20 cm from the surface of a human body and such attenuation can almost be ignored.
- the blood is considered as the measuring liquid.
- the blood pressure in the heart rapidly changes and is denoted as P p (t.) for each pulsation with reference to the ambient pressure Pa (generally an atmospheric pressure) and it is a current subject to measure Pp(t) from the outside of body.
- Pa generally an atmospheric pressure
- Pc critical pressure
- P(t) The absolute pressure of blood is denoted as P(t), and is always changing due to pulsation.
- the frequency f is selected, for example, to be equal to about 10 kHz so that Q(t) changes at a substantially higher speed than P p (t).
- P p (t c ) can be obtained when the values of Q 0' t c , P a' P c are known.
- Q 0 , t c , P a can be measured and P c can be obtained by calibrating the measuring result by the other measuring method as explained later.
- the critical pressure P c can be obtained previously in the case of an industrial system, but it changes when a chemical reaction progresses step by step and also, in the case of a human body, temperature and degree of gasification sometimes change largely depending on time due to a history of living (exercise, sleeping etc.) or between individuals.
- a method of determining P c of the blood of a human body is explained below.
- the artery pressure P ' of the upper arm is often measured by the following procedures. Namely, the air rubber tube is wound around the arm in order to temporarily block the flow of blood by increasing the air pressure, then the pulsating condition is monitored with the acoustic receiver while gradually decreasing the air pressure and the maximum blood pressure P ' max is measured by acoustically detecting a sound generated when the peak pulse flows again while the minimum blood pressure P ' min is measured by detecting a sound generated when the lower limit of pulse flows again.
- the maximum blood pressure can be measured with higher accuracy and it is desirable to calibrate the critical pressure with this value.
- the vein pressure and tissue liquid pressure can be measured by directly inserting the pressure sensor into the blood vessel or tissue and it is exceedingly safer than insertion into the artery.
- the P ' max is measured previously at the upper arm portion by these method and thereafter the same portion is measured under the same condition by the method of the present invention.
- a value of P can be obtained by assuming that the result of such measurement is equal to said P ' max measured previously.
- a value of P p can be measured at the desired area by calibrating P at the more feasible and safer region.
- the necessary applied pressure Q O can be lowered and the response time can also be improved by previously dissolving or absorbing the harmless gas which easily becomes bubbles such as the noble gas like helium or carbon di-oxide into the blood.
- These gases can be dissolved sufficiently into the blood in the breathing operation by placing a living body under the ambient atmosphere obtained by replacing a part of nitrogen within the chamber of I atm or adding some pressure of the mixture. It is also possible to introduce gas directly into the blood vessel by injection of well gasified liquid or volatile liquid. As explained above, measurement can be done with small Q by increasing the critical pressure P .
- the response time is improved and the number of times of measuring sweep can be increased. Reduction of QO not only makes easy and economical the designing of unit but also minimizes the effect of ultrasonic wave on a human body.
- the desired timing and area for measuring can be obtained and also noise and unwanted signal can be eliminated by synchronizing the applying time and area and measuring time and area so that the ultrasonic wave for detecting bubbles is applied to the measuring area only at the phase when the negative sweep of pressure is at the measuring area.
- Fig.3 and Fig.4 show the methods of forming the ultrasonic wave amplitude which can be applied to an area which does not prevent transmission of the ultrasonic wave, such as abdomen and arms or legs
- Fig.5 shows the method which can be applied to the case where the ultrasonic wave cannot pass through a body because a lung having air therein exists behind the heart and therefore becomes an intensive reflector due to a large difference of acoustic impedance between the air and tissue, preventing the ultrasonic wave from passing through the body.
- 1 is the transducer forming the sweep pressure and is driven, for example, by a center frequency of 10 kHz. In case it is applied to a human body, a diameter of 50 to 200 mm is most desirable. It also provides a hole with a diameter of about 15 to 25 mm at the center in order to mount the bubble detection transmitter/receiver transducer 5.
- 2 is a human body and 3 is a particular tissue such as the heart, liver or artery and 4 is the measuring area within such tissue. The dimension of the measuring area 4 is determined by the beam diameter of bubble detection ultrasonic wave and the drive pulse lenght or the gate width for extracting the measuring signal from the reflected receiving signal with the timing gate.
- the bubble detection emitter/receiver transducer having a center frequency of, for example, 3.5 MHz.
- the diameter required for obtaining a sufficiently converging beam is about 10 mm.
- the size of the measuring area 4 can be set to several millimeters.
- Fig.3 A shows the example where transducers 1, 5, and the human body 2 are respectively arranged within the water which is the sound conductive medium and a reflector 6 consisting of a metal plate having an acoustic impedance which is largely different from that of water or a living body, is also arranged within the water opposing to transducer 1 with the distance of n x half- wavelength X/2. Simultaneously the transducer 1 transmits a continuous wave in the wavelength ⁇ . Thereby, the resonant condition is formed between the transducer I and the reflector 6, thus forming a standing wave as shown in Fig.3 B.
- the wavelength in the water or a living body is 15 cm.
- n is selected to 4, for example, the distance between the transducer 1 and the reflector 6 becomes 30 cm ((15/2 x 4). This is sufficient for placing the abdomen of a human body between the transducer 1 and the reflector 6.
- the vibration loop center of the standing wave can be set to the measuring area by shifting the transducer 1 and the reflector 6 or both while keeping the distance between the transducer I and the reflector 6 at a constant value.
- generation of nuclei bubbles can be obtained by using a half cycle of negative swing for the pressure sweep.
- Fig. 4 A is an example of using a progressing wave.
- 7 is the plastic bag containing the water which is used in place of the water in Fig. 3 A. This plastic bag exists between the transducer 1 and the body 2 which can be the abdomen of a human body. Jelly or oil is applied at the contact surface, thus obtaining excellent transmission of the ultrasonic wave by eliminating the air.
- 8 is also a plastic bag containing water
- 9 is a nonreflective absorber of the ultrasonic wave"consisting of plastic or rubber containing metallic powder or bubble corpuscles.
- the plastic bag 8 and the absorber 9 are integrated and the jelly or oil is of course applied at the contact surface between the body 2 and the plastic bag 8 in order to eliminate the air.
- the transducer 1 transmits a pulse wave such as the curve C shown in Fig.2, such pulse wave progresses into the absorber 9 from the transducer I at the sound velocity (about 1500 cm/sec in the water) and is absorbed.
- Fig. 4 B shows the distribution of pressure in a moment during transmission.
- a pressure of the measuring area 4 has the same waveform than the one of transducer: 1 but is just delayed by a time obtained by dividing the distance between the transducer 1 and the measuring area 4 with the sound velocity, and changes as the time goes by. Namely, the pressure sweep is carried out.
- Fig.5 shows the case where a strong absorber or reflector like a lung exists behind the measuring area 4 such as the heart.
- a strong absorber exists behind the measuring area
- the sweep pressure at the measuring area 4 becomes uncertain because the pressure field is formed at the area 4 by both the reflected wave from the reflecting surface 10 and the field of the progressing wave from the transducer 1.
- the width of the progressive wave must be shortened by setting the center frequency at 100 - 1000 kHz and also the applying direction (incident direction) must be changed as shown in Fig.7.
- the existence and location of a reflecting body can be detected by using the transducer 1 as the receiver or by the transducer 5.
- Fig. 5 shows the pressure distribution in a moment.
- the size (diameter) of the transducer 1 cannot be made too large for the practical use and therefore it becomes almost equal to the wavelength and as a result, the wave generated becomes similar to a spherical wave.
- the transducer In Fig. 3 A, the transducer must supply the drive energy which meets the energy spherically diverging in all directions other than the direction of reflector 6 in order to obtain a resonance between the transducer I and the reflector 6.
- the transmitter surface of transmitter 1 is not requested to be flat and can be formed as a concave surface in order to force the energy to converge to the required direction.
- a pressure amplitude along the axis of transducer 1 changes as a function of the distance z and therefore it is necessary to get the function previously, by setting the transducer 1 in water without a human body 2 and measuring the pressure as a function of the axial distance z.
- the bubble detection transducer 5 can be flat or concave and can also be of the phased array type with multi-elements. As material, structure, circuit etc., those used by so-called A mode, M mode, B mode and Doppler measurement can be used.
- the measuring area can be determined while observing the sectional view of the B mode.
- a method similar to the well known Doppler measurement combining the B mode can be used.
- the transducer 5 can be mounted in a port of transducer 1 as shown in the drawing for measurement and it can also be mounted in a location other than the transducer 1 for the measurement.
- the sector scanning can be done by the transducer 5 itself and the scanning for detecting bubbles passing the measuring area 4 may be done during the scanning.
- the Doppler effect cannot be used because the measuring area 4 has no flow and detection must be made by extracting a change of reflection intensity.
- the burst wave (having a time duration of about lps) with a center frequency of 3.5 MHz is .transmitted from transducer 5
- the pulse becomes a burst wave of about 1.5 mm length and progresses at a rate of about 1 .5 mm/us.
- This pulse progresses sending back the reflected waves from each point in accordance with a change of acoustic impedance.
- the receiving waveform of transducer 5 is continuous and complicated.
- the receiving waveformat a time when the reflected waveform from the position 4 reaches the transducer 5 can be observed by extracting it with the timing gate.
- the reflected signal from the measuring area 4 can be obtained with a single scanning as explained above. Namely, when the measuring area 4 is located at the depth of about 20 cm within a body, the time required for the forward and backward transmission of ultrasonic'wave is 266 us and measurements of 3760 times per second can be done.
- the measuring area 4 is located in the flow of the heart or blood vessel not only the simple reflection intensity but also the Doppler shift caused by blood flow can be analyzed and detected by the well know method.
- the doppler method is very effective for eliminating reflected waves from structural tissues.
- the applied pressure is of a center frequency 10 kHz and swept to negative direction sinusoidaly
- the negative half cycle is about 50 ⁇ s. Therefore, a single detection can be obtained in a single sweep.
- the critical pressure can be detected by repeated sweeps and detections where the phasesof transmitting and receiving waves of both ultrasonic waves for pressure sweep and detection are shifted a little at each time. Detail of such procedures is shown in Fig.6.
- the heart pulsation is 1 to 2 times per second, it is a sufficient frequency for following the dynamic change of pressure.
- measurement can be done by adequately shifting the phase so that the measuring points are sequentially placed in such rapidly changing period by synchronization with the electrocardiograph signal.
- Fig.6 A shows how the sweep of the pressure is formed at the measuring area 4.
- the vertical axis indicates the absolute pressure (t), which is given as a sum of the atmospheric pressure P a , the heart pressure P p (t) with reference to the atmospheric pressure and applied sweep pressure -Q 0 .sin (2 ⁇ ft).
- P c is the bubble-forming critical pressure.
- the horizontal axis indicates the time t. When P (t) is lower than P c , the bubble is generated.
- Fig.6 B shows the reflected signal extracted by the time gate.
- the vertical axis indicates the amplitude, while the horizontal axis indicates the time.
- T is the timing when the ultrasonic wave pulse is transmitted.
- M is the timing when the transmitted pulse reaches the measuring area 4.
- R is the timing when the reflection signal from the measuring area 4 is received.
- V the sound velocity
- V the time interval between T and R is given by 2 l/v and the following relation is obtained :
- T - M M - R.
- the sending time T is synchronized to the applied pressure waveform so that the measuring time M 1 coincides with the time tl of the sweep pressure.
- Fig. 6 B shows the waveforms obtained by extracting only the Doppler shift signals from the reflection signals of Fig. 6 B.
- the signals R 1 ', R 2 ' are sufficiently small as compared with the signals R 3 ', R 4 ', R 5 ', and improve the bubble detection accuracy.
- the bubble-forming critical pressure P can be obtained from the point where bubble generation starts.
- the bubble-forming critical pressure P can also be obtained from the minimum Q 0 for detecting bubble generation which can be obtained by adjusting such Q 0 .
- the detecting waveforms 11, 12, ... are overlapping on time in order to make clear the phase relation with the pressure sweep waveforms.
- the waveforms 11, 12, ... are sent and received for different sweep cycles.
- the condition of measuring point 4 can be measured continuously by sending the bubble detection ultrasonic wave as a continuous wave in place of the pulse as shown in Fig. 6 A. This embodiment is explained below, upon reference to Fig. 7.
- Fig. 7, 2 is a human body, 3 is the heart and 4 is the measuring area being selected in the blood flow in the left atrium in the figure.
- 1 is the ultrasonic transducer for pressure sweep and it is driven by a center frequency of 10 to 1000 kHz.
- the waveform is generated in a waveform generator 22.
- the waveform generator 22 digitally stores the waveforms which are previously A/D converted in series and generates wave forms with D/A conversion by sequentially reading the stored data.
- the center frequency can be changed by changing the period of the read clock.
- Circuit 21 drives the transducer 1 through the power amplification of the waveform produced by the generator 22 and forms the necessary sweep negative pressure.
- 5 is the bubble detection probe.
- the transmitting unit 5' and receiving unit 5" are provided individually and the continuous wave with M sequence modulation is transmitted and received.
- 24 is the base frequency generator utilizing a crystal oscillation unit and it generates, for example, a frequency of 2 MHz.
- 25 is the M sequence modulation circuit, which sequentially reads the M sequence codes previously stored in the ROM in accordance with the clock from 23 and, for example, phase-modulates the base sine signal.
- 26 is the power amplifier for driving the transmitting unit 5'.
- 5" is the receiving unit and the received signal is amplified by the receiving amplifier circuit 27.
- the M sequence code from the circuit 25 are sent to the circuit 30 via the variable delay circuit 28 which provides a delay equal to the traveling time of the sound forward and backward along the paths transmitting unit 5', measuring area 4 and receiving unit 5" by refering the preset value specified with ten-key in depth setting circuit 29 and is compared with the output of the amplifier circuit 27 by taking correlation between them.
- This is realized by the multiplication circuit 30.
- the output of the multiplication circuit 30 is orthogonally detected by a circuit 31 through comparison with the original oscillation signal.
- the real part and imaginary part are sent to the amplitude circuit 32, the square value of amplitude being thereby obtained by the integral circuit having a time constant shorter than the M sequence code length but longer than the code interval, for example, several tens of code length, and the square-sum circuit, and the squared amplitude is used as the Y 1 signal.
- the real or imaginary part output of the circuit 31 are sent to the Doppler extraction circuit 33.
- Such signal is detected after the band pass filter which has the function of limiting higher frequency allowing the Doppler shift frequency to pass whilst not allowing,the original oscillation frequency to pass and the function of limiting lower frequency not allowing the lower Doppler shift frequency due to the stationary of almost stationary speed motion to pass, and then sent to Y 2 as the Doppler signal. If it is necessary to judge the direction of blood flow, both real and imaginary part are used.
- the 23 is the timing control circuit which generates the required clock signals from the original oscillation frequency of the base frequency generator 24, and also generates the control signals using the built-in program for each portion.
- the actual pressure waveforms at each position of the measuring area 4 within the water caused by the transducer I are previously measured. These are stored, after the A/D conversion,into the sweep waveform storing circuit 34.
- the digitized waveforms are selected from the circuit 34 in accordance with the depth preset by the depth setting circuit 29. These are read by the clocks which control the read start timing and the read speed provided by the timing control circuit 23, and the data obtained are D/A converted by the D/A converter 35 and are used as the X axis deflection signal (negative sweep pressure) of the CRT of the display unit 36.
- the display unit 36 is a two- channel synchroscope, giving the respective outputs of the amplitude circuit 32 and the Doppler extraction circuit 33 to the Y 1 and Y 2 of Y axis. From this Y 1 -X curve and Y 2 -X curve, the critical pressure P can be confirmed, and the pressure P p can be obtained by reading the X values of the rising and falling points of the displayed curve. In this example, judging is made manually from the curve but it can be made automatically by electronic means. Of course, P can be digitally or analogously displayed and recorded continuously.
- a position calculating circuit 54 calculates the relative position of transducer 5 and B mode sector scan probe 50, and the data calculated are sent to the B mode display unit 55.
- the beam location of transducer 5 is displayed as a line on the B mode display unit 56 and the position corresponding to the measuring area 4 is displayed by increased brightness or marker in accordance with the depth information given by the depth setting circuit 29. This information is used for assigning the measuring area required on the sector scanned sectional view of a human body.
- the method of the present invention can also be used as a quite unique inspection or diagnostic means which is very useful for tissue characterization and early detection of disease by executing such a measurement to each point of a bidimensional plane and by displaying the result on the display unit as an image in two dimensions.
- the critical pressure P c of bubble generation it is rather easier and more efficient to get the relative distribution of the critical pressure P c of bubble generation than the absolute pressure of each point.
- the composition and temperature of the cell liquid are respectively different and the critical pressure P c is also different in each organ.
- the critical pressure P c it is not easy to obtain the critical pressure P c by calibrating it by the other measuring method at the other measuring area as shown in the case of blood.
- the critical pressure P c can be measured as a relative value to the atmospheric pressure,on the supposition that the absolute pressure is almost constant under the atmospheric pressure (this condition is almost always true except for the area near the heart), and the tissue characterization can be done by observing distribution on the bidimensional plane.
- the critical pressure P c of each tissue changes as time passes depending on the total body activity such as exercises, eating and sleeping etc. and such variation also appears in the blood.
- the more clear tissue characterization image elimitating said aging variation can be obtained by simultaneously measuring the critical pressure of blood and displaying the critical pressure of each tissue with the relative value obtained from said critical value of blood.
- Fig. 8 shows the block diagram of an embodiment for such an object.
- 80 is a measuring system similar to the system described with reference to Fig. 7. The only difference with respect to Fig. 7 is that the low frequency and high frequency ultrasonic wave transducers I and 5 can move in the vertical direction by means of a pulse motor 81.
- 82 is a measuring l o - cation scanning control circuit which operates in such a manner as sequentially to advance y of the bidimensional coordinate (x, y) and also advance x at a high speed for each y.
- 83 is the drive circuit of pulse motor 81 and generates the specified number of pulses for each advance of y, shifing the transducers 1, 5 by the specified pitch.
- 84 is a bubble generating detection circuit, which monitors the reflection of the high frequency ultrasonic wave sent from the orthogonal detection circuit 31 in Fig.7 and detects its rising time.
- 85 is a sampling circuit which samples the low frequency ultrasonic wave amplitude sent from the sweep waveform storing circuit 34 in Fig. 7, namely the relative sweep pressure value as a difference from the atmospheric pressure at the timing when the bubble generation is detected by said bubble detection circuit 84.
- 86 is ameasured-value temporary holding circuit, and 89 is a subtraction circuit.
- 88 is a bidimensional memory to which an output value of the subtraction circuit 89 is written at the address x, y.
- 87 is a display unit, which displays the measured value at each coordinate (x, y) stored in the bidimensional memory 88 in the brightness or color tone in accordance with the values as the plane image.
- a value of x from the circuit 82 is used to set the measuring area depth for the depth setting circuit 29 in Fig.7.
- the transducers I and 5 are applied to the upper part of the arm in order to measure the critical pressure P c of the artery blood with the procedures explained with reference to Fig. 7 and the value obtained is temporarily stored in the holding (register) circuit 86 as a reference. thereafter, the transducers 1 and 5 are moved to the desired place of the body and the critical pressures of respective measuring area are measured by sequentially changing x and y. These measured values are compared with the value in the register 86 by means of said subtraction circuit and the difference obtained is written into the bidimensional memory. Instead of subtraction, the ratio of tissue critical pressure to blood critical pressure can be used.
- measurement for one display format can be realized in about 25 seconds, for example, by changing x, y respectively for 1 to 500 in order to obtain picture elements of 500 x 500 and a continuous wave of 10 kHz is used as the low frequency ultrasonic wave.
- the propagation time is different in the area which is far from , respectively near the transducer, and some delay is generated by the drive of pulse motor. Consequently, a somehow longer period is required.
- An operation at higher speed can also be realized by employing transducers 1, 5 of the phased array type.
- the scanning in the direction y is then carried out electronically and measurements on individual points on the same line are carried out simultaneously by providing a plurality of pairs (for example, 500 pairs) of circuits 27, 28, 29, 30, 31, 34, 84, 85 in Fig.7.
- a scanning is carried out with polar coordinates instead of orthogonal coordinates and y represents the deflection angle, while x represents the distance from the center.
- the critical pressure P c of tissue is generally comparatively low, it is practical to previously raise the critical pressure P c by dissolving inactive gas such as helium, krypton and xenon or carbon dioxide gas.
- an application field which is similar to that of the tracer method by radioactive isotope can be developed by injecting a chemical substance which selectively works on the particular tissue and largely changes its critical pressure.
- an inner pressure of an industrial system or a living body can be measured non-invasively from the outside by detecting an ultrasonic cavitation generated by ultrasonic wave, resulting in the effect of measuring internal pressure safely without a risk of invasing a system or causing a living body to come to death, moreover without giving pain and without any fear of introduc- ting impurity or infection of disease.
- pressure distribution can also be measured on a real time basis.
Abstract
Description
- The present invention relates to a liquid pressure measuring system, particularly to a system for non-destructively measuring with ultrasonic wave from outside a blood pressure, for example, in the heart of a living body or a pressure of flowing liquid used in an ordinary chemical industry showing particularly high temperature and pressure, high probability of chemical reaction or existence of solid particles or fibres, etc. in case it is difficult to insert a pressure gauge directly into a measuring object.
- Currently, the catheter equipping a pressure sensor has been inserted into the blood vessels or heart in order to measure a blood pressure, however this method is accompanied by such a disadvantage as not only giving pain to a body but also giving a risk to a life by unexpected misoperation or infection of bacterium, etc. It is also widely known acoustically to detect blockade of blood flow in the arm or start of pulsation by winding the air tube around the arm and changing the air pressure. This method, however, can be applied to the arms and legs but cannot be used for measurement of internal organs such as the heart.
- In the field of industrial systems operating under a high temperature, low temperature and/or a-strong radiation field and handling the liquid which is chemically very active, of high viscosity or a dense mixture of grain particles, chips of wood and fibres etc., a pressure sensor has often been damaged by temperature, radiation, chemical reaction or by external force due to solid materials included. Therefore it has been wanted to measure a pressure from outside of a vessel or system but there has been no adequate method . OBJECT AND SUMMARY OF THE INVENTION
- Accordingly it is an object of the present invention to provide a method of non-destructively measuring a pressure of a desired region within a substance from outside. According to the process of the present invention, an ultrasonic wave is applied to the desired region within a substance in view of generating bubbles within the liquid existing at said region during the negative pressure cycle and thereafter generation of bubbles is detected by harmonic or subharmonic ultrasonic wave accompanying such bubbles and/or by the echo of another ultrasonic wave of higher frequency applied to said region.
- According to the common language, an ultrasonic wave means a sound wave of a frequency higher than the audible frequency (16 kHz or higher). However, according to the present invention, an ultrasonic wave is deemed to include both the audible sound wave and the ultrasonic wave in the above mentioned sense.
- The present invention utilizes the so-called phenomenon of cavitation where the gas and/or water content melted or absorbed in the blood, lymph and cell liquid etc. existing in the heart, blood vessel or organs of a human body are isolated or vaporized by the negative pressure of an ultrasonic wave applied externally, to generate micro bubble nuclei and then grow up to large bubbles. BRIEF DESCRIPTION OF THE DRAWINGS
- Fig.1 is a graph indicating relation between the critical sound pressure and the frequency for generating the cavitation.
- Fig.2 shows waveforms A, B, C, D, representing typical waveforms of the sound pressure to be applied.
- Fig.3A is a sectional view and Fig.3B a pressure distribution diagram of an embodiment which forms pressure sweep at the measuring area in a human body etc. with a standing wave.
- Fig.4A is a sectional view, and.Fig.4B is a pressure distribution diagram of an embodiment using a progressing wave.
- Fig.5A is a sectional view, and Fig.5B is a pressure distribution diagram of an embodiment using a progressing wave, in case there is an intensive reflector within an object.
- Fig.6A shows a diagram indicating a pressure wave form at the measuring region, when the pressure is swept by a pulse wave, Fig.6B shows a diagram indicating the timing of bubble detecting signal and Fig.6C shows a diagram indicating the timing relation for detection with the Doppler signal.
- Fig.7 shows the block diagram of a particular embodiment, in case a continuous wave modulated by the M sequence code is used as the bubble detecting ultrasonic wave, to measure a changing blood pressure in real time while confirming the measuring region on B mode image of the human heart.
- Fig.8 is the block diagram of an embodiment for indicating pressure or tissue parameters relating to cavitation according to a distribution in two dimensions.
- The bubble generating pressure is a function of the ambient pressure (about 1 atm on the ground or sea level), the temperature, the frequency of the ultrasonic wave applied and the condition whether it is a progressive wave or a standing wave. It also depends on the fact that the liquid to be measured has sufficiently degassed or on the contrary has been exposed to or has absorbed the gas sufficiently.
- As an example, Fig.1 shows the measurement of the critical amplitude of an ultrasonic wave for generating bubbles under an ambient pressure of I atm and the room temperature, (a) with water sufficiently degassed and (b) with water sufficiently aerated. The horizontal axis indicates the frequency, while the longitudinal axis indicates the sound pressure (amplitude). The profile changes around the frequency zone of about 104 to 10 Hz. At the frequencies under 104 Hz, the critical pressure for generating bubbles does not depend on the frequency, but largely depends on the frequency at 105Hz or higher. This indicates that a time duration of about 10-4 second is necessary for formation of nuclei and growth of bubbles.
- In the past experiments, it has been impossible to measure the critical pressure for formation of nuclei and it has been measured by optically recognizing the sufficiently grown bubbles or by means of the acoustic sound generated when the bubbles grow up and break. These methods result in a time lag for growth between application of pressure and detection of bubbles and thereby fluctuation of critical pressure measurement is induced and some delay of response time is caused. In the case of the present invention, bubbles are detected in the early stage where nuclei of bubbles are formed, thereby improving the measuring accuracy and decreasing the response time.
- The nuclei bubbles are outstandingly different from the liquid in the acoustic impedance and give intensive reflection and scattering. The nuclei bubbles are generally equivalent or smaller than a wavelength, in the frequency range from 1M to 10 MHz and generate a Rayleigh scattering. Its energy is proportional to the square of frequency. Therefore, the higher the frequency, the higher the sensitivity. The ultrasonic wave is however exponentially attenuated as it is transmitted into a living body and its attenuation coefficient is almost proportional to the frequency. In case the frequency is high, the ultrasonic wave is as much attenuated during forward and backward transmission for the detection of nuclei bubbles at the deeper region of the human body. Therefore, the ultrasonic wave of 1MHz to 10MHz is suitable for detection of bubbles within a human body.
- The reflected waves can be discriminated easily in case of measuring a blood pressure within the heart of large blood vessels because the reflected wave from blood is weak whereas an intensive reflected wave appears due to the bubble generation. In contradistinction thereto it is difficult to discriminate the bubble generation if an intensive reflected wave from the structural tissues coexists at the region, such as the part near the blood vessel wall, small blood vessel, lymph vessel and tissue fluid. However even in such a case, if the liquid is flowing, the reflected wave has the Doppler shift due to the flow of nuclei bubbles. An embodiment of the present invention provides a system of eliminating reflection from the structural organs by extracting such Doppler shift and of detecting bubble generation with Doppler signal and also provides, as a result, highly sensitive measurement. This system realizes simultaneously the measurement of both flow rate and pressure, resulting in the effect of obtaining highly accurate and detailed data.
- As explained above, measurement of critical pressure becomes more accurate and when an applied pressure is swept, a time delay is almost eliminated and the sweep speed can be increased by detecting generation of nuclei bubbles with a high sensitivity.
- A method of sweeping the pressure can be selected freely but it is easiest to utilize a sine wave. For this method, the continuous wave A or the burst wavesB shown in Fig.2, or the pulse wave C shown in Fig.2 can be used. In this case, a wider band width is necessary in the sequence of A, B and C around the center frequency f. Moreover, it is also possible to realize the sweep using a saw-tooth wave D as shown in Fig.2.
- It is desirable to set the center frequency f to a value, for example, 10 kHz from Fig.1 because the nuclei bubble generating pressure can be lowered. The high sensitivity nuclei bubble detection of the present invention allows use of a higher frequency as the ultrasonic wave for nuclei bubble generation but it is desirable that the attenuation within a human body can be ignored and consequently it is desirable to select the frequency to 1000 kHz or less. Attenuation by tissues is of the order of I db/MHz.cm and therefore attenuation becomes 0.2 db when the ultrasonic wave of 10 kHz is applied to a depth of 20 cm from the surface of a human body and such attenuation can almost be ignored.
- In the following explanation, the blood is considered as the measuring liquid. The blood pressure in the heart rapidly changes and is denoted as Pp(t.) for each pulsation with reference to the ambient pressure Pa (generally an atmospheric pressure) and it is a current subject to measure Pp(t) from the outside of body. Generation of nuclei bubbles by the cavitation in blood can be thought to depend on the absolute pressure when the degree of gasification, such as the rate of dissolving and absorbing gas, is constant and the temperature is also constant. Such critical pressure is denoted as Pc. The absolute pressure of blood is denoted as P(t), and is always changing due to pulsation. Thus, the following relation can be obtained.

- It takes several hours for Pa to change a little and Pp(t) indicates a change by pulsation which is slower than one msec. Here it is supposed that the sound field denoted as Q(t) is applied to the measuring area, which is given by the next equation.

- The frequency f is selected, for example, to be equal to about 10 kHz so that Q(t) changes at a substantially higher speed than Pp (t).
- At this time, the combined absolute pressure(t) becomes as follow.


- When Q0 is selected adequately in order to cause(t) to decrease to Pc or less in the negative cycle of Q(t), nuclei bubbles are generated in the range,
 (t) ≦ Pc , and at the timing tc when
 (t) = Pc, following relations can be obtained.


- Accordingly, Pp(tc) can be obtained when the values of Q0' tc , Pa' Pc are known. Here, Q0, tc, Pa can be measured and Pc can be obtained by calibrating the measuring result by the other measuring method as explained later.
- The critical pressure Pc can be obtained previously in the case of an industrial system, but it changes when a chemical reaction progresses step by step and also, in the case of a human body, temperature and degree of gasification sometimes change largely depending on time due to a history of living (exercise, sleeping etc.) or between individuals. Explained below is a method of determining P c of the blood of a human body, as an example.
- In case of blood flow within a human body which circulates in a closed loop, it can be thought that blood having the same temperature and gasification as the main measuring area, for example, the left ventricle of the heart, is flowing into the artery of upper arm and the vein blood of upper arm can be approximated to have the same temperature and gasification as that of the right ventricle (however the blood exchanges substances at the vasal capilare of lungs and tissues and therefore characteristics change through passing them). For this reason, when the critical pressures of the artery and vein of the upper arms can be obtained, the pressures of the left atrium and the left ventricle of the heart (artery blood) and the right atrium and the right ventricle (vein blood) can be measured. The artery pressure P ' of the upper arm is often measured by the following procedures. Namely, the air rubber tube is wound around the arm in order to temporarily block the flow of blood by increasing the air pressure, then the pulsating condition is monitored with the acoustic receiver while gradually decreasing the air pressure and the maximum blood pressure P ' max is measured by acoustically detecting a sound generated when the peak pulse flows again while the minimum blood pressure P ' min is measured by detecting a sound generated when the lower limit of pulse flows again. Generally, the maximum blood pressure can be measured with higher accuracy and it is desirable to calibrate the critical pressure with this value.
- The vein pressure and tissue liquid pressure can be measured by directly inserting the pressure sensor into the blood vessel or tissue and it is exceedingly safer than insertion into the artery.
- First, the P ' max is measured previously at the upper arm portion by these method and thereafter the same portion is measured under the same condition by the method of the present invention. Thus, a value of P can be obtained by assuming that the result of such measurement is equal to said P ' max measured previously. In the same way, in the case of industrial systems, a value of Pp can be measured at the desired area by calibrating P at the more feasible and safer region.
- Moreover, the necessary applied pressure QO can be lowered and the response time can also be improved by previously dissolving or absorbing the harmless gas which easily becomes bubbles such as the noble gas like helium or carbon di-oxide into the blood. These gases can be dissolved sufficiently into the blood in the breathing operation by placing a living body under the ambient atmosphere obtained by replacing a part of nitrogen within the chamber of I atm or adding some pressure of the mixture. It is also possible to introduce gas directly into the blood vessel by injection of well gasified liquid or volatile liquid. As explained above, measurement can be done with small Q by increasing the critical pressure P . Moreover, the response time is improved and the number of times of measuring sweep can be increased. Reduction of QO not only makes easy and economical the designing of unit but also minimizes the effect of ultrasonic wave on a human body.
- The desired timing and area for measuring can be obtained and also noise and unwanted signal can be eliminated by synchronizing the applying time and area and measuring time and area so that the ultrasonic wave for detecting bubbles is applied to the measuring area only at the phase when the negative sweep of pressure is at the measuring area.
- An embodiment applied to a human body is explained hereunder.
- Fig.3 and Fig.4 show the methods of forming the ultrasonic wave amplitude which can be applied to an area which does not prevent transmission of the ultrasonic wave, such as abdomen and arms or legs, while Fig.5 shows the method which can be applied to the case where the ultrasonic wave cannot pass through a body because a lung having air therein exists behind the heart and therefore becomes an intensive reflector due to a large difference of acoustic impedance between the air and tissue, preventing the ultrasonic wave from passing through the body.
- 1 is the transducer forming the sweep pressure and is driven, for example, by a center frequency of 10 kHz. In case it is applied to a human body, a diameter of 50 to 200 mm is most desirable. It also provides a hole with a diameter of about 15 to 25 mm at the center in order to mount the bubble detection transmitter/
receiver transducer 5. 2 is a human body and 3 is a particular tissue such as the heart, liver or artery and 4 is the measuring area within such tissue. The dimension of the measuringarea 4 is determined by the beam diameter of bubble detection ultrasonic wave and the drive pulse lenght or the gate width for extracting the measuring signal from the reflected receiving signal with the timing gate. 5 is is the bubble detection emitter/receiver transducer having a center frequency of, for example, 3.5 MHz. The diameter required for obtaining a sufficiently converging beam is about 10 mm. In this case the size of the measuringarea 4 can be set to several millimeters. - Fig.3 A shows the example where
transducers human body 2 are respectively arranged within the water which is the sound conductive medium and areflector 6 consisting of a metal plate having an acoustic impedance which is largely different from that of water or a living body, is also arranged within the water opposing totransducer 1 with the distance of n x half- wavelength X/2. Simultaneously thetransducer 1 transmits a continuous wave in the wavelength À. Thereby, the resonant condition is formed between the transducer I and thereflector 6, thus forming a standing wave as shown in Fig.3 B. - When the frequency is determined as 10 kHz, the wavelength in the water or a living body is 15 cm. For example, n is selected to 4, for example, the distance between the
transducer 1 and thereflector 6 becomes 30 cm ((15/2 x 4). This is sufficient for placing the abdomen of a human body between thetransducer 1 and thereflector 6. The vibration loop center of the standing wave can be set to the measuring area by shifting thetransducer 1 and thereflector 6 or both while keeping the distance between the transducer I and thereflector 6 at a constant value. As the pressure in the area changes with the sine wave of 10 kHz, of which maximum pressure amplitude is the one of loop, generation of nuclei bubbles can be obtained by using a half cycle of negative swing for the pressure sweep. - Fig. 4 A is an example of using a progressing wave. 7 is the plastic bag containing the water which is used in place of the water in Fig. 3 A. This plastic bag exists between the
transducer 1 and thebody 2 which can be the abdomen of a human body. Jelly or oil is applied at the contact surface, thus obtaining excellent transmission of the ultrasonic wave by eliminating the air. 8 is also a plastic bag containing water, and 9 is a nonreflective absorber of the ultrasonic wave"consisting of plastic or rubber containing metallic powder or bubble corpuscles.Theplastic bag 8 and theabsorber 9 are integrated and the jelly or oil is of course applied at the contact surface between thebody 2 and theplastic bag 8 in order to eliminate the air. When thetransducer 1 transmits a pulse wave such as the curve C shown in Fig.2, such pulse wave progresses into theabsorber 9 from the transducer I at the sound velocity (about 1500 cm/sec in the water) and is absorbed. - Fig. 4 B shows the distribution of pressure in a moment during transmission. When looking at the particular measuring area, for example, the
area 4, a pressure of the measuringarea 4 has the same waveform than the one of transducer: 1 but is just delayed by a time obtained by dividing the distance between thetransducer 1 and the measuringarea 4 with the sound velocity, and changes as the time goes by. Namely, the pressure sweep is carried out. - Fig.5 shows the case where a strong absorber or reflector like a lung exists behind the measuring
area 4 such as the heart. In case a strong absorber exists behind the measuring area, there is no problem very similarly to the case of Fig. 4 A. But if there is a strong reflectingsurface 10 behind the measuring area, the sweep pressure at the measuringarea 4 becomes uncertain because the pressure field is formed at thearea 4 by both the reflected wave from the reflectingsurface 10 and the field of the progressing wave from thetransducer 1. In order to prevent such overlapping, the width of the progressive wave must be shortened by setting the center frequency at 100 - 1000 kHz and also the applying direction (incident direction) must be changed as shown in Fig.7. The existence and location of a reflecting body can be detected by using thetransducer 1 as the receiver or by thetransducer 5. Fig. 5 shows the pressure distribution in a moment. - In any case, the size (diameter) of the
transducer 1 cannot be made too large for the practical use and therefore it becomes almost equal to the wavelength and as a result, the wave generated becomes similar to a spherical wave. - In Fig. 3 A, the transducer must supply the drive energy which meets the energy spherically diverging in all directions other than the direction of
reflector 6 in order to obtain a resonance between the transducer I and thereflector 6. In Fig.4 A and Fig.5 A, the transmitter surface oftransmitter 1 is not requested to be flat and can be formed as a concave surface in order to force the energy to converge to the required direction. In any case, a pressure amplitude along the axis oftransducer 1 changes as a function of the distance z and therefore it is necessary to get the function previously, by setting thetransducer 1 in water without ahuman body 2 and measuring the pressure as a function of the axial distance z. - The
bubble detection transducer 5 can be flat or concave and can also be of the phased array type with multi-elements. As material, structure, circuit etc., those used by so-called A mode, M mode, B mode and Doppler measurement can be used. - As shown in Fig.7, the measuring area can be determined while observing the sectional view of the B mode. For this purpose, a method similar to the well known Doppler measurement combining the B mode can be used.
- In this case, since the applied pressure sweep frequency is sufficiently low, an operation simultaneous with the bubble detecting system can be realized without any interference between them. On the contrary, the B mode and the bubble detection frequency are sufficiently high , so that any influence or interference on the low frequency critical pressure do not occur as can be understood from Fig. 1
- The
transducer 5 can be mounted in a port oftransducer 1 as shown in the drawing for measurement and it can also be mounted in a location other than thetransducer 1 for the measurement. In case the B mode is used in combination, the sector scanning can be done by thetransducer 5 itself and the scanning for detecting bubbles passing the measuringarea 4 may be done during the scanning. Moreover, it is also possible to use another B mode probe as shown in Fig. 7. - In case the measuring
area 4 is located in the tissue cell, the Doppler effect cannot be used because the measuringarea 4 has no flow and detection must be made by extracting a change of reflection intensity. For example, when the burst wave (having a time duration of about lps) with a center frequency of 3.5 MHz is .transmitted fromtransducer 5, the pulse becomes a burst wave of about 1.5 mm length and progresses at a rate of about 1 .5 mm/us. This pulse progresses sending back the reflected waves from each point in accordance with a change of acoustic impedance. Therefo-re, the receiving waveform oftransducer 5 is continuous and complicated. But, only the receiving waveformat a time when the reflected waveform from theposition 4 reaches thetransducer 5 can be observed by extracting it with the timing gate. This is ordinarily well known. The reflected signal from the measuringarea 4 can be obtained with a single scanning as explained above. Namely, when the measuringarea 4 is located at the depth of about 20 cm within a body, the time required for the forward and backward transmission of ultrasonic'wave is 266 us and measurements of 3760 times per second can be done. As explained above, when the measuringarea 4 is located in the flow of the heart or blood vessel not only the simple reflection intensity but also the Doppler shift caused by blood flow can be analyzed and detected by the well know method. The doppler method is very effective for eliminating reflected waves from structural tissues. - In case the applied pressure is of a
center frequency 10 kHz and swept to negative direction sinusoidaly, the negative half cycle is about 50 µs. Therefore, a single detection can be obtained in a single sweep. The critical pressure can be detected by repeated sweeps and detections where the phasesof transmitting and receiving waves of both ultrasonic waves for pressure sweep and detection are shifted a little at each time. Detail of such procedures is shown in Fig.6. As the heart pulsation is 1 to 2 times per second, it is a sufficient frequency for following the dynamic change of pressure. In order to detect in detail the status wherein the heart pressure rapidly changes, measurement can be done by adequately shifting the phase so that the measuring points are sequentially placed in such rapidly changing period by synchronization with the electrocardiograph signal. - Fig.6 A shows how the sweep of the pressure is formed at the measuring
area 4. The vertical axis indicates the absolute pressure(t), which is given as a sum of the atmospheric pressure Pa , the heart pressure Pp (t) with reference to the atmospheric pressure and applied sweep pressure -Q0.sin (2 π ft). In this figure, Pc is the bubble-forming critical pressure. The horizontal axis indicates the time t. When P (t) is lower than Pc, the bubble is generated.
- Fig.6 B shows the reflected signal extracted by the time gate. The vertical axis indicates the amplitude, while the horizontal axis indicates the time. T is the timing when the ultrasonic wave pulse is transmitted. M is the timing when the transmitted pulse reaches the measuring
area 4. R is the timing when the reflection signal from the measuringarea 4 is received. In case the distance between thetransducer 5 and the measuringarea 4 is l, the sound velocity is V, the time interval between T and R is given by 2 l/v and the following relation is obtained : T - M = M - R. In thewaveform 11 of Fig.6 B, the sending time T is synchronized to the applied pressure waveform so that the measuring time M1 coincides with the time tl of the sweep pressure. Thewaveforms waveforms waveforms - In any case, when a pressure (-QO.sin 2 π ft) at each point (tl, t2' ...) of the pressure sweep waveform is previously known, the bubble-forming critical pressure P can be obtained from the point where bubble generation starts.
- Otherwise, the bubble-forming critical pressure P can also be obtained from the minimum Q0 for detecting bubble generation which can be obtained by adjusting such Q0. In Fig.6 B and C, the detecting
waveforms waveforms - As another method, the condition of measuring
point 4 can be measured continuously by sending the bubble detection ultrasonic wave as a continuous wave in place of the pulse as shown in Fig. 6 A. This embodiment is explained below, upon reference to Fig. 7. - In Fig. 7, 2 is a human body, 3 is the heart and 4 is the measuring area being selected in the blood flow in the left atrium in the figure. 1 is the ultrasonic transducer for pressure sweep and it is driven by a center frequency of 10 to 1000 kHz. The waveform is generated in a
waveform generator 22. Thewaveform generator 22 digitally stores the waveforms which are previously A/D converted in series and generates wave forms with D/A conversion by sequentially reading the stored data. The center frequency can be changed by changing the period of the read clock.Circuit 21 drives thetransducer 1 through the power amplification of the waveform produced by thegenerator 22 and forms the necessary sweep negative pressure. 5 is the bubble detection probe. In this embodiment, the transmitting unit 5' and receivingunit 5" are provided individually and the continuous wave with M sequence modulation is transmitted and received. 24 is the base frequency generator utilizing a crystal oscillation unit and it generates, for example, a frequency of 2 MHz. 25 is the M sequence modulation circuit, which sequentially reads the M sequence codes previously stored in the ROM in accordance with the clock from 23 and, for example, phase-modulates the base sine signal. 26 is the power amplifier for driving thetransmitting unit 5'. 5" is the receiving unit and the received signal is amplified by the receivingamplifier circuit 27. The M sequence code from thecircuit 25 are sent to thecircuit 30 via thevariable delay circuit 28 which provides a delay equal to the traveling time of the sound forward and backward along the paths transmitting unit 5', measuringarea 4 and receivingunit 5" by refering the preset value specified with ten-key indepth setting circuit 29 and is compared with the output of theamplifier circuit 27 by taking correlation between them. This is realized by themultiplication circuit 30. The output of themultiplication circuit 30 is orthogonally detected by acircuit 31 through comparison with the original oscillation signal. The real part and imaginary part are sent to theamplitude circuit 32, the square value of amplitude being thereby obtained by the integral circuit having a time constant shorter than the M sequence code length but longer than the code interval, for example, several tens of code length, and the square-sum circuit, and the squared amplitude is used as the Y1 signal. - The real or imaginary part output of the
circuit 31 are sent to theDoppler extraction circuit 33. Such signal is detected after the band pass filter which has the function of limiting higher frequency allowing the Doppler shift frequency to pass whilst not allowing,the original oscillation frequency to pass and the function of limiting lower frequency not allowing the lower Doppler shift frequency due to the stationary of almost stationary speed motion to pass, and then sent to Y2 as the Doppler signal. If it is necessary to judge the direction of blood flow, both real and imaginary part are used. - 23 is the timing control circuit which generates the required clock signals from the original oscillation frequency of the
base frequency generator 24, and also generates the control signals using the built-in program for each portion. - On the other hand, the actual pressure waveforms at each position of the measuring
area 4 within the water caused by the transducer I are previously measured. These are stored, after the A/D conversion,into the sweepwaveform storing circuit 34. The digitized waveforms are selected from thecircuit 34 in accordance with the depth preset by thedepth setting circuit 29. These are read by the clocks which control the read start timing and the read speed provided by thetiming control circuit 23, and the data obtained are D/A converted by the D/A converter 35 and are used as the X axis deflection signal (negative sweep pressure) of the CRT of thedisplay unit 36. Thedisplay unit 36 is a two- channel synchroscope, giving the respective outputs of theamplitude circuit 32 and theDoppler extraction circuit 33 to the Y1 and Y2 of Y axis. From this Y1-X curve and Y2-X curve, the critical pressure P can be confirmed, and the pressure Pp can be obtained by reading the X values of the rising and falling points of the displayed curve. In this example, judging is made manually from the curve but it can be made automatically by electronic means. Of course, P can be digitally or analogously displayed and recorded continuously. - 50 is a B mode sector scan probe independent from said
transducers transducer 5 by a link and thejoints position calculating circuit 54 calculates the relative position oftransducer 5 and B modesector scan probe 50, and the data calculated are sent to the Bmode display unit 55. - The beam location of
transducer 5 is displayed as a line on the Bmode display unit 56 and the position corresponding to the measuringarea 4 is displayed by increased brightness or marker in accordance with the depth information given by thedepth setting circuit 29. This information is used for assigning the measuring area required on the sector scanned sectional view of a human body. - Moreover the method of the present invention can also be used as a quite unique inspection or diagnostic means which is very useful for tissue characterization and early detection of disease by executing such a measurement to each point of a bidimensional plane and by displaying the result on the display unit as an image in two dimensions.
- In this case, it is rather easier and more efficient to get the relative distribution of the critical pressure Pc of bubble generation than the absolute pressure of each point. Namely, in each organ of a living body, the composition and temperature of the cell liquid are respectively different and the critical pressure Pc is also different in each organ. However, it is not easy to obtain the critical pressure Pc by calibrating it by the other measuring method at the other measuring area as shown in the case of blood. In such a case,and contrary to measurement of blood pressure, the critical pressure Pc can be measured as a relative value to the atmospheric pressure,on the supposition that the absolute pressure is almost constant under the atmospheric pressure (this condition is almost always true except for the area near the heart), and the tissue characterization can be done by observing distribution on the bidimensional plane.
- The critical pressure P c of each tissue changes as time passes depending on the total body activity such as exercises, eating and sleeping etc. and such variation also appears in the blood. The more clear tissue characterization image elimitating said aging variation can be obtained by simultaneously measuring the critical pressure of blood and displaying the critical pressure of each tissue with the relative value obtained from said critical value of blood.
- Fig. 8 shows the block diagram of an embodiment for such an object. 80 is a measuring system similar to the system described with reference to Fig. 7. The only difference with respect to Fig. 7 is that the low frequency and high frequency ultrasonic wave transducers I and 5 can move in the vertical direction by means of a
pulse motor 81. In addition, 82 is a measuring lo- cation scanning control circuit which operates in such a manner as sequentially to advance y of the bidimensional coordinate (x, y) and also advance x at a high speed for each y. - 83 is the drive circuit of
pulse motor 81 and generates the specified number of pulses for each advance of y, shifing thetransducers orthogonal detection circuit 31 in Fig.7 and detects its rising time. 85 is a sampling circuit which samples the low frequency ultrasonic wave amplitude sent from the sweepwaveform storing circuit 34 in Fig. 7, namely the relative sweep pressure value as a difference from the atmospheric pressure at the timing when the bubble generation is detected by saidbubble detection circuit 84. 86 is ameasured-value temporary holding circuit, and 89 is a subtraction circuit. 88 is a bidimensional memory to which an output value of thesubtraction circuit 89 is written at the address x, y. 87 is a display unit, which displays the measured value at each coordinate (x, y) stored in thebidimensional memory 88 in the brightness or color tone in accordance with the values as the plane image. A value of x from thecircuit 82 is used to set the measuring area depth for thedepth setting circuit 29 in Fig.7. - In this embodiment, first the transducers I and 5 are applied to the upper part of the arm in order to measure the critical pressure P c of the artery blood with the procedures explained with reference to Fig. 7 and the value obtained is temporarily stored in the holding (register)
circuit 86 as a reference. thereafter, thetransducers register 86 by means of said subtraction circuit and the difference obtained is written into the bidimensional memory. Instead of subtraction, the ratio of tissue critical pressure to blood critical pressure can be used. - According to the system as explained above, measurement for one display format can be realized in about 25 seconds, for example, by changing x, y respectively for 1 to 500 in order to obtain picture elements of 500 x 500 and a continuous wave of 10 kHz is used as the low frequency ultrasonic wave. In practice, the propagation time is different in the area which is far from , respectively near the transducer, and some delay is generated by the drive of pulse motor. Consequently, a somehow longer period is required. An operation at higher speed can also be realized by employing
transducers circuits - Since the critical pressure P c of tissue is generally comparatively low, it is practical to previously raise the critical pressure P c by dissolving inactive gas such as helium, krypton and xenon or carbon dioxide gas.
- Moreover, an application field which is similar to that of the tracer method by radioactive isotope can be developed by injecting a chemical substance which selectively works on the particular tissue and largely changes its critical pressure.
- As explained above, according to the present invention,an inner pressure of an industrial system or a living body can be measured non-invasively from the outside by detecting an ultrasonic cavitation generated by ultrasonic wave, resulting in the effect of measuring internal pressure safely without a risk of invasing a system or causing a living body to come to death, moreover without giving pain and without any fear of introduc- ting impurity or infection of disease. In addition, since the measuring area can be changed from the outside, pressure distribution can also be measured on a real time basis.
- It is also known that a high or low harmonic frequency ultrasonic wave is generated on the occasion of bubble generation and/or collapsing. The high frequency ultrasonic wave unit 5' is no longer necessary, if such harmonics ultrasonic wave is used for the detection of bubble.
Claims (9)
said measuring means includes a means (86) for temporarily storing the results of measurement and a calculating means (89), whereby the bubble generation critical pressure of blood is measured at the blood vessel in a living body and the results are stored in said temporary holding means, the bubble generation critical pressure is measured along the bidimensional plane for the tissues at the desired areas in said living body, a difference or ratio between the result.and the data in the said temporary holding means is calculated by said calculation means and such difference or ratio values are stored in said memory means (88) and then displayed.
Applications Claiming Priority (2)
| Application Number | Priority Date | Filing Date | Title |
|---|---|---|---|
| JP56124588A JPS5826238A (en) | 1981-08-08 | 1981-08-08 | Pressure measurement system by ultrasonic wave |
| JP124588/81 | 1981-08-08 |
Publications (3)
| Publication Number | Publication Date |
|---|---|
| EP0072330A2 true EP0072330A2 (en) | 1983-02-16 |
| EP0072330A3 EP0072330A3 (en) | 1986-08-06 |
| EP0072330B1 EP0072330B1 (en) | 1989-07-05 |
Family
ID=14889174
Family Applications (1)
| Application Number | Title | Priority Date | Filing Date |
|---|---|---|---|
| EP82401503A Expired EP0072330B1 (en) | 1981-08-08 | 1982-08-06 | Pressure measuring system with ultrasonic wave |
Country Status (4)
| Country | Link |
|---|---|
| US (1) | US4483345A (en) |
| EP (1) | EP0072330B1 (en) |
| JP (1) | JPS5826238A (en) |
| DE (1) | DE3279800D1 (en) |
Cited By (9)
| Publication number | Priority date | Publication date | Assignee | Title |
|---|---|---|---|---|
| EP0224934A2 (en) * | 1985-12-05 | 1987-06-10 | Steven B. Feinstein | Contrast agent, process for its preparation and its use for ultrasonic imaging |
| WO1988003388A1 (en) * | 1986-11-05 | 1988-05-19 | Schering Aktiengesellschaft Berlin Und Bergkamen | Process for ultrasonic pressure measurement in a liquid using micro-bubbles |
| EP0357164A1 (en) * | 1988-09-01 | 1990-03-07 | Schering Aktiengesellschaft | Ultrasonic method and circuitries for carrying out same |
| US5219401A (en) * | 1989-02-21 | 1993-06-15 | Technomed Int'l | Apparatus for selective destruction of cells by implosion of gas bubbles |
| EP0626822A4 (en) * | 1991-12-30 | 1995-04-19 | Sound Science Limited Partners | Ultrasound contrast agent examination of tissue perfusion. |
| EP0770352A1 (en) * | 1995-10-10 | 1997-05-02 | Advanced Technology Laboratories, Inc. | Ultrasonic diagnostic imaging with contrast agents |
| US5833613A (en) * | 1996-09-27 | 1998-11-10 | Advanced Technology Laboratories, Inc. | Ultrasonic diagnostic imaging with contrast agents |
| WO1999035967A1 (en) * | 1998-01-16 | 1999-07-22 | Acuson Corporation | Ultrasound contrast imaging |
| DE102017010727A1 (en) * | 2017-11-21 | 2019-05-23 | Diehl Metering Gmbh | Measuring device for determining a pressure in a measuring volume |
Families Citing this family (50)
| Publication number | Priority date | Publication date | Assignee | Title |
|---|---|---|---|---|
| JPS6053131A (en) * | 1983-08-31 | 1985-03-26 | 富士通株式会社 | Ultrasonic air bubble generating system |
| US4689986A (en) * | 1985-03-13 | 1987-09-01 | The University Of Michigan | Variable frequency gas-bubble-manipulating apparatus and method |
| US4926871A (en) * | 1985-05-08 | 1990-05-22 | International Biomedics, Inc. | Apparatus and method for non-invasively and automatically measuring the volume of urine in a human bladder |
| JPS6382623A (en) * | 1986-09-27 | 1988-04-13 | 日立建機株式会社 | Apparatus for recording intracranial pressure |
| DE3814743C2 (en) * | 1988-04-30 | 1994-01-27 | Wolf Gmbh Richard | Device for dissolving concrements in a body cavity |
| US5410516A (en) * | 1988-09-01 | 1995-04-25 | Schering Aktiengesellschaft | Ultrasonic processes and circuits for performing them |
| US5435311A (en) * | 1989-06-27 | 1995-07-25 | Hitachi, Ltd. | Ultrasound therapeutic system |
| US5195521A (en) * | 1990-11-09 | 1993-03-23 | Hewlett-Packard Company | Tissue measurements |
| DE4205030C2 (en) * | 1991-02-28 | 1997-04-03 | Hitachi Ltd | Therapeutic ultrasound device |
| JPH07241288A (en) * | 1994-03-04 | 1995-09-19 | Hitachi Ltd | Ultrasonic device |
| US5678553A (en) * | 1994-11-01 | 1997-10-21 | Schering Aktiengesellschaft | Ultrasonic processes and circuits for carrying out those processes |
| US5601086A (en) * | 1995-05-12 | 1997-02-11 | The United States Of America As Represented By The Administrator Of The National Aeronautics And Space Administration | Beat frequency ultrasonic microsphere contrast agent detection system |
| US7104956B1 (en) * | 1996-11-08 | 2006-09-12 | Research Corporation Technologies, Inc. | Finite amplitude distortion-based inhomogeneous pulse echo ultrasonic imaging |
| AU3103099A (en) * | 1998-03-20 | 1999-10-11 | Thomas Jefferson University | Microbubble-based ultrasonic contrast agents for pressure measurements |
| EP1140211A1 (en) * | 1998-10-12 | 2001-10-10 | Mallinckrodt Inc. | Novel ultrasound contrast agents |
| US6224554B1 (en) * | 1999-03-31 | 2001-05-01 | Point Biomedical Corporation | Method to measure ambient fluid pressure |
| US6408679B1 (en) * | 2000-02-04 | 2002-06-25 | The United States Of America As Represented By The Administrator Of The National Aeronautics And Space Administration | Bubble measuring instrument and method |
| DE60223239T2 (en) * | 2001-04-06 | 2008-08-14 | Bracco Research S.A. | Device for measuring local physical parameters in a liquid-filled cavity |
| US7455666B2 (en) | 2001-07-13 | 2008-11-25 | Board Of Regents, The University Of Texas System | Methods and apparatuses for navigating the subarachnoid space |
| US7010962B2 (en) * | 2003-01-24 | 2006-03-14 | Sinha Naveen N | Characterization of liquids using gas bubbles |
| US20040229256A1 (en) * | 2003-03-19 | 2004-11-18 | Theodor Funck | Method and device for diagnostic investigation of biological samples |
| US8038616B2 (en) * | 2003-05-30 | 2011-10-18 | Surf Technology As | Acoustic imaging by nonlinear low frequency manipulation of high frequency scattering and propagation properties |
| US20040267129A1 (en) * | 2003-05-30 | 2004-12-30 | Angelsen Bjorn A.J. | Ultrasonic contrast agent detection and imaging by low frequency manipulation of high frequency scattering properties |
| US20050283074A1 (en) * | 2004-06-22 | 2005-12-22 | Siemens Medical Solutions Usa, Inc. | Ultrasound feedback for tissue ablation procedures |
| US7837626B2 (en) | 2005-08-05 | 2010-11-23 | Siemens Medical Solutions Usa, Inc. | Contrast agent manipulation with medical ultrasound imaging |
| US10219815B2 (en) | 2005-09-22 | 2019-03-05 | The Regents Of The University Of Michigan | Histotripsy for thrombolysis |
| US8057408B2 (en) | 2005-09-22 | 2011-11-15 | The Regents Of The University Of Michigan | Pulsed cavitational ultrasound therapy |
| JP4163733B2 (en) * | 2006-07-18 | 2008-10-08 | アロカ株式会社 | Ultrasonic diagnostic equipment |
| JP5404390B2 (en) * | 2007-04-24 | 2014-01-29 | パナソニック株式会社 | Ultrasonic diagnostic equipment |
| JP4902508B2 (en) * | 2007-12-03 | 2012-03-21 | 日本電信電話株式会社 | Component concentration measuring apparatus and component concentration measuring apparatus control method |
| KR20090116039A (en) * | 2008-05-06 | 2009-11-11 | 한국표준과학연구원 | Pressure measuring apparatus using acoustic impedance variation |
| JP2009281887A (en) * | 2008-05-22 | 2009-12-03 | Fujitsu Ltd | Device and method for measuring atmospheric pressure |
| US9033882B2 (en) * | 2009-06-10 | 2015-05-19 | Honeywell International Inc. | Gas supersaturation monitoring |
| AU2010284313B2 (en) | 2009-08-17 | 2016-01-28 | Histosonics, Inc. | Disposable acoustic coupling medium container |
| AU2010289775B2 (en) | 2009-08-26 | 2016-02-04 | Histosonics, Inc. | Devices and methods for using controlled bubble cloud cavitation in fractionating urinary stones |
| US9943708B2 (en) | 2009-08-26 | 2018-04-17 | Histosonics, Inc. | Automated control of micromanipulator arm for histotripsy prostate therapy while imaging via ultrasound transducers in real time |
| US8539813B2 (en) | 2009-09-22 | 2013-09-24 | The Regents Of The University Of Michigan | Gel phantoms for testing cavitational ultrasound (histotripsy) transducers |
| US20110092955A1 (en) | 2009-10-07 | 2011-04-21 | Purdy Phillip D | Pressure-Sensing Medical Devices, Systems and Methods, and Methods of Forming Medical Devices |
| US9144694B2 (en) | 2011-08-10 | 2015-09-29 | The Regents Of The University Of Michigan | Lesion generation through bone using histotripsy therapy without aberration correction |
| US9049783B2 (en) | 2012-04-13 | 2015-06-02 | Histosonics, Inc. | Systems and methods for obtaining large creepage isolation on printed circuit boards |
| WO2013166019A1 (en) | 2012-04-30 | 2013-11-07 | The Regents Of The University Of Michigan | Ultrasound transducer manufacturing using rapid-prototyping method |
| WO2014055906A1 (en) | 2012-10-05 | 2014-04-10 | The Regents Of The University Of Michigan | Bubble-induced color doppler feedback during histotripsy |
| BR112015032926B1 (en) | 2013-07-03 | 2022-04-05 | Histosonics, Inc. | ULTRASOUND THERAPY SYSTEM |
| WO2015003154A1 (en) | 2013-07-03 | 2015-01-08 | Histosonics, Inc. | Articulating arm limiter for cavitational ultrasound therapy system |
| WO2015027164A1 (en) | 2013-08-22 | 2015-02-26 | The Regents Of The University Of Michigan | Histotripsy using very short ultrasound pulses |
| CN107205721A (en) | 2014-12-08 | 2017-09-26 | 华盛顿大学 | The system and method for recognizing the motion of subject |
| US11135454B2 (en) | 2015-06-24 | 2021-10-05 | The Regents Of The University Of Michigan | Histotripsy therapy systems and methods for the treatment of brain tissue |
| AU2019389001A1 (en) | 2018-11-28 | 2021-06-10 | Histosonics, Inc. | Histotripsy systems and methods |
| EP4096782A4 (en) | 2020-01-28 | 2024-02-14 | Univ Michigan Regents | Systems and methods for histotripsy immunosensitization |
| CN116105905B (en) * | 2023-02-03 | 2023-11-03 | 保利长大工程有限公司 | Construction platform stress checking calculation system based on bridge impact drilling construction system |
Citations (9)
| Publication number | Priority date | Publication date | Assignee | Title |
|---|---|---|---|---|
| DE865832C (en) * | 1941-09-26 | 1953-02-05 | Siemens Ag | Device for the treatment of liquids or gases with ultrasound |
| US3640271A (en) * | 1969-06-30 | 1972-02-08 | Ibm | Blood flow pressure measurement technique employing injected bubbled and ultrasonic frequency scanning |
| US4112735A (en) * | 1976-09-13 | 1978-09-12 | United Kingdom Atomic Energy Authority | Detection of bubbles in a liquid |
| US4130010A (en) * | 1977-08-15 | 1978-12-19 | Westinghouse Electric Corp. | Bubble detector |
| AT350170B (en) * | 1977-11-10 | 1979-05-10 | Eckel Kurt Dr | BLOOD PRESSURE MONITOR |
| EP0027215A1 (en) * | 1979-10-15 | 1981-04-22 | Fraunhofer-Gesellschaft Zur Förderung Der Angewandten Forschung E.V. | Cardiotachometer |
| US4265251A (en) * | 1979-06-28 | 1981-05-05 | Rasor Associates, Inc. | Method of determining pressure within liquid containing vessel |
| DE2946662A1 (en) * | 1979-11-19 | 1981-05-27 | Siemens AG, 1000 Berlin und 8000 München | Blood pressure measuring appts. - uses ultrasonic waves with volume variation of injected gas bubbles indicated from size of reflected waves |
| US4316391A (en) * | 1979-11-13 | 1982-02-23 | Ultra Med, Inc. | Flow rate measurement |
Family Cites Families (4)
| Publication number | Priority date | Publication date | Assignee | Title |
|---|---|---|---|---|
| GB1268640A (en) * | 1968-05-31 | 1972-03-29 | Nat Res Dev | Acoustic detection apparatus |
| US3974681A (en) * | 1973-10-23 | 1976-08-17 | Jerry Namery | Ultrasonic bubble detector |
| US4122713A (en) * | 1977-05-19 | 1978-10-31 | Medtronic, Inc. | Liquid velocity measuring system |
| SU725014A1 (en) * | 1978-06-15 | 1980-03-30 | Институт Прикладной Физики | Method of detecting gas bubbles in liquid |
-
1981
- 1981-08-08 JP JP56124588A patent/JPS5826238A/en active Granted
-
1982
- 1982-08-04 US US06/405,143 patent/US4483345A/en not_active Expired - Fee Related
- 1982-08-06 DE DE8282401503T patent/DE3279800D1/en not_active Expired
- 1982-08-06 EP EP82401503A patent/EP0072330B1/en not_active Expired
Patent Citations (9)
| Publication number | Priority date | Publication date | Assignee | Title |
|---|---|---|---|---|
| DE865832C (en) * | 1941-09-26 | 1953-02-05 | Siemens Ag | Device for the treatment of liquids or gases with ultrasound |
| US3640271A (en) * | 1969-06-30 | 1972-02-08 | Ibm | Blood flow pressure measurement technique employing injected bubbled and ultrasonic frequency scanning |
| US4112735A (en) * | 1976-09-13 | 1978-09-12 | United Kingdom Atomic Energy Authority | Detection of bubbles in a liquid |
| US4130010A (en) * | 1977-08-15 | 1978-12-19 | Westinghouse Electric Corp. | Bubble detector |
| AT350170B (en) * | 1977-11-10 | 1979-05-10 | Eckel Kurt Dr | BLOOD PRESSURE MONITOR |
| US4265251A (en) * | 1979-06-28 | 1981-05-05 | Rasor Associates, Inc. | Method of determining pressure within liquid containing vessel |
| EP0027215A1 (en) * | 1979-10-15 | 1981-04-22 | Fraunhofer-Gesellschaft Zur Förderung Der Angewandten Forschung E.V. | Cardiotachometer |
| US4316391A (en) * | 1979-11-13 | 1982-02-23 | Ultra Med, Inc. | Flow rate measurement |
| DE2946662A1 (en) * | 1979-11-19 | 1981-05-27 | Siemens AG, 1000 Berlin und 8000 München | Blood pressure measuring appts. - uses ultrasonic waves with volume variation of injected gas bubbles indicated from size of reflected waves |
Cited By (14)
| Publication number | Priority date | Publication date | Assignee | Title |
|---|---|---|---|---|
| EP0224934A2 (en) * | 1985-12-05 | 1987-06-10 | Steven B. Feinstein | Contrast agent, process for its preparation and its use for ultrasonic imaging |
| EP0224934A3 (en) * | 1985-12-05 | 1989-02-22 | Steven B. Feinstein | Contrast agent, process for its preparation and its use for ultrasonic imaging |
| WO1988003388A1 (en) * | 1986-11-05 | 1988-05-19 | Schering Aktiengesellschaft Berlin Und Bergkamen | Process for ultrasonic pressure measurement in a liquid using micro-bubbles |
| EP0273140A1 (en) * | 1986-11-05 | 1988-07-06 | Schering Aktiengesellschaft | Ultrasonic fluid manometry by means of microbubbles |
| AU637059B2 (en) * | 1988-09-01 | 1993-05-20 | Schering Aktiengesellschaft Berlin Und Bergkamen | Ultrasonic process and circuits |
| WO1990002517A1 (en) * | 1988-09-01 | 1990-03-22 | Schering Aktiengesellschaft Berlin Und Bergkamen | Ultrasonic process and circuits |
| EP0357164A1 (en) * | 1988-09-01 | 1990-03-07 | Schering Aktiengesellschaft | Ultrasonic method and circuitries for carrying out same |
| US5219401A (en) * | 1989-02-21 | 1993-06-15 | Technomed Int'l | Apparatus for selective destruction of cells by implosion of gas bubbles |
| EP0626822A4 (en) * | 1991-12-30 | 1995-04-19 | Sound Science Limited Partners | Ultrasound contrast agent examination of tissue perfusion. |
| EP0770352A1 (en) * | 1995-10-10 | 1997-05-02 | Advanced Technology Laboratories, Inc. | Ultrasonic diagnostic imaging with contrast agents |
| EP1374777A1 (en) * | 1995-10-10 | 2004-01-02 | Advanced Technology Laboratories, Inc. | Ultrasonic diagnostic imaging with contrast agents |
| US5833613A (en) * | 1996-09-27 | 1998-11-10 | Advanced Technology Laboratories, Inc. | Ultrasonic diagnostic imaging with contrast agents |
| WO1999035967A1 (en) * | 1998-01-16 | 1999-07-22 | Acuson Corporation | Ultrasound contrast imaging |
| DE102017010727A1 (en) * | 2017-11-21 | 2019-05-23 | Diehl Metering Gmbh | Measuring device for determining a pressure in a measuring volume |
Also Published As
| Publication number | Publication date |
|---|---|
| EP0072330B1 (en) | 1989-07-05 |
| EP0072330A3 (en) | 1986-08-06 |
| JPS6353486B2 (en) | 1988-10-24 |
| DE3279800D1 (en) | 1989-08-10 |
| US4483345A (en) | 1984-11-20 |
| JPS5826238A (en) | 1983-02-16 |
Similar Documents
| Publication | Publication Date | Title |
|---|---|---|
| EP0072330B1 (en) | Pressure measuring system with ultrasonic wave | |
| CA2564854C (en) | Methods and devices for determining the resonance frequency of passive mechanical resonators | |
| EP1551305B1 (en) | Instantaneous ultrasonic measurement of bladder volume | |
| US4774959A (en) | Narrow band ultrasonic frequency attentuation bone measurement system | |
| CA1323090C (en) | Ultrasonic densitometer device and method | |
| US4819649A (en) | Noninvasive vibration measurement system and method for measuring amplitude of vibration of tissue in an object being investigated | |
| JPH0570769B2 (en) | ||
| IL104159A (en) | Methods of and systems for examining tissue perfusion using ultrasonic contrast agents | |
| JPH09164138A (en) | Ultrasonic wave diagnosis picture processing method using contrast agent, and its diagnosis device | |
| US3939707A (en) | Measurement of liquid flow | |
| JPH0847497A (en) | Medical treatment needle which is used for ultrsonic wave image formation,and method to improve visibility or degree of clearness of said needle against ultrsonic wave | |
| US3310049A (en) | Ultrasonic cardiac volume measurements | |
| Kelsey et al. | Applications of ultrasound in speech research | |
| JPS6247537B2 (en) | ||
| JPS61100237A (en) | Ultrasonic diagnostic apparatus | |
| Hök | A new approach to noninvasive manometry: Interaction between ultrasound and bubbles | |
| US4452085A (en) | Method and means for generating time gain compensation control signal for use in ultrasonic scanner and the like | |
| Masotti | Basic principles and advanced technological aspects of ultrasound imaging | |
| Hassani et al. | Principles of ultrasonography | |
| JPS59164035A (en) | Internal pressure measuring apparatus of living body tissue | |
| SCHWARTZ et al. | Review and evaluation of range-gated, pulsed, echo-Doppler | |
| KR840002100B1 (en) | Ultrasonic diagnosing apparatus | |
| Kremkau | Technical considerations, equipment, and physics of duplex sonography | |
| McCartney et al. | Doppler basics | |
| JPH0256097B2 (en) |
Legal Events
| Date | Code | Title | Description |
|---|---|---|---|
| PUAI | Public reference made under article 153(3) epc to a published international application that has entered the european phase |
Free format text: ORIGINAL CODE: 0009012 |
|
| AK | Designated contracting states |
Designated state(s): DE FR GB NL SE |
|
| PUAL | Search report despatched |
Free format text: ORIGINAL CODE: 0009013 |
|
| AK | Designated contracting states |
Kind code of ref document: A3 Designated state(s): DE FR GB NL SE |
|
| 17P | Request for examination filed |
Effective date: 19870105 |
|
| 17Q | First examination report despatched |
Effective date: 19880104 |
|
| GRAA | (expected) grant |
Free format text: ORIGINAL CODE: 0009210 |
|
| AK | Designated contracting states |
Kind code of ref document: B1 Designated state(s): DE FR GB NL SE |
|
| REF | Corresponds to: |
Ref document number: 3279800 Country of ref document: DE Date of ref document: 19890810 |
|
| ET | Fr: translation filed | ||
| PLBE | No opposition filed within time limit |
Free format text: ORIGINAL CODE: 0009261 |
|
| STAA | Information on the status of an ep patent application or granted ep patent |
Free format text: STATUS: NO OPPOSITION FILED WITHIN TIME LIMIT |
|
| 26N | No opposition filed | ||
| PGFP | Annual fee paid to national office [announced via postgrant information from national office to epo] |
Ref country code: SE Payment date: 19920630 Year of fee payment: 11 |
|
| PGFP | Annual fee paid to national office [announced via postgrant information from national office to epo] |
Ref country code: FR Payment date: 19920828 Year of fee payment: 11 |
|
| PGFP | Annual fee paid to national office [announced via postgrant information from national office to epo] |
Ref country code: NL Payment date: 19920831 Year of fee payment: 11 |
|
| PGFP | Annual fee paid to national office [announced via postgrant information from national office to epo] |
Ref country code: DE Payment date: 19921021 Year of fee payment: 11 |
|
| PGFP | Annual fee paid to national office [announced via postgrant information from national office to epo] |
Ref country code: GB Payment date: 19930617 Year of fee payment: 12 |
|
| PG25 | Lapsed in a contracting state [announced via postgrant information from national office to epo] |
Ref country code: SE Effective date: 19930807 |
|
| PG25 | Lapsed in a contracting state [announced via postgrant information from national office to epo] |
Ref country code: NL Effective date: 19940301 |
|
| NLV4 | Nl: lapsed or anulled due to non-payment of the annual fee | ||
| PG25 | Lapsed in a contracting state [announced via postgrant information from national office to epo] |
Ref country code: FR Effective date: 19940429 |
|
| PG25 | Lapsed in a contracting state [announced via postgrant information from national office to epo] |
Ref country code: DE Effective date: 19940503 |
|
| REG | Reference to a national code |
Ref country code: FR Ref legal event code: ST |
|
| PG25 | Lapsed in a contracting state [announced via postgrant information from national office to epo] |
Ref country code: GB Effective date: 19940806 |
|
| EUG | Se: european patent has lapsed |
Ref document number: 82401503.6 Effective date: 19940310 |
|
| GBPC | Gb: european patent ceased through non-payment of renewal fee |
Effective date: 19940806 |