EP0168565A1 - Ultrasonic measurement method and apparatus therefor - Google Patents
Ultrasonic measurement method and apparatus therefor Download PDFInfo
- Publication number
- EP0168565A1 EP0168565A1 EP85105060A EP85105060A EP0168565A1 EP 0168565 A1 EP0168565 A1 EP 0168565A1 EP 85105060 A EP85105060 A EP 85105060A EP 85105060 A EP85105060 A EP 85105060A EP 0168565 A1 EP0168565 A1 EP 0168565A1
- Authority
- EP
- European Patent Office
- Prior art keywords
- interest
- ultrasonic
- intensity
- attenuation coefficient
- ultrasonic waves
- Prior art date
- Legal status (The legal status is an assumption and is not a legal conclusion. Google has not performed a legal analysis and makes no representation as to the accuracy of the status listed.)
- Granted
Links
Images


Classifications
-
- G—PHYSICS
- G01—MEASURING; TESTING
- G01S—RADIO DIRECTION-FINDING; RADIO NAVIGATION; DETERMINING DISTANCE OR VELOCITY BY USE OF RADIO WAVES; LOCATING OR PRESENCE-DETECTING BY USE OF THE REFLECTION OR RERADIATION OF RADIO WAVES; ANALOGOUS ARRANGEMENTS USING OTHER WAVES
- G01S15/00—Systems using the reflection or reradiation of acoustic waves, e.g. sonar systems
- G01S15/88—Sonar systems specially adapted for specific applications
- G01S15/89—Sonar systems specially adapted for specific applications for mapping or imaging
- G01S15/8906—Short-range imaging systems; Acoustic microscope systems using pulse-echo techniques
- G01S15/895—Short-range imaging systems; Acoustic microscope systems using pulse-echo techniques characterised by the transmitted frequency spectrum
- G01S15/8952—Short-range imaging systems; Acoustic microscope systems using pulse-echo techniques characterised by the transmitted frequency spectrum using discrete, multiple frequencies
-
- G—PHYSICS
- G01—MEASURING; TESTING
- G01N—INVESTIGATING OR ANALYSING MATERIALS BY DETERMINING THEIR CHEMICAL OR PHYSICAL PROPERTIES
- G01N29/00—Investigating or analysing materials by the use of ultrasonic, sonic or infrasonic waves; Visualisation of the interior of objects by transmitting ultrasonic or sonic waves through the object
- G01N29/04—Analysing solids
- G01N29/06—Visualisation of the interior, e.g. acoustic microscopy
- G01N29/0609—Display arrangements, e.g. colour displays
- G01N29/0645—Display representation or displayed parameters, e.g. A-, B- or C-Scan
-
- G—PHYSICS
- G01—MEASURING; TESTING
- G01N—INVESTIGATING OR ANALYSING MATERIALS BY DETERMINING THEIR CHEMICAL OR PHYSICAL PROPERTIES
- G01N29/00—Investigating or analysing materials by the use of ultrasonic, sonic or infrasonic waves; Visualisation of the interior of objects by transmitting ultrasonic or sonic waves through the object
- G01N29/04—Analysing solids
- G01N29/06—Visualisation of the interior, e.g. acoustic microscopy
- G01N29/0654—Imaging
- G01N29/069—Defect imaging, localisation and sizing using, e.g. time of flight diffraction [TOFD], synthetic aperture focusing technique [SAFT], Amplituden-Laufzeit-Ortskurven [ALOK] technique
-
- G—PHYSICS
- G01—MEASURING; TESTING
- G01N—INVESTIGATING OR ANALYSING MATERIALS BY DETERMINING THEIR CHEMICAL OR PHYSICAL PROPERTIES
- G01N29/00—Investigating or analysing materials by the use of ultrasonic, sonic or infrasonic waves; Visualisation of the interior of objects by transmitting ultrasonic or sonic waves through the object
- G01N29/22—Details, e.g. general constructional or apparatus details
- G01N29/24—Probes
- G01N29/2437—Piezoelectric probes
- G01N29/245—Ceramic probes, e.g. lead zirconate titanate [PZT] probes
-
- G—PHYSICS
- G01—MEASURING; TESTING
- G01N—INVESTIGATING OR ANALYSING MATERIALS BY DETERMINING THEIR CHEMICAL OR PHYSICAL PROPERTIES
- G01N29/00—Investigating or analysing materials by the use of ultrasonic, sonic or infrasonic waves; Visualisation of the interior of objects by transmitting ultrasonic or sonic waves through the object
- G01N29/34—Generating the ultrasonic, sonic or infrasonic waves, e.g. electronic circuits specially adapted therefor
- G01N29/348—Generating the ultrasonic, sonic or infrasonic waves, e.g. electronic circuits specially adapted therefor with frequency characteristics, e.g. single frequency signals, chirp signals
-
- G—PHYSICS
- G01—MEASURING; TESTING
- G01S—RADIO DIRECTION-FINDING; RADIO NAVIGATION; DETERMINING DISTANCE OR VELOCITY BY USE OF RADIO WAVES; LOCATING OR PRESENCE-DETECTING BY USE OF THE REFLECTION OR RERADIATION OF RADIO WAVES; ANALOGOUS ARRANGEMENTS USING OTHER WAVES
- G01S15/00—Systems using the reflection or reradiation of acoustic waves, e.g. sonar systems
- G01S15/88—Sonar systems specially adapted for specific applications
- G01S15/89—Sonar systems specially adapted for specific applications for mapping or imaging
- G01S15/8906—Short-range imaging systems; Acoustic microscope systems using pulse-echo techniques
- G01S15/8997—Short-range imaging systems; Acoustic microscope systems using pulse-echo techniques using synthetic aperture techniques
-
- G—PHYSICS
- G01—MEASURING; TESTING
- G01S—RADIO DIRECTION-FINDING; RADIO NAVIGATION; DETERMINING DISTANCE OR VELOCITY BY USE OF RADIO WAVES; LOCATING OR PRESENCE-DETECTING BY USE OF THE REFLECTION OR RERADIATION OF RADIO WAVES; ANALOGOUS ARRANGEMENTS USING OTHER WAVES
- G01S7/00—Details of systems according to groups G01S13/00, G01S15/00, G01S17/00
- G01S7/52—Details of systems according to groups G01S13/00, G01S15/00, G01S17/00 of systems according to group G01S15/00
- G01S7/52017—Details of systems according to groups G01S13/00, G01S15/00, G01S17/00 of systems according to group G01S15/00 particularly adapted to short-range imaging
- G01S7/52023—Details of receivers
- G01S7/52036—Details of receivers using analysis of echo signal for target characterisation
Abstract
Description
- This invention relates to improvements in an ultrasonic measurement method for subjecting an object to an ultrasonic transmission and receiving reflected ultrasonic waves from the interior of the object to measure the acoustic characteristics of the interior. More particularly, the invention relates to an ultrasonic measurement method and apparatus for providing information relating to attenuation that accompanies propagation of ultrasonic waves in the interior of an object.
- Ultrasonic measurement techniques find application widely in such fields as material testing, SONAR and medical diagnosis. In ultrasound material testing, measuring the degree of attenuation of ultrasonic waves in an object under examination is one of the most useful expedients for clarifying the physical and material properties of the object. In a case where the size of a flaw in a specimen exhibiting a high degree of ultrasonic attenuation is estimated when examining for flaws by using an ultrasonic flaw detector, it is necessary to apply a correction to compensate for the amount of attenuation. To accomplish this, there is a need for accurate measurement of attenuation coefficients.
- A problem encountered in this regard is that sound intensity gradually decreases owing to gradual spreading of an ultrasonic wavefront caused by diffraction when the ultrasonic waves propagate internally of the object. This phenomenon, referred to as diffusion loss, must be corrected for without fail when measuring an attenuation coefficient. Correction for diffusion loss is described in detail in
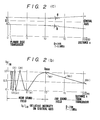
Chapter 6 of Ultrasonic Material Testing published by the Nikkan Kogyo Shimbun Ltd., in which it is stated that correction is made by performing a comparative measurement using a reference specimen for measuring attentuation. The reference specimen is required to have the same geometry, dimensions, surface conditions and acoustic impedence as the object undergoing measurement, to have a known attenuation coefficient and to be so small that attenuation is negligible. Accordingly, it does not always follow that a reference specimen in line with the object under measurement can be fabricated. - Let us now discuss the reasons why a practical correction must be made using such a reference specimen. As well known, ultrasonic waves encounter an interference or diffraction phenomenon, with the result that the transmission sound field characteristic of, e.g., a disc transducer having a finite aperture defines a complicated pattern or field, as shown in Figs. 2(a) through 2(c). Fig. 2(a) shows that almost all the ultrasonic energy lies within the limits shown. Fig. 2(b) shows the distribution of the relative intensity Ix/Im along the central axis of the beam, where amplitude Ix represents sound intensity at a position X, and Im represents maximum sound intensity along the X axis. Fig. 2(c) shows the energy distribution of beam cross-sections at positions (i) through (viii) along the X axis in Fig. 2(b). Xmax in Fig. 2(b) denotes the last position where maximum intensity along the X axis occurs. Even for the same attenuating medium, therefore, the characteristics of the transmitted ultrasonic beam incident upon the medium differ depending upon the distance X from the transducer, as shown in Figs. 2(a) through 2(c). Moreover, the sound fields ordinarily used for measurement are in the neighborhood of the more complex near sound fields, so applying a theoretical correction involves considerable difficulty. It is for this reason that a reference specimen is used in the prior art in order to correct for diffusion loss.
- The present invention has been devised to eliminate the aforementioned drawbacks encountered in the prior art and the object thereof is to provide a method and apparatus for measuring an attenuation coefficient of an object under examination, wherein an attenuation coefficient measurement error ascribable to diffusion loss is minimized without relying upon a reference specimen for attenuation measurement.
- According to the present invention, the foregoing object is attained by providing an ultrasonic measurement method, comprising successively scanning ultrasonic transceiving means, which is adapted to transmit generally spherical ultrasonic waves having at least three frequency components toward an object under examination, substantially at right angles to a direction in which the ultrasonic waves are transmitted, during which time the transceiving means receives an echo from the object, measuring the intensity of a reflected wave based on the echo and performing a calculation using a synthetic aperture method to obtain a B-scan distribution image of the intensity in the object, and obtaining an attenuation coefficient of the object based on the intensity of the reflected wave for a scanning position of the transceiving means generally on an extension of a line connecting plural positions of interest designated in the obtained B-scan distribution image.
- According to a characterizing feature of the present invention, when a sound pressure of the transmitted ultrasonic waves is solely inversely proportional to the square of the propagation distance within the object under examination, attenuation coefficient can be calculated without influence of the diffusion loss which is caused by the propagation.
- According to another characterizing feature of the present invention, when more than two positions of interest are at the same distance from the scanning position, another scanning position is found and an attenuation coefficient is calculated based on the intensity of the reflected wave for the other scanning position.
- According to another aspect of the present invention, the foregoing object is attained by providing an ultrasonic measurement apparatus comprising transceiving means having an ultrasonic transducer for transmitting generally spherical ultrasonic waves having at least three frequency components toward an object under investigation, and for receiving an echo signal from the object, and scanning means for successively scanning the ultrasonic transducer substantially at right angles to a direction in which the ultrasonic waves are transmitted, first arithmetic means for measuring the intensity of a reflected wave based on the echo signal and for performing a calculation based on a synthetic aperture method to obtain a B-scan distribution image of the intensity in the object, designating means for designating plural positions of interest in the B-scan distribution image obtained, and second arithmetic means for obtaining an attenuation coefficient of the object based on the intensity of the reflected wave for a scanning position of the ultrasonic transducer generally on an extension of a line connecting the plural positions of interest designated.
- According to another characterizing feature of the present invention, the second arithmetic means is adapted to calculate a sound pressure of the transmitted ultrasonic waves is solely inversely proportional to the square of the propagation distance within the object under examination, attenuation coefficient can be calculated without influence of the diffusion loss which is caused by the propagation.
- According to another characterizing feature of the present invention, when more than two positions of interest are at the same distance from the scanning position, another scanning position is found and tha apparatus can calculate an attenuation coefficient based on the intensity of the reflected wave for the other scanning position.
- According to still another characterizing feature of the present invention, the designating means has display means for visually displaying the B-scan distribution image, with the positions of interest being designated based on the B-scan distribution image displayed on the display means. The second arithmetic means is further adapted to display the obtained attenuation coefficient on the display means.
- Other features and advantages of the present invention will be apparent from the following description taken in conjunction with the accompanying drawings, in which like reference characters designate the same or similar parts throughout the figures thereof.
-
- Fig. 1 is a block diagram illustrating an embodiment of an apparatus for practicing an ultrasonic measurement method according to the present invention;
- Figs. 2(a) through 2(c) are explanatory views illustrating near and far sound fields produced by a planar disc transducer;
- Fig. 3(a) and (b) are explanatory views illustrating the principle of a synthetic aperture method;
- Fig. 4 is a block diagram illustrating an example of a prior-art ultrasonic measurement apparatus using the synthetic aperture method;
- Figs. 5(a),(b),(c) through 9 are views useful in describing the principle of the ultrasonic measurement method according to the present invention;
- Figs. 10(a) and 10(b) are views for describing the operation of the embodiment shown in Fig. 1; and
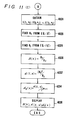
- Figs. ll(a) and 11(b) are flowcharts illustrating the operation of the embodiment shown in Fig. 1.
- Before describing a preferred embodiment of the present invention in detail, we shall discuss the principle of ultrasonic flaw detection based on a synthetic aperture method employed in the present invention.
- The sythentic aperture method is one of the image forming methods long known in the radar field as synthetic aperture radar. For a detailed discussion of the synthetic aperature method, see for example Chapter 23 of the Radar Handbook, edited by M.L. Skolnik and published by the McGraw-Hill Book Company. An example of this principle applied to a method of ultrasonic flaw detection is set forth in "Flaw Detection by the Synthetic Aperture Ultrasonic Imaging Method", Vol. 30, No. 9, p. 720 of Non-destructive Inspections in the summaries of convention lectures held in the fall of 1981. According to the description given, image information such as a scan or tomograph of an object under investigation is obtained by successively transmitting ultrasonic signals toward the object from a plurality of positions, receiving signals, which are reflected from within the object, at a plurality of aperture planes, and analyzing, editing and synthesizing the signals thus received, thereby obtaining the aforesaid information.
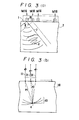
- Let us describe this principle in simple fashion in accordance with Figs. 3(a), (b) and 4, in which Fig. 3(a) and (b) illustrate the aforementioned ultrasonic flaw detection method using the synthetic aperture technique, and Fig. 4 shows a conventional apparatus for practicing the method. A
probe 1 comprises n-number oftransducers 10 each of which has a wide angle of beam directivity. The first (leftmost) transducer responds to adrive signal 6 from a transmittingunit 100 by transmitting, into anobject 2 undergoing measurement, ultrasonic waves spread over a wide angle 0 of directivity, as shown for example at 7 in Fig. 3(a). An echo which results from reflection of the ultrasonic waves at aflaw 4 in theobject 2 is received by the first transducer, which responds by producing a reception signal 8 (Fig. 4). Thesignal 8 is amplified to a required magnitude by a receivingunit 120 and then has its amplitude and phase stored in awaveform memory 130, shown in Fig. 4. - The second transducer performs an identical transmission and reception operation to produce a reception signal which is likewise stored in the
waveform memory 130. The same operations are performed by each of all transducers from the third onward. Thus, the first to the n-th transducers are scanned by atransducer switching unit 110 as each executes a transceiving operation in successive fashion. As the result of a scan, the amplitudes and phases of all echo signals received by the entirety of transducers will come to be stored in thewaveform memory 130. In other words, the equivalent of an ultrasonic hologram of theobject 2 will be formed in thewaveform memory 130. - A synthetic aperture
arithmetic unit 140 performs a calculation to obtain a tomograph of theobject 2 from the data stored in thewaveform memory 130. To this end, various methods using synthetic aperture algorithms are available and research into improvements is presently underway. The general features of one example are disclosed in "Ultrasonic Synthetic Aperture Imaging with Nonlinear Processing", 41-PE-33, p. 587, of the collected papers presented at the lectures of the 4lst Japan Society of Ultrasonics in Medicine (1982). Let us describe in brief a method of cumulative addition, which is the most basic of the algorithms. - As shown in Figs. 3(a) and 3(b), on the basis of a received waveform 11 obtained at the first transducer, a concentric circle centered on the first transducer and the radius whereof is the echo pulse reception time period (i.e., phase Pl) is described on an
image reconstruction plane 30, and a value corresponding to the echo amplitude is written on the concentric circle. Likewise, for a received waveform 21 obtained at the second transducer, a value corresponding to the echo amplitude is written and superposed on a concentric circle having a phase P2 as its radius. This process is repeated for all transducers up to the n-th transducer, whereby locii of the kind shown at 40 are described on theimage reconstruction plane 30. An image of theflaw 4 is formed by the concentrated intersection of the locii, which are defined by the concentric circles, at a position in the image reconstruction plane that corresponds to the position of theflaw 4. - Assuming that the propagation velocity of sound in the
object 2 is either known or a certain fixed value C, we can obtain the distance from the surface of theobject 2 to theflaw 4 by calculating 2Ct, where t is the time needed for an echo to be received from theflaw 4 at a point on the surface of the object directly above the flaw. An image obtained in this manner is fed into animage memory 150 and displayed as an intensity-modulated tomograph on adisplay unit 160, such as a CRT. The apparatus is under the overall control of acontrol unit 170. - The image obtained by the synthetic aperture method has a spatial resolution over the entirety of the image that is a vast improvement over that of the B-scan image based on a conventional pulse-echo technique. The reasons for this improvement are set forth in detail in the Radar Handbook mentioned earlier and will not be described here.
- Though the image obtained in the foregoing manner does represent a great improvement over the conventional image in terms of spatial resolution, the acquired information is exactly the same as that provided by the conventional B-scan image, namely a two-dimensional distribution image at a boundary or interface where the acoustic impedence of the
object 2 differs. In other words, the information obtained does not go beyond morphological information representative of the object undergoing measurement. To be more specific, it is presumed that attenuation which accompanies propagation of ultrasonic waves in an object is dealt with by a base-line correction method, which is the conventional way of correcting for attenuation, or by a so-called STC (sensitivity time control) method. That is to say, it is thought that attenuation is corrected for either by performing a cumulative addition after an STC correction has been applied to an original signal, namely a signal prior to reproduction as an image (i.e., the signals 11, 21, 31... in Fig. 3(b)), or by externally applying an STC correction at one's volition in such a manner that a finally reproduced image is averaged to exhibit a substantially constant brilliance from the surface of the image down to the depths thereof. - There have been several reports describing application of the synthetic aperture method to ultrasonic flaw detection and to ultrasonic diagnostic systems for medical purposes, as mentioned above. Improved methods have also been disclosed as for example in the specification of Japanese Patent Application Laid-Open No. 55-143476. Nevertheless, all of these methods either ignore attenuation or apply a correction using an STC method of the kind set forth above.
- According to the present invention, the attenuation coefficient of an object under examination is measured by exploiting the advantages of the synthetic aperture-type image formation method to reduce an error that appears in the attenuation coefficient due to diffusion loss internally of the object. Figs. 5(a) and 5(b) illustrate the principle of the present invention. Fig. 5(b) shows an image following application of the synthetic aperture method, which image has already been subjected to a desired correction for attentuation.
Numerals - In general, when a
probe 200 transmitsultrasonic pulses 300 having an intensity Io(f) and a frequency f into anobject 210 under examination, as shown in Fig. 6, the intensity I(f,x) of an echo from a reflector at an interface, located at a distance X from the probe, where the acoustic impedence of the object differs is represented by the following equation:
- In order to measure the attenuation coefficient α(f,x) accurately, it is desirable to minimize error, namely the influence of G(f,x), D(f,x), R(f,x) and Io(f).
- With the aim of excluding the aforementioned error to the greatest extent possible, the inventors have already proposed, in the specifications of Japanese Patent Application Nos. 55-49571 (Japanese Patent Application Laid-open No. 56-147082) and 58-229853 (not published as yet), respectively, a method of measuring an attenuation coefficient, which is an acoustic characteristic of the object under examination, by using ultrasonic waves of plural frequencies and submitting a plurality of echos detected through use of these frequencies to information processing, and a method of measuring an attenuation coefficient quantitatively by improving upon the former method. These method enable an attenuation coefficient to be measured upon reducing the influence of R(f,x) and D(f,x).
- According to these methods, however, the ultrasonic waves are assumed to be an ideal pencil beam. In other words, these methods do not take diffusion loss G(f,x) experienced by the ultrasonic waves into account and therefore neglect the effects thereof.
- The present invention attempts to further improve attenuation coefficient measurement accuracy by reducing measurement error ascribable to diffusion loss through use of the synthetic aperture method. More specifically, with the synthetic aperture method, rather than making the aperture (D) of the transceiving transducer sufficiently large in comparison with wavelength (λ.), as in the prior art, it is necessary to use an aperture which is small in comparison with wavelength in order to form, internally of the object under examination, an ultrasonic beam having little directivity (i.e., an ultrasonic beam the directivity angle Ã/D whereof is large). Accordingly, as well known, a sound field of a transmitted ultrasonic wave which emerges from an aperture small in comparison with wavelength spreads into a spherical wave as soon as it leaves the aperture. That is to say, a far sound field is formed closer to the vicinity of the probe than in the case with the conventional probe.
- The conditions described above are shown in approximate form in Figs. 7(a) and 7(b), in which the ultrasonic waves emerge from a planar disc transducer operating at a frequency of 3 MHz, the aperture being 10 mm in Fig. 7(a) and 1 mm in Fig. 7(b).
- The intensity of a far sound field formed by a spherical wave is known to be inversely proportional to the square of the propagation distance. The foregoing facts are described in detail in
Chapter 2 of Ultrasonic Material Testing mentioned earlier. Thus, if the synthetic aperture method is applied, diffusion term can be expressed by G(f,x) = k/x2, where k is a proportional constant considered to be independent of frequency within the range of frequencies used. If the substitutions R(f,x) = g(x)·fa(f,x), D(f,x) = xb(x) are made, Eq. (1) can be written as follows, as set forth in the specifications of the aforementioned patent applications:
- Rearranging the above equation gives us

- Taking the natural logarithm of both side of Eq. (2) results in

- With regard to the value of a(f,x), a(f,x) = 0 will hold at an acoustic characteristic discontinuity surface sufficiently larger than the wavelength (λ = v/f), whereas a(f,x) = 4 will hold at an acoustic characteristic discontinuity surface sufficiently smaller than the wavelength (where V represents the propagation velocity of sound in the object under measurement). Within a certain frequency range, therefore, a(f,x) will be constant, and the relation 0 < a(f,x) < 4 may be considered to hold. Further, x b(x) may be considered as being the effect of a weakening in the reflection intensity at the position of the
ultrasonic probe 200 owing to spread of the reflected wave. At a sufficiently broad acoustic characteristic discontinuity surface, b(x) = 0 will hold, whereas b(x) = -2 will prevail at a small acoustic characteristic continuity surface. In general, therefore, the relation -2 < b(x) < 0 may be considered to hold. - When Eq. (3) is applied to the intensities of
echos respective reflectors 


- Evaluating Eq. (6) at two frequencies f1, f3, taking the difference between the two values found, multiplying by


- In other words, the influence of transmitted and reflected wave diffusion is eliminated by calculating the difference between the echo intensities at the two frequencies f1, f3. Next, we multiply by (f3+f1)/2 to arrive at the following equation:

where
- If we assume that α(f,x ) = αo(x) f β(x) holds, the left side of Eq. (8) can be transformed to

- Since we may also write the following:


we will obtain
- Thus, Eq. (9) gives, in approximate form, a value obtained 1+3 1+3 by multiplying α(f1+f3/2, x), at the average value (f1+f3/2) of the frequencies fl, f3 between x1 and x2, by the coefficient β(x), which is representative of the frequency dependence of the attenuation coefficient. Further, using data regarding three frequencies f1, f2, f3 (f1<f2<f3 ), we take a difference quotient of second order with relation to the frequency logarithms ℓnf1, ℓnf2, ℓnf3, and make a transformation to obtain the following equation:

- where


- A mathematical discussion of the process for obtaining Eq. (10) is set forth in detail for a pencil beam in our Japanese Patent Application No. 58-229853 (not published as yet) (for which the corresponding applications in the USA and Europe are U.S. Serial No. 657028 and EPA 84 112 223.7, respectively).
- Returning to H3, we may write

- Thus, Eq. (11) gives, in approximate form, a value obtained by multiplying p(f1+f2+
f 3 3, x), at the average value f1+f2+f 3 3 of the frequencies f1, f2, f3 between x1 and x2, by the square of (x). - Dividing Eq. (11) by Eq. (9) gives us

- Thus, Eq. (12) gives an approximate expression of the mean value of #(x) between x1 and x2 and between f1 and f3. H3/H2 takes on the following form from Eq. (10):

Where
- Further, from Eqs. (11) and (9) we have:

- Thus, Eq. (14) gives a mean value of α(f,x ) between x1and x2 and between f1 and f3. (H2)2 /H3 takes on the following form from Eqs. (8), (10):

- The first term in the denominator of Eq. (13) and the first term in the numerator thereof are measured quantities, but the second terms, namely D2 and D3, arise owing to frequency dependence ascribable to the intensity of reflection at the surface of acoustic characteristic discontinuity. These represent error terms with respect to β(x). If the coefficient a(f,x) of the frequency dependence fa(f,x) of the reflection intensity is constant within the range of frequencies measured, namely if


- hold, then a(f,x) will be a function solely of x and D3 will be zero. Accordingly, Eqs. (8), (10) may then be written as follows:


- Therefore, Eq. (13) takes on the following form from Eqs. (16) and (17):

- And Eq. (15) takes on the following form from Eqs. (16) and (17):

- It may be understood that these two equations have fewer error terms in comparison with Eqs. (13) and (15). More specifically, the error term in Eq. (18) is solely [a(x2)-a(x1)]·ln(f3/f1) in the denominator, and the error term in Eq. (19) is solely [a(x2)-a(x1)].ℓn(f3/f1) in the numerator.
- If the coefficient a(x) of the frequency dependence fa(x) of the reflection intensity is constant and independent of the distance x, then, from a (x2) = a(x1), Eq. (18) may be written as the following equation, in which the error is reduced even further:


- In other words, if the coefficient a(f,x) indicating the frequency dependence of the reflection intensity is constant and independent of the frequency f within the measured range and of the distance x, then a(f,x) = a will hold and, in accordance with Eq. (20), the mean value β(x) of the frequency dependence of the attenuation coefficient α(f,x) can be measured with even greater accuracy. In this case, in accordance with Eq. (19), it is also possible to measure o((f,x) with greater accuracy as shown by the following equation:

- In this case, αo(x) also is obtained with greater accuracy from the relation αo(x) = α(f,x)/fβ(x).
- In Eqs. (8), (10), D2 and D3 are error terms which cannot be found from experimental values. In Eq. (8), D2 vanishes when a(f,x) is constant and independent of f1, f3, xl, x2. In Eq. (10), D3 vanishes when a(f,x) is constant with regard to the frequencies fl, f2, f3 even if it is dependent upon xl, x2. In cases where the foregoing conditions do not hold, however, the relative error can be evaluated in the following way. Specifically, since 0 < a(f,x) < 4 holds, we may write

- This gives the relative error ascribable to D2 in Eq. (8). Likewise, we have

- This gives the relative error ascribable to D3 in Eq. (10). In conclusion, the error terms D2, D3 can be neglected if, from Eqs. (22), (23), the values of the following are sufficiently large:


- In such case, Eqs. (8), (10) can be transformed as follows:


- As set forth above, plane ultrasonic wave pulses having three different frequencies fl, f2' f3 are inflicted upon the object under examination and the object's attentuation coefficients α(f,x), αo (x) and their frequency dependence β(x) can be approximately measured based on the resulting echo signals. In particular, if the reflection intensity is constant and independent of the observed range of frequency f and of the distance x, then it is possible to measure α((f,x), αo(f,x) and f(x) with greater accuracy.
- Thus we can sum up by saying that the coordinate values of each scatterer (flaw) in the object relative to each transducer are known from a two-dimensional distribution of the scatters, which distribution is obtained by the ultrasonic measurement apparatus of Fig. 4 that uses the conventional synthetic aperture method.
- Let us now discuss direct application of the above-described echo intensity processing method to the synthetic aperture method of Fig. 5(a) and (b).
- Fig. 5(b) shows the reconstructed image, in which numerals 50, 60 represent reflectors corresponding to the
reflectors reflectors straight line 80 connecting the points where thereflectors probe 1, as shown in Fig. 5(a). Now we find the transducer nearest the point of intersection, which in the example of Fig. 5(a) is the fifth transducer from the left. Next, an echo signal (the original signal, namely the signal that prevails prior to processing for, e.g., correction of attenuation) 500 (shown in Fig. 5(c)) detected by this fifth transducer is extracted from thewaveform memory 130 in the apparatus of Fig. 4. Theecho signal 500 contains echo signals 510, 520 corresponding to thereflectors signal 510, and I(f,x2) in Eq. (5) corresponds to the intensity of thesignal 520. Io(f) may be considered to be the intensity of ultrasonic waves transmitted in the direction of thereflectors - By applying the processing method described in detail above, the values of o((f,x), αo (x), f(X) relating to the attenuation coefficient between the
reflectors - Figs. 8(a) through 8(d) illustrate a situation which is more complicated than that shown in Figs. 5(a) and 5(b), as the object under examination in this case contains a
third reflector 90 in addition to thereflectors reflectors reflectors echo signal 530. - Whether or not the
reflector 90 is located at the same distance from the fifth transducer as thereflector 60 can be determined in advance from the reproduced image (shown in Fig. 8(b)), as will be described in detail below. In this case, therefore, astraight line 100 connecting thereflectors probe 1 and intersects the seventh transducer 7. Accordingly, information relating to the attenuation coefficient between thereflectors signals 710, 720 (shown in Fig. 8(d)) from thereflectors echo signal 700 from the seventh transducer. - Thus it has been shown, as set forth above, that information relating to the attenuation coefficient of an object not heretofore obtainable with the conventional method and not even with the synthetic aperture method can be acquired through correct measurement by expanding upon the signal processing method disclosed in the specification of the present applicant's previously filed Japanese Patent Application No. 55-49571 (Japanese Patent Application Laid-open No. 56-147082), and by applying this method to the synthetic aperture method, and that this can be achieved without introducing large errors due to transmitted sound field diffusion loss, as occurs in the prior art, and without going to the trouble of compensating for diffusion loss by means of a reference specimen for attenuation measuring purposes. It should be noted that the present invention is not limited to ultrasonic flaw detection but can also be applied to liquid specimens for which the attenuation coefficient is unknown. Such an application can readily be practiced by adopting a liquid as the
object 2 shown in Fig. 5(a) and disposing thereflectors - As for application of the present invention to an ultrasonic diagnostic system for medical purposes, namely to measurement of living tissue, it will be appreciated that a more sophisticated method of signal processing will be required in view of the fact that such tissue does not possess a simple constitution of the type shown in Fig. 5(a) or Fig. 8(a) but may instead be thought of as a fairly complex assemblage of scatterers.
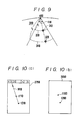
- However, analysis is comparatively easy if we imagine a case where, as shown in Fig. 9, a
liver 300 contains, internally thereof, comparativelystout blood vessels arc 330 within adirectivity angle 410, the radius of the arc being the distance r (=rl) from a transmissionacoustic source 400 to thereflector 310, and (b) the intensity exhibited by an echo signal from thereflector 310. The same will hold true for thereflector 320. - Referring to Eq. (2), let us assume that the intensity of the echo signal from the
reflector 310 is expressed by I(f,r1), and that the sum of the intensities of the echo signals from the other reflectors on thearc 330 is expressed by I'(f,r1). We may then express the intensity J(f,r1) of the echo signal received by thetransducer 400 as follows:

- Here we assume that the intensity of the transmitted ultrasonic wave is Io(f), which is constant within the
directivity angle 410. From Eqs. (2) and (25), Eq. (24) becomes:
- Taking the natural logarithm of both sides of Eq. (27) gives us


- The last term on the right side of the above equation is an error term which, in comparison with Eq. (2), is caused by the presense of reflectors other than the
reflector 310 on thearc 330. - Accordingly, we will assume that the reflection intensity of the
reflector 310 is sufficiently large in comparison with the reflection intensities of the other reflectors on thearc 330. That is, we will assume that the following condition holds:
- Further, assuming that the reflectors (with the exception of reflector 310) on the
arc 330 are sufficiently small in comparison with wavelength, b'(rl) = -2 may be considered to hold for these reflectors and -2 < b(r1) < 0 for thereflector 310, so that we have:
- Since α'(f,r) - α(f,r) may be considered to hold for a liver, which is one example of living tissue, the value of

- is presumed to be |Δα|, which is very small. Therefore, if the error term in Eq. (28) is replaced by E(f,rl), we may write

and if exp (|Δα|) ≃ 1 is considered to hold, Eq. (30) reduces to
- Accordingly, assuming from the condition set forth in Eq. (29) that the second term enclosed by the brackets in Eq. (31) is assumed to be very small, namely that the condition

holds, then Eq. (31) will reduce to
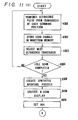
so that the error term may be considered to be negligibly small. The foregoing will also hold true for thereflector 320, so that we will have E(f,r2) = 0. Subsequent processing is as already set forth in detail above, enabling the acquistion of information relating to the attenuation coefficient between thereflectors - Let us now give a detailed description of an embodiment of the present invention, which is illustrated in the block diagram of Fig. 1, with reference to the flowcharts of Figs. ll(a) through 11(c) which show control procedures executed by the
control unit 170. The apparatus of Fig. 1 is distinguishable over the prior-art apparatus of Fig. 4 mainly by provision of an attenuation informationarithmetic unit 3000 and a region-of-interest setting unit 2900. - With reference now to the flowcharts, the loop consisting of
steps 4000 through 4004 calls for transmitting an ultrasonic pulse into anobject 1000 under examination sequentially from the first to the n-th transducers of theprobe 1, and sequentially storing the echo signals received by the transducers in thewaveform memory 130. When echo signals from all of the transducers have been stored in the waveform memory 130 (step 4004), the next step executed is astep 4006, which calls for setting the synthetic aperturearithmetic unit 140 into operation to perform an image reconstruction by means of the synthetic aperture method. The reconstructed image is stored in theimage memory 150. The image signal stored in theimage memory 150 is subjected to an arbitrary attenuation correction and is brightness- modulated for display as an image 2850 [Fig. 10(b)] on thedisplay unit 160. This isstep 4008 of the flowchart. - It is assumed here that two
flaws image 2850. In this case, theflaws image 2850 arbitrarily corrected for attenuation. Next, at astep 4010, the region-of-interest setting unit 2900 is manipulated to set a region which contains theflaws setting unit 2900 may be comprise, e.g., a light pen, in which case the light pen would be used to designate the twoflaws flaws image 2850. A flaw position recognition operation of this kind can also be performed automatically within a set region by the attenuation informationarithmetic unit 3000. - Whichever method of setting the region of interest is adopted, the attenuation information
arithmetic unit 3000 executes astep 4012 to convert the coordinates of the twoflaws image 2850 into position information contained inimage data 2750 stored in theimage memory 150. Theimage data 2750 may be thought of as having the form shown in Fig. 10(a) when expressed in terms of assumed two-dimensional space. Next, at astep 4014, a straight line connecting the twoflaws step 4016, at which thestraight line 1410 is extended and the number of the transducer closest to the point at which the extension intersects the straight line connecting all of the transducers is obtained. - Next, at a
step 4018, the echo signal received by the transducer determined at thestep 4016 is read out of thewave memory 130, which stores the echo signals from all transducers as mentioned above. The read echo signal may be thought of as corresponding to thesignal 500 in Fig. 5(a). The distance from the abovementioned transducer to each of the two flaws is calculated at astep 4020, with the distances obtained being designated X1, X2. A fast-Fourier transformation (FFT) is applied at astep 4022 to the echo signal intensities I(f,X1), I(f,X2) corresponding to the respective distances X1, X2, and I(f1,X1), I(f2,X1), I(f 3,X 1), I(fl,X2), I(f2,X2), I(f3,X2) are obtained at astep 4024. -
Steps 4026 through 4034 call for finding H2, H3, β(x), α(f,x) and αo(x) in succession. Next, at astep 4036, the values of β(x), 0((f,x) and αo(x) are written into theimage memory 150, whereby the abovementioned attenuation information is displayed together with theimage 2850 on thedisplay unit 160. Thus, attenuation information for any region of the object under examination can be obtained. - In the foregoing embodiment, it is described that the
probe 1 incorporates a plurality of internally located transducers. Theprobe 1 is, therefore, of the so-called linear array type. Alternatively, however, the probe can be replaced by a single transducer which, while transmitting ultrasonic waves, is scanned at right angles to the direction of transmission, with the transducer receiving echos of the transmitted waves to provide echo signals. - In practicing the present invention, echo intensities of plural frequencies are required. This makes it necessary to use a probe having good sensitivity and response with respect to the frequencies adopted. To realize a probe of this kind, the
probe 1 is supplied with a sharply attenuating wide-band drive pulse having a waveform of the type shown at 2210. Preferably, theprobe 1 is a transducer made of polymer material (polyvinyldifluoride, or PVDF), a composite transducer made of polymer and inorganic materials, or a PZT transducer provided with an acoustic matching layer, these transducers being designed to have a wide-band characteristic. With a transducer of this type, the ultrasonic pulses transmitted into the interior of theobject 1000 from theprobe 1 will exhibit a wide band and have a waveform of the kind shown at 2210 in Fig. 1. It is also permissible, as set forth in the specification of Japanese Patent Application No. 55-49571 (Japanese Patent Application Laid-open No. 56-147082) mentioned above, to replace the wide-band probe with a probe that exhibits a plurality of diffferent frequency bands. - Furthermore, in a case where echo intensities having a plurality of frequencies are obtained, as described above, it is permissible to transmit and measure individual ultrasonic signals of a plurality of different frequencies. It is also possible to transmit an ultrasonic signal that contains a plurality of different frequency components. In any case, the expression "ultrasonic waves having a plurality of frequencies" and expressions similar thereto used in the present specification are to be interpreted in their widest sense so as to cover not only individual ultrasonic waves but also an ultrasonic wave made up of a plurality of frequency components.
- Thus, according to the present invention, the intensity of an echo obtained from an object under examination as the result of an ultrasonic transmission having a plurality of different frequencies is measured by the so-called synthetic aperture method, whereby the attenuation coefficient of the object and the frequency dependence of the attenuation coefficient can be measured with a minimal error caused by diffusion loss ascribable to diffraction of the transmitted ultrasonic waves. Accordingly, whereas the conventional ultrasonic measurement method and apparatus are capable of providing solely morphological information, the present invention makes it possible to acquire quantitative information relating to attenuation internally of the object under examination.
- As many apparently widely different embodiments of the present invention can be made without departing from the spirit and scope thereof, it is to be understood that the invention is not limited to the specific embodiments thereof except as defined in the appended claims.
Claims (7)
Applications Claiming Priority (2)
| Application Number | Priority Date | Filing Date | Title |
|---|---|---|---|
| JP131918/84 | 1984-06-28 | ||
| JP59131918A JPS6111658A (en) | 1984-06-28 | 1984-06-28 | Method and device for measuring ultrasonic wave |
Publications (2)
| Publication Number | Publication Date |
|---|---|
| EP0168565A1 true EP0168565A1 (en) | 1986-01-22 |
| EP0168565B1 EP0168565B1 (en) | 1991-09-18 |
Family
ID=15069233
Family Applications (1)
| Application Number | Title | Priority Date | Filing Date |
|---|---|---|---|
| EP85105060A Expired - Lifetime EP0168565B1 (en) | 1984-06-28 | 1985-04-25 | Ultrasonic measurement method and apparatus therefor |
Country Status (4)
| Country | Link |
|---|---|
| US (1) | US4597292A (en) |
| EP (1) | EP0168565B1 (en) |
| JP (1) | JPS6111658A (en) |
| DE (1) | DE3584117D1 (en) |
Cited By (3)
| Publication number | Priority date | Publication date | Assignee | Title |
|---|---|---|---|---|
| WO1987007026A1 (en) * | 1986-05-05 | 1987-11-19 | Akademiet For De Tekniske Videnskaber, Svejsecentr | System for ultrasonic examination |
| FR2752461A1 (en) * | 1996-08-14 | 1998-02-20 | Dory Jacques | METHOD AND DEVICE FOR PROCESSING SIGNALS REPRESENTATIVE OF WAVES REFLECTED OR TRANSMITTED BY A VOLUME STRUCTURE WITH A VIEW TO PERFORMING AN EXPLORATION AND ANALYSIS OF THIS STRUCTURE |
| US6167377A (en) * | 1997-03-28 | 2000-12-26 | Dragon Systems, Inc. | Speech recognition language models |
Families Citing this family (41)
| Publication number | Priority date | Publication date | Assignee | Title |
|---|---|---|---|---|
| JPS6070381A (en) * | 1983-09-28 | 1985-04-22 | Toshiba Corp | Ultrasonic imaging apparatus |
| US4736630A (en) * | 1985-08-05 | 1988-04-12 | Hitachi, Ltd. | Apparatus and method for sending out and receiving ultrasonic wave signals |
| US4817015A (en) * | 1985-11-18 | 1989-03-28 | The United States Government As Represented By The Secretary Of The Health And Human Services | High speed texture discriminator for ultrasonic imaging |
| JPH0666854B2 (en) * | 1986-03-12 | 1994-08-24 | 富士写真フイルム株式会社 | Radiation image information recording / reading device |
| JP2647372B2 (en) * | 1987-01-14 | 1997-08-27 | 三菱重工業株式会社 | Aperture synthesis signal processing method |
| DE3720219A1 (en) * | 1987-06-17 | 1988-12-29 | Betr Forsch Inst Angew Forsch | METHOD FOR CHECKING COMPONENTS |
| US5343863A (en) * | 1988-05-11 | 1994-09-06 | Lunar Corporation | Ultrasonic densitometer device and method |
| US4930511A (en) * | 1988-05-11 | 1990-06-05 | Lunar Radiation, Inc. | Ultrasonic densitometer device and method |
| US5042489A (en) * | 1988-05-11 | 1991-08-27 | Lunar Corporation | Ultrasonic densitometer device and method |
| US5840029A (en) * | 1988-05-11 | 1998-11-24 | Lunar Corporation | Imaging ultrasonic densitometer |
| US5099849A (en) * | 1988-05-11 | 1992-03-31 | Lunar Corporation | Ultrasonic densitometer device and method |
| US6277076B1 (en) | 1988-05-11 | 2001-08-21 | Lunar Corporation | Ultrasonic densitometer with pre-inflated fluid coupling membranes |
| US5483965A (en) * | 1988-05-11 | 1996-01-16 | Lunar Corporation | Ultrasonic densitometer device and method |
| US5349959A (en) * | 1988-05-11 | 1994-09-27 | Lunar Corporation | Ultrasonic densitometer device and method |
| US6027449A (en) * | 1988-05-11 | 2000-02-22 | Lunar Corporation | Ultrasonometer employing distensible membranes |
| US5603325A (en) * | 1988-05-11 | 1997-02-18 | Lunar Corporation | Ultrasonic densitometer with width compensation |
| US5054490A (en) * | 1988-05-11 | 1991-10-08 | Lunar Corporation | Ultrasonic densitometer device and method |
| US5111696A (en) * | 1989-01-24 | 1992-05-12 | Akademiet For De Tekniske Videnskaber, Svejsecentralen | Method of visualizing reflection characteristic in ultrasonic examination |
| IL94616A (en) * | 1990-06-04 | 1994-06-24 | Medicano Systems Ltd | Apparatus and method for calculating the mechanical properties of a solid |
| US5426979A (en) * | 1990-06-04 | 1995-06-27 | Medicano Systems Ltd. | Frequency spectrum apparatus for determining mechanical properties |
| US5475613A (en) * | 1991-04-19 | 1995-12-12 | Kawasaki Jukogyo Kabushiki Kaisha | Ultrasonic defect testing method and apparatus |
| US5218963A (en) * | 1991-10-15 | 1993-06-15 | Lunar Corporation | Ultrasonic bone analysis device and method |
| US5269309A (en) * | 1991-12-11 | 1993-12-14 | Fort J Robert | Synthetic aperture ultrasound imaging system |
| US5501222A (en) * | 1994-05-13 | 1996-03-26 | Briggs; Keith A. | System for imaging a region |
| US5549002A (en) * | 1994-07-01 | 1996-08-27 | General Electric Company | Method for detecting and characterizing flaws in engineering materials |
| US6517487B1 (en) | 1995-03-01 | 2003-02-11 | Lunar Corporation | Ultrasonic densitometer with opposed single transducer and transducer array |
| IL116701A0 (en) | 1995-10-04 | 1996-10-16 | Sunlight Ultrasound Technologi | Ultrasonic device for determining bone characteristics |
| EP0829714A4 (en) * | 1996-03-28 | 2007-06-27 | Mitsubishi Electric Corp | Ultrasonic flaw detector and ultrasonic flaw-detecting method |
| US5801312A (en) * | 1996-04-01 | 1998-09-01 | General Electric Company | Method and system for laser ultrasonic imaging of an object |
| US7112173B1 (en) | 1998-03-03 | 2006-09-26 | Sunlight Medical Ltd. | Determination of acoustic velocity in bone |
| US7353709B2 (en) * | 2005-07-06 | 2008-04-08 | National Research Council Of Canada | Method and system for determining material properties using ultrasonic attenuation |
| WO2007003058A1 (en) * | 2005-07-06 | 2007-01-11 | National Research Council Of Canada | Method and system for determining material properties using ultrasonic attenuation |
| DE102006027132B4 (en) | 2006-06-02 | 2010-04-15 | BAM Bundesanstalt für Materialforschung und -prüfung | Method for detecting defects in concrete components |
| US7836769B2 (en) * | 2006-08-10 | 2010-11-23 | Akrion Systems Llc | Apparatus and method of measuring acoustical energy applied to a substrate |
| JP5683213B2 (en) | 2009-11-17 | 2015-03-11 | キヤノン株式会社 | Image forming apparatus and image forming method |
| US9110166B2 (en) | 2011-12-01 | 2015-08-18 | Halliburton Energy Services, Inc. | Acoustic imaging |
| EP3282921B1 (en) | 2015-04-16 | 2022-02-16 | Gentuity LLC | Micro-optic probes for neurology |
| JP6981967B2 (en) | 2015-08-31 | 2021-12-17 | ジェンテュイティ・リミテッド・ライアビリティ・カンパニーGentuity, LLC | Imaging system including imaging probe and delivery device |
| CN106932277B (en) * | 2017-04-28 | 2023-05-12 | 大连理工大学 | Interface ultrasonic reflectivity-pressure intensity relation curve establishment method based on fillet plane contact theory and loading test bed |
| JP7160935B2 (en) | 2017-11-28 | 2022-10-25 | ジェンテュイティ・リミテッド・ライアビリティ・カンパニー | Imaging system |
| US11719672B2 (en) | 2020-06-12 | 2023-08-08 | Baker Hughes Oilfield Operations Llc | Application specific excitation of ultrasonic probes |
Citations (2)
| Publication number | Priority date | Publication date | Assignee | Title |
|---|---|---|---|---|
| WO1982002781A1 (en) * | 1981-02-09 | 1982-08-19 | Esko Alasaarela | The holographic b-scan imaging method |
| EP0091768A2 (en) * | 1982-04-07 | 1983-10-19 | Fujitsu Limited | Measuring characteristics of living tissues by ultrasonic waves |
Family Cites Families (4)
| Publication number | Priority date | Publication date | Assignee | Title |
|---|---|---|---|---|
| JPS55143476A (en) * | 1979-04-26 | 1980-11-08 | Kiyoshi Nakayama | Composing method for ultrasonic-wave opening surface |
| JPS56147082A (en) * | 1980-04-17 | 1981-11-14 | Yoshinori Hayakawa | Method and device for quantitative ultrasonic inspection using plural frequencies |
| JPS59171540A (en) * | 1983-03-18 | 1984-09-28 | 富士通株式会社 | Measurement utilizing spectrum shape |
| US4546772A (en) * | 1983-08-08 | 1985-10-15 | General Electric Company | Method and means for determining ultrasonic wave attenuation in tissue using phase locked loop |
-
1984
- 1984-06-28 JP JP59131918A patent/JPS6111658A/en active Pending
-
1985
- 1985-04-22 US US06/725,797 patent/US4597292A/en not_active Expired - Lifetime
- 1985-04-25 DE DE8585105060T patent/DE3584117D1/en not_active Expired - Fee Related
- 1985-04-25 EP EP85105060A patent/EP0168565B1/en not_active Expired - Lifetime
Patent Citations (2)
| Publication number | Priority date | Publication date | Assignee | Title |
|---|---|---|---|---|
| WO1982002781A1 (en) * | 1981-02-09 | 1982-08-19 | Esko Alasaarela | The holographic b-scan imaging method |
| EP0091768A2 (en) * | 1982-04-07 | 1983-10-19 | Fujitsu Limited | Measuring characteristics of living tissues by ultrasonic waves |
Non-Patent Citations (3)
| Title |
|---|
| 1972 IEEE ULTRASONICS SYMPOSIUM PROCEEDINGS, 72 CHO 708-8 SU, pages 81-86, New York, US; E.P. PAPADAKIS et al.: "New uses of ultrasonic spectrum analysis" * |
| JOURNAL OF THE ACOUSTICAL SOCIETY OF AMERICA, vol. 64, no. 2, August 1977, pages 341-345, Acoustical Society of America, New York, US; T. SATO et al.: "Super-resolution ultrasonic imaging by combined spectral and aperture synthesis" * |
| JOURNAL OF THE ACOUSTICAL SOCIETY OF AMERICA, vol. 69, no. 6, June 1981, pages 1838-1840, Acoust. Soc. Am., New York, US; Y. HAYAKAWA et al.: "Multifrequency echoscopy for quantitative acoustical characterization of living tissues" * |
Cited By (5)
| Publication number | Priority date | Publication date | Assignee | Title |
|---|---|---|---|---|
| WO1987007026A1 (en) * | 1986-05-05 | 1987-11-19 | Akademiet For De Tekniske Videnskaber, Svejsecentr | System for ultrasonic examination |
| FR2752461A1 (en) * | 1996-08-14 | 1998-02-20 | Dory Jacques | METHOD AND DEVICE FOR PROCESSING SIGNALS REPRESENTATIVE OF WAVES REFLECTED OR TRANSMITTED BY A VOLUME STRUCTURE WITH A VIEW TO PERFORMING AN EXPLORATION AND ANALYSIS OF THIS STRUCTURE |
| EP0825453A1 (en) * | 1996-08-14 | 1998-02-25 | Jacques Dory | Method and apparatus for processing signals representative of waves which have been reflected by or transmitted through a volume structure, in order to enable exploration and analysis of said structure |
| US6023660A (en) * | 1996-08-14 | 2000-02-08 | Dory; Jacques | Method and device for the processing of signals representative of waves reflected or transmitted by a voluminal structure with a view to exploring and analyzing said structure |
| US6167377A (en) * | 1997-03-28 | 2000-12-26 | Dragon Systems, Inc. | Speech recognition language models |
Also Published As
| Publication number | Publication date |
|---|---|
| JPS6111658A (en) | 1986-01-20 |
| US4597292A (en) | 1986-07-01 |
| EP0168565B1 (en) | 1991-09-18 |
| DE3584117D1 (en) | 1991-10-24 |
Similar Documents
| Publication | Publication Date | Title |
|---|---|---|
| EP0168565B1 (en) | Ultrasonic measurement method and apparatus therefor | |
| Ylitalo et al. | Ultrasound synthetic aperture imaging: monostatic approach | |
| Busse | Three-dimensional imaging using a frequency-domain synthetic aperture focusing technique | |
| Von Ramm et al. | Beam steering with linear arrays | |
| Aubry et al. | Optimal focusing by spatio-temporal inverse filter. II. Experiments. Application to focusing through absorbing and reverberating media | |
| US4182173A (en) | Duplex ultrasonic imaging system with repetitive excitation of common transducer in doppler modality | |
| Kino | Acoustic imaging for nondestructive evaluation | |
| EP0154869B1 (en) | Ultrasonic measurement apparatus | |
| EP0146707B1 (en) | Ultrasonic measurement method, and apparatus therefor | |
| EP0155630B1 (en) | Ultrasonic measurement method, and apparatus therefor | |
| EP0139235B1 (en) | Ultrasonic measurement method and apparatus therefor | |
| Lu et al. | In vitro and in vivo real-time imaging with ultrasonic limited diffraction beams | |
| McKee et al. | Volumetric imaging through a doubly-curved surface using a 2D phased array | |
| Insana et al. | Backscatter coefficient estimation using array transducers | |
| JPH0713631B2 (en) | Ultrasonic echographic inspection method and apparatus for medium | |
| US11796659B2 (en) | Suppression of multiple scattering noise in pulse echo imaging | |
| Yao | Synthetic aperture methods for medical ultrasonic imaging | |
| US11885917B2 (en) | Methods and instrumentation for estimation of wave propagation and scattering parameters | |
| WO2021260405A1 (en) | Methods and instrumentation for estimation of wave propagation and scattering parameters | |
| Robinson et al. | Real-time angular scatter imaging system for improved tissue contrast in diagnostic ultrasound images | |
| Barber | The scanning acoustic microprobe: I. Analysis and synthesis of a spherically symmetric point spread function | |
| Lacefield et al. | Angular scatter ultrasound imaging of wavelength scale targets | |
| Iriarte et al. | Synthetic aperture ultrasound imaging using GPUs | |
| JPH0713630B2 (en) | Method and apparatus for inspecting object by ultrasonic echography | |
| Wilcox et al. | Defect characterization using ultrasonic arrays |
Legal Events
| Date | Code | Title | Description |
|---|---|---|---|
| PUAI | Public reference made under article 153(3) epc to a published international application that has entered the european phase |
Free format text: ORIGINAL CODE: 0009012 |
|
| 17P | Request for examination filed |
Effective date: 19850522 |
|
| AK | Designated contracting states |
Designated state(s): DE FR GB NL |
|
| 17Q | First examination report despatched |
Effective date: 19890329 |
|
| GRAA | (expected) grant |
Free format text: ORIGINAL CODE: 0009210 |
|
| AK | Designated contracting states |
Kind code of ref document: B1 Designated state(s): DE FR GB NL |
|
| ET | Fr: translation filed | ||
| REF | Corresponds to: |
Ref document number: 3584117 Country of ref document: DE Date of ref document: 19911024 |
|
| PLBE | No opposition filed within time limit |
Free format text: ORIGINAL CODE: 0009261 |
|
| STAA | Information on the status of an ep patent application or granted ep patent |
Free format text: STATUS: NO OPPOSITION FILED WITHIN TIME LIMIT |
|
| 26N | No opposition filed | ||
| REG | Reference to a national code |
Ref country code: GB Ref legal event code: IF02 |
|
| PGFP | Annual fee paid to national office [announced via postgrant information from national office to epo] |
Ref country code: FR Payment date: 20030408 Year of fee payment: 19 |
|
| PGFP | Annual fee paid to national office [announced via postgrant information from national office to epo] |
Ref country code: GB Payment date: 20030423 Year of fee payment: 19 |
|
| PGFP | Annual fee paid to national office [announced via postgrant information from national office to epo] |
Ref country code: NL Payment date: 20030429 Year of fee payment: 19 |
|
| PGFP | Annual fee paid to national office [announced via postgrant information from national office to epo] |
Ref country code: DE Payment date: 20030508 Year of fee payment: 19 |
|
| PG25 | Lapsed in a contracting state [announced via postgrant information from national office to epo] |
Ref country code: GB Free format text: LAPSE BECAUSE OF NON-PAYMENT OF DUE FEES Effective date: 20040425 |
|
| PG25 | Lapsed in a contracting state [announced via postgrant information from national office to epo] |
Ref country code: NL Free format text: LAPSE BECAUSE OF NON-PAYMENT OF DUE FEES Effective date: 20041101 |
|
| PG25 | Lapsed in a contracting state [announced via postgrant information from national office to epo] |
Ref country code: DE Free format text: LAPSE BECAUSE OF NON-PAYMENT OF DUE FEES Effective date: 20041103 |
|
| GBPC | Gb: european patent ceased through non-payment of renewal fee |
Effective date: 20040425 |
|
| PG25 | Lapsed in a contracting state [announced via postgrant information from national office to epo] |
Ref country code: FR Free format text: LAPSE BECAUSE OF NON-PAYMENT OF DUE FEES Effective date: 20041231 |
|
| NLV4 | Nl: lapsed or anulled due to non-payment of the annual fee |
Effective date: 20041101 |
|
| REG | Reference to a national code |
Ref country code: FR Ref legal event code: ST |