EP0226044A2 - Display of a stream line of an inhomogeneous flowing medium - Google Patents
Display of a stream line of an inhomogeneous flowing medium Download PDFInfo
- Publication number
- EP0226044A2 EP0226044A2 EP86115755A EP86115755A EP0226044A2 EP 0226044 A2 EP0226044 A2 EP 0226044A2 EP 86115755 A EP86115755 A EP 86115755A EP 86115755 A EP86115755 A EP 86115755A EP 0226044 A2 EP0226044 A2 EP 0226044A2
- Authority
- EP
- European Patent Office
- Prior art keywords
- scanning
- flow
- signals
- sub
- stream line
- Prior art date
- Legal status (The legal status is an assumption and is not a legal conclusion. Google has not performed a legal analysis and makes no representation as to the accuracy of the status listed.)
- Granted
Links
Images


Classifications
-
- A—HUMAN NECESSITIES
- A61—MEDICAL OR VETERINARY SCIENCE; HYGIENE
- A61B—DIAGNOSIS; SURGERY; IDENTIFICATION
- A61B8/00—Diagnosis using ultrasonic, sonic or infrasonic waves
- A61B8/06—Measuring blood flow
-
- A—HUMAN NECESSITIES
- A61—MEDICAL OR VETERINARY SCIENCE; HYGIENE
- A61B—DIAGNOSIS; SURGERY; IDENTIFICATION
- A61B8/00—Diagnosis using ultrasonic, sonic or infrasonic waves
- A61B8/48—Diagnostic techniques
- A61B8/481—Diagnostic techniques involving the use of contrast agent, e.g. microbubbles introduced into the bloodstream
-
- G—PHYSICS
- G01—MEASURING; TESTING
- G01P—MEASURING LINEAR OR ANGULAR SPEED, ACCELERATION, DECELERATION, OR SHOCK; INDICATING PRESENCE, ABSENCE, OR DIRECTION, OF MOVEMENT
- G01P5/00—Measuring speed of fluids, e.g. of air stream; Measuring speed of bodies relative to fluids, e.g. of ship, of aircraft
- G01P5/24—Measuring speed of fluids, e.g. of air stream; Measuring speed of bodies relative to fluids, e.g. of ship, of aircraft by measuring the direct influence of the streaming fluid on the properties of a detecting acoustical wave
-
- G—PHYSICS
- G01—MEASURING; TESTING
- G01S—RADIO DIRECTION-FINDING; RADIO NAVIGATION; DETERMINING DISTANCE OR VELOCITY BY USE OF RADIO WAVES; LOCATING OR PRESENCE-DETECTING BY USE OF THE REFLECTION OR RERADIATION OF RADIO WAVES; ANALOGOUS ARRANGEMENTS USING OTHER WAVES
- G01S7/00—Details of systems according to groups G01S13/00, G01S15/00, G01S17/00
- G01S7/52—Details of systems according to groups G01S13/00, G01S15/00, G01S17/00 of systems according to group G01S15/00
- G01S7/52017—Details of systems according to groups G01S13/00, G01S15/00, G01S17/00 of systems according to group G01S15/00 particularly adapted to short-range imaging
- G01S7/52023—Details of receivers
- G01S7/52036—Details of receivers using analysis of echo signal for target characterisation
-
- G—PHYSICS
- G01—MEASURING; TESTING
- G01S—RADIO DIRECTION-FINDING; RADIO NAVIGATION; DETERMINING DISTANCE OR VELOCITY BY USE OF RADIO WAVES; LOCATING OR PRESENCE-DETECTING BY USE OF THE REFLECTION OR RERADIATION OF RADIO WAVES; ANALOGOUS ARRANGEMENTS USING OTHER WAVES
- G01S7/00—Details of systems according to groups G01S13/00, G01S15/00, G01S17/00
- G01S7/52—Details of systems according to groups G01S13/00, G01S15/00, G01S17/00 of systems according to group G01S15/00
- G01S7/52017—Details of systems according to groups G01S13/00, G01S15/00, G01S17/00 of systems according to group G01S15/00 particularly adapted to short-range imaging
- G01S7/52085—Details related to the ultrasound signal acquisition, e.g. scan sequences
Definitions
- This invention relates to the display of stream lines of inhomogeneous flowing mediums.
- a Doppler tomograph In the art of medical electronics, it has been proposed to use an ultrasonic wave tomograph to display condition or motion of human organs on a cathode ray tube (CRT). Recently, it has been proposed to use a Doppler tomograph to obtain a display of blood motion, showing a "map" of blood flow on a two dimensional tomogram, using a colour display. For example, a bloodstream approaching an ultrasonic pulse transmitting and receiving transducer is coloured red and a stream going away from the transducer is coloured blue. The colour tone is varied in accordance with the speed of the bloodstream. An indication of the speed of the bloodstream is obtained from a frequency shift, phase shift or a distortion of pulse form present in an echo pulse and caused by the Doppler effect. A process whereby an indication of speed of a moving body is obtained from such data is called a Doppler process, and hence a tomograph using such a process is called a Doppler tomograph.
- the measured speed of a blood flow is the relative speed of the bloodstream concerned in the scanning direction of the ultrasonic beam used. Therefore, measured speed varies when the scanning direction is varied, and as a limit measured blood speed is zero when the bloodstream is scanned orthogonally. If the scanning direction is further rotated, the measured blood speed is reversed.
- the previously proposed ultrasonic tomograph cannot show blood stream-lines.
- a blood stream-line is parallel to the relevant blood vessel. Therefore, the need to show blood stream-lines has not in general been great.
- the heart is a chamber rather than a tube so the flow of blood in a ventricle cannot be anticipated from its appearance. Accordingly it is important to display real speed and direction of a stream line of blood flow in a tomogram.
- no means have been provided which can show stream lines of blood flow in the human heart.
- An embodiment of the present invention can provide a method of displaying a stream line of an inhomogenous flowing medium.
- An embodiment of the present invention can provide a device for showing a stream line of an inhomogenous flowing medium.
- An embodiment of the present invention can provide a tomograph which can show a stream line of blood flow in the human heart.
- Embodiments of the present invention can provide for real-time display of a blood flow stream line.
- An embodiment of the present invention observes, in effect, motion of speckles which appear in a tomogram of an inhomogeneous flow such as a bloodstream. For example, two tomograms, taken at timings separated by a very short time interval, during which interval correlation between speckles is retained, are used. From an image constructed from difference between the two tomograms, direction of motion and speed of the speckles are obtained. By a proper graphic process, segments of stream lines are shown in the tomogram.
- the scanning field in an embodiment of the invention, is divided into m sub-fields, and in respect of each sub-field processing as mentioned above is performed.
- processing in respect of a first sub-field is completed, the next sub-field is processed, and in such a manner the entire scanning field is composed.
- Blood is composed of a mixture of red blood corpuscles, hemoleukocytes and blood platelets immersed in blood serum. Mean density of blood is almost uniform in the heart, for example. However, the microscopic spatial arrangement of blood components, red blood corpuscles for example, is random.
- a reflected ultrasonic wave is composed of waves reflected or scattered from each of those various red blood corpuscles respectively. Since these reflected waves interfere with each other, an image obtained from reflected waves exhibits speckles consisting of randomly arranged white (for example) portions (indicating strong reflections) and dark (for example) portions (indicating weak reflections). Usually, such a white portion is called a "speckle".
- Reflections of ultrasonic waves from blood are extremely weak as compared with those from muscles, the heart wall or heart membranes. So, reflections from blood cannot be observed in ordinary B mode image display, in which reflected wave intensity is represented by image brightness on a CRT. However, as will be described later, if two tomograms are taken in sequence, and an image corresponding to differences between these two tomograms is extracted, the strong image of muscles and heart membranes, etc., which are not moving, disappear. Only signals from portions that have moved during the interval between the tomograms are left on the display. Such a "difference" image can provide an image of blood stream flow, and hence speckles appear.
- the size of a speckle in the observation of blood flow in this way varies depending upon aperture of the ultrasonic transducer, focusing of the ultrasonic beam employed, depth of the reflecting body (blood) (distance from transducer), frequency of the ultrasonic waves employed, and bandwidth of the ultrasonic receiver, and so on.
- the shape of a speckle is approximated to a circle having a diameter of 5 mm, and the depth of measurement is assumed to be 10 cm.
- Fig. 1(a) is an image of speckles.
- two images of flowing speckles measured or taken sequentially, with a short time interval between them, are superposed.
- the broken lines indicate speckles observed in the first measurement, and the solid lines indicate the same speckles observed in the second measurement.
- ⁇ T it is necessary that the time interval ⁇ T between the two measurements be small, so that the image of respective speckles obtained in the two measurements are superposed on (at least partially overlap) one another to retain spatial correlation. If ⁇ T is too large, the first (former) images of the speckles separate for the second (latter) images, and since the shape of a speckle varies rapidly, correlation between the speckles is lost, and it is difficult to distinguish which speckle has moved to where. ⁇ T should be varied depending on the speed of motion of the speckles to be measured.
- Fig. 1(a) When the images of Fig. 1(a) are shown with brightness modulation, that is, as monochromatic images, and when an image showing differences of brightness between the first and second images is composed, it is schematically illustrated in Fig. 1(b).
- the dotted portions correspond to regions of small brightness difference (between the first and second images) indicating parts where speckles overlap;
- the white portions indicate regions of brightness of difference of a positive value (e.g. first image brighter than second in these regions), and the hatched portions indicate regions of brightness of difference of a negative value (e.g. first image darker than second).
- the images are colour-modulated and positive difference value portions (white portions) coloured red and negative difference value portions (hatched portions) are coloured green
- the central portions (dotted portions) become a mixture of red and green, so it is possible to determine that the speckles have moved in a direction from green to red.
- the distance between the red and green portions corresponds to the speed of the speckles.
- the resultant image on the CRT becomes as schematically indicated in Fig. 1(c).
- the brightness is high, and at the centre portion, the brightness is small.
- This picture resembles a photograph of moving particles taken with a properly long exposure.
- the dislocation or displacement of the images indicates the direction of motion, and the length of the dislocation or displacement indicates the speed of motion.
- FIGs. 1(d) and (e) show images obtained with the processes of Fig. 1(b) and Fig. 1(c) carried out twice in each case. Namely the repetition number q is 2.
- the repetition number q is 2.
- three tomograms have been taken.
- the above-mentioned processes are performed twice, and the obtained images superposed on each other.
- Fig. 1(d) corresponds to Fig. 1(b)
- the white portions may be represented on a colour display as red
- the hatched portions as green
- the dotted portions become a yellowish mixture of red and green.
- Fig. 1(e) corresponds to Fig. 1(c).
- Fig. 1(d) and (e) have advantage that the images provided have greater resemblance to a stream line.
- the images of speckles are brightest at their centres, and become darker towards their peripheries. Therefore, the formed segments of stream lines indicated in Fig. 1(d) and (e) are brighter at their centre portions, and darker on both sides of the images. Therefore, if brightness is digitized using an appropriate threshold value (namely if the portions brighter than the threshold value are emphasized to maximum brightness (100% bright), and portions of brightness less than the threshold value are cut down to zero brightness) the images of Fig. 1(e) are thinned, as illustrated in Fig. 1(f). Compared to the broad features of Figs. 1(d) and (e), the images of Fig. 1(f) resemble more nearly segments of stream lines.
- a speckle observed in the first measurement contacts another speckle image, it will cause a misjudgment of the stream line or speed of flow.
- diameter of a speckle is almost equal to the spacing between speckles. So the displacement of a speckle between successive measurements must be less than the diameter of the speckle. This limits the maximum length of the segment of a stream line to be displayed on a tomogram.
- speckle diameter is almost equal to the spacing between speckles. So the maximum length of a stream line segment is twice the speckle diameter. For example, if speckle diameter is 5 mm, the length of a stream line segment which can be shown on the tomogram is less than 10 mm.
- the length of stream line segments can be varied by varying the diameter of the speckles.
- the diameter of the speckles may be varied by varying the aperture of the transducer, focusing of the beam and wave length of the ultrasonic wave, etc.
- most effective for obtaining a long stream line is the introduction of some kind of echo enhancing particle, such as bubbles, into the blood stream.
- an introduced particle bubble for example
- does not change its shape during motion, and the size of and spacing between particles may be controlled at will.
- the movement of a particle (e.g. bubble) may be traced, without losing its spatial correlation, for a relatively long time.
- the repetition number q of the measurement may be increased to provide a long stream line as compared with that shown in Fig. 1(f).
- the effect is similar to that which would be achieved if the motion of a particle were traced by a motion picture, and then the frames of the motion picture were superposed on each other.
- inequality (1) becomes also the condition that one speckle does not overlap other speckles. This also determines the maximum length of stream line segments.
- Embodiments of the present invention will be described below as they relate to the provision of tomographs for displaying bloodstream in the human heart.
- it is necessary to provide a measuring depth of at least 150 mm. Since sound velocity in the human body is about 1.5 mm/ ⁇ s, it takes 0.2 ms for an ultrasonic wave to travel to and return from a depth of 150 mm.
- the embodiment of the present invention described below is designed to display bloodstream speeds of up to 1 m/s.
- Fig. 2 illustrates an ultrasonic beam scanning method employed in a first embodiment of the present invention.
- a scanning field of 90° is divided into four sub-fields A, B, C and D, each having a scan angle of 22.5°.
- Fig. 2(b) illustrates the relationship between scan angle and scan time, over the time required to scan an entire frame of the scanning field.
- the scanning line density is 128 lines/90°. So, each sub-field is scanned by 32 scanning lines respectively. As indicated above, it takes 0.2 ms to obtain each scanning line, and it takes 6.4 (0.2 ⁇ 32) ms to scan over one sub-field.
- Each sub-field is scanned twice and, therefore, measurement in relation to one sub-field takes 12.8 ms.
- sub-field B is scanned, in succession. It thus requires 51.2 ms to complete measurement in respect of the entire scanning field of 90°. So, the frame rate is 20 frames/s, and the time interval between scannings ⁇ T is 6.4 ms.
- Data obtained from ultrasonic echo signals is stored successively in a memory, and after measurement in respect of one sub-field is completed, image processing is effected to obtain segments of stream lines as described above.
- the time needed for such processing is very short compared to the time needed for measurement in respect of one sub-field. So, such processing in relation to one sub-field is completed while measurement in respect of a next sub-field is going on, and the results are displayed on a CRT as a sub-frame. Images of sub-fields obtained in such manner are displayed successively on the CRT to construct an entire frame of the scanning field.
- FIG. 3 A scanning method employed in a second embodiment of the present invention is illustrated in Fig. 3. This embodiment can provide for a more precise measurement of stream lines.
- the entire scanning field of 45° is divided into 8 sub-fields, and measurements are repeated three times for each of the sub-fields; therefore, the repetition number q is 3.
- the scanning line density is 128 lines/90°. So, the number of scanning lines p which covers one sub-field is 8, and the time interval between measurements, ⁇ T, is 1.6 ms (0.2 ⁇ 8). So more precise stream line determination can be available.
- Fig. 3 indicates time variation of the scan angle of the supersonic (ultrasonic) beam.
- the ordinate corresponds to scan angle and the abscissa to time in ms.
- Circled numerals along the abscissa indicate the relevant sub-fields being scanned at the indicated times and scan angles. As shown in the Figure, each sub-field is scanned four times. Small horizontal bars beneath the circled numerals indicate pairs of scannings, from which scan data is processed to obtain differences. For each sub-field, the first processing is effected using the difference between first and second scanning data indicated by the first bar.
- the second processing is effected using the second and the third scanning data indicated by the second bar
- the third processing is effected using the third and fourth scanning data indicated by the third bar.
- ⁇ T is 1.6 ms. Images of moving speckles are obtained respectively from these three processings and stream lines are obtained by superposing these images.
- sub-frames are composed in each 6.4 ms, and the total time to complete a frame is 51.2 ms, so the frame rate becomes approximately 20 frames/s.
- the time difference or interval between two images to be processed is reduced to one-fourth. Therefore, spatial wavelength of noise induced by slow motion of organs arising from breathing or slippage of the transducer during the measurements is reduced to one-fourth. So, it becomes easy to apply a filter to remove such noise, and hence a better image is obtained.
- a third embodiment of the present invention employs a scanning method intended to suppress such noise to as low a level as possible.
- the time interval to take a difference is reduced to 0.2 ms, namely, the difference is taken between successive shots of the supersonic (ultrasonic) beam.
- Each scanning line is scanned twice (in succession) repeatedly, and echo information is obtained from the difference between these two shots. Therefore noise caused by the motion of the target is reduced to minimum, and only the fast movement of blood flow is left.
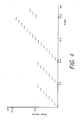
- Fig. 4 illustrates the time variation of beam scan angle for the method employed in the third embodiment. Abscissa is time in ms, and ordinate is scan angle. Black dots in Fig. 4 indicate ultrasonic beam shots; therefore each spot corresponds to one line scanning, and from each two spots aligned horizontally in Fig. 4 (i.e. from the scannings of the same line), information relating to one scanning line is obtained. Though Fig. 4 illustrates only a part of a total scanning cycle, it will be clear that the scan angle is increased stepwise after every second shot. Each sub-field is scanned with eight double scans (it takes 3.2 ms), and such scanning is repeated three times for each sub-field.
- the image is displayed on a CRT, and then the next sub-field is processed successively.
- the time required for measurement in respect of one frame is 76.8 ms, so the frame rate becomes 13 frames/sec.
- the scanning satisfies the above requirements in terms of scanning line density and frame rate. Therefore, by adding four images each having a 22.5° frame angle but having directions differing from one another but 22.5°, the images taken from or in respect of four successive cardiac pulses, it is possible to synthesize a 90° frame image.
- Such stroboscopic synthesizing is known in the art so further description is omitted.
- the original signals from which images are formed are assumed to be simply echo signals.
- various types of input signal are known. For example, a time gain controlled signal, a logarithmic signal, an orthogonal detected signal, a power signal and so on.
- Embodiments of the present invention can employ such signals as input.
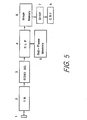
- FIG. 5 The configuration of a tomograph in accordance with an embodiment of the present invention is schematically illustrated in Fig. 5.
- 1 is a transducer which emits and receives an ultrasonic beam
- 2 is a circuit for handling transmission or reception of ultrasonic waves (abbreviated to TR).
- Transducer 1 and circuit 2 are similar to such items used for an ordinary ultrasonic imaging device having a B mode display.
- 3 is an echo signal generator (ESG) which processes received echo signals and generates a signal having various kinds of characteristics preferable to obtain a desired image, for example, a logarithmic wave, a gain controlled echo signal, a power signal and so on.
- ESG echo signal generator
- Such signals are all well-known in the art, so further description is omitted.
- the signal processed in the echo signal generator is mainly an analog signal, so the output signal of the echo signal generator is converted to a digital signal by a built-in analog to digital converter (A/D converter), and supplied to a stream line processor (SLP) 4.
- the stream line processor stores echo signals in a plurality of sub-frame memories 5, and reads out the memories to process the stored data as has been described above, to provide an image signal.
- Image signals are stored in an image memory 6.
- a display circuit (DISP) 7 reads out the image memory, and displays images on a CRT 8. Though it is not shown in the Figure, all of these processes and timing are controlled by a central processor unit (CPU).
- the echo signal processed in the echo signal generator 3 is digitized and supplied to the SLP 4.
- the SLP comprises a digital scan converter (DSC) 41, which provides the input signal with an address for storage in sub-frame memory 5.
- the sub-frame memory 5 is composed of plurality of memory means which may be called, respectively, first, second, and third sub-frame memories and so on (51, 52, 53 ...), corresponding to the number of sub-frames m into which the scanning field is divided.
- the SLP 4 also comprises switches S1, S2, S3 and so on, respectively corresponding to the sub-frame memories.
- DSP digital signal processor
- the switch S1 is switched to the DSC side, and the other switches are switched to the DSP side, as shown in Fig. 6, so that echo data is stored in the first sub-frame memory 51.
- the data is stored in memory planes 511, 512, 513 and so on, each plane corresponding to a first, second, third scanning, and so on.
- Such a memory device, its control and operation are well-known in the art, so further description is omitted for the sake of simplicity.
- the other switches S2 to S4 are switched to the DSP side, so the DSP can carry out processing to obtain stream lines, using data stored in the second and third sub-frame memories and so on.
- the data processed by the DSP is sent to the image memory 6 and stored there.
- the digital signal processor (DSP) 42 may be of any kind which can perform the required processing, as has been mentioned before.
- Processes for display of an image such as is stored in the image memory 6 on a CRT 8 using a display circuit DISP 7 are known in the art, so description will be omitted. Usually, however, it is necessary to display in superposition streamline segments and an image of the target (heart for example). For such purpose, data obtained from the data buses 43, 43′ is applicable. This data includes image information of the target. Mixing this data with data stored in the image memory can be achieved using well-known processes.
- Embodiments of the present invention provide methods and devices enabling real time display of a stream line of an inhomogeneous flowing medium, for example of blood flowing in the heart.
- the object containing the flow of an inhomogeneous medium
- the object is scanned several times using ultrasonic beam pulses.
- an image of speckles formed by the flow is formed.
- Such a process is repeated several times, to obtain the motion of the speckles.
- the segments of the stream line are obtained.
- several methods of scanning are disclosed to take the difference between the images.
- An embodiment of the present invention provides a method to display in real time a stream line of an inhomogeneous flowing medium by scanning an object with ultrasonic wave beam pulses and processing the echoes thereof reflected from the object, comprising successive processes of:-
- An embodiment of the present invention provides a device to display in real time a stream line of an inhomogeneous flowing medium by scanning an object with ultrasonic wave beam pulses and processing the echoes thereof reflected from the object, comprising: a transducer for converting electrical energy to sound energy or vise versa for sending out and receiving ultrasonic wave; a transmitting circuit for exciting the transducer and make it generate a pulse of ultrasonic wave beam in a direction to scan the object so as to each point of the object is scanned plural times with a predetermined time interval; a receiver which receives a signal from the transducer which converts the echo of ultrasonic wave from an object into an electrical signal; an echo signal generator for processing the electrical signal of said receiver to provide an echo signal preferable for the image processing and converting it to a digital signal; a plurality of sub-frame memory means for storing the echo signal; a stream line processor (SLP) for processing the data stored in said sub-frame memory means to obtain the data of segments of stream lines; an image memory means
Abstract
Description
- This invention relates to the display of stream lines of inhomogeneous flowing mediums.
- In the art of medical electronics, it has been proposed to use an ultrasonic wave tomograph to display condition or motion of human organs on a cathode ray tube (CRT). Recently, it has been proposed to use a Doppler tomograph to obtain a display of blood motion, showing a "map" of blood flow on a two dimensional tomogram, using a colour display. For example, a bloodstream approaching an ultrasonic pulse transmitting and receiving transducer is coloured red and a stream going away from the transducer is coloured blue. The colour tone is varied in accordance with the speed of the bloodstream. An indication of the speed of the bloodstream is obtained from a frequency shift, phase shift or a distortion of pulse form present in an echo pulse and caused by the Doppler effect. A process whereby an indication of speed of a moving body is obtained from such data is called a Doppler process, and hence a tomograph using such a process is called a Doppler tomograph.
- The following U.S. patents relate to Doppler tomography intended for displaying blood:-
4,182,173 by Papadofrangakis et al. Jan. 8, 1980;
4,476 874 by Taenzer et al. Oct. 16, 1984;
4,509,525 by Seo. Apr. 9, 1985. - In Doppler tomography the measured speed of a blood flow is the relative speed of the bloodstream concerned in the scanning direction of the ultrasonic beam used. Therefore, measured speed varies when the scanning direction is varied, and as a limit measured blood speed is zero when the bloodstream is scanned orthogonally. If the scanning direction is further rotated, the measured blood speed is reversed.
- An attempt to overcome these problems has been proposed by K. Machii et al, in proceedings of WFUMB 1985, page 382, as "Clinical Usefulness of Power Mode Two Dimensional Doppler Colour Flow Mapping". In accordance with this proposal a speed component of blood included in a Doppler tomogram taken by power echo of an ultrasonic beam is detected. The application of this proposal is limited to blood speeds of less than 0.1 m/s. These are very slow speeds.
- Moreover, the previously proposed ultrasonic tomograph cannot show blood stream-lines. Essentially, a blood stream-line is parallel to the relevant blood vessel. Therefore, the need to show blood stream-lines has not in general been great. However, it is important to accumulate information concerning blood flow in the heart. The heart is a chamber rather than a tube so the flow of blood in a ventricle cannot be anticipated from its appearance. Accordingly it is important to display real speed and direction of a stream line of blood flow in a tomogram. Previously, however, so far as the inventors are aware, no means have been provided which can show stream lines of blood flow in the human heart.
- An embodiment of the present invention can provide a method of displaying a stream line of an inhomogenous flowing medium.
- An embodiment of the present invention can provide a device for showing a stream line of an inhomogenous flowing medium.
- An embodiment of the present invention can provide a tomograph which can show a stream line of blood flow in the human heart.
- Embodiments of the present invention can provide for real-time display of a blood flow stream line.
- An embodiment of the present invention observes, in effect, motion of speckles which appear in a tomogram of an inhomogeneous flow such as a bloodstream. For example, two tomograms, taken at timings separated by a very short time interval, during which interval correlation between speckles is retained, are used. From an image constructed from difference between the two tomograms, direction of motion and speed of the speckles are obtained. By a proper graphic process, segments of stream lines are shown in the tomogram.
- Taking two tomograms at timings separated by a very short time interval means that there may be insufficient time available to scan the entire extent of a desired scanning field. In this case, the scanning field, in an embodiment of the invention, is divided into m sub-fields, and in respect of each sub-field processing as mentioned above is performed. When processing in respect of a first sub-field is completed, the next sub-field is processed, and in such a manner the entire scanning field is composed.
- According to the speed of flow to be measured and the required accuracy of measurement, several methods of field separation and scanning are provided in embodiments of the present invention.
- Reference is made, by way of example, to the accompanying drawings, in which:-
- Fig. 1 schematically illustrates imaging of speckles, wherein
- Fig. 1(a) schematically illustrates an example of speckle motion, indicated by the superposition of two tomograms taken at times separated by a short time interval:
- Fig. 1(b) schematically illustrates an image of speckles obtained from a difference between the two tomograms used in Fig. 1(a);
- Fig. 1(c) schematically illustrates an image obtained from that Fig. 1(b), using absolute value processing;
- Fig. 1(d) is an image corresponding to that of Fig. 1(b), but for a case in which three tomograms, taken successively at times separated by short time intervals, are employed;
- Fig. 1(e) is an image corresponding to that of Fig. 1(c) but obtained by processing from the image of Fig. 1(d); and
- Fig. 1(f) is an image obtained by a thinning process applied to the image of Fig. 1(e), showing segments of stream lines;
- Fig. 2 illustrates a scanning method employed in a first embodiment of the present invention, wherein
- Fig. 2(a) illustrates division of a scanning field, and
- Fig. 2(b) is a graphical illustration of time variation of scan angle;
- Fig. 3 is a graphical illustration of time variation of scan angles in a scanning method employed in a second embodiment of the present invention which is applicable to a more precise measurement;
- Fig. 4 illustrates a scanning method of a third embodiment of the present invention, which can reduce noise caused by motion of a target or which is applicable for measuring a very fast flow; in Fig. 4 small black dots indicate ultrasonic pulse shots at respective scan angles;
- Fig. 5 is a schematic block diagram illustrating circuit constitution of an ultrasonic tomograph in accordance with an embodiment of the present invention, and
- Fig. 6 is a schematic block diagram illustrating a stream line processor and sub-frame memories of the tomograph of Fig. 5, illustrating their operations in the circuit of Fig. 5.
- First, a tomogram image derived from signals originating from ultrasonic pulses reflected from an inhomogeneous flowing medium, such as blood, will be discussed.
- Blood is composed of a mixture of red blood corpuscles, hemoleukocytes and blood platelets immersed in blood serum. Mean density of blood is almost uniform in the heart, for example. However, the microscopic spatial arrangement of blood components, red blood corpuscles for example, is random. A reflected ultrasonic wave is composed of waves reflected or scattered from each of those various red blood corpuscles respectively. Since these reflected waves interfere with each other, an image obtained from reflected waves exhibits speckles consisting of randomly arranged white (for example) portions (indicating strong reflections) and dark (for example) portions (indicating weak reflections). Usually, such a white portion is called a "speckle".
- Reflections of ultrasonic waves from blood are extremely weak as compared with those from muscles, the heart wall or heart membranes. So, reflections from blood cannot be observed in ordinary B mode image display, in which reflected wave intensity is represented by image brightness on a CRT. However, as will be described later, if two tomograms are taken in sequence, and an image corresponding to differences between these two tomograms is extracted, the strong image of muscles and heart membranes, etc., which are not moving, disappear. Only signals from portions that have moved during the interval between the tomograms are left on the display. Such a "difference" image can provide an image of blood stream flow, and hence speckles appear.
- The size of a speckle in the observation of blood flow in this way varies depending upon aperture of the ultrasonic transducer, focusing of the ultrasonic beam employed, depth of the reflecting body (blood) (distance from transducer), frequency of the ultrasonic waves employed, and bandwidth of the ultrasonic receiver, and so on. In the following analysis, the shape of a speckle is approximated to a circle having a diameter of 5 mm, and the depth of measurement is assumed to be 10 cm.
- Next, the formation of segments of stream lines will be described.
- Fig. 1(a) is an image of speckles. In the Figure, two images of flowing speckles measured or taken sequentially, with a short time interval between them, are superposed. The broken lines indicate speckles observed in the first measurement, and the solid lines indicate the same speckles observed in the second measurement. It is necessary that the time interval ΔT between the two measurements be small, so that the image of respective speckles obtained in the two measurements are superposed on (at least partially overlap) one another to retain spatial correlation. If ΔT is too large, the first (former) images of the speckles separate for the second (latter) images, and since the shape of a speckle varies rapidly, correlation between the speckles is lost, and it is difficult to distinguish which speckle has moved to where. ΔT should be varied depending on the speed of motion of the speckles to be measured.
- When the images of Fig. 1(a) are shown with brightness modulation, that is, as monochromatic images, and when an image showing differences of brightness between the first and second images is composed, it is schematically illustrated in Fig. 1(b). In the Figure, the dotted portions correspond to regions of small brightness difference (between the first and second images) indicating parts where speckles overlap; the white portions indicate regions of brightness of difference of a positive value (e.g. first image brighter than second in these regions), and the hatched portions indicate regions of brightness of difference of a negative value (e.g. first image darker than second). If the images are colour-modulated and positive difference value portions (white portions) coloured red and negative difference value portions (hatched portions) are coloured green, the central portions (dotted portions) become a mixture of red and green, so it is possible to determine that the speckles have moved in a direction from green to red. The distance between the red and green portions corresponds to the speed of the speckles. Thus it is possible to image the direction and speed of a bloodstream by interpretation of the speckles.
- As has been mentioned above, if ΔT is too large, correlation between first and second measurements is lost, and it is impossible to judge the direction of motion of the speckles. On the other hand, if ΔT is too small, the variation or displacement of speckles is too small to enable movement to be indicated.
- If only absolute brightness values are used to indicate differences between the first and second images of Fig. 1(a) the resultant image on the CRT becomes as schematically indicated in Fig. 1(c). At the two ends of the speckles, the brightness is high, and at the centre portion, the brightness is small. This picture resembles a photograph of moving particles taken with a properly long exposure. The dislocation or displacement of the images indicates the direction of motion, and the length of the dislocation or displacement indicates the speed of motion.
- It is possible to repeat the above process several times. An example of this is schematically illustrated in Figs. 1(d) and (e). The Figures show images obtained with the processes of Fig. 1(b) and Fig. 1(c) carried out twice in each case. Namely the repetition number q is 2. In this example, three tomograms have been taken. Using the first and second, and second and third tomograms, the above-mentioned processes are performed twice, and the obtained images superposed on each other. Fig. 1(d) corresponds to Fig. 1(b), the white portions may be represented on a colour display as red, the hatched portions as green, and the dotted portions become a yellowish mixture of red and green. Fig. 1(e) corresponds to Fig. 1(c). Fig. 1(d) and (e) have advantage that the images provided have greater resemblance to a stream line.
- Generally, the images of speckles are brightest at their centres, and become darker towards their peripheries. Therefore, the formed segments of stream lines indicated in Fig. 1(d) and (e) are brighter at their centre portions, and darker on both sides of the images. Therefore, if brightness is digitized using an appropriate threshold value (namely if the portions brighter than the threshold value are emphasized to maximum brightness (100% bright), and portions of brightness less than the threshold value are cut down to zero brightness) the images of Fig. 1(e) are thinned, as illustrated in Fig. 1(f). Compared to the broad features of Figs. 1(d) and (e), the images of Fig. 1(f) resemble more nearly segments of stream lines.
- As has been mentioned above, it is necessary to retain the spatial correlation of speckles. When the speckle images of two tomograms are superposed as shown in Fig. 1(a), if a speckle observed in the first measurement (broken lines) contacts another speckle image, it will cause a misjudgment of the stream line or speed of flow. In practice, diameter of a speckle is almost equal to the spacing between speckles. So the displacement of a speckle between successive measurements must be less than the diameter of the speckle. This limits the maximum length of the segment of a stream line to be displayed on a tomogram. Usually speckle diameter is almost equal to the spacing between speckles. So the maximum length of a stream line segment is twice the speckle diameter. For example, if speckle diameter is 5 mm, the length of a stream line segment which can be shown on the tomogram is less than 10 mm.
- The length of stream line segments can be varied by varying the diameter of the speckles. The diameter of the speckles may be varied by varying the aperture of the transducer, focusing of the beam and wave length of the ultrasonic wave, etc. However, most effective for obtaining a long stream line is the introduction of some kind of echo enhancing particle, such as bubbles, into the blood stream. Compared to measurement using speckles, such an introduced particle (bubble for example) does not change its shape during motion, and the size of and spacing between particles may be controlled at will. The movement of a particle (e.g. bubble) may be traced, without losing its spatial correlation, for a relatively long time. So, with such particles, the repetition number q of the measurement may be increased to provide a long stream line as compared with that shown in Fig. 1(f). The effect is similar to that which would be achieved if the motion of a particle were traced by a motion picture, and then the frames of the motion picture were superposed on each other.
- The conditions that ΔT, the measurement time interval, should satisfy will be considered. Let the expected maximum speed of the bloodstream be V mm/ms, and let speckle size correspond to a diameter D mm. In order to form an image of a stream line, it is necessary for there to be at least an overlapped portion between the images of the same speckle when first and second tomograms are superposed to each other. Therefore, it is necessary that
V·ΔT < D. (1) - If speckle size is assumed to be equal to the spacing between speckles, inequality (1) becomes also the condition that one speckle does not overlap other speckles. This also determines the maximum length of stream line segments.
- If measurement is repeated q times (if q+1 tomograms are used) to obtain a more precise indication of a stream line segment, the condition becomes
V·ΔT·q < D. (2) - On the other hand, if artificial echo enhancing particles such as bubbles are introduced, as has been described above, it is possible to control the mean spacing between the bubbles to be large compared to the size of the bubbles, and in this case conditions (1) and (2) become unnecessary.
- Embodiments of the present invention will be described below as they relate to the provision of tomographs for displaying bloodstream in the human heart. For such purpose, it is necessary to provide a measuring depth of at least 150 mm. Since sound velocity in the human body is about 1.5 mm/µs, it takes 0.2 ms for an ultrasonic wave to travel to and return from a depth of 150 mm. It is desirable to provide a frame rate of 15-30 frames/s in order to display the bloodstream of a beating heart. It is said that the speed of an abnormal bloodstream which flows backward from a gap of an incomplete cardiac valve is sometimes as high as 2.5 m/s. However, the embodiment of the present invention described below is designed to display bloodstream speeds of up to 1 m/s. It is desirable to scan the object (the heart) with a fan shaped scanning field having a scan angle of 45-90°, and to display the scanning field as a frame on a CRT. It is desirable to provide 64-128 scanning lines per 90° for ordinary B mode display.
- Fig. 2 illustrates an ultrasonic beam scanning method employed in a first embodiment of the present invention. As illustrated in Fig. 2(a), a scanning field of 90° is divided into four sub-fields A, B, C and D, each having a scan angle of 22.5°. Fig. 2(b) illustrates the relationship between scan angle and scan time, over the time required to scan an entire frame of the scanning field. The scanning line density is 128 lines/90°. So, each sub-field is scanned by 32 scanning lines respectively. As indicated above, it takes 0.2 ms to obtain each scanning line, and it takes 6.4 (0.2 × 32) ms to scan over one sub-field. Each sub-field is scanned twice and, therefore, measurement in relation to one sub-field takes 12.8 ms. When a measurement in relation to sub-field A is finished, sub-field B is scanned, in succession. It thus requires 51.2 ms to complete measurement in respect of the entire scanning field of 90°. So, the frame rate is 20 frames/s, and the time interval between scannings ΔT is 6.4 ms. These measuring constants almost satisfy inequality (1).
- Data obtained from ultrasonic echo signals is stored successively in a memory, and after measurement in respect of one sub-field is completed, image processing is effected to obtain segments of stream lines as described above. The time needed for such processing is very short compared to the time needed for measurement in respect of one sub-field. So, such processing in relation to one sub-field is completed while measurement in respect of a next sub-field is going on, and the results are displayed on a CRT as a sub-frame. Images of sub-fields obtained in such manner are displayed successively on the CRT to construct an entire frame of the scanning field.
- A scanning method employed in a second embodiment of the present invention is illustrated in Fig. 3. This embodiment can provide for a more precise measurement of stream lines.
- The entire scanning field of 45° is divided into 8 sub-fields, and measurements are repeated three times for each of the sub-fields; therefore, the repetition number q is 3. The scanning line density is 128 lines/90°. So, the number of scanning lines p which covers one sub-field is 8, and the time interval between measurements, ΔT, is 1.6 ms (0.2 × 8). So more precise stream line determination can be available.
- Fig. 3 indicates time variation of the scan angle of the supersonic (ultrasonic) beam. In the Figure, the ordinate corresponds to scan angle and the abscissa to time in ms. Circled numerals along the abscissa indicate the relevant sub-fields being scanned at the indicated times and scan angles. As shown in the Figure, each sub-field is scanned four times. Small horizontal bars beneath the circled numerals indicate pairs of scannings, from which scan data is processed to obtain differences. For each sub-field, the first processing is effected using the difference between first and second scanning data indicated by the first bar. The second processing is effected using the second and the third scanning data indicated by the second bar, and the third processing is effected using the third and fourth scanning data indicated by the third bar. For each processing ΔT is 1.6 ms. Images of moving speckles are obtained respectively from these three processings and stream lines are obtained by superposing these images. On the CRT, sub-frames are composed in each 6.4 ms, and the total time to complete a frame is 51.2 ms, so the frame rate becomes approximately 20 frames/s.
- In the second embodiment, as compared with the first embodiment, ΔT, the time difference or interval between two images to be processed is reduced to one-fourth. Therefore, spatial wavelength of noise induced by slow motion of organs arising from breathing or slippage of the transducer during the measurements is reduced to one-fourth. So, it becomes easy to apply a filter to remove such noise, and hence a better image is obtained.
- A third embodiment of the present invention employs a scanning method intended to suppress such noise to as low a level as possible. The time interval to take a difference is reduced to 0.2 ms, namely, the difference is taken between successive shots of the supersonic (ultrasonic) beam. The scanning field is 45°, it is divided into 8 sub-fields (m=8), and each sub-field is scanned by 8 scanning lines respectively (p=8). Each scanning line is scanned twice (in succession) repeatedly, and echo information is obtained from the difference between these two shots. Therefore noise caused by the motion of the target is reduced to minimum, and only the fast movement of blood flow is left. Such double scanning is repeated three times (q=3) in relation to each sub-field.
- Fig. 4 illustrates the time variation of beam scan angle for the method employed in the third embodiment. Abscissa is time in ms, and ordinate is scan angle. Black dots in Fig. 4 indicate ultrasonic beam shots; therefore each spot corresponds to one line scanning, and from each two spots aligned horizontally in Fig. 4 (i.e. from the scannings of the same line), information relating to one scanning line is obtained. Though Fig. 4 illustrates only a part of a total scanning cycle, it will be clear that the scan angle is increased stepwise after every second shot. Each sub-field is scanned with eight double scans (it takes 3.2 ms), and such scanning is repeated three times for each sub-field. When the process for one sub-field is completed (it takes 9.6 ms), the image is displayed on a CRT, and then the next sub-field is processed successively. The time required for measurement in respect of one frame is 76.8 ms, so the frame rate becomes 13 frames/sec.
- In practice, there can often occur a requirement for images such that the total scan angle is 90°, the frame rate is 30 frames/sec., and the scanning line density is 128 lines/90°. The above-described embodiments of the present invention do not satisfy these requirements. However, in the observation of the heart, for example, phenomena are repeated in synchrony with the beating of the heart. Accordingly, it is possible to apply stroboscopic technology. For example, it is possible to provide an image of blood flow at a predetermined time phase with respect to the R wave of an electro-cardiogram, using measurements obtained in respect of several beats of the heart.
- For example, using the scanning method of the above-described second or third embodiment of the present invention, if the total scan angle is 22.5°, m=4, p=8 and q=3, the scanning satisfies the above requirements in terms of scanning line density and frame rate. Therefore, by adding four images each having a 22.5° frame angle but having directions differing from one another but 22.5°, the images taken from or in respect of four successive cardiac pulses, it is possible to synthesize a 90° frame image. Such stroboscopic synthesizing is known in the art so further description is omitted.
- In the description of embodiments of the present invention given above, the original signals from which images are formed are assumed to be simply echo signals. However, in the art of ultrasonic imaging, various types of input signal are known. For example, a time gain controlled signal, a logarithmic signal, an orthogonal detected signal, a power signal and so on. Embodiments of the present invention can employ such signals as input.
- It will be clear that the above-described embodiments of the present invention employ scanning methods to accumulate information on the reflection of ultrasonic waves. Various modifications are possible; for example, it is possible to scan several times on the same scanning line to reduce noise and, after reduction of noise, use the (resultant) signal as the scanning line signal. The above-described embodiments are, therefore, to be considered in all respects as illustrative and not restrictive.
- The configuration of a tomograph in accordance with an embodiment of the present invention is schematically illustrated in Fig. 5. 1 is a transducer which emits and receives an ultrasonic beam, 2 is a circuit for handling transmission or reception of ultrasonic waves (abbreviated to TR).
Transducer 1 andcircuit 2 are similar to such items used for an ordinary ultrasonic imaging device having a B mode display. 3 is an echo signal generator (ESG) which processes received echo signals and generates a signal having various kinds of characteristics preferable to obtain a desired image, for example, a logarithmic wave, a gain controlled echo signal, a power signal and so on. As has been indicated above, the use of any such processed signal is possible. Such signals are all well-known in the art, so further description is omitted. - The signal processed in the echo signal generator is mainly an analog signal, so the output signal of the echo signal generator is converted to a digital signal by a built-in analog to digital converter (A/D converter), and supplied to a stream line processor (SLP) 4. The stream line processor stores echo signals in a plurality of
sub-frame memories 5, and reads out the memories to process the stored data as has been described above, to provide an image signal. Image signals are stored in animage memory 6. A display circuit (DISP) 7 reads out the image memory, and displays images on aCRT 8. Though it is not shown in the Figure, all of these processes and timing are controlled by a central processor unit (CPU). - Operation in the stream line processor (SLP) 4 will be described briefly with reference to Fig. 6. The echo signal processed in the
echo signal generator 3 is digitized and supplied to theSLP 4. The SLP comprises a digital scan converter (DSC) 41, which provides the input signal with an address for storage insub-frame memory 5. Thesub-frame memory 5 is composed of plurality of memory means which may be called, respectively, first, second, and third sub-frame memories and so on (51, 52, 53 ...), corresponding to the number of sub-frames m into which the scanning field is divided. TheSLP 4 also comprises switches S1, S2, S3 and so on, respectively corresponding to the sub-frame memories. They are used to switch the flow of address and echo signals to the sub-frame memories or to a digital signal processor (DSP) 42. The I/O (input and output) ports of these circuitries and data bus lines connecting them are identified by notations A and D respectively. The directions of streams of data in the data buses are indicated by arrows. - For example, when a beam is scanning a first sub-field, the switch S1 is switched to the DSC side, and the other switches are switched to the DSP side, as shown in Fig. 6, so that echo data is stored in the
first sub-frame memory 51. In the sub-field memories, for example in the firstsub-field memory 51, the data is stored inmemory planes sub-frame memory 51, the other switches S2 to S4 are switched to the DSP side, so the DSP can carry out processing to obtain stream lines, using data stored in the second and third sub-frame memories and so on. The data processed by the DSP is sent to theimage memory 6 and stored there. - When scanning in respect of the first sub-frame is completed, the switches S1 and S2 are switched respectively to the DSP and DSC sides. Echo data is then stored in the second
sub-field memory 52, and data stored in the firstsub-field memory 51 is processed byDSP 42. In such manner, the entire field is scanned and processed successively. The digital signal processor (DSP) 42 may be of any kind which can perform the required processing, as has been mentioned before. - Processes for display of an image such as is stored in the
image memory 6 on aCRT 8 using adisplay circuit DISP 7 are known in the art, so description will be omitted. Usually, however, it is necessary to display in superposition streamline segments and an image of the target (heart for example). For such purpose, data obtained from thedata buses - As has been described, it is possible with an embodiment of the invention to provide for display in real time of segments of a stream line of a bloodstream in the heart. Although the description given above has been given with respect to blood flow, it will be clear that the invention may be applied to any other inhomogeneous flow.
- Embodiments of the present invention provide methods and devices enabling real time display of a stream line of an inhomogeneous flowing medium, for example of blood flowing in the heart. The object (containing the flow of an inhomogeneous medium) is scanned several times using ultrasonic beam pulses. By taking differences between echoes appearing with a predetermined time interval at each point of the object, an image of speckles formed by the flow is formed. Such a process is repeated several times, to obtain the motion of the speckles. By taking a difference between the images of spatially correlated speckles taken with the time interval, the segments of the stream line are obtained. There are various ways of taking a difference between successive frames, successive lines, etc. According to such methods, several methods of scanning are disclosed to take the difference between the images.
- An embodiment of the present invention provides a method to display in real time a stream line of an inhomogeneous flowing medium by scanning an object with ultrasonic wave beam pulses and processing the echoes thereof reflected from the object, comprising successive processes of:-
- A) sending out pulses of the ultrasonic wave beam to scan the object so as to each point of the object is scanned plural times with a predetermined time interval;
- B) forming images of speckles formed by the flow of said inhomogeneous flowing medium by taking a difference between two echoes appearing with said time interval at each point of a scanning line; and
- C) obtaining locus of movement of said speckles having spatial correlation between each other during said time interval by taking a difference of the images of the speckles obtained by repetition of said process B.
- An embodiment of the present invention provides a device to display in real time a stream line of an inhomogeneous flowing medium by scanning an object with ultrasonic wave beam pulses and processing the echoes thereof reflected from the object, comprising:
a transducer for converting electrical energy to sound energy or vise versa for sending out and receiving ultrasonic wave;
a transmitting circuit for exciting the transducer and make it generate a pulse of ultrasonic wave beam in a direction to scan the object so as to each point of the object is scanned plural times with a predetermined time interval;
a receiver which receives a signal from the transducer which converts the echo of ultrasonic wave from an object into an electrical signal;
an echo signal generator for processing the electrical signal of said receiver to provide an echo signal preferable for the image processing and converting it to a digital signal;
a plurality of sub-frame memory means for storing the echo signal;
a stream line processor (SLP) for processing the data stored in said sub-frame memory means to obtain the data of segments of stream lines;
an image memory means for storing the data of segments of stream lines; and
a display circuit for taking out the data stored in said image memory means and generating an image signal of the segments of stream line to display on a CRT (cathode ray tube).
Claims (15)
ultrasonic transducer means operable to send out and to receive the said ultrasonic signals and their echoes;
transmission circuitry operable to excite the transducer means to cause the ultrasonic transducer means to send out the said ultrasonic signals so that points in the object are scanned a plurality of times;
receiving circuitry operable to receive electrical signals provided by the ultrasonic transducer means in response to echoes of the said ultrasonic signals from the object;
an echo signal generator operable to process electrical signals from the receiving circuitry to provide echo signals in a digital form suitable for image processing;
a plurality of sub-frame memory means operable to store echo signals;
a stream line processor (SLP) operable to process data stored in the sub-frame memory means to obtain data representing segments of stream lines;
an image memory means for storing data relating to segments of stream lines; and
a display circuit operable on the basis of data stored in the image memory means and to generate image signals for representing segments of the stream line on a CRT (cathode ray tube) display.
a digital scan converter which provides an input echo signal with an address signal for use in storage in the sub-frame memory means;
a digital signal processor which takes differences between echo signals relating to the same point in the object to obtain data representing images of speckles in the flow and takes differences representing speckle movement in the flow; and
a plurality of switches for controlling flow of data and address signals between the digital scan converter, the digital signal processor and the sub-frame memory means.
Applications Claiming Priority (2)
| Application Number | Priority Date | Filing Date | Title |
|---|---|---|---|
| JP60255401A JPS62114539A (en) | 1985-11-14 | 1985-11-14 | Flow display apparatus utilizing ultrasonic wave |
| JP255401/85 | 1985-11-14 |
Publications (3)
| Publication Number | Publication Date |
|---|---|
| EP0226044A2 true EP0226044A2 (en) | 1987-06-24 |
| EP0226044A3 EP0226044A3 (en) | 1989-06-07 |
| EP0226044B1 EP0226044B1 (en) | 1992-08-12 |
Family
ID=17278249
Family Applications (1)
| Application Number | Title | Priority Date | Filing Date |
|---|---|---|---|
| EP86115755A Expired EP0226044B1 (en) | 1985-11-14 | 1986-11-13 | Display of a stream line of an inhomogeneous flowing medium |
Country Status (4)
| Country | Link |
|---|---|
| US (1) | US4790321A (en) |
| EP (1) | EP0226044B1 (en) |
| JP (1) | JPS62114539A (en) |
| DE (1) | DE3686401T2 (en) |
Cited By (5)
| Publication number | Priority date | Publication date | Assignee | Title |
|---|---|---|---|---|
| EP0379593A1 (en) * | 1988-06-30 | 1990-08-01 | Shigeo Ohtsuki | Doppler system flow velocity distribution measuring apparatus |
| WO1991015999A1 (en) * | 1990-04-26 | 1991-10-31 | The Victoria University Of Manchester | Ultrasound imaging technique using non linear scattering from bubbles |
| EP0713680A3 (en) * | 1994-11-23 | 1998-08-12 | Advanced Technology Laboratories, Inc. | Ultrasonic detection of contrasting agents |
| US7004905B2 (en) | 1996-11-08 | 2006-02-28 | Research Corporation Technologies, Inc. | Finite amplitude distortion-based inhomogeneous pulse echo ultrasonic imaging |
| US9259205B2 (en) | 2010-11-30 | 2016-02-16 | Hitachi Medical Corporation | Ultrasound image capture device, ultrasound image capture method, ultrasound image capture program |
Families Citing this family (30)
| Publication number | Priority date | Publication date | Assignee | Title |
|---|---|---|---|---|
| JPS6417634A (en) * | 1987-07-14 | 1989-01-20 | Yokogawa Medical Syst | Pulse doppler mti apparatus |
| DE3854303T2 (en) * | 1987-08-31 | 1995-12-21 | Yokogawa Medical Syst | ULTRASONIC DIAGNOSTIC DEVICE. |
| US4944189A (en) * | 1987-11-30 | 1990-07-31 | Aloka Co., Ltd. | Ultrasonic speckle velocity measurement method and apparatus |
| JP2754493B2 (en) * | 1989-05-20 | 1998-05-20 | 富士通株式会社 | Blood flow visualization method |
| US5031467A (en) * | 1989-12-11 | 1991-07-16 | Shell Oil Company | Pulse echo technique for detecting fluid flow |
| US5184622A (en) * | 1990-01-24 | 1993-02-09 | Kabushiki Kaisha Toshiba | Ultrasonic diagnosing apparatus |
| JP3000233B2 (en) * | 1990-11-19 | 2000-01-17 | 株式会社日立メデイコ | Ultrasound diagnostic equipment |
| US5109857A (en) * | 1991-03-04 | 1992-05-05 | Duke University | Ultrasound time domain velocity detection method and apparatus |
| US5226419A (en) * | 1992-03-13 | 1993-07-13 | Core Medical Technologies, Inc. | Method and device for cutaneous marking of the venous anatomy |
| US5544657A (en) * | 1994-09-09 | 1996-08-13 | Siemens Medical Systems, Inc. | Ultrasound blood flow monitor of the non-doppler type |
| JP3759184B2 (en) * | 1994-12-21 | 2006-03-22 | ジーイー横河メディカルシステム株式会社 | Ultrasound blood flow display method and apparatus |
| JP3488541B2 (en) * | 1995-06-09 | 2004-01-19 | 株式会社東芝 | Ultrasound diagnostic equipment |
| JP4574790B2 (en) * | 1999-03-30 | 2010-11-04 | 東芝医用システムエンジニアリング株式会社 | Ultrasonic diagnostic apparatus and ultrasonic diagnostic method |
| US6618493B1 (en) * | 1999-11-26 | 2003-09-09 | Ge Medical Systems Global Technology Company, Llc | Method and apparatus for visualization of motion in ultrasound flow imaging using packet data acquisition |
| US6277075B1 (en) * | 1999-11-26 | 2001-08-21 | Ge Medical Systems Global Technology Company, Llc | Method and apparatus for visualization of motion in ultrasound flow imaging using continuous data acquisition |
| DE60129925T2 (en) * | 2000-11-15 | 2008-05-08 | Aloka Co. Ltd., Mitaka | UTRASCHALLDIAGNOSEGERÄT |
| US20070225605A1 (en) * | 2001-01-25 | 2007-09-27 | Swanbom Rebecca L | Method and Device for Marking Skin During an Ultrasound Examination |
| US7223238B2 (en) | 2001-01-25 | 2007-05-29 | Swanbom Rebecca L | Method and device for marking skin during an ultrasound examination |
| US6805669B2 (en) | 2001-01-25 | 2004-10-19 | Rebecca L. Swanbom | Method and device for marking skin during an ultrasound examination |
| JP2003010183A (en) * | 2001-07-02 | 2003-01-14 | Matsushita Electric Ind Co Ltd | Ultrasonograph |
| US6946410B2 (en) * | 2002-04-05 | 2005-09-20 | E. I. Du Pont De Nemours And Company | Method for providing nano-structures of uniform length |
| JP4233808B2 (en) * | 2002-06-04 | 2009-03-04 | 株式会社日立メディコ | Ultrasonic diagnostic equipment |
| JP2007525299A (en) | 2004-03-01 | 2007-09-06 | サニーブルック アンド ウィメンズ カレッジ ヘルス サイエンシーズ センター | System and method for ECG-triggered retrospective color flow ultrasound imaging |
| JP4660126B2 (en) * | 2004-06-18 | 2011-03-30 | 株式会社東芝 | Ultrasound blood flow imaging device |
| US7717849B2 (en) * | 2004-07-06 | 2010-05-18 | Gerneral Electric Company | Method and apparatus for controlling ultrasound system display |
| US8206301B2 (en) * | 2005-02-01 | 2012-06-26 | Fujifilm Corporation | Ultrasonic imaging apparatus and ultrasonic image processing apparatus, method and program |
| JP2008167985A (en) * | 2007-01-12 | 2008-07-24 | Fujifilm Corp | Ultrasonic diagnostic equipment |
| JP4787358B2 (en) * | 2007-04-27 | 2011-10-05 | 株式会社日立メディコ | Ultrasonic diagnostic equipment |
| US9028413B2 (en) * | 2010-03-08 | 2015-05-12 | Siemens Medical Solutions Usa, Inc. | Prediction-based flow estimation for ultrasound diagnostic imaging |
| WO2016203288A1 (en) * | 2015-06-15 | 2016-12-22 | B-K Medical Aps | Display of imaging data in a moving viewport |
Citations (3)
| Publication number | Priority date | Publication date | Assignee | Title |
|---|---|---|---|---|
| EP0008517A1 (en) * | 1978-08-23 | 1980-03-05 | General Electric Company | Duplex ultrasonic imaging system with repetitive excitation of common transducer in Doppler modality |
| EP0135170A2 (en) * | 1983-08-25 | 1985-03-27 | Kabushiki Kaisha Toshiba | Apparatus for observing blood flow patterns |
| EP0177942A2 (en) * | 1984-10-08 | 1986-04-16 | Fujitsu Limited | Correlation detection type ultrasound blood flowmeter |
Family Cites Families (13)
| Publication number | Priority date | Publication date | Assignee | Title |
|---|---|---|---|---|
| US4159462A (en) * | 1977-08-18 | 1979-06-26 | General Electric Company | Ultrasonic multi-sector scanner |
| US4271842A (en) * | 1978-03-03 | 1981-06-09 | Smith Kline Instruments, Inc. | Apparatus and method for providing multiple ultrasonic sector image displays |
| US4448200A (en) * | 1978-03-27 | 1984-05-15 | University Of Southern California | System and method for dynamic background subtraction |
| JPS608822B2 (en) * | 1978-08-15 | 1985-03-06 | 株式会社東芝 | Ultrasound diagnostic equipment |
| JPS55125856A (en) * | 1979-03-22 | 1980-09-29 | Tokyo Shibaura Electric Co | Ultrasonic wave image display device |
| JPS56136533A (en) * | 1980-03-27 | 1981-10-24 | Aloka Co Ltd | Ultrasonic diagnosis apparatus |
| JPS5897347A (en) * | 1981-12-03 | 1983-06-09 | 株式会社東芝 | Ultrasonic diagnostic apparatus |
| US4476874A (en) * | 1982-06-01 | 1984-10-16 | Sri International | Ultrasonic imaging with volume flow measuring method and apparatus |
| JPS6099237A (en) * | 1983-11-04 | 1985-06-03 | 三菱電機株式会社 | Ultrasonic vibrator apparatus |
| US4612937A (en) * | 1983-11-10 | 1986-09-23 | Siemens Medical Laboratories, Inc. | Ultrasound diagnostic apparatus |
| JPS60122549A (en) * | 1983-12-08 | 1985-07-01 | 株式会社東芝 | Ultrasonic diagnostic apparatus |
| US4593314A (en) * | 1984-05-17 | 1986-06-03 | The Kemp-Carraway Heart Institute | Echocardiogram machine control |
| JPS61100237A (en) * | 1984-10-23 | 1986-05-19 | 株式会社東芝 | Ultrasonic diagnostic apparatus |
-
1985
- 1985-11-14 JP JP60255401A patent/JPS62114539A/en active Pending
-
1986
- 1986-11-13 DE DE8686115755T patent/DE3686401T2/en not_active Expired - Fee Related
- 1986-11-13 EP EP86115755A patent/EP0226044B1/en not_active Expired
- 1986-11-14 US US06/930,413 patent/US4790321A/en not_active Expired - Fee Related
Patent Citations (3)
| Publication number | Priority date | Publication date | Assignee | Title |
|---|---|---|---|---|
| EP0008517A1 (en) * | 1978-08-23 | 1980-03-05 | General Electric Company | Duplex ultrasonic imaging system with repetitive excitation of common transducer in Doppler modality |
| EP0135170A2 (en) * | 1983-08-25 | 1985-03-27 | Kabushiki Kaisha Toshiba | Apparatus for observing blood flow patterns |
| EP0177942A2 (en) * | 1984-10-08 | 1986-04-16 | Fujitsu Limited | Correlation detection type ultrasound blood flowmeter |
Non-Patent Citations (1)
| Title |
|---|
| PROCEEDINGS OF THE IEEE THIRD WORKING CONFERENCE ON CURRENT MEASUREMENT, Virginia, 22nd-24th January 1986, pages 78-81, IEEE, US; S.F. CLIFFORD et al.: "Space-time analysis of acoustic scintillations in ocean current sensing" * |
Cited By (9)
| Publication number | Priority date | Publication date | Assignee | Title |
|---|---|---|---|---|
| EP0379593A1 (en) * | 1988-06-30 | 1990-08-01 | Shigeo Ohtsuki | Doppler system flow velocity distribution measuring apparatus |
| EP0379593A4 (en) * | 1988-06-30 | 1991-01-16 | Shigeo Ohtsuki | Doppler system flow velocity distribution measuring apparatus |
| US5010528A (en) * | 1988-06-30 | 1991-04-23 | Shigeo Ohtsuki | Doppler flow velocity distribution measuring apparatus |
| WO1991015999A1 (en) * | 1990-04-26 | 1991-10-31 | The Victoria University Of Manchester | Ultrasound imaging technique using non linear scattering from bubbles |
| EP0713680A3 (en) * | 1994-11-23 | 1998-08-12 | Advanced Technology Laboratories, Inc. | Ultrasonic detection of contrasting agents |
| US7004905B2 (en) | 1996-11-08 | 2006-02-28 | Research Corporation Technologies, Inc. | Finite amplitude distortion-based inhomogeneous pulse echo ultrasonic imaging |
| US7513870B2 (en) | 1996-11-08 | 2009-04-07 | Research Corproation Technologies, Inc. | Finite amplitude distortion-based inhomogeneous pulse echo ultrasonic imaging |
| US7811233B2 (en) | 1996-11-08 | 2010-10-12 | Research Corporation Technologies, Inc. | Finite amplitude distortion-based inhomogeneous pulse echo ultrasonic imaging |
| US9259205B2 (en) | 2010-11-30 | 2016-02-16 | Hitachi Medical Corporation | Ultrasound image capture device, ultrasound image capture method, ultrasound image capture program |
Also Published As
| Publication number | Publication date |
|---|---|
| JPS62114539A (en) | 1987-05-26 |
| EP0226044B1 (en) | 1992-08-12 |
| EP0226044A3 (en) | 1989-06-07 |
| US4790321A (en) | 1988-12-13 |
| DE3686401T2 (en) | 1993-01-28 |
| DE3686401D1 (en) | 1992-09-17 |
Similar Documents
| Publication | Publication Date | Title |
|---|---|---|
| EP0226044B1 (en) | Display of a stream line of an inhomogeneous flowing medium | |
| US6406430B1 (en) | Ultrasound image display by combining enhanced flow imaging in B-mode and color flow mode | |
| EP1501419B1 (en) | Contrast-agent enhanced color-flow imaging | |
| US4993417A (en) | Method and system for controlling ultrasound scanning sequence | |
| US5993390A (en) | Segmented 3-D cardiac ultrasound imaging method and apparatus | |
| US4612937A (en) | Ultrasound diagnostic apparatus | |
| CN106102588B (en) | Ultrasound grayscale imaging system and method | |
| US5908391A (en) | Method and apparatus for enhancing resolution and sensitivity in color flow ultrasound imaging using multiple transmit focal zones | |
| EP0010304A1 (en) | Ultrasonic diagnostic apparatus | |
| CN102292028B (en) | Ultrasonic diagnostic device | |
| JPH02211136A (en) | Dual mode supersonic imaging device | |
| US6761691B2 (en) | Image forming method used in ultrasonic diagnosis, ultrasonic diagnostic apparatus, signal processing apparatus, and recording medium for recording signal processing program | |
| JP2005177494A (en) | Method and apparatus for flow parameter imaging | |
| KR20010061963A (en) | Method and apparatus for visualization of motion in ultrasound flow imaging using packet data acquisition | |
| JP2004202229A (en) | Method and apparatus for contrast agent time intensity curve analysis | |
| US6123672A (en) | Color flow imaging for enhancing segmentation and flow dynamics | |
| EP0367826B1 (en) | Pulse doppler mti apparatus | |
| JPH078492A (en) | Ultrasonic diagnostic device | |
| EP0163664A1 (en) | Ultrasound diagnostic apparatus | |
| CN108354629A (en) | Supersonic wave imaging method | |
| US6048313A (en) | Method and apparatus for fractal-based enhancement of ultrasound imaging | |
| JP2639391B2 (en) | Fluid map image forming device | |
| JP2719707B2 (en) | Image display method of color Doppler MTI device | |
| JP3101301B2 (en) | Ultrasound diagnostic equipment | |
| KR100255836B1 (en) | Apparatus for image processing |
Legal Events
| Date | Code | Title | Description |
|---|---|---|---|
| PUAI | Public reference made under article 153(3) epc to a published international application that has entered the european phase |
Free format text: ORIGINAL CODE: 0009012 |
|
| AK | Designated contracting states |
Kind code of ref document: A2 Designated state(s): DE FR GB SE |
|
| PUAL | Search report despatched |
Free format text: ORIGINAL CODE: 0009013 |
|
| RHK1 | Main classification (correction) |
Ipc: A61B 8/06 |
|
| AK | Designated contracting states |
Kind code of ref document: A3 Designated state(s): DE FR GB SE |
|
| 17P | Request for examination filed |
Effective date: 19890814 |
|
| 17Q | First examination report despatched |
Effective date: 19910417 |
|
| GRAA | (expected) grant |
Free format text: ORIGINAL CODE: 0009210 |
|
| AK | Designated contracting states |
Kind code of ref document: B1 Designated state(s): DE FR GB SE |
|
| PGFP | Annual fee paid to national office [announced via postgrant information from national office to epo] |
Ref country code: GB Payment date: 19920903 Year of fee payment: 7 |
|
| REF | Corresponds to: |
Ref document number: 3686401 Country of ref document: DE Date of ref document: 19920917 |
|
| PGFP | Annual fee paid to national office [announced via postgrant information from national office to epo] |
Ref country code: SE Payment date: 19921005 Year of fee payment: 7 |
|
| ET | Fr: translation filed | ||
| PGFP | Annual fee paid to national office [announced via postgrant information from national office to epo] |
Ref country code: FR Payment date: 19921127 Year of fee payment: 7 |
|
| PLBE | No opposition filed within time limit |
Free format text: ORIGINAL CODE: 0009261 |
|
| STAA | Information on the status of an ep patent application or granted ep patent |
Free format text: STATUS: NO OPPOSITION FILED WITHIN TIME LIMIT |
|
| 26N | No opposition filed | ||
| PG25 | Lapsed in a contracting state [announced via postgrant information from national office to epo] |
Ref country code: GB Effective date: 19931113 |
|
| PG25 | Lapsed in a contracting state [announced via postgrant information from national office to epo] |
Ref country code: SE Effective date: 19931114 |
|
| GBPC | Gb: european patent ceased through non-payment of renewal fee |
Effective date: 19931113 |
|
| PG25 | Lapsed in a contracting state [announced via postgrant information from national office to epo] |
Ref country code: FR Effective date: 19940729 |
|
| REG | Reference to a national code |
Ref country code: FR Ref legal event code: ST |
|
| PGFP | Annual fee paid to national office [announced via postgrant information from national office to epo] |
Ref country code: DE Payment date: 19941110 Year of fee payment: 9 |
|
| EUG | Se: european patent has lapsed |
Ref document number: 86115755.0 Effective date: 19940610 |
|
| PG25 | Lapsed in a contracting state [announced via postgrant information from national office to epo] |
Ref country code: DE Effective date: 19960801 |