EP0339582A2 - Fluorescence microscope system - Google Patents
Fluorescence microscope system Download PDFInfo
- Publication number
- EP0339582A2 EP0339582A2 EP89107487A EP89107487A EP0339582A2 EP 0339582 A2 EP0339582 A2 EP 0339582A2 EP 89107487 A EP89107487 A EP 89107487A EP 89107487 A EP89107487 A EP 89107487A EP 0339582 A2 EP0339582 A2 EP 0339582A2
- Authority
- EP
- European Patent Office
- Prior art keywords
- sample
- fluorescent
- image
- fluorescent light
- filter
- Prior art date
- Legal status (The legal status is an assumption and is not a legal conclusion. Google has not performed a legal analysis and makes no representation as to the accuracy of the status listed.)
- Granted
Links
- 239000000523 sample Substances 0.000 claims abstract description 128
- 230000005284 excitation Effects 0.000 claims abstract description 58
- 230000003287 optical effect Effects 0.000 claims abstract description 42
- 238000009826 distribution Methods 0.000 claims abstract description 17
- 238000002189 fluorescence spectrum Methods 0.000 claims abstract description 11
- 238000000695 excitation spectrum Methods 0.000 claims abstract description 10
- 238000012545 processing Methods 0.000 claims description 12
- 206010001497 Agitation Diseases 0.000 claims description 8
- 230000007246 mechanism Effects 0.000 claims description 8
- 238000001914 filtration Methods 0.000 claims description 5
- 238000011088 calibration curve Methods 0.000 claims description 4
- 239000007850 fluorescent dye Substances 0.000 claims description 3
- 230000007935 neutral effect Effects 0.000 claims description 3
- 210000004027 cell Anatomy 0.000 description 75
- BHPQYMZQTOCNFJ-UHFFFAOYSA-N Calcium cation Chemical compound [Ca+2] BHPQYMZQTOCNFJ-UHFFFAOYSA-N 0.000 description 60
- 229910001424 calcium ion Inorganic materials 0.000 description 60
- YFHXZQPUBCBNIP-UHFFFAOYSA-N fura-2 Chemical group CC1=CC=C(N(CC(O)=O)CC(O)=O)C(OCCOC=2C(=CC=3OC(=CC=3C=2)C=2OC(=CN=2)C(O)=O)N(CC(O)=O)CC(O)=O)=C1 YFHXZQPUBCBNIP-UHFFFAOYSA-N 0.000 description 35
- PNDZEEPOYCVIIY-UHFFFAOYSA-N indo-1 Chemical compound CC1=CC=C(N(CC(O)=O)CC(O)=O)C(OCCOC=2C(=CC=C(C=2)C=2N=C3[CH]C(=CC=C3C=2)C(O)=O)N(CC(O)=O)CC(O)=O)=C1 PNDZEEPOYCVIIY-UHFFFAOYSA-N 0.000 description 19
- OYPRJOBELJOOCE-UHFFFAOYSA-N Calcium Chemical compound [Ca] OYPRJOBELJOOCE-UHFFFAOYSA-N 0.000 description 17
- 229910052791 calcium Inorganic materials 0.000 description 17
- 239000011575 calcium Substances 0.000 description 17
- 238000000034 method Methods 0.000 description 13
- 239000012528 membrane Substances 0.000 description 12
- 239000013626 chemical specie Substances 0.000 description 10
- 238000010586 diagram Methods 0.000 description 10
- 238000001228 spectrum Methods 0.000 description 8
- 239000006096 absorbing agent Substances 0.000 description 6
- 230000008859 change Effects 0.000 description 6
- -1 hydrogen ions Chemical class 0.000 description 6
- QSHDDOUJBYECFT-UHFFFAOYSA-N mercury Chemical compound [Hg] QSHDDOUJBYECFT-UHFFFAOYSA-N 0.000 description 6
- 229910052753 mercury Inorganic materials 0.000 description 6
- 229910052739 hydrogen Inorganic materials 0.000 description 4
- 239000001257 hydrogen Substances 0.000 description 4
- 125000003178 carboxy group Chemical group [H]OC(*)=O 0.000 description 3
- 230000007423 decrease Effects 0.000 description 3
- 239000000975 dye Substances 0.000 description 3
- 238000005286 illumination Methods 0.000 description 3
- 150000002500 ions Chemical class 0.000 description 3
- 238000005259 measurement Methods 0.000 description 3
- 238000004445 quantitative analysis Methods 0.000 description 3
- 239000000126 substance Substances 0.000 description 3
- 239000003153 chemical reaction reagent Substances 0.000 description 2
- 239000003086 colorant Substances 0.000 description 2
- 230000004060 metabolic process Effects 0.000 description 2
- 239000003068 molecular probe Substances 0.000 description 2
- 238000002360 preparation method Methods 0.000 description 2
- 102000004169 proteins and genes Human genes 0.000 description 2
- 108090000623 proteins and genes Proteins 0.000 description 2
- 241001422033 Thestylus Species 0.000 description 1
- 238000009825 accumulation Methods 0.000 description 1
- 238000004458 analytical method Methods 0.000 description 1
- 230000002238 attenuated effect Effects 0.000 description 1
- 210000000170 cell membrane Anatomy 0.000 description 1
- 229940000425 combination drug Drugs 0.000 description 1
- 238000012937 correction Methods 0.000 description 1
- 230000003247 decreasing effect Effects 0.000 description 1
- 238000011161 development Methods 0.000 description 1
- 230000005684 electric field Effects 0.000 description 1
- 230000006870 function Effects 0.000 description 1
- 239000011159 matrix material Substances 0.000 description 1
- 230000007102 metabolic function Effects 0.000 description 1
- 238000012986 modification Methods 0.000 description 1
- 230000004048 modification Effects 0.000 description 1
- 210000004498 neuroglial cell Anatomy 0.000 description 1
- 210000002569 neuron Anatomy 0.000 description 1
- 102000039446 nucleic acids Human genes 0.000 description 1
- 108020004707 nucleic acids Proteins 0.000 description 1
- 150000007523 nucleic acids Chemical class 0.000 description 1
- 229940086255 perform Drugs 0.000 description 1
- 230000003334 potential effect Effects 0.000 description 1
- 230000008569 process Effects 0.000 description 1
- 238000012360 testing method Methods 0.000 description 1
- XAGUNWDMROKIFJ-UHFFFAOYSA-J tetrapotassium;2-[2-[[8-[bis(carboxylatomethyl)amino]-6-methoxyquinolin-2-yl]methoxy]-n-(carboxylatomethyl)-4-methylanilino]acetate Chemical compound [K+].[K+].[K+].[K+].C1=CC2=CC(OC)=CC(N(CC([O-])=O)CC([O-])=O)=C2N=C1COC1=CC(C)=CC=C1N(CC([O-])=O)CC([O-])=O XAGUNWDMROKIFJ-UHFFFAOYSA-J 0.000 description 1
- 238000002834 transmittance Methods 0.000 description 1
- 229910052724 xenon Inorganic materials 0.000 description 1
- FHNFHKCVQCLJFQ-UHFFFAOYSA-N xenon atom Chemical compound [Xe] FHNFHKCVQCLJFQ-UHFFFAOYSA-N 0.000 description 1
Images


Classifications
-
- G—PHYSICS
- G01—MEASURING; TESTING
- G01N—INVESTIGATING OR ANALYSING MATERIALS BY DETERMINING THEIR CHEMICAL OR PHYSICAL PROPERTIES
- G01N21/00—Investigating or analysing materials by the use of optical means, i.e. using sub-millimetre waves, infrared, visible or ultraviolet light
- G01N21/62—Systems in which the material investigated is excited whereby it emits light or causes a change in wavelength of the incident light
- G01N21/63—Systems in which the material investigated is excited whereby it emits light or causes a change in wavelength of the incident light optically excited
- G01N21/64—Fluorescence; Phosphorescence
- G01N21/645—Specially adapted constructive features of fluorimeters
- G01N21/6456—Spatial resolved fluorescence measurements; Imaging
- G01N21/6458—Fluorescence microscopy
-
- G—PHYSICS
- G02—OPTICS
- G02B—OPTICAL ELEMENTS, SYSTEMS OR APPARATUS
- G02B21/00—Microscopes
- G02B21/16—Microscopes adapted for ultraviolet illumination ; Fluorescence microscopes
-
- G—PHYSICS
- G01—MEASURING; TESTING
- G01N—INVESTIGATING OR ANALYSING MATERIALS BY DETERMINING THEIR CHEMICAL OR PHYSICAL PROPERTIES
- G01N21/00—Investigating or analysing materials by the use of optical means, i.e. using sub-millimetre waves, infrared, visible or ultraviolet light
- G01N21/62—Systems in which the material investigated is excited whereby it emits light or causes a change in wavelength of the incident light
- G01N21/63—Systems in which the material investigated is excited whereby it emits light or causes a change in wavelength of the incident light optically excited
- G01N21/64—Fluorescence; Phosphorescence
- G01N2021/6417—Spectrofluorimetric devices
- G01N2021/6421—Measuring at two or more wavelengths
-
- G—PHYSICS
- G01—MEASURING; TESTING
- G01N—INVESTIGATING OR ANALYSING MATERIALS BY DETERMINING THEIR CHEMICAL OR PHYSICAL PROPERTIES
- G01N21/00—Investigating or analysing materials by the use of optical means, i.e. using sub-millimetre waves, infrared, visible or ultraviolet light
- G01N21/62—Systems in which the material investigated is excited whereby it emits light or causes a change in wavelength of the incident light
- G01N21/63—Systems in which the material investigated is excited whereby it emits light or causes a change in wavelength of the incident light optically excited
- G01N21/64—Fluorescence; Phosphorescence
- G01N21/645—Specially adapted constructive features of fluorimeters
- G01N21/6456—Spatial resolved fluorescence measurements; Imaging
Abstract
Description
- The present invention relates to a fluorescence microscope system which uses a fluorescence reagent as a probe and measures, for example, the concentration of the calcium ions or that of the hydrogen ions present in living cells. More particularly, the invention relates to a fluorescence microscope which can measure the concentration distribution of such ions within a predetermined planar area.
- Measuring the concentration of free calcium ions within living cells, as well as the concentration of other ions (e.g., hydrogen ions) and gigantic molecules (e.g., protein or nucleic acid), in order to study the metabolic function of the cells, is a recent development in the fields of neuroscience and cell biology. All the methods to measure the concentration of ions and gigantic molecules employ a fluorescence reagent (hereinafter called "fluorescence probe") as a probe. The fluorescence probe is introduced into the living cells, and the concentration of a target chemical species is determined from the intensity of the fluorescent light emitted from the cells. The principle of measuring the concentration of a target chemical species will now be explained in detail.
- When the fluorescence probe combines with a specific test substance, either its fluorescence spectrum or its excitation spectrum changes, the degree of the spectrum changes depending upon the concentration of the chemical species. Hence, the concentration of the chemical species can be measured from the degree of the spectrum changes. The degree of the spectrum changes can be determined by detecting the intensity of the fluorescent light being emitted from the chemical species by using of a fluorescence spectrophotometer or a fluorescence microscope. An example of a fluorescence probe is fura-2, which is used to measure the calcium ions in living cells. When introduced into the living cells, fura-2 combines with the calcium ions in a specific way, and its excitation spectrum changes. The degree of this spectrum change is measured by detecting the change in the intensity of the fluorescent light in a limited circular area of the fluorescent image of a cell, by using a fluorescence microscope.
- Using the method described above, it is easy to measure the concentration of the calcium ions in a specific, but limited, area of a cell. However, it is difficult to determine the concentration distribution of calcium ions in a relatively large planar area. Since it is extremely important, in the fields of neuroscience and cell biology, that the concentration distribution of calcium ions be determined in a region containing several cells, this necessitates the taking of a number of samples and measuring of the concentration of calcium ions in each of these samples. This method is obviously laborious and time-consuming.
- In order to promote the use of the above method of measuring the concentration of a target chemical species, a fluorescence probe must be developed which facilitate the measuring of the concentration of the chemical species, and an apparatus must also be developed which can measure the concentrations of the chemical species at various points in a relatively large planar area simultaneously and which can thus easily determine the concentration distribution of the chemical species therein.
- The fluorescent light emitted from the fluorescent probe introduced into a living cell is measured by a fluorescence microscope, also in order to detect the membrane potential of the cell. It is demanded that an apparatus be developed which can easily measure the distribution of potential in a relatively large planar area.
- Accordingly, the object of the present invention is to provide a fluorescence microscope system which can measure the concentration distribution of a specified substance in a planar area or the concentration distribution of membrane potential.
- According to the present invention, there is provided a fluorescence microscope system for measuring an analytical characteristic of a sample from either the fluorescence spectrum or the excitation spectrum of a fluorescence probe introduced into the sample, the system comprising:
a light source for emitting excitation light to excite the fluorescence probe;
a filter unit for filtering the excitation light emitted from the light source, having a plurality of interference filters for allowing passages of excitation light beams each of a different wavelength;
a drive mechanism for moving the filter unit, thereby to position, in the optical axis of the light source, a specified interference filter allowing the passage of an excitation light beam of a desired wavelength;
a first optical system for causing the excitation light beam passing through the specified interference filter to fall onto a predetermined area of a sample into which a fluorescence probe has already been administered;
an interference filter located in the optical pass of the fluorescent light emitted from the specified area of the sample, for allowing the passage of only that beam of the fluorescent light which has a predetermined wavelength;
beam-splitting means located in the optical path of the fluorescent light beam passing through the interference filter, for splitting the fluorescent light beam into first and second beams;
a second optical system, including an ocular lens, for focusing the first beam, thereby to form a fluorescent image of the specified area of the sample;
a third optical system for focusing the second beam, thereby to form a fluorescent image of the specified area of the sample;
a television camera for converting, into electric image data, the fluorescent image formed by the third optical system; and
an image data processing device for processing the image data provided by the television camera, thereby to form an image representing the distribution of the analytical characteristic measured in the specified area of the sample. - Preferably, the interference filter for passing the fluorescent light beam is replaced by a unit which comprises, like the filter unit, a plurality of interference filters for allowing passage of fluorescent light beams. If this is the case, this filter unit is moved such that one of the interference filters, which allows passage of a fluorescent light beam having a desired wavelength, is positioned in the optical path of the fluorescent light to extract only the fluorescent light beam emitted from the sample and having the desired wavelength.
- When the interference filter for passing the fluorescent light beam is replaced by a unit comprising a plurality of interference filters, the filter unit for filtering the excitation light can be replaced by a single interference filter.
- This invention can be more fully understood from the following detailed description when taken in conjunction with the accompanying drawings, in which:
- Fig. 1 is a spectrum diagram showing how the intensities of fluorescent light beams having a wavelength of 510nm and emitted from fura-2 contained in samples each having a different calcium ion concentration, change with the wavelength of the excitation light beam which has been applied to the samples;
- Fig. 2 is a graph showing the relationship between the input and output of a TV camera;
- Fig. 3 is a graph showing the relationship between the normalized I340/I360 ratio of fura-2 and the concentration of calcium ions;
- Fig. 4 is a diagram representing the fluorescence spectrum of Indo-1, which is observed when excitation light having a wavelength of 340nm is applied to Indo-1 administered samples each containing calcium in a different concentration;
- Fig. 5 is a graph showing the relationship between the normalized I410/I460 ratio of Indo-1 and the concentration of calcium ions;
- Fig. 6 is a diagram schematically illustrating a fluorescence microscope system according to the present invention;
- Fig. 7 is a block diagram showing the microscope system illustrated in Fig. 6;
- Figs. 8 and 9 are diagrams, both showing the optical system used in the microscope system shown in Fig. 6;
- Fig. 10 is a perspective view showing the filter unit incorporated in the system shown in Fig. 6, and also the optical components arranged near this filter unit;
- Fig. 11 is a diagram illustrating the drive mechanism for moving the filter unit shown in Fig. 10;
- Fig. 12 is a sectional view of a modification of the filter unit shown in Fig. 10;
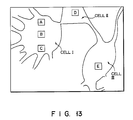
- Fig. 13 is a schematic representation of the image observed by means of the fluorescence microscope system shown in Fig. 6; and
- Figs. 14 and 15 are diagram showing another fluorescence microscope system according to the present invention.
- To facilitate the understanding of the fluorescence microscope system according to the present invention, the method of measuring the analytical characteristics such as the concentration of a substance contained in living cells, by utilizing a fluorescence probe, will be explained in greater detail.
- In this method, a fluorescence probe is used whose excitation spectrum or fluorescence spectrum changes in accordance with the concentration or membrane potential of a living cell sample. For example, the fluorescence probes called fura-2, Quin-2, and Indo-1, all manufactured by Molecular Probes, Inc., can be used to measure the concentration of calcium ions.
- Fura-2 is identified by the following formula (I). This probe has free carboxyl group. Due to the free carboxyl group, fura-2 cannot pass through the membranes of established nerve cell line (NG108, N115), the membranes of established cell line resulting from glia cell (C6Bu-1), or the membrane of similar cells. Therefore, fura-2 is acetoxy-methyl-esterified, thus forming a derivative called fura-2/AM, and this derivative is administered into the sample cells. Fura-2/AM undergoes metabolism as soon as it is taken into the cells, and changes into fura-2 which is a free carboxyl ion. Fura-2 readily combines with calcium ions.

- When fura-2 combines with the calcium ions, its excitation spectrum changes in accordance with the concentration of the calcium ions. The fluorescent light emitted from fura-2 has a single peak at wavelength of 510nm, and a band pass of l0nm. Fig. 1 is a spectrum diagram which represents the intensities of the fluorescent light beams having a wavelength of 510nm, which fura-2 contained in samples having different concentrations of calcium ions emitted when the excitation light beams having different wavelengths were applied to the samples. As can be understood from Fig. 1, the intensity of the fluorescent light emitted from fura-2 contained in any sample increased most greatly with the increment of calcium ion concentration when the excitation light beam applied to the sample had a wavelength of 340nm. Also, as is obvious from Fig. 1, when the excitation light beam having a wavelength of 360nm was applied to the samples, the intensity of the fluorescent light scarcely depends upon the concentration of calcium ions. Further, the intensity of the fluorescent light emitted from fura-2 contained in any sample decreased most greatly with the increment of the calcium ion concentration when the excitation light beam applied to the sample had a wavelength of 380nm.
- As is evident from Fig. 1, the intensity of the fluorescent light beam depended on the concentration of calcium ions and changed in accordance with the wavelength of the excitation light beam applied to the sample. Therefore, the concentration of the calcium ions in a sample can be measured by applying two excitation beams having different wavelengths to the sample, obtaining the intensity ratio between the two fluorescent beams which fura-2 emits when the excitation beams are applied to the sample, and determining the concentration of the calcium ions from this intensity ratio. One of the two excitation beams must have a wavelength at which the fluorescent intensity increases most greatly, and the other excitation beam must have a wavelength at which the fluorescent intensity does not change or decreases most greatly. This method of measuring the concentration of the calcium ions makes it possible to standardize either the the concentration and attenuation of the fluorescence probe, or the difference in the intensity of the excitation light beams. The method, wherein two excitation beams having wavelengths of 340nm and 360nm are used as a measuring beam and a reference beam, respectively, will be explained in detail.
- As can be seen from Fig. 1, the ratio of the intensity I340 of the fluorescent beam emitted from fura-2 contained in a sample when the 340nm excitation beam is applied to the sample, to the intensity I360 fluorescent beam emitted from fura-2 when the 360nm excitation beam is applied to the sample varies from 0.64 to 1.89, depending upon the concentration of the calcium ions contained in the sample. It should be noted that the data shown in Fig. 1 has been obtained by measuring the intensities of the fluorescent beams by means of a fluorescence spectrophotometer. The data acquired by measuring the intensities of the fluorescent beams by a different device, such as fluorescence microscope, differs from the data shown in Fig. 1. Further, even when devices of the same type are used, the ratio of I340/I360 may differ from that measured by a device of the same type, due to the difference in the wavelength characteristics of the components. For example, the ratios of I340/I360 measured by two fluorescence microscopes differ when the microscope are different in the wavelength characteristics of the light source, lenses, and reflectors.
- When a TV camera is used to measure the ratio of I340/I360, the dynamic range of the TV camera greatly influence the accuracy of the calcium concentration measured by the method described above. Generally, the input and output of a TV camera have the specific relationship which is illustrated in Fig. 2. As is evident from Fig. 2, this relationship has sufficient linearity only in a predetermined dynamic range. Hence, the value of I340/I360, i.e., the input of the TV camera, must vary within said dynamic range in order that the TV camera produces a sufficiently accurate output. To this end, it suffices to use a neutral density (ND) filter to adjust the intensity of the excitation beam such that the value of I340/I350 is normalized, that is, the median of this value becomes 1. Fig. 3 shows the relationship between the normalized value of I340/I360 and the calcium concentration. The data shown in Fig. 3 can be used as calibration curve for measuring the calcium concentration.
- Indo-1, which can also be used to measure the concentration of calcium, is identified by the following formula (II). This fluorescence probe also has free carboxyl group, and cannot pass through the membranes of living cells. Hence, Indo-1 is acetoxy-methyl-esterified into a derivative called Indo-1/AM, and this derivative is introduced into the cells. Indo-1/AM does not combine with the calcium ions in the living cells. Rather, Indo-1, which has been formed due to the metabolism taking place in the cells, combines with the calcium ions.

- When Indo-1 is used, the fluorescent spectrum changes in accordance with the concentration of calcium ions, unlike in the case where fura-2 is used. Fig. 4 shows the fluorescence spectrum of Indo-1, which was observed when excitation light having a wavelength of 340nm is applied to Indo-1 administered samples each containing calcium in a different concentration. As this spectrum clearly shows, it is the fluorescent beam having a wavelength of about 410nm whose intensity increases most greatly with the concentration of calcium ions. By contrast, the intensity of the fluorescent beam which has a wavelength of 460nm does not change at all, regardless of the concentration of calcium ions. The intensity of a fluorescent beam, whose wavelength ranges from 460nm to 480, decreases with the concentration of calcium ions. Hence, the concentration of the calcium ions in a sample can be measured by two wavelengths measurement as in the case where fura-2 is used as fluorescence probe. In the case where Indo-1 is used as fluorescence probe, however, only one excitation beam having predetermined wavelength is applied to the sample, and intensity of two fluorescent beam having different wavelengths is detected. Beams having wavelengths of 410nm and 460nm are usually used as the two fluorescent beams. Alternatively, a 410nm beam and a 480nm beam can be used as the fluorescent beams. A TV camera is employed and detects the ratio of I410/I460 or the ratio of I410/I480. For the reason stated above in conjunction with the method using fura-2 as the fluorescence probe, the value of I410/I460 or I410/I480 is normalized. More precisely, this value is adjusted by an ND filter such that its median becomes 1. Fig. 5 represents the relationship between the normalized value of I410/I460 and the concentration of calcium ions. The curve showing this specific relationship can be used as calibration curve for measuring the concentration of calcium ions.
- Quantitative analysis utilizing a fluorescence probe, which is similar to the analysis described above, can be applied to determine the concentration of a chemical species other than calcium, provided that a suitable florescence probe is available. For instance, such quantitative analysis can apply to the measuring of pH value, i.e., the concentration of hydrogen ions, by using 2′,7′-bis carboxyethyl carboxy fluorescein as fluorescence probe. This fluorescence probe is sold by Molecular Probes, Inc., under the trade name of "BCECF."
- Further, a method similar to the one described above can be employed to measure the membrane potential of living cells, by using a fluorescence probe whose fluorescence or excitation spectrum changes with the intensity of the electric field applied on it. Usable as such a fluorescence probe is, for example, RH421 or RH460, either being a styrylic dye (see A. Grinvald et al., Biophys. J., 1982, pp. 30--308). This dye is fat-soluble and can, therefore, trapped within a cell membrane. Its fluorescence spectrum varies in accordance with the difference between the electrical potential within the cell and that outside the cell. Hence, when the dye is used as fluorescence probe, it is possible to measure the membrane potential of the living cell.
- In the method explained above, the fluorescence light emitted from the sample is attenuated. The more intense the excitation light continuously applied to a sample, the greater the attenuation of the fluorescent light emitted from the fluorescence probe contained in the sample. When the intensity of the fluorescent light decreases below a predetermined value, it is no longer possible to measure analytical characteristic such as the concentration of calcium ions. The same problem also arises in the two wavelengths measurement case where two excitation beams or fluorescent beams having different wavelengths are used. It is therefore required that the excitation beam be as less intense as possible and be applied to the sample for a time as short as possible. The excitation beam must be shielded by means of a shutter or the like, unless it needs to be applied to the sample to measure the concentration of calcium ions.
- Fluorescence microscope systems according to this invention will now be described, each being a combination of a fluorescence microscope, a TV camera, and an image-processing device, and designed to perform the above-mentioned quantitative analysis on a predetermine planer area, thus to determine the distribution of calcium concentration or the like, in the predetermined planer area.
- The fluorescence microscope system according to the first embodiment will be described, with reference to Figs. 6 to 13. This system is designed to analyze the changes of an excitation spectrum of fura-2 contained in a sample, thereby to measure the concentration of the calcium ions within the sample.
- Fig. 6 is a diagram schematically illustrating the fluorescence microscope system, and Fig. 7 is a block diagram showing this system.
- As is shown in Fig. 6, the fluorescence microscope system comprises an
illumination device 1. Thedevice 1 contains anmercury lamp 2 used as an excitation light source. Themercury lamp 2 can be replaced by any lamp such as a xenon lamp, which emits light having a desired wavelength. A light-projectingtube 3 is attached at one end to theillumination device 1, and at the other end to the housing of the fluorescent microscope system. Thetube 3 contains afilter unit 6. Thefilter unit 6 comprises a neutral density (ND)filter 4 and aninterference filter 5, and is located in the optical axis of themercury lamp 2. Theinterference filter 5 can allow passage of only light beam having a predetermined wavelength. TheND filter 4 is designed to adjust the amount of light that can pass through thefilter unit 6. TheND filter 4 can be dispensed with if the other conditions allow to omit the ND filter. - The light passing through the
filter unit 6, which is used as excitation light, is applied to anobjective lens 8 via the optical system shown in Fig. 8. Theobjective lens 8 focuses the excitation light ontosample cells 10 placed on astage 9. Fura-2 has been introduced into thesample cells 10. Fura-2 is excited with the light, and emits fluorescent light. This fluorescent light passes through the optical system shown in Fig. 8 and observed through anocular lens 12. The fluorescent light is also applied to aTV camera 13 via the optical system shown in Fig. 9. TheTV camera 13 is connected to animage processor 14, which in turn is connected to acomputer 15. Thecomputer 15 is connected to amonitor 16, which in turn is coupled to aprinter 17. In both optical systems shown in Figs. 8 and 9, the epi-fluorescent light is observed. - With this system it is possible not only to measure the concentration of the calcium ions within the
sample cells 10 by the epi-fluorescent light, but also to perform usual microscopic examination of thesample cells 10. As is shown in Fig. 6, the system has a visible-light source 20a for use in microscopically examining thecells 10. The visible light which the visible-light source 20a emits is focused by acondenser lens 20b and applied onto thesample cells 10. The visible light passes through thecells 10, through the optical system shown in Fig. 8, and through theocular lens 12. In other words, the visible light propagates through a passing-light path, whereby the microscopic examination of thecells 10 is made possible. - The fluorescence microscope system will be described in greater detail, with reference to Figs. 7, 8, and 9. As is illustrated in Fig. 7, the
filter unit 6 has threeND filters 4 and threeinterference filters 5. The interference filters 5 allow passage of excitation light beams having wavelengths of 340nm, 360nm, and 380nm, respectively. The ND filters 4 and the interference filters 5 can be moved by steppingmotors 18, across the optical axis of theillumination device 1. Therefore, whichever ND filter desired, and whichever interference filter desired can be located in the optical axis of thedevice 1, and can thus extract an excitation beam having the desired wavelength from the excitation light emitted from themercury lamp 2. The ND filters 4 are used to adjust the amount of light which can pass through the interference filters 5. More precisely, two of the ND filters 4 may be employed to changes the incident excitation beams each having a different wavelength and a different intensity, to excitation beams having substantially identical intensities which are required to accomplish an accurate measuring of the concentration of the calcium ions within thesample cells 10. - The system further comprises another filter unit (not shown) including four ND filters having different transmittance ratios of 0%, 25%, 40%, and 100%. One of these ND filters is selected and used whenever the
ocular lens 8 is replaced by another. The selected ND filter is located in the optical axis of theobjective lens 8. - As is shown in Fig. 8, a
dichroic mirror 7 is arranged in the optical axis of themercury lamp 2 and right below theobjective lens 8. The excitation light passing through thefilter unit 6 is reflected by thedichroic mirror 7, and is applied through theobjective lens 8 onto thesample cells 10. The fura-2 contained in thecells 10 emits fluorescent light, upon receipt of the excitation light. This epi-fluorescent light is applied to thedichroic mirror 7. Themirror 7 allow the fluorescent light pass through. Located immediately below thedichroic mirror 7 is anemission filter 19. Thisfilter 19 allows passage of only the fluorescent beam having a wavelength of 510nm emitted from fura-2. The 510nm fluorescent beam is applied to abeam splitter 11. Part of this beam, about 20%, passes through thebeam splitter 11. The 510nm fluorescent beam passing through thebeam splitter 11 is reflected, first by a reflector 60a and then by areflector 60b. The 510nm beam is then supplied to theocular lens 12 through aprism 61. - As can be understood from Fig. 9, the
beam splitter 11 splits the fluorescent beam passing through theemission filter 19, into two beams. The first beam, which amounts to 20% of the beam incident on thebeam splitter 11, is guided to theocular lens 12, as has been explained. The second beam, which amounts to 80% of the beam incident on thebeam splitter 11, is emitted from thebeam splitter 11 and propagates in the direction at right angles to the first beam. The second beam is reflected by a reflector 60c and applied to theTV camera 13. - As is illustrated in Fig. 7, the
image processor 14 is connected to theTV camera 13. Theimage processor 14 has functions, to control theTV camera 13 and to accumulate the image data items output by theTV camera 13. Theimage processor 14 is coupled to thecomputer 15 with a built-in RAM disk. Thecomputer 15 is connected to themonitor 16, which in turn is coupled to theprinter 17. Thecomputer 15 processes the image data items supplied from theimage processor 14, thereby determining the concentration of the calcium ions within thesample cells 10 and also the distribution of the calcium concentration. Thecomputer 15 is connected to the steppingmotors 18, thus controlling thesemotors 18. - Fig. 10 is a perspective view showing the
filter unit 6 and the components located near theunit 6. The steppingmotors 18 are driven under the control of thecomputer 15, thereby moving the ND filters 4 and/or the interference filters 5 in the directions of the arrows shown in Fig. 10. As a result, the desiredND filter 4 and the desiredinterference filter 5 are placed in the optical axis of themercury lamp 2. - The ND filters 4 and the interference filters 5 can be connected together, as is illustrated in Fig. 12. If this is the case, the unit consisting of these
filters filter frame 41 by means of aholder 42. - The
filter unit 6 is moved by the mechanism shown in Fig. 11. As is shown in Fig. 11, thehousing 21 of the microscope is secured to abase 22. Poles 32 stand vertically on thebase 22.Vibration absorbers 24, each made of rubber, are fastened to the tops of the poles 32. The base 25 of the mechanism is connected to thevibration absorbers 24. A straight guide rail 26 is mounted on the base 25. Two linear bearings are mounted on the guide rail 26, and two blocks are supported by these bearings. A movable table 27 is fastened to the blocks, and can therefore move along the guide rail 26. Thefilter unit 6 and arack 28 are attached to the movable table 27.Vibration absorbers 29 are mounted on the base 26, and amotor 30 is supported by thesevibration absorbers 29. Apinion 31 is fastened to the shaft of themotor 30, and put in mesh with therack 28. Hence, when themotor 30 is driven, therack 28 is moved horizontally. As a result of this, thefilter unit 6 and the table 27 are moved together, in the horizontal direction. - The
vibration absorbers filter unit 6, prevent thestage 9 from vibrating, even when the ND filters 4 and the interference filters 5 vibrate while being moved by the steppingmotors 18. Hence, thesample cells 10 placed on thestage 9 are not vibrated at all, and their membranes are not torn by the styluses set in thecells 10 to measure the pH value and/or electric potential of thecells 10. Without thevibration absorbers 24 to 29, thecells 10 should vibrate, and their membranes should be broken, making it impossible to determine the pH value and/or the electric potential, along with the concentration of the calcium ions contained in thesample cells 10. - It will now be explained how the fluorescence microscope system described above is operated in order to measure the concentration of the calcium ions within the
sample cells 10. - The data representative of the conditions under which to measure the concentration of the calcium ions is input to the
computer 15. Further, a file of these conditions is prepared. If necessary, this file is corrected, stored, or deleted. - The following conditions (1) to (7) are input to the
computer 15, thus preparing a table of measuring conditions. The table, thus prepared, is stored into the memory incorporated in thecomputer 15. If necessary, a file name is assigned to the table. The table is recorded, as a measuring-condition file, on a floppy disk. - The number of images output by the
TV camera 13, which must be accumulated to determine the concentration of the calcium ions, varies in accordance with the intensity of fluorescent light emitted from the sample cells, i.e., the brightness of the measuring view field. The brighter the view field, the less the number of images to be accumulated. In other words, the darker the view field, the greater the number of images to be accumulated. The number of images which must be accumulated determines the time required for measuring the calcium ion concentration. The time for accumulating the images, and the intervals at which theTV camera 13 form images depend upon the concentration of fura-2 contained in thecells 10, and also upon the degree by which the calcium ion concentration changes. - The time required for measuring the calcium ion concentration is:
(1/30 sec × accumulation number of images) + time for image processing - Generally, the calcium ion concentration is measured 59 times or less, for the same sample cells.
- The wavelength of the excitation light is chosen in accordance with which fluorescent probe is used. When fura-2 is applied in measuring the calcium ion concentration by applying two excitation beams, either a 340nm beam and a 360nm beam, or a 340nm beam and a 380nm beam, are applied to the
sample cells 10. When Indo-1 is used, a 340nm beam is applied to thesample cells 10. - Which ND filter is selected depends upon the type of the source of the excitation light, the characteristics of the
objective lens 8, and the like. - The wavelength for the measuring fluorescent light is selected in accordance with which fluorescence probe is employed. More specifically, when fura-2 is used, a 510nm is selected. When Indo-1 is used to measure the calcium ion concentration, two fluorescent beams, a 410nm beam and a 460nm beam, or a 410nm beam and a 480nm beam are used as measuring light beams.
- Generally, a pixel matrix, in which at most 512 pixels form each column, and at most 512 pixels form each row, is employed.
- To alter the measuring conditions (1) to (7) recorded on the floppy disk, the file of these conditions is read from the floppy disk into the memory incorporated in the
computer 15. The file is corrected in thecomputer 15. If necessary, the corrected file is recorded on a floppy disk with a filing name. - The operator look through the
ocular lens 12 into thesample cells 10 into which a fluorescence probe has already been introduced. Looking at the enlarged view of thecells 10, he or she makes various adjustments on the microscope. For example, the operator inputs adjustment data to thecomputer 15, thereby adjusting theobjective lens 8 to bring the image into focus, and adjusting thefilter unit 6 to change the brightness of the image. - The conditions under which to measure the calcium ion concentration automatically are registered in the
computer 15. - The concentration of the calcium ions within the
sample cells 10 is automatically measured under the conditions which have been registered in thecomputer 15, in the following way. - (1) The fluorescent light emitted from the
sample cells 10 is applied to theTV camera 13. TheTV camera 13 converts the fluorescent beams applied to the pixels into electric signals, each having a magnitude proportional to the intensity of the fluorescent beam applied to the corresponding pixel. These electric signals, or image data, are input to theimage processor 14. TheTV camera 13 produces an image data item for each exposure period (e.g., 1/30 sec), and supplies the data item to theimage processor 14. Theimage processor 14 accumulates a predetermined number of the image data items supplied from theTV camera 13, thus forming an image of thesample cells 10. The data representing this image is input to thecomputer 15. - (2) The image data output by the
image processor 14 is written into the frame memory provided in thecomputer 15. The image data is then recorded on the RAM disk also provided in thecomputer 15. In the case where two excitation beams of deferent wavelength or two fluorescent beams of different wavelength is employed, two image data items are obtained. Both image data items are recorded on the RAM disk. More specifically, when fura-2 is used as fluorescence probe, the first image data item is acquired from the fluorescent beam which fura-2 emits when excited by an excitation beam having a wavelength of 340nm, and the second image data item is produced from the fluorescent beam which fura-2 emits when excited by an excitation beam having a wavelength of 360nm. - (3) The
computer 15 compares the first and second image data items, for every pixel, in accordance with the image-processing program stored in thecomputer 15, thereby calculates an intensity ratio of, for example, I340/I360. Further, thecomputer 15 converts the intensity ratio into a calcium concentration in accordance with such an calibration curve as is illustrated in Fig. 3. A pseudo-color, which identifies the calcium concentration thus calculated, is assigned to the pixel. In other words, the same pseudo-color is assigned to the pixels showing the identical calcium concentrations, and different pseudo-colors are assigned to the pixels representing different calcium concentrations. Hence, the concentration of the calcium ions in each part of thecells 10 is identified with the pseudo-color of the corresponding pixel. The color image of thesample cells 10, which is formed of the pixels, shows the distribution of the calcium ion concentration in thecells 10. - The image data obtained at any step of the automatic measuring of the calcium concentration and written on the RAM disk can be recorded, if necessary, on the floppy disk.
- The image data recorded on the RAM disk or the floppy disk can be displayed on the screen of the
monitor 16, in the form of a color image of thesample cells 10. From the color image it can be understood how the concentration of calcium ions is distributed in thesample cells 10. Moreover, theprinter 17 can provide a hard copy of this color image of thecells 10. - As can be obvious from the above, the fluorescence microscope system described above can form a color image of the sample cells, which indicates the distribution of the concentration of the calcium ions within the cells, by processing the image data items produced from the fluorescent beams collected by the fluorescence microscope incorporated in the system. More precisely, the system can provide such an image as is schematically shown in Fig. 13. This is an image of three cells I, II, and III. The concentrations of calcium ions, at points A to E in this image, are as follows:
A = 94.1nM B = 82.1nM C = 110.6nM D = 90.3nM E = 30.9nM - Although not demonstrated in Fig. 13, those portions of the three cells which are located at points A to E are displayed in different pseudo-colors representing different calcium concentrations. Hence, the calcium concentrations in these portions of the cells can be clearly understood at a glance of this color image.
- Another embodiment of the present invention will now be described, with reference to Figs. 14 and 15. This embodiment is a fluorescence microscope system which can measure the concentration of the calcium ions within living cells, by using Indo-1 as fluorescence probe and by detecting how the fluorescence spectrum of this probe changes.
- Fig. 14 schematically illustrates this fluorescence microscope system. As the comparison of Fig. 15 with Fig. 7 may indicate, a
filter holder 52 is used in place of theemission filter 19 used in the first embodiment (Fig. 7). As is evident from Fig. 16, thefilter holder 52 is a disk having three throughholes filter holder 52 is connected to a steppingmotor 51. When thefilter holder 52 is rotated by the steppingmotor 51, one of theholes - As is shown in Fig. 15, the stepping
motor 51 and thefilter holder 52 are located within a light-shielding box 53. Aninterference filter 44 and aND filter 45, one laid upon the other, are fitted in the throughhole 54a of thefilter holder 52. Similarly, aninterference filter 44 and aND filter 45, one laid upon the other, are fitted in the throughhole 54b of theholder 52. The interference filter fitted in thehole 54a allows a light beam having a wavelength of about 410nm (410nm ± 10 to 20nm) to pass therethrough. The interference filter fitted in thehole 54b allows a light beam having a wavelength of about 460nm (460nm ± 10 to 20nm) to pass therethrough. The light beams passing through these interference filters 44 and also the ND filters 45 are used to measure the concentration of the calcium ions within sample cells which contains Indo-1 used as fluorescence probe. As is illustrated in Fig. 15, the system has asensor 55 for positioning the filters,lens 56 for forming the epi-fluorescent image and asupport 57 supporting the steppingmotor 51. In all other structural aspects, the system is identical to the system illustrated in Figs. 6 to 12. - To measure the concentration of the calcium ions in the sample cells which contain Indo-1 employed as fluorescence probe, an excitation beam having a wavelength of 340nm is applied to the cells through one of the interference filters 5, as is shown in Fig. 14. The
motor 51 rotates thefilter holder 52 such that the interference filters 44, which allow passage of a 410nm beam and a 460nm beam, come into the optical axis of thecondenser lens 56, one after the other. As a result, two fluorescent beams emitted from Indo-1 contained in the sample cells, and having wavelengths of 410nm and 460nm, respectively, are applied to theTV camera 13 through theimage forming lens 56. - Since no interference filter is fitted in the through hole 54c of the
filter holder 52, the system shown in Fig. 14 can measure the calcium concentration in the same way as the system shown in Figs. 6 to 12, by utilizing fura-2 as fluorescence probe, provided that the steppingmotor 51 rotates thefilter holder 52, thus placing the through hole 54c in the optical path of the epi-fluorescent light. - Either fluorescence microscope system described above, can not only measure the concentration of the calcium ions within living cells, but also determine the concentration of the hydrogen ions or gigantic moleculars (e.g., protein molecules) within living cells, and detect the membrane potential of living cells.
Claims (10)
a light source (2) for emitting excitation light to excite the fluorescent probe;
a first filter unit (6) for filtering the excitation light emitted from said light source (2), having a plurality of interference filters (5) for allowing the passage of excitation light beams each having a different wavelength;
a drive mechanism (26, 27, 28, 30, 31) for moving said first filter unit (6), thereby to position, in the optical axis of said light source (2), a specified interference filter allowing the passage of an excitation light beam of a desired wavelength;
a first optical system (7, 8) for causing the excitation light beam passing through said specified interference filter (5) to fall onto a predetermined area of a sample (10) into which a fluorescence probe has been introduced;
an interference filter (19) located in the optical path of the fluorescent light emitted from the specified area of the sample (10), for allowing the passage of only that beam of the fluorescent light which has a predetermined wavelength;
beam-splitting means (11) located in the optical path of the fluorescent light beam passing through the interference filter (19), for splitting the fluorescent light beam into first and second beams;
a second optical system (60s, 60b, 61), including an ocular lens (12), for focusing the first beam, thereby to form a fluorescent image of the specified area of the sample (10);
a third optical system (60c, 56) for focusing the second beam, thereby to form a fluorescent image of the specified area of the sample (10);
a television camera (13) for converting, into electric image data, the fluorescent image formed by said third optical system (60c, 56); and
an image processing device (14, 15) for processing the image data provided by said television camera (13), thereby to form an image representing the distribution of the values of the analytical characteristic measured in the specified area of the sample (10).
a light source (2) for emitting excitation light to excite the fluorescence probe;
an interference filter (5) located in the optical axis of said light source (2), for allowing the passage of only that beam of the excitation light which has a predetermined wavelength;
a first optical system (7, 8) for causing the excitation light beam passing through said interference filter (5) to fall onto a specified area of a sample (10) into which a fluorescence probe has been introduced;
a filter unit (52) for filtering the fluorescent light emitted from the specified area of the sample (10) when the excitation light beam is applied to this area, said unit (52) having a plurality of interference filters (44) for allowing the passage of fluorescent light beams each having a different wavelength;
a drive mechanism (51, 55) for moving said filter unit (52), thereby to position, in the optical path of the fluorescent light, a specified interference filter (44) allowing the passage of a fluorescent light beam of a desired wavelength;
beam-splitting means (11) located in the optical path of the fluorescent light beam passing through the specified interference filter (44), for splitting the fluorescent light beam into first and second beams;
a second optical system (60a, 60b, 61), including an ocular lens (12), for focusing the first beam, thereby to form a fluorescent image of the specified area of the sample (10);
a third optical system (60c, 56) for focusing the second beam, thereby to form a fluorescent image of the specified area of the sample (10);
a television camera (13) for converting, into electric image data, the fluorescent image formed by said third optical system (60c, 56); and
an image processing device (14, 15) for processing the image data provided by said television camera (13), thereby to form an image representing the distribution of the values of the analytical characteristic measured in the specified area of the sample (10).
Applications Claiming Priority (4)
| Application Number | Priority Date | Filing Date | Title |
|---|---|---|---|
| JP103545/88 | 1988-04-26 | ||
| JP10354588 | 1988-04-26 | ||
| JP63189453A JP2749069B2 (en) | 1988-04-26 | 1988-07-28 | Fluorescence microscope equipment |
| JP189453/88 | 1988-07-28 |
Publications (3)
| Publication Number | Publication Date |
|---|---|
| EP0339582A2 true EP0339582A2 (en) | 1989-11-02 |
| EP0339582A3 EP0339582A3 (en) | 1990-11-22 |
| EP0339582B1 EP0339582B1 (en) | 1994-12-14 |
Family
ID=26444189
Family Applications (1)
| Application Number | Title | Priority Date | Filing Date |
|---|---|---|---|
| EP19890107487 Expired - Lifetime EP0339582B1 (en) | 1988-04-26 | 1989-04-25 | Fluorescence microscope system |
Country Status (3)
| Country | Link |
|---|---|
| EP (1) | EP0339582B1 (en) |
| JP (1) | JP2749069B2 (en) |
| DE (1) | DE68919892T2 (en) |
Cited By (26)
| Publication number | Priority date | Publication date | Assignee | Title |
|---|---|---|---|---|
| DE4026564A1 (en) * | 1989-08-24 | 1991-02-28 | Olympus Optical Co | METHOD FOR PRODUCING A TWO-DIMENSIONAL DISTRIBUTION IMAGE OF AN ION CONCENTRATION IN A CELL |
| EP0440342A2 (en) * | 1990-01-12 | 1991-08-07 | The Regents Of The University Of California | Laser excited confocol microscope fluorescence scanner and method |
| EP0510329A2 (en) * | 1991-04-26 | 1992-10-28 | Olympus Optical Co., Ltd. | Photographing apparatus for microscopes |
| DE4239016A1 (en) * | 1991-11-20 | 1993-05-27 | Hamamatsu Photonics Kk | |
| EP0610036A2 (en) * | 1993-01-28 | 1994-08-10 | Research Development Corporation Of Japan | Method of spectrometry and apparatus therefor |
| WO1997011636A2 (en) * | 1995-09-26 | 1997-04-03 | Karl Storz Gmbh & Co. | Apparatus for photodynamic diagnosis |
| EP1154261A2 (en) * | 2000-05-12 | 2001-11-14 | Shiseido Company Limited | Imaging of ion distribution in tissue |
| WO2002057759A1 (en) * | 2001-01-18 | 2002-07-25 | Koninklijke Philips Electronics N.V. | Analysis of a composition |
| FR2820828A1 (en) * | 2001-02-09 | 2002-08-16 | Commissariat Energie Atomique | DEVICE FOR OBSERVING SAMPLES BY FLUORESCENCE, ESPECIALLY SEQUENTIALLY |
| US6711283B1 (en) * | 2000-05-03 | 2004-03-23 | Aperio Technologies, Inc. | Fully automatic rapid microscope slide scanner |
| US7110586B2 (en) | 1996-08-23 | 2006-09-19 | Bacus Laboratories, Inc. | Apparatus for remote control of a microscope |
| US7146372B2 (en) | 1997-03-03 | 2006-12-05 | Olympus America Inc. | Method and apparatus for creating a virtual microscope slide |
| WO2007085496A1 (en) * | 2006-01-30 | 2007-08-02 | Carl Zeiss Surgical Gmbh | Microscope system |
| US7257268B2 (en) | 2003-02-28 | 2007-08-14 | Aperio Technologies, Inc. | Systems and methods for image pattern recognition |
| US7463761B2 (en) | 2004-05-27 | 2008-12-09 | Aperio Technologies, Inc. | Systems and methods for creating and viewing three dimensional virtual slides |
| US7518652B2 (en) | 2000-05-03 | 2009-04-14 | Aperio Technologies, Inc. | Method and apparatus for pre-focus in a linear array based slide scanner |
| US7602524B2 (en) | 2003-02-28 | 2009-10-13 | Aperio Technologies, Inc. | Image processing and analysis framework |
| US7668362B2 (en) | 2000-05-03 | 2010-02-23 | Aperio Technologies, Inc. | System and method for assessing virtual slide image quality |
| US7738688B2 (en) | 2000-05-03 | 2010-06-15 | Aperio Technologies, Inc. | System and method for viewing virtual slides |
| US7787674B2 (en) | 2005-01-27 | 2010-08-31 | Aperio Technologies, Incorporated | Systems and methods for viewing three dimensional virtual slides |
| US8164622B2 (en) | 2005-07-01 | 2012-04-24 | Aperio Technologies, Inc. | System and method for single optical axis multi-detector microscope slide scanner |
| CN102818798A (en) * | 2012-09-10 | 2012-12-12 | 重庆大学 | Fluorescence detection device for detecting gas exhaled from patient with lung cancer |
| CN102841082A (en) * | 2012-09-10 | 2012-12-26 | 重庆大学 | Double-signal lung cancer exhalation gas detecting system |
| US8571286B2 (en) | 2007-05-04 | 2013-10-29 | Leica Biosystems Imaging, Inc. | System and method for quality assurance in pathology |
| US8705825B2 (en) | 2009-12-11 | 2014-04-22 | Leica Biosystems Imaging, Inc. | Signal to noise ratio in digital pathology image analysis |
| US8743195B2 (en) | 2008-10-24 | 2014-06-03 | Leica Biosystems Imaging, Inc. | Whole slide fluorescence scanner |
Families Citing this family (11)
| Publication number | Priority date | Publication date | Assignee | Title |
|---|---|---|---|---|
| US5863504A (en) * | 1995-03-16 | 1999-01-26 | Bio-Rad Laboratories, Inc. | Fluorescence imaging instrument utilizing fish |
| CA2283267A1 (en) * | 1997-03-07 | 1998-09-11 | Clare Chemical Research Llc | Fluorometric detection using visible light |
| LU90186B1 (en) * | 1997-12-22 | 1999-06-24 | Communaute Europ Ce Batiment E | Device for non-destructive analysis of plants and vehicle comprising such an on-board device |
| JP2000098244A (en) | 1998-09-24 | 2000-04-07 | Olympus Optical Co Ltd | Fluorescent microscope |
| DE19858206C2 (en) * | 1998-12-17 | 2001-10-11 | Leica Microsystems | Method for adapting excitation intensities in a multiband fluorescence microscope and multiband fluorescence microscope for carrying out the method |
| US6075613A (en) * | 1999-02-26 | 2000-06-13 | General Scanning, Inc. | Optical scanner calibration device |
| US7158294B2 (en) | 2001-12-18 | 2007-01-02 | Olympus Optical Co., Ltd. | Laser scanning confocal microscope apparatus, image recording method, and recording medium |
| EP1721146B1 (en) * | 2004-01-14 | 2008-06-18 | Applera Corporation | Apparatus and method for fluorescent detection in biological samples |
| US7295316B2 (en) * | 2004-01-14 | 2007-11-13 | Applera Corporation | Fluorescent detector with automatic changing filters |
| JP5099675B2 (en) * | 2004-12-28 | 2012-12-19 | 学校法人東京理科大学 | Novel drug screening method using fluorescent molecular probe |
| JP2006189616A (en) * | 2005-01-06 | 2006-07-20 | Nikon Corp | Optical path switching unit and inverted microscope equipped therewith |
Citations (5)
| Publication number | Priority date | Publication date | Assignee | Title |
|---|---|---|---|---|
| DE1019841B (en) * | 1955-12-16 | 1957-11-21 | Leitz Ernst Gmbh | Fluorescence microscope |
| JPS53122473A (en) * | 1977-04-01 | 1978-10-25 | Olympus Optical Co Ltd | Fluorescent photometric mecroscope |
| EP0106721A2 (en) * | 1982-09-03 | 1984-04-25 | Henri Georges De France | System for the observation and automatic quantitative valuation of events detectable by fluorescence |
| JPS62263447A (en) * | 1986-05-10 | 1987-11-16 | Japan Spectroscopic Co | Fluorescent spectrometer for measuring concentration of calcium |
| US4773097A (en) * | 1984-05-31 | 1988-09-20 | Omron Tateisi Electronics Co. | Image analyzing apparatus |
Family Cites Families (2)
| Publication number | Priority date | Publication date | Assignee | Title |
|---|---|---|---|---|
| JPS56130150U (en) * | 1980-03-04 | 1981-10-02 | ||
| US4791310A (en) * | 1986-10-02 | 1988-12-13 | Syracuse University | Fluorescence microscopy |
-
1988
- 1988-07-28 JP JP63189453A patent/JP2749069B2/en not_active Expired - Fee Related
-
1989
- 1989-04-25 DE DE1989619892 patent/DE68919892T2/en not_active Expired - Lifetime
- 1989-04-25 EP EP19890107487 patent/EP0339582B1/en not_active Expired - Lifetime
Patent Citations (5)
| Publication number | Priority date | Publication date | Assignee | Title |
|---|---|---|---|---|
| DE1019841B (en) * | 1955-12-16 | 1957-11-21 | Leitz Ernst Gmbh | Fluorescence microscope |
| JPS53122473A (en) * | 1977-04-01 | 1978-10-25 | Olympus Optical Co Ltd | Fluorescent photometric mecroscope |
| EP0106721A2 (en) * | 1982-09-03 | 1984-04-25 | Henri Georges De France | System for the observation and automatic quantitative valuation of events detectable by fluorescence |
| US4773097A (en) * | 1984-05-31 | 1988-09-20 | Omron Tateisi Electronics Co. | Image analyzing apparatus |
| JPS62263447A (en) * | 1986-05-10 | 1987-11-16 | Japan Spectroscopic Co | Fluorescent spectrometer for measuring concentration of calcium |
Non-Patent Citations (1)
| Title |
|---|
| PATENT ABSTRACTS OF JAPAN, vol. 2, no. 154, section E, 25th December 1978, page 9927 E 78; & JP-A-53 122 473 (OLYMPUS KOGAKU KOGYO K.K.) 25-10-1978 * |
Cited By (70)
| Publication number | Priority date | Publication date | Assignee | Title |
|---|---|---|---|---|
| DE4026564A1 (en) * | 1989-08-24 | 1991-02-28 | Olympus Optical Co | METHOD FOR PRODUCING A TWO-DIMENSIONAL DISTRIBUTION IMAGE OF AN ION CONCENTRATION IN A CELL |
| FR2651321A1 (en) * | 1989-08-24 | 1991-03-01 | Olympus Optical Co | METHOD FOR FORMING AN IMAGE OF THE TWO-DIMENSIONAL DISTRIBUTION OF ION CONCENTRATION IN A LIVING CELL. |
| EP0440342A2 (en) * | 1990-01-12 | 1991-08-07 | The Regents Of The University Of California | Laser excited confocol microscope fluorescence scanner and method |
| EP0440342A3 (en) * | 1990-01-12 | 1991-11-27 | The Regents Of The University Of California | Laser excited confocol microscope fluorescence scanner and method |
| EP0510329A2 (en) * | 1991-04-26 | 1992-10-28 | Olympus Optical Co., Ltd. | Photographing apparatus for microscopes |
| EP0510329A3 (en) * | 1991-04-26 | 1993-03-17 | Olympus Optical Co., Ltd. | Photographing apparatus for microscopes |
| DE4239016A1 (en) * | 1991-11-20 | 1993-05-27 | Hamamatsu Photonics Kk | |
| US5319209A (en) * | 1991-11-20 | 1994-06-07 | Hammamatsu Photonics K.K. | Method for measurement of intracellular ion concentration using fluorescence probe dyes |
| EP0610036A2 (en) * | 1993-01-28 | 1994-08-10 | Research Development Corporation Of Japan | Method of spectrometry and apparatus therefor |
| EP0610036A3 (en) * | 1993-01-28 | 1995-03-15 | Japan Res Dev Corp | Method of spectrometry and apparatus therefor. |
| WO1997011636A2 (en) * | 1995-09-26 | 1997-04-03 | Karl Storz Gmbh & Co. | Apparatus for photodynamic diagnosis |
| WO1997011636A3 (en) * | 1995-09-26 | 1997-06-05 | Storz Karl Gmbh & Co | Apparatus for photodynamic diagnosis |
| US7110586B2 (en) | 1996-08-23 | 2006-09-19 | Bacus Laboratories, Inc. | Apparatus for remote control of a microscope |
| US8625920B2 (en) | 1997-03-03 | 2014-01-07 | Olympus America Inc. | Method and apparatus for creating a virtual microscope slide |
| US7146372B2 (en) | 1997-03-03 | 2006-12-05 | Olympus America Inc. | Method and apparatus for creating a virtual microscope slide |
| US8582849B2 (en) | 2000-05-03 | 2013-11-12 | Leica Biosystems Imaging, Inc. | Viewing digital slides |
| US9521309B2 (en) | 2000-05-03 | 2016-12-13 | Leica Biosystems Imaging, Inc. | Data management in a linear-array-based microscope slide scanner |
| US9729749B2 (en) | 2000-05-03 | 2017-08-08 | Leica Biosystems Imaging, Inc. | Data management in a linear-array-based microscope slide scanner |
| US7978894B2 (en) | 2000-05-03 | 2011-07-12 | Aperio Technologies, Inc. | Fully automatic rapid microscope slide scanner |
| US7949168B2 (en) | 2000-05-03 | 2011-05-24 | Aperio Technologies, Inc. | Data management in a linear-array-based microscope slide scanner |
| US7893988B2 (en) | 2000-05-03 | 2011-02-22 | Aperio Technologies, Inc. | Method for pre-focus of digital slides |
| US6711283B1 (en) * | 2000-05-03 | 2004-03-23 | Aperio Technologies, Inc. | Fully automatic rapid microscope slide scanner |
| US8103082B2 (en) | 2000-05-03 | 2012-01-24 | Aperio Technologies, Inc. | Optimizing virtual slide image quality |
| US8385619B2 (en) | 2000-05-03 | 2013-02-26 | Aperio Technologies, Inc. | Fully automatic rapid microscope slide scanner |
| US7826649B2 (en) | 2000-05-03 | 2010-11-02 | Aperio Technologies, Inc. | Data management in a linear-array-based microscope slide scanner |
| US8731260B2 (en) | 2000-05-03 | 2014-05-20 | Leica Biosystems Imaging, Inc. | Data management in a linear-array-based microscope slide scanner |
| US7428324B2 (en) | 2000-05-03 | 2008-09-23 | Aperio Technologies, Inc. | System and method for data management in a linear-array-based microscope slide scanner |
| US7457446B2 (en) | 2000-05-03 | 2008-11-25 | Aperio Technologies, Inc. | Fully automatic rapid microscope slide scanner |
| US9851550B2 (en) | 2000-05-03 | 2017-12-26 | Leica Biosystems Imaging, Inc. | Fully automatic rapid microscope slide scanner |
| US7518652B2 (en) | 2000-05-03 | 2009-04-14 | Aperio Technologies, Inc. | Method and apparatus for pre-focus in a linear array based slide scanner |
| US8055042B2 (en) | 2000-05-03 | 2011-11-08 | Aperio Technologies, Inc. | Fully automatic rapid microscope slide scanner |
| US7646495B2 (en) | 2000-05-03 | 2010-01-12 | Aperio Technologies, Inc. | System and computer readable medium for pre-focus of digital slides |
| US7668362B2 (en) | 2000-05-03 | 2010-02-23 | Aperio Technologies, Inc. | System and method for assessing virtual slide image quality |
| US7738688B2 (en) | 2000-05-03 | 2010-06-15 | Aperio Technologies, Inc. | System and method for viewing virtual slides |
| US8456522B2 (en) | 2000-05-03 | 2013-06-04 | Aperio Technologies, Inc. | Achieving focus in a digital pathology system |
| EP1154261A2 (en) * | 2000-05-12 | 2001-11-14 | Shiseido Company Limited | Imaging of ion distribution in tissue |
| EP1154261A3 (en) * | 2000-05-12 | 2004-03-17 | Shiseido Company Limited | Imaging of ion distribution in tissue |
| WO2002057759A1 (en) * | 2001-01-18 | 2002-07-25 | Koninklijke Philips Electronics N.V. | Analysis of a composition |
| WO2002057758A1 (en) * | 2001-01-18 | 2002-07-25 | Koninklijke Philips Electronics N.V. | Analysis of a composition |
| US6687520B2 (en) | 2001-01-18 | 2004-02-03 | Koninklijke Philips Electronics N.V. | Analysis of a composition |
| US6609015B2 (en) | 2001-01-18 | 2003-08-19 | Koninklijke Philips Electronics N.V. | Analysis of a composition |
| WO2002065160A2 (en) * | 2001-02-09 | 2002-08-22 | Commissariat A L'energie Atomique | Device for fluorescence microscopy of samples, in particular sequentially |
| WO2002065160A3 (en) * | 2001-02-09 | 2002-12-12 | Commissariat Energie Atomique | Device for fluorescence microscopy of samples, in particular sequentially |
| FR2820828A1 (en) * | 2001-02-09 | 2002-08-16 | Commissariat Energie Atomique | DEVICE FOR OBSERVING SAMPLES BY FLUORESCENCE, ESPECIALLY SEQUENTIALLY |
| US9019546B2 (en) | 2003-02-28 | 2015-04-28 | Leica Biosystems Imaging, Inc. | Image processing of digital slide images based on a macro |
| US8199358B2 (en) | 2003-02-28 | 2012-06-12 | Aperio Technologies, Inc. | Digital slide image analysis |
| US8780401B2 (en) | 2003-02-28 | 2014-07-15 | Leica Biosystems Imaging, Inc. | Systems and methods for analyzing digital slide images using algorithms constrained by parameter data |
| US7257268B2 (en) | 2003-02-28 | 2007-08-14 | Aperio Technologies, Inc. | Systems and methods for image pattern recognition |
| US7602524B2 (en) | 2003-02-28 | 2009-10-13 | Aperio Technologies, Inc. | Image processing and analysis framework |
| US7844125B2 (en) | 2003-02-28 | 2010-11-30 | Aperio Technologies, Inc. | Systems and methods for image pattern recognition |
| US8467083B2 (en) | 2003-02-28 | 2013-06-18 | Aperio Technologies, Inc. | Framework for processing the content of a digital image of a microscope sample |
| US7463761B2 (en) | 2004-05-27 | 2008-12-09 | Aperio Technologies, Inc. | Systems and methods for creating and viewing three dimensional virtual slides |
| US7860292B2 (en) | 2004-05-27 | 2010-12-28 | Aperio Technologies, Inc. | Creating and viewing three dimensional virtual slides |
| US8189891B2 (en) | 2005-01-27 | 2012-05-29 | Aperio Technologies, Inc. | Viewing three dimensional digital slides |
| US7787674B2 (en) | 2005-01-27 | 2010-08-31 | Aperio Technologies, Incorporated | Systems and methods for viewing three dimensional virtual slides |
| US8620047B2 (en) | 2005-01-27 | 2013-12-31 | Leica Biosystems Imaging, Inc. | Viewing three dimensional digital slides |
| US8164622B2 (en) | 2005-07-01 | 2012-04-24 | Aperio Technologies, Inc. | System and method for single optical axis multi-detector microscope slide scanner |
| US8040599B2 (en) | 2006-01-30 | 2011-10-18 | Carl Zeiss Surgical Gmbh | Microscope system |
| EP2682801A3 (en) * | 2006-01-30 | 2014-04-30 | Carl Zeiss Meditec AG | Microscope system |
| WO2007085496A1 (en) * | 2006-01-30 | 2007-08-02 | Carl Zeiss Surgical Gmbh | Microscope system |
| US8885900B2 (en) | 2007-05-04 | 2014-11-11 | Leica Biosystems Imaging, Inc. | System and method for quality assurance in pathology |
| US9122905B2 (en) | 2007-05-04 | 2015-09-01 | Leica Biosystems Imaging, Inc. | System and method for quality assurance in pathology |
| US9349036B2 (en) | 2007-05-04 | 2016-05-24 | Leica Biosystems Imaging, Inc. | System and method for quality assurance in pathology |
| US8571286B2 (en) | 2007-05-04 | 2013-10-29 | Leica Biosystems Imaging, Inc. | System and method for quality assurance in pathology |
| US9523844B2 (en) | 2008-10-24 | 2016-12-20 | Leica Biosystems Imaging, Inc. | Whole slide fluorescence scanner |
| US8743195B2 (en) | 2008-10-24 | 2014-06-03 | Leica Biosystems Imaging, Inc. | Whole slide fluorescence scanner |
| US8705825B2 (en) | 2009-12-11 | 2014-04-22 | Leica Biosystems Imaging, Inc. | Signal to noise ratio in digital pathology image analysis |
| CN102841082B (en) * | 2012-09-10 | 2014-08-20 | 重庆大学 | Double-signal lung cancer exhalation gas detecting system |
| CN102841082A (en) * | 2012-09-10 | 2012-12-26 | 重庆大学 | Double-signal lung cancer exhalation gas detecting system |
| CN102818798A (en) * | 2012-09-10 | 2012-12-12 | 重庆大学 | Fluorescence detection device for detecting gas exhaled from patient with lung cancer |
Also Published As
| Publication number | Publication date |
|---|---|
| EP0339582B1 (en) | 1994-12-14 |
| DE68919892T2 (en) | 1995-07-06 |
| EP0339582A3 (en) | 1990-11-22 |
| JP2749069B2 (en) | 1998-05-13 |
| DE68919892D1 (en) | 1995-01-26 |
| JPH0228542A (en) | 1990-01-30 |
Similar Documents
| Publication | Publication Date | Title |
|---|---|---|
| EP0339582B1 (en) | Fluorescence microscope system | |
| US4407008A (en) | Method and apparatus for light-induced scanning-microscope display of specimen parameters and of their distribution | |
| JP4441695B2 (en) | Sample inspection method | |
| US5009488A (en) | Filter accessory for an imaging microspectrofluorimeter | |
| JP2001521182A (en) | High precision computer-assisted microscope | |
| US7645971B2 (en) | Image scanning apparatus and method | |
| US7289265B2 (en) | Microscope illumination intensity measuring device | |
| US7326938B2 (en) | Optical system and method for inspecting fluorescently labeled biological specimens | |
| WO2000062549A1 (en) | System and method for detecting with high resolution a large, high content field | |
| US7474777B2 (en) | Device and method for optical measurement of chemical and/or biological samples | |
| US4859063A (en) | Imaging microspectrofluorimeter | |
| US5799773A (en) | Method and apparatus for correcting lens and detector non-uniformities | |
| WO1996037797A1 (en) | Wide field of view microscope and scanning system useful in the microscope | |
| US11442018B2 (en) | System and method for intensity stabilization for quantitative imaging | |
| US20060170916A1 (en) | Method and apparatus for variable-field illumination | |
| US20230221178A1 (en) | Apparatus and a method for fluorescence imaging | |
| JPH1096697A (en) | Fluorescent microscope apparatus | |
| US4943142A (en) | Imaging microspectrofluorimeter | |
| Benedetti et al. | Confocal‐line microscopy | |
| JPH11258512A (en) | Fluorescent microscope | |
| JP2865298B2 (en) | Optical heterodyne fluorescence microscope | |
| CN116593438A (en) | Animal fluorescence hyperspectral imager | |
| Evangelista et al. | Confocal-line optical microscopy | |
| Moreton | Single-cell imaging technology | |
| Beghuin et al. | Compact laser scanning confocal microscope |
Legal Events
| Date | Code | Title | Description |
|---|---|---|---|
| PUAI | Public reference made under article 153(3) epc to a published international application that has entered the european phase |
Free format text: ORIGINAL CODE: 0009012 |
|
| 17P | Request for examination filed |
Effective date: 19890425 |
|
| AK | Designated contracting states |
Kind code of ref document: A2 Designated state(s): DE FR GB |
|
| PUAL | Search report despatched |
Free format text: ORIGINAL CODE: 0009013 |
|
| AK | Designated contracting states |
Kind code of ref document: A3 Designated state(s): DE FR GB |
|
| 17Q | First examination report despatched |
Effective date: 19921008 |
|
| GRAA | (expected) grant |
Free format text: ORIGINAL CODE: 0009210 |
|
| STAA | Information on the status of an ep patent application or granted ep patent |
Free format text: STATUS: THE PATENT HAS BEEN GRANTED |
|
| AK | Designated contracting states |
Kind code of ref document: B1 Designated state(s): DE FR GB |
|
| REF | Corresponds to: |
Ref document number: 68919892 Country of ref document: DE Date of ref document: 19950126 |
|
| ET | Fr: translation filed | ||
| PLBE | No opposition filed within time limit |
Free format text: ORIGINAL CODE: 0009261 |
|
| 26N | No opposition filed | ||
| REG | Reference to a national code |
Ref country code: GB Ref legal event code: IF02 |
|
| REG | Reference to a national code |
Ref country code: GB Ref legal event code: 746 Effective date: 20040511 |
|
| PGFP | Annual fee paid to national office [announced via postgrant information from national office to epo] |
Ref country code: FR Payment date: 20050408 Year of fee payment: 17 |
|
| PGFP | Annual fee paid to national office [announced via postgrant information from national office to epo] |
Ref country code: GB Payment date: 20050420 Year of fee payment: 17 |
|
| PG25 | Lapsed in a contracting state [announced via postgrant information from national office to epo] |
Ref country code: GB Free format text: LAPSE BECAUSE OF NON-PAYMENT OF DUE FEES Effective date: 20060425 |
|
| GBPC | Gb: european patent ceased through non-payment of renewal fee |
Effective date: 20060425 |
|
| REG | Reference to a national code |
Ref country code: FR Ref legal event code: ST Effective date: 20061230 |
|
| PG25 | Lapsed in a contracting state [announced via postgrant information from national office to epo] |
Ref country code: FR Free format text: LAPSE BECAUSE OF NON-PAYMENT OF DUE FEES Effective date: 20060502 |
|
| PGFP | Annual fee paid to national office [announced via postgrant information from national office to epo] |
Ref country code: DE Payment date: 20080502 Year of fee payment: 20 |