EP0431014B1 - Utility metering - Google Patents
Utility metering Download PDFInfo
- Publication number
- EP0431014B1 EP0431014B1 EP19890909584 EP89909584A EP0431014B1 EP 0431014 B1 EP0431014 B1 EP 0431014B1 EP 19890909584 EP19890909584 EP 19890909584 EP 89909584 A EP89909584 A EP 89909584A EP 0431014 B1 EP0431014 B1 EP 0431014B1
- Authority
- EP
- European Patent Office
- Prior art keywords
- zones
- consumption
- utility
- group
- zone
- Prior art date
- Legal status (The legal status is an assumption and is not a legal conclusion. Google has not performed a legal analysis and makes no representation as to the accuracy of the status listed.)
- Expired - Lifetime
Links
Images


Classifications
-
- G—PHYSICS
- G06—COMPUTING; CALCULATING OR COUNTING
- G06Q—INFORMATION AND COMMUNICATION TECHNOLOGY [ICT] SPECIALLY ADAPTED FOR ADMINISTRATIVE, COMMERCIAL, FINANCIAL, MANAGERIAL OR SUPERVISORY PURPOSES; SYSTEMS OR METHODS SPECIALLY ADAPTED FOR ADMINISTRATIVE, COMMERCIAL, FINANCIAL, MANAGERIAL OR SUPERVISORY PURPOSES, NOT OTHERWISE PROVIDED FOR
- G06Q30/00—Commerce
- G06Q30/04—Billing or invoicing
-
- H—ELECTRICITY
- H02—GENERATION; CONVERSION OR DISTRIBUTION OF ELECTRIC POWER
- H02J—CIRCUIT ARRANGEMENTS OR SYSTEMS FOR SUPPLYING OR DISTRIBUTING ELECTRIC POWER; SYSTEMS FOR STORING ELECTRIC ENERGY
- H02J3/00—Circuit arrangements for ac mains or ac distribution networks
- H02J3/12—Circuit arrangements for ac mains or ac distribution networks for adjusting voltage in ac networks by changing a characteristic of the network load
- H02J3/14—Circuit arrangements for ac mains or ac distribution networks for adjusting voltage in ac networks by changing a characteristic of the network load by switching loads on to, or off from, network, e.g. progressively balanced loading
- H02J3/144—Demand-response operation of the power transmission or distribution network
-
- H—ELECTRICITY
- H02—GENERATION; CONVERSION OR DISTRIBUTION OF ELECTRIC POWER
- H02J—CIRCUIT ARRANGEMENTS OR SYSTEMS FOR SUPPLYING OR DISTRIBUTING ELECTRIC POWER; SYSTEMS FOR STORING ELECTRIC ENERGY
- H02J2310/00—The network for supplying or distributing electric power characterised by its spatial reach or by the load
- H02J2310/50—The network for supplying or distributing electric power characterised by its spatial reach or by the load for selectively controlling the operation of the loads
- H02J2310/56—The network for supplying or distributing electric power characterised by its spatial reach or by the load for selectively controlling the operation of the loads characterised by the condition upon which the selective controlling is based
- H02J2310/58—The condition being electrical
- H02J2310/60—Limiting power consumption in the network or in one section of the network, e.g. load shedding or peak shaving
-
- Y—GENERAL TAGGING OF NEW TECHNOLOGICAL DEVELOPMENTS; GENERAL TAGGING OF CROSS-SECTIONAL TECHNOLOGIES SPANNING OVER SEVERAL SECTIONS OF THE IPC; TECHNICAL SUBJECTS COVERED BY FORMER USPC CROSS-REFERENCE ART COLLECTIONS [XRACs] AND DIGESTS
- Y02—TECHNOLOGIES OR APPLICATIONS FOR MITIGATION OR ADAPTATION AGAINST CLIMATE CHANGE
- Y02B—CLIMATE CHANGE MITIGATION TECHNOLOGIES RELATED TO BUILDINGS, e.g. HOUSING, HOUSE APPLIANCES OR RELATED END-USER APPLICATIONS
- Y02B70/00—Technologies for an efficient end-user side electric power management and consumption
- Y02B70/30—Systems integrating technologies related to power network operation and communication or information technologies for improving the carbon footprint of the management of residential or tertiary loads, i.e. smart grids as climate change mitigation technology in the buildings sector, including also the last stages of power distribution and the control, monitoring or operating management systems at local level
- Y02B70/3225—Demand response systems, e.g. load shedding, peak shaving
-
- Y—GENERAL TAGGING OF NEW TECHNOLOGICAL DEVELOPMENTS; GENERAL TAGGING OF CROSS-SECTIONAL TECHNOLOGIES SPANNING OVER SEVERAL SECTIONS OF THE IPC; TECHNICAL SUBJECTS COVERED BY FORMER USPC CROSS-REFERENCE ART COLLECTIONS [XRACs] AND DIGESTS
- Y02—TECHNOLOGIES OR APPLICATIONS FOR MITIGATION OR ADAPTATION AGAINST CLIMATE CHANGE
- Y02P—CLIMATE CHANGE MITIGATION TECHNOLOGIES IN THE PRODUCTION OR PROCESSING OF GOODS
- Y02P80/00—Climate change mitigation technologies for sector-wide applications
- Y02P80/10—Efficient use of energy, e.g. using compressed air or pressurized fluid as energy carrier
-
- Y—GENERAL TAGGING OF NEW TECHNOLOGICAL DEVELOPMENTS; GENERAL TAGGING OF CROSS-SECTIONAL TECHNOLOGIES SPANNING OVER SEVERAL SECTIONS OF THE IPC; TECHNICAL SUBJECTS COVERED BY FORMER USPC CROSS-REFERENCE ART COLLECTIONS [XRACs] AND DIGESTS
- Y04—INFORMATION OR COMMUNICATION TECHNOLOGIES HAVING AN IMPACT ON OTHER TECHNOLOGY AREAS
- Y04S—SYSTEMS INTEGRATING TECHNOLOGIES RELATED TO POWER NETWORK OPERATION, COMMUNICATION OR INFORMATION TECHNOLOGIES FOR IMPROVING THE ELECTRICAL POWER GENERATION, TRANSMISSION, DISTRIBUTION, MANAGEMENT OR USAGE, i.e. SMART GRIDS
- Y04S20/00—Management or operation of end-user stationary applications or the last stages of power distribution; Controlling, monitoring or operating thereof
- Y04S20/20—End-user application control systems
- Y04S20/222—Demand response systems, e.g. load shedding, peak shaving
-
- Y—GENERAL TAGGING OF NEW TECHNOLOGICAL DEVELOPMENTS; GENERAL TAGGING OF CROSS-SECTIONAL TECHNOLOGIES SPANNING OVER SEVERAL SECTIONS OF THE IPC; TECHNICAL SUBJECTS COVERED BY FORMER USPC CROSS-REFERENCE ART COLLECTIONS [XRACs] AND DIGESTS
- Y04—INFORMATION OR COMMUNICATION TECHNOLOGIES HAVING AN IMPACT ON OTHER TECHNOLOGY AREAS
- Y04S—SYSTEMS INTEGRATING TECHNOLOGIES RELATED TO POWER NETWORK OPERATION, COMMUNICATION OR INFORMATION TECHNOLOGIES FOR IMPROVING THE ELECTRICAL POWER GENERATION, TRANSMISSION, DISTRIBUTION, MANAGEMENT OR USAGE, i.e. SMART GRIDS
- Y04S50/00—Market activities related to the operation of systems integrating technologies related to power network operation or related to communication or information technologies
- Y04S50/12—Billing, invoicing, buying or selling transactions or other related activities, e.g. cost or usage evaluation
Definitions
- the present invention relates to utility metering.
- the present invention seeks to enable the use of utility metering data by the consumer, especially industrial consumers, to allow the consumer to ensure greater efficiency in the use of the utilities.
- a method of monitoring the consumption of utilities in business premises in which the premises are notionally divided into zones, each of which contains at least one utility load to be supplied, and characterised in that utility metering means are associated with each zone, to record consumption within the associated zone, the zones are notionally combined into groups, each group including all of those zones which contribute to the provision of a specified product or service, and analysis means are provided in relation to each group, and are used to:
- the zones are notionally combined by providing the analysis means with data identifying the zones which constitute each group.
- the identifying data may preferably be changed, whereby the groups may be re-organised.
- Each zone may include loads for a plurality of utilities, and the utility metering means associated with each zone may record the consumption of each utility within the associated zone.
- the analysis means may be used to separately combine data relating to the consumption of each utility within each group of zones, to provide data relating to the total consumption of each utility within each group.
- the analysis means may be used to combine all data relating to consumption of any utility within each group of zones, to provide data relating to the total utility consumption of each group.
- the analysis means may be operable to combine consumption data with tariff data to provide cost data relating to utility consumption costs.
- Additional utility metering means used to record quantities of a utility supplied to a zone or zones
- the analysis means may be used to compare the quantity of the utility supplied to the zone or zones and the measured utility consumption within that zone or those zones, to detect losses.
- the detected losses may be apportioned to the zones in,which the losses occur, in proportion to the measured consumption within those zones, the apportioned losses being thereafter considered as additional consumption within the zones to which the losses are apportioned.
- the invention also provides apparatus for monitoring the consumption of utilities in business premises notionally divided into zones each containing at least one utility load to be supplied, characterised in that the apparatus comprises utility metering means associated with each notional zone of the premises and operable to record consumption within the associated zone, and analysis means operable to analyse consumption data relating to the zones of groups of zones, into which the zones are notionally divided, each notional group including all of those zones which contribute to the provision of a specified product or service, and in that the analysis means are further operable in relation to each group to:
- the analysis means comprise means for storing data identifying the zones which are notionally combined to constitute each group.
- the identifying data may preferably be changed, whereby the groups may be re-organised.
- Each zone may include loads for a plurality of utilities, the utility metering means associated with each zone recording the consumption of each utility within the associated zone.
- the analysis means may be operable to separately combine data relating to the consumption of each utility within each group of zones, to provide data relating to the total consumption of each utility within each group.
- the analysis means may be operable to combine all data relating to consumption of any utility within each group of zones, to provide data relating to the total utility consumption of each group.
- the analysis means may be operable to combine consumption data with tariff data to provide cost data relating to utility consumption costs.
- additional utility metering means operable to record quantities of a utility supplied to a zone or zones
- the analysis means may be operable to compare the quantity of the utility supplied to the zone or zones and the measured utility consumption within that zone or those zones, to detect losses.
- the analysis means is operable to apportion detected losses to the zones in which the losses occur, in proportion to the measured consumption within those zones, the apportioned losses being thereafter considered as additional consumption within the zones to which the losses are apportioned.
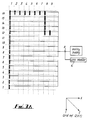
- Fig. 1 schematically represents the premises of a business having three sites of operation. Each site is divided notionally into a series of zones 10, shown for convenience as square zones on a grid of 9 columns and 16 rows. Each zone includes at least one machine or other utility load (not shown in Fig. 1). Zones are notional only, and are therefore not necessarily square, nor are they necessarily all of equal shape or size. Each zone has associated with it utility metering means (not shown in Fig. 1) for metering the consumption of utilities within that zone.
- a zone 10 is shown in more detail in Fig. 2.
- the zone includes one or more utility loads 110, such as machines. These are supplied with utilities from a utility supply 112 through utility metering means 114.
- Fig. 2 shows the utility supply 112 supplying three utilities, but different numbers of utilities could be supplied in practice, and each load 110 may not require all of the utilities supplied to the zone 10.
- the meter 114 is connected to a computer 116 local to the zone and which has an associated store 118 for recording metered consumption data produced by the meter 114.
- the computer 116 is also connected to the load 110 to allow the computer 116 to control the load 110, such as by setting the maximum operating level of the load 110.
- the computer 116 is in communication with a central analysis computer 120. Communication may be direct, or may be through a group computer 122 in communication with computers in several zones, to provide a buffer between the computers 116 and the central computer 120.
- the group computer 122 may have associated memory 124 to facilitate its use as a buffer.
- Communication between the computer 120 and the computers 116 is two-way, so that the computer 120 may receive consumption data from the zones, and may send control data to the zones to control consumption in dependence on the result of the analysis carried out by the computer 120, to be described.
- Zone grouping data is stored at 126 to identify the selection of zones 10 which are to be treated as a group for the purposes of the analysis.
- a store 128 is used by the central computer 120 for storing metered consumption data received from the zones.
- the store 128 may store raw data and also processed data.
- Tariff data is stored at 130 to allow the computer to determine the cost of the utilities consumed, by combining tariff data and consumption data.
- Asset data is stored at 132 and concerns the expected utility consumption within each zone 10 under each of a set of operating conditions (such as full load, partial load etc.).
- Appropriate input devices are provided at 134 to allow the computer 120 to be controlled, and also to allow data stored at 126, 130 and 132 to be modified as required.
- Appropriate output means are provided at 136 for the output of the results of the analysis.
- Fig. 2 The apparatus has been shown highly schematically in Fig. 2 to indicate that many variations are possible in the practical implementation of a system like the one described. Many aspects will depend on particular choices of hardware and may also depend on other factors of the operating conditions.
- the grey shading 12 indicates the notional combining of zones into groups, each group including all of those zones which contribute to the provision of a specific product or service.
- site 3 is responsible for finishing the manufacture of a product which is made from sub-products manufactured at site 1 and at site 2, respectively.
- Raw materials for one sub-product enter site 1 at zone (1, 1) (indicated by the arrow SP1) and proceed along the shaded line of zones until leaving site 1 from zone (9, 12).
- the first sub-product then enters site 3 at zone (3, 1).
- Raw materials for the second sub-product enter site 2 at zone (1, 1) (indicated by the arrow SP2) and leave at zone (9, 7) to enter site 3 at zone (1, 1).
- the two sub-products are combined at zone (2, 3) of site 3 and are further processed into the finished product which is ready to leave site 3 from zone (2, 16).
- the utility metering means 114 associated with each zone of the 3 sites continuously produces consumption data for the or each utility consumed in the zone and this data may be stored or passed to the central analysis means (the computer 120). Consumption data is preferably sent with other information which characterises that data.
- the characterising information may indicate the following:
- Data included in each batch transmitted to or from the zone may include the following sorts of data:
- Information of this type received from all the zones of all the sites of the business can be analysed by the computer 120 in many different ways, by selecting some or all of the constituents of the data. For instance, data relating to electricity consumption in each zone of the group of zones used for the manufacture of a particular product can be added together to provide a figure for the total electricity consumption associated with the production of that product. Similar calculations can be conducted in relation to other utilities, or the total consumption of all utilities for that group can be calculated to provide a figure for the total cost of utility consumption as an overhead in the production of that product.
- the analysis means 120 has a store containing asset data.
- This asset data gives the expected utility consumption in the associated zone according to parameters such as the rate of operation of machinery, or the rate of throughput of products.
- the analysis means 120 By performing similar operations on the asset data and the consumption data, it is possible for the analysis means 120 to make a comparison between the predicted consumption which should be occuring, and the consumption which is actually occuring. This allows an early warning to be given if the actual consumption strays significantly from the expected consumption.
- the analysis means 120 is able to send instructions back to the zones in order to control machinery and modify the consumption in order to increase the efficiency of utility consumption, if any inefficiencies are detectable from these comparisons.
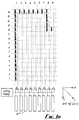
- Figs. 3A and 3B show two extensions of the ideas outlined above, and which take account of losses which occur in the distribution or usage of the utilities.
- monitoring units are included at various points in the distribution network of each utility to measure the amount of utility actually supplied to that point. This figure can be compared with the actual consumption metered in the zones supplied through that point in order to determine any losses which may be occuring in the distribution network.
- the utility is supplied to the premises at a single point A from which the utility is distributed to all of the zones on the premises.
- a single monitoring device 14 at A records the amount of the utility supplied to the premises and supplies the information to the analysis means 120. Thus, the total losses which occur between the point A and the utility loads in the zones can be determined.
- the losses which are detected are attributed to the zones in which the losses may be occuring, in proportion to the metered consumption in those zones.
- the apportioned losses are treated as additional consumption by those zones, so that calculations such as the total utility consumption in producing a product can correctly reflect associated losses as well as intentional utility usage.
- each zone could include more than one utility load, it may be convenient or desirable for the zone to be broken down into subzones, each containing only one utility load, and having associated utility metering means and loss monitoring equipment. Data would then be sent from the sub-zones to control apparatus associated with the whole zone, for onward transmission from the zone to the analysis means.
- information moves between zones and the analysis means through a group computer associated with a group of zones.
- equipment in each zone communicates only with the group computer, and the analysis means communicates with the group computer rather than directly with the apparatus within each zone.
- the group computer can therefore be programmed to perform preliminary analysis on the data collected from the zones.
- the group computer may also be programmed and provided with memory sufficient to allow it to run routines for interrogating zones on a regular basis.
- the provision of storage at the group computer reduces the risk of data being lost as a result of faulty transmission between the group computer and the analysis means.
Abstract
Description
- The present invention relates to utility metering.
- The use of utilities has hitherto been metered by the utility supplier, in order to ensure that the consumer (whether industrial or domestic) is correctly charged for any utility supplied to the consumer's premises.
- An energy management system is described in the Proceedings of the Eight Triennial World Congress of the International Federation of Automatic Control (Pergamon Press, Oxford, GB) at pages 3213 to 3218. The arrangement compares actual consumption in an industrial plant with a set upper limit, to allow load shedding when the limit is exceeded. Published document EP-A-0003010 describes an arrangement for limiting the power demand of a campus of buildings, in which the total power usage of the campus is monitored by a single meter.
- The present invention seeks to enable the use of utility metering data by the consumer, especially industrial consumers, to allow the consumer to ensure greater efficiency in the use of the utilities.
- According to the invention, there is provided a method of monitoring the consumption of utilities in business premises, in which the premises are notionally divided into zones, each of which contains at least one utility load to be supplied, and characterised in that utility metering means are associated with each zone, to record consumption within the associated zone, the zones are notionally combined into groups, each group including all of those zones which contribute to the provision of a specified product or service, and analysis means are provided in relation to each group, and are used to:
- (i) Receive utility consumption data relating to the zones of that group and to combine the received data to provide data concerning the total measured utility consumption within that group;
- (ii) Store asset data relating to the zones of that group and concerning the expected utility consumption within each of the zones under each of a set of operating conditions, and combine asset data relating to the zones of that group to provide data concerning the total expected utility consumption within that group,
- (iii) Compare the total expected utility consumption data with the total measured utility consumption data; and
- (iv) Supply control data to a zone or zones within that group to enable utility consumption to be controlled in dependence on the result of the comparison.
- Preferably the zones are notionally combined by providing the analysis means with data identifying the zones which constitute each group. The identifying data may preferably be changed, whereby the groups may be re-organised.
- Each zone may include loads for a plurality of utilities, and the utility metering means associated with each zone may record the consumption of each utility within the associated zone. The analysis means may be used to separately combine data relating to the consumption of each utility within each group of zones, to provide data relating to the total consumption of each utility within each group.
- The analysis means may be used to combine all data relating to consumption of any utility within each group of zones, to provide data relating to the total utility consumption of each group. The analysis means may be operable to combine consumption data with tariff data to provide cost data relating to utility consumption costs.
- There may further be provided additional utility metering means used to record quantities of a utility supplied to a zone or zones, and the analysis means may be used to compare the quantity of the utility supplied to the zone or zones and the measured utility consumption within that zone or those zones, to detect losses. The detected losses may be apportioned to the zones in,which the losses occur, in proportion to the measured consumption within those zones, the apportioned losses being thereafter considered as additional consumption within the zones to which the losses are apportioned.
- The invention also provides apparatus for monitoring the consumption of utilities in business premises notionally divided into zones each containing at least one utility load to be supplied, characterised in that the apparatus comprises utility metering means associated with each notional zone of the premises and operable to record consumption within the associated zone, and analysis means operable to analyse consumption data relating to the zones of groups of zones, into which the zones are notionally divided, each notional group including all of those zones which contribute to the provision of a specified product or service, and in that the analysis means are further operable in relation to each group to:
- (i) Receive utility consumption data relating to the zones of that group and to combine the received data to provide data concerning the total measured utility consumption within that group;
- (ii) Store asset data relating to the zones of that group and concerning the expected utility consumption within each of the zones under each of a set of operating conditions, and combine asset data relating to the zones of that group to provide data concerning the total expected utility consumption within that group,
- (iii) Compare the total expected utility consumption data with the total measured utility consumption data; and
- (iv) Supply control data to a zone or zones within that group to enable utility consumption to be controlled in dependent on the result of the comparison.
- Preferably the analysis means comprise means for storing data identifying the zones which are notionally combined to constitute each group. The identifying data may preferably be changed, whereby the groups may be re-organised.
- Each zone may include loads for a plurality of utilities, the utility metering means associated with each zone recording the consumption of each utility within the associated zone. The analysis means may be operable to separately combine data relating to the consumption of each utility within each group of zones, to provide data relating to the total consumption of each utility within each group. The analysis means may be operable to combine all data relating to consumption of any utility within each group of zones, to provide data relating to the total utility consumption of each group. The analysis means may be operable to combine consumption data with tariff data to provide cost data relating to utility consumption costs.
- There are preferably provided additional utility metering means operable to record quantities of a utility supplied to a zone or zones, and the analysis means may be operable to compare the quantity of the utility supplied to the zone or zones and the measured utility consumption within that zone or those zones, to detect losses. Preferably the analysis means is operable to apportion detected losses to the zones in which the losses occur, in proportion to the measured consumption within those zones, the apportioned losses being thereafter considered as additional consumption within the zones to which the losses are apportioned.
- Proposals for the implementation of the present invention will now be described in more detail, by way of example only, and with reference to the accompanying drawings in which:
- Fig. 1 is a schematic representation of a business premises on three sites;
- Fig. 2 shows one zone in more detail; and
- Figs. 3A and 3B indicate alternative implementations of the ideas.
- Fig. 1 schematically represents the premises of a business having three sites of operation. Each site is divided notionally into a series of
zones 10, shown for convenience as square zones on a grid of 9 columns and 16 rows. Each zone includes at least one machine or other utility load (not shown in Fig. 1). Zones are notional only, and are therefore not necessarily square, nor are they necessarily all of equal shape or size. Each zone has associated with it utility metering means (not shown in Fig. 1) for metering the consumption of utilities within that zone. - A
zone 10 is shown in more detail in Fig. 2. The zone includes one ormore utility loads 110, such as machines. These are supplied with utilities from autility supply 112 through utility metering means 114. Fig. 2 shows theutility supply 112 supplying three utilities, but different numbers of utilities could be supplied in practice, and eachload 110 may not require all of the utilities supplied to thezone 10. - The
meter 114 is connected to acomputer 116 local to the zone and which has an associatedstore 118 for recording metered consumption data produced by themeter 114. - The
computer 116 is also connected to theload 110 to allow thecomputer 116 to control theload 110, such as by setting the maximum operating level of theload 110. - In common with the computers in all other zones, the
computer 116 is in communication with acentral analysis computer 120. Communication may be direct, or may be through agroup computer 122 in communication with computers in several zones, to provide a buffer between thecomputers 116 and thecentral computer 120. Thegroup computer 122 may have associatedmemory 124 to facilitate its use as a buffer. - Communication between the
computer 120 and thecomputers 116 is two-way, so that thecomputer 120 may receive consumption data from the zones, and may send control data to the zones to control consumption in dependence on the result of the analysis carried out by thecomputer 120, to be described. - Associated with the
central analysis computer 120, are various stores of data for use in the analysis. Zone grouping data is stored at 126 to identify the selection ofzones 10 which are to be treated as a group for the purposes of the analysis. Astore 128 is used by thecentral computer 120 for storing metered consumption data received from the zones. Thestore 128 may store raw data and also processed data. - Tariff data is stored at 130 to allow the computer to determine the cost of the utilities consumed, by combining tariff data and consumption data.
- Asset data is stored at 132 and concerns the expected utility consumption within each
zone 10 under each of a set of operating conditions (such as full load, partial load etc.). Appropriate input devices are provided at 134 to allow thecomputer 120 to be controlled, and also to allow data stored at 126, 130 and 132 to be modified as required. Appropriate output means are provided at 136 for the output of the results of the analysis. - The apparatus has been shown highly schematically in Fig. 2 to indicate that many variations are possible in the practical implementation of a system like the one described. Many aspects will depend on particular choices of hardware and may also depend on other factors of the operating conditions.
- Returning to Fig. 1, the
grey shading 12 indicates the notional combining of zones into groups, each group including all of those zones which contribute to the provision of a specific product or service. In the example shown,site 3 is responsible for finishing the manufacture of a product which is made from sub-products manufactured atsite 1 and atsite 2, respectively. Raw materials for one sub-product entersite 1 at zone (1, 1) (indicated by the arrow SP1) and proceed along the shaded line of zones until leavingsite 1 from zone (9, 12). The first sub-product then enterssite 3 at zone (3, 1). - Raw materials for the second
sub-product enter site 2 at zone (1, 1) (indicated by the arrow SP2) and leave at zone (9, 7) to entersite 3 at zone (1, 1). The two sub-products are combined at zone (2, 3) ofsite 3 and are further processed into the finished product which is ready to leavesite 3 from zone (2, 16). - The utility metering means 114 associated with each zone of the 3 sites continuously produces consumption data for the or each utility consumed in the zone and this data may be stored or passed to the central analysis means (the computer 120). Consumption data is preferably sent with other information which characterises that data. The characterising information may indicate the following:
- (a) The date and time on which the consumption data is collected .
- (b) The site in which the zone is located.
- (c) Identification of any product of which the product manufactured at the zone constitutes a sub-product.
- (d) Identification of personnel responsible for the operation of machinery or other utility loads in the zone. Personnel may be identified at several layers of a management structure.
- (e) Identification of the zone from which the data was collected.
- (f) Identification of a part of the zone from which the data was collected, if desired.
- (g) Whether the utility load in the zone was operating at the time or data collection.
- Data included in each batch transmitted to or from the zone may include the following sorts of data:
- a) Data transmitted from the
central computer 120 to thecomputer 116 associated with a particular zone. - b) Data transmitted from the zone to the
central computer 120, including utility consumption data - c) Instructions sent to the
zone computer 116 from thecentral computer 120, such as instructions to control the rate of operation of a machine, or instructions to turn a machine on or off. - Information of this type received from all the zones of all the sites of the business can be analysed by the
computer 120 in many different ways, by selecting some or all of the constituents of the data. For instance, data relating to electricity consumption in each zone of the group of zones used for the manufacture of a particular product can be added together to provide a figure for the total electricity consumption associated with the production of that product. Similar calculations can be conducted in relation to other utilities, or the total consumption of all utilities for that group can be calculated to provide a figure for the total cost of utility consumption as an overhead in the production of that product. - As has been described, the analysis means 120 has a store containing asset data. This asset data gives the expected utility consumption in the associated zone according to parameters such as the rate of operation of machinery, or the rate of throughput of products. By performing similar operations on the asset data and the consumption data, it is possible for the analysis means 120 to make a comparison between the predicted consumption which should be occuring, and the consumption which is actually occuring. This allows an early warning to be given if the actual consumption strays significantly from the expected consumption. The analysis means 120 is able to send instructions back to the zones in order to control machinery and modify the consumption in order to increase the efficiency of utility consumption, if any inefficiencies are detectable from these comparisons.
- It is also possible to provide predictions of expected utility consumption in selected conditions of operation of the utility loads. This facility provides a helpful management tool by enabling the effects of proposed changes in the production techniques to be studied in advance.
- Figs. 3A and 3B show two extensions of the ideas outlined above, and which take account of losses which occur in the distribution or usage of the utilities.
- In each case, monitoring units are included at various points in the distribution network of each utility to measure the amount of utility actually supplied to that point. This figure can be compared with the actual consumption metered in the zones supplied through that point in order to determine any losses which may be occuring in the distribution network.
- In Fig. 3A, the utility is supplied to the premises at a single point A from which the utility is distributed to all of the zones on the premises. A
single monitoring device 14 at A records the amount of the utility supplied to the premises and supplies the information to the analysis means 120. Thus, the total losses which occur between the point A and the utility loads in the zones can be determined. - In a more sophisticated arrangement shown in Fig. 3B, separate
loss monitoring apparatus 16 is supplied for each column of zones. It is therefore possible to determine the losses which occur in any single column so that, for instance, appropriate action can be taken if losses are excessively high in one column, in relation to losses in another column. Again, this information is reported to the analysis means. - In each case, the losses which are detected are attributed to the zones in which the losses may be occuring, in proportion to the metered consumption in those zones. Thus, if one zone is metered as consuming a utility at twice the rate of another zone, twice as much of the loss will be apportioned to it. Thereafter, the apportioned losses are treated as additional consumption by those zones, so that calculations such as the total utility consumption in producing a product can correctly reflect associated losses as well as intentional utility usage.
- It will be appreciated that because each zone could include more than one utility load, it may be convenient or desirable for the zone to be broken down into subzones, each containing only one utility load, and having associated utility metering means and loss monitoring equipment. Data would then be sent from the sub-zones to control apparatus associated with the whole zone, for onward transmission from the zone to the analysis means. In another arrangement which is envisaged, as outlined above, information moves between zones and the analysis means through a group computer associated with a group of zones. Thus, equipment in each zone communicates only with the group computer, and the analysis means communicates with the group computer rather than directly with the apparatus within each zone. The group computer can therefore be programmed to perform preliminary analysis on the data collected from the zones. The group computer may also be programmed and provided with memory sufficient to allow it to run routines for interrogating zones on a regular basis. The provision of storage at the group computer reduces the risk of data being lost as a result of faulty transmission between the group computer and the analysis means.
Claims (18)
- A method of monitoring the consumption of utilities in business premises, in which the premises are notionally divided into zones, each of which contains at least one utility load to be supplied, and characterised in that utility metering means are associated with each zone, to record consumption within the associated zone, the zones are notionally combined into groups, each group including all of those zones which contribute to the provision of a specified product or service, and analysis means are provided, and are used in relation to each group to:(i) Receive utility consumption data relating to the zones of that group and to combine the received data to provide data concerning the total measured utility consumption within that group;(ii) Store asset data relating to the zones of that group and concerning the expected utility consumption within each of the zones under each of a set of operating conditions, and combine asset data relating to the zones of that group to provide data concerning the total expected utility consumption with that group;(iii) Compare the total expected utility consumption data with the total measured utility consumption data; and(iv) Supply control data to a zone or zones within that group to enable utility consumption to be controlled in dependence on the result of the comparison.
- A method according to claim 1, further characterised in that the zones are notionally combined by providing the analysis means with data identifying the zones which constitute each group.
- A method according to claim 2, further characterised in that the identifying data may be changed, whereby the groups may be re-organised.
- A method according to any preceding claim, further characterised in that each zone includes loads for a plurality of utilities, and the utility metering means associated with each zone may record the consumption of each utility within the associated zone.
- A method according to claim 4, further characterised in that the analysis means are used to separately combine data relating to the consumption of each utility within each group of zones, to provide data relating to the total consumption of each utility within each group.
- A method according to any preceding claim, further characterised in that the analysis means are used to combine all data relating to consumption of any utility within each group of zones, to provide data relating to the total utility consumption of each group.
- A method according to any preceding claim, further characterised in that the analysis means are operable to combine consumption data with tariff data to provide cost data relating to utility consumption costs.
- A method according to any preceding claim, further characterised in that there are provided additional utility metering means used to record quantities of a utility supplied to a zone or zones, and wherein the analysis means are used to compare the quantity of the utility supplied to the zone or zones and the measured utility consumption within that zone or those zones, to detect losses.
- A method according to claim 8, further characterised in that the detected losses are apportioned to the zones in which the losses occur, in proportion to the measured consumption within those zones, the apportioned losses being thereafter considered as additional consumption within the zones to which the losses are apportioned.
- Apparatus for monitoring the consumption of utilities in business premises notionally divided into zones each containing at least one utility load to be supplied, characterised in that the apparatus comprises utility metering means associated with each notional zone of the premises and operable to record consumption within the associated zone, and analysis means operable to analyse consumption data relating to the zones of groups of zones, into which the zones are notionally divided, each notional group including all of those zones which contribute to the provision of a specified product or service, and in that the analysis means are further operable in relation to each group to:(i) Receive utility consumption data relating to the zones of that group and to combine the received data to provide data concerning the total measured utility consumption within that group;(ii) Store asset data relating to the zones of that group and concerning the expected utility consumption within each of the zones under each of a set of operating conditions, and combine asset data relating to the zones of that group to provide data concerning the total expected utility consumption with that group;(iii) Compare the total expected utility consumption data with the total measured utility consumption data; and(iv) Supply control data to a zone or zones within that group to enable utility consumption to be controlled in dependence on the result of the comparison.
- Apparatus according to claim 10, further characterised in that the analysis means comprises means for storing data identifying the zones which are notionally combined to constitute each group.
- Apparatus according to claim 11, further characterised in that the data may be changed, whereby the groups may be re-organised.
- Apparatus according to any of claims 10 to 12, further characterised in that each zone includes loads for a plurality of utilities, and the utility metering means associated with each zone records the consumption of each utility within the associated zone.
- Apparatus according to claim 13, further characterised in that the analysis means is operable to separately combine data relating to the consumption of each utility within each group of zones, to provide data relating to the total consumption of each utility within each group.
- Apparatus according to any of claims 10 to 14, further characterised in that the analysis means are operable to combine all data relating to consumption of any utility within each group of zones, to provide data relating to the total utility consumption of each group.
- Apparatus according to any of claims 10 to 15, further characterised in that the analysis means are operable to combine consumption data with tariff data to provide cost data relating to utility consumption costs.
- Apparatus according to any of claims 10 to 16, further characterised in that there are provided additional utility metering means operable to record quantities of a utility supplied to a zone or zones, and the analysis means are operable to compare the quantity of the utility supplied to the zone or zones and the measured utility consumption within that zone or zones, to detect losses.
- Apparatus according to claim 17, further characterised in that the analysis means is operable to apportion detected losses to the zones in which the losses occur, in proportion to the measured consumption within those zones, the apportioned losses being thereafter considered as additional consumption within the zones to which the losses are apportioned.
Priority Applications (1)
| Application Number | Priority Date | Filing Date | Title |
|---|---|---|---|
| AT89909584T ATE90164T1 (en) | 1988-08-23 | 1989-08-11 | DETECTION OF CONSUMPTION VALUES. |
Applications Claiming Priority (4)
| Application Number | Priority Date | Filing Date | Title |
|---|---|---|---|
| GB888820008A GB8820008D0 (en) | 1988-08-23 | 1988-08-23 | Data transmission system |
| GB8820008 | 1988-08-23 | ||
| GB8911661 | 1989-05-20 | ||
| GB8911661A GB8911661D0 (en) | 1989-05-20 | 1989-05-20 | Utility metering |
Publications (2)
| Publication Number | Publication Date |
|---|---|
| EP0431014A1 EP0431014A1 (en) | 1991-06-12 |
| EP0431014B1 true EP0431014B1 (en) | 1993-06-02 |
Family
ID=26294313
Family Applications (1)
| Application Number | Title | Priority Date | Filing Date |
|---|---|---|---|
| EP19890909584 Expired - Lifetime EP0431014B1 (en) | 1988-08-23 | 1989-08-11 | Utility metering |
Country Status (8)
| Country | Link |
|---|---|
| US (1) | US5404136A (en) |
| EP (1) | EP0431014B1 (en) |
| JP (1) | JPH04501194A (en) |
| AU (1) | AU622215B2 (en) |
| CA (1) | CA1330579C (en) |
| DE (1) | DE68906894T2 (en) |
| GB (1) | GB2239993B (en) |
| WO (1) | WO1990002379A1 (en) |
Cited By (1)
| Publication number | Priority date | Publication date | Assignee | Title |
|---|---|---|---|---|
| EP2201391A4 (en) * | 2007-09-11 | 2017-01-25 | Universidade Federal de Minas Gerais-UFMG | Method and device for measuring and monitoring |
Families Citing this family (62)
| Publication number | Priority date | Publication date | Assignee | Title |
|---|---|---|---|---|
| JPH06251030A (en) * | 1993-02-24 | 1994-09-09 | Hitachi Ltd | City lifeline operation management system |
| US5491473A (en) * | 1993-03-31 | 1996-02-13 | Euro Cp S.A.R.L. | System for remote data collecting, method implemented in this system and data collector device |
| JPH08182194A (en) * | 1994-12-27 | 1996-07-12 | Mark Tec:Kk | Maximum demand power controller |
| US5838258A (en) * | 1996-11-08 | 1998-11-17 | Saar; David A. | System for monitoring the use of heat energy in water devices in an individual unit of a multi-unit building |
| US6161100A (en) * | 1996-11-08 | 2000-12-12 | Saar; David A. | System for billing individual units of a multi-unit building for water use and for water related energy use |
| US6377190B1 (en) | 1996-11-08 | 2002-04-23 | David A. Saar | System for monitoring water consuming structures in an individual unit of a multi-unit building |
| US7486782B1 (en) | 1997-09-17 | 2009-02-03 | Roos Charles E | Multifunction data port providing an interface between a digital network and electronics in residential or commercial structures |
| US6728646B2 (en) * | 1998-02-23 | 2004-04-27 | Enerwise Global Technologies, Inc. | Energy information system and sub-measurement board for use therewith |
| US6393775B1 (en) | 1998-04-24 | 2002-05-28 | Udo Ingmar Staschik | Utilities container |
| US6366889B1 (en) | 1998-05-18 | 2002-04-02 | Joseph A. Zaloom | Optimizing operational efficiency and reducing costs of major energy system at large facilities |
| US6122603A (en) * | 1998-05-29 | 2000-09-19 | Powerweb, Inc. | Multi-utility energy control system with dashboard |
| US6311105B1 (en) | 1998-05-29 | 2001-10-30 | Powerweb, Inc. | Multi-utility energy control system |
| US6178362B1 (en) * | 1998-09-24 | 2001-01-23 | Silicon Energy Corp. | Energy management system and method |
| US6636893B1 (en) | 1998-09-24 | 2003-10-21 | Itron, Inc. | Web bridged energy management system and method |
| US6714977B1 (en) | 1999-10-27 | 2004-03-30 | Netbotz, Inc. | Method and system for monitoring computer networks and equipment |
| US7392309B2 (en) * | 1999-10-27 | 2008-06-24 | American Power Conversion Corporation | Network appliance management |
| US7330886B2 (en) * | 1999-10-27 | 2008-02-12 | American Power Conversion Corporation | Network appliance management |
| US7249043B1 (en) | 2000-03-10 | 2007-07-24 | E.P.M., Inc. | Computer program and method for reducing HVAC demand for energy |
| US6697951B1 (en) * | 2000-04-26 | 2004-02-24 | General Electric Company | Distributed electrical power management system for selecting remote or local power generators |
| US20020082748A1 (en) * | 2000-06-15 | 2002-06-27 | Internet Energy Systems, Inc. | Utility monitoring and control systems |
| US6868293B1 (en) | 2000-09-28 | 2005-03-15 | Itron, Inc. | System and method for energy usage curtailment |
| US6577962B1 (en) | 2000-09-28 | 2003-06-10 | Silicon Energy, Inc. | System and method for forecasting energy usage load |
| US20040059815A1 (en) * | 2001-01-24 | 2004-03-25 | Buckingham Duane W. | Guest room service and control system |
| US8271626B2 (en) | 2001-01-26 | 2012-09-18 | American Power Conversion Corporation | Methods for displaying physical network topology and environmental status by location, organization, or responsible party |
| EP1360796B1 (en) * | 2001-01-26 | 2009-12-23 | American Power Conversion Corporation | Method and system for a set of network appliances which can be connected to provide enhanced collaboration, scalability, and reliability |
| WO2002077581A1 (en) * | 2001-03-22 | 2002-10-03 | Fernando Milanes Garcia-Moreno | Electronic method and system for instant creation and storage of consumption histograms in drinkable water tapping points |
| US7069161B2 (en) * | 2002-01-17 | 2006-06-27 | Gristina Family Trust | System for managing resource infrastructure and resource consumption in real time |
| WO2003085798A2 (en) * | 2002-04-01 | 2003-10-16 | Battelle Memorial Institute | Energy management system |
| US7779026B2 (en) | 2002-05-03 | 2010-08-17 | American Power Conversion Corporation | Method and apparatus for collecting and displaying network device information |
| GB2394077B (en) * | 2002-10-07 | 2005-11-30 | Abb Ltd | Consumption meter |
| AU2002348737B2 (en) * | 2002-12-19 | 2008-04-17 | Council Of Scientific And Industrial Research | An energy efficient data acquisition system and a computer controlled energy monitoring system incorporating the same |
| WO2004092907A2 (en) * | 2003-04-14 | 2004-10-28 | Netbotz, Inc. | Extensible sensor monitoring, alert processing and notification system and method |
| US7542963B2 (en) | 2003-04-14 | 2009-06-02 | American Power Conversion Corporation | Method and system for journaling and accessing sensor and configuration data |
| US8566292B2 (en) | 2003-04-14 | 2013-10-22 | Schneider Electric It Corporation | Method and system for journaling and accessing sensor and configuration data |
| EP1616237B1 (en) * | 2003-04-14 | 2017-10-25 | Schneider Electric IT Corporation | Environmental monitoring device |
| US7627651B2 (en) * | 2003-10-27 | 2009-12-01 | American Power Conversion Corporation | System and method for network device communication |
| US8145748B2 (en) | 2004-12-13 | 2012-03-27 | American Power Conversion Corporation | Remote monitoring system |
| US7711814B1 (en) | 2004-12-13 | 2010-05-04 | American Power Conversion Corporation | Method and system for remote monitoring of a power supply device with user registration capability |
| US8327656B2 (en) * | 2006-08-15 | 2012-12-11 | American Power Conversion Corporation | Method and apparatus for cooling |
| US8322155B2 (en) * | 2006-08-15 | 2012-12-04 | American Power Conversion Corporation | Method and apparatus for cooling |
| US9568206B2 (en) * | 2006-08-15 | 2017-02-14 | Schneider Electric It Corporation | Method and apparatus for cooling |
| US20080142068A1 (en) * | 2006-12-18 | 2008-06-19 | American Power Conversion Corporation | Direct Thermoelectric chiller assembly |
| US7681404B2 (en) | 2006-12-18 | 2010-03-23 | American Power Conversion Corporation | Modular ice storage for uninterruptible chilled water |
| US8425287B2 (en) * | 2007-01-23 | 2013-04-23 | Schneider Electric It Corporation | In-row air containment and cooling system and method |
| CA2686564C (en) | 2007-05-15 | 2018-04-17 | American Power Conversion Corporation | Methods and systems for managing facility power and cooling |
| US7983798B2 (en) | 2008-09-11 | 2011-07-19 | International Business Machines Corporation | Framework for managing consumption of energy |
| US8214671B2 (en) * | 2008-09-11 | 2012-07-03 | International Business Machines Corporation | Managing dependencies among objects of a system for energy conservation |
| US10296987B2 (en) * | 2008-09-11 | 2019-05-21 | International Business Machines Corporation | Policy-based energy management |
| WO2010048036A2 (en) * | 2008-10-22 | 2010-04-29 | Terratrim, Inc. | Systems and methods for managing utility consumption |
| US20100161146A1 (en) * | 2008-12-23 | 2010-06-24 | International Business Machines Corporation | Variable energy pricing in shortage conditions |
| US20100169227A1 (en) * | 2008-12-31 | 2010-07-01 | International Business Machines Corporation | ENERGY MANAGEMENT AND QUALITY OF SERVICE (QoS) |
| US9519517B2 (en) * | 2009-02-13 | 2016-12-13 | Schneider Electtic It Corporation | Data center control |
| US9778718B2 (en) * | 2009-02-13 | 2017-10-03 | Schneider Electric It Corporation | Power supply and data center control |
| US8560677B2 (en) * | 2009-02-13 | 2013-10-15 | Schneider Electric It Corporation | Data center control |
| US8996180B2 (en) | 2010-09-17 | 2015-03-31 | Schneider Electric It Corporation | System and method for predicting perforated tile airflow in a data center |
| US8825451B2 (en) | 2010-12-16 | 2014-09-02 | Schneider Electric It Corporation | System and methods for rack cooling analysis |
| US8688413B2 (en) | 2010-12-30 | 2014-04-01 | Christopher M. Healey | System and method for sequential placement of cooling resources within data center layouts |
| US8429003B2 (en) | 2011-04-21 | 2013-04-23 | Efficiency3 Corp. | Methods, technology, and systems for quickly enhancing the operating and financial performance of energy systems at large facilities; interpreting usual and unusual patterns in energy consumption; identifying, quantifying, and monetizing hidden operating and financial waste; and accurately measuring the results of implemented energy management solutions-in the shortest amount of time with minimal cost and effort |
| US8990536B2 (en) | 2011-06-01 | 2015-03-24 | Schneider Electric It Corporation | Systems and methods for journaling and executing device control instructions |
| US9830410B2 (en) | 2011-12-22 | 2017-11-28 | Schneider Electric It Corporation | System and method for prediction of temperature values in an electronics system |
| CN104137105B (en) | 2011-12-22 | 2017-07-11 | 施耐德电气It公司 | Impact analysis on temporal event to the temperature in data center |
| CA2861937A1 (en) * | 2012-01-10 | 2013-07-18 | Enbala Power Networks Inc. | Method and system for measurement of resource meters |
Family Cites Families (6)
| Publication number | Priority date | Publication date | Assignee | Title |
|---|---|---|---|---|
| EP0003010A1 (en) * | 1977-12-27 | 1979-07-11 | United Technologies Corporation | Method and apparatus for limiting the power demand in heating-ventilation-air conditioning |
| US4337401A (en) * | 1981-01-23 | 1982-06-29 | Honeywell Inc. | Adaptive load shedding |
| US4489386A (en) * | 1982-02-03 | 1984-12-18 | At&T Bell Laboratories | Device control system |
| US4510398A (en) * | 1983-12-13 | 1985-04-09 | Honeywell Inc. | Add/shed load control according to multiple add/shed sequences |
| GB8412277D0 (en) * | 1984-05-14 | 1984-06-20 | Gen Electric Co Plc | Electricity metering equipment |
| CA1277033C (en) * | 1986-04-30 | 1990-11-27 | Johann Sollinger | Automatic metering apparatus |
-
1989
- 1989-08-11 US US07/659,346 patent/US5404136A/en not_active Expired - Fee Related
- 1989-08-11 DE DE1989606894 patent/DE68906894T2/en not_active Expired - Fee Related
- 1989-08-11 WO PCT/GB1989/000921 patent/WO1990002379A1/en active IP Right Grant
- 1989-08-11 AU AU40763/89A patent/AU622215B2/en not_active Ceased
- 1989-08-11 EP EP19890909584 patent/EP0431014B1/en not_active Expired - Lifetime
- 1989-08-11 JP JP1508996A patent/JPH04501194A/en active Pending
- 1989-08-22 CA CA 609020 patent/CA1330579C/en not_active Expired - Fee Related
-
1991
- 1991-02-11 GB GB9102832A patent/GB2239993B/en not_active Expired - Lifetime
Cited By (1)
| Publication number | Priority date | Publication date | Assignee | Title |
|---|---|---|---|---|
| EP2201391A4 (en) * | 2007-09-11 | 2017-01-25 | Universidade Federal de Minas Gerais-UFMG | Method and device for measuring and monitoring |
Also Published As
| Publication number | Publication date |
|---|---|
| WO1990002379A1 (en) | 1990-03-08 |
| AU4076389A (en) | 1990-03-23 |
| EP0431014A1 (en) | 1991-06-12 |
| DE68906894D1 (en) | 1993-07-08 |
| GB2239993A (en) | 1991-07-17 |
| GB9102832D0 (en) | 1991-04-10 |
| JPH04501194A (en) | 1992-02-27 |
| US5404136A (en) | 1995-04-04 |
| DE68906894T2 (en) | 1993-12-16 |
| AU622215B2 (en) | 1992-04-02 |
| GB2239993B (en) | 1992-09-02 |
| CA1330579C (en) | 1994-07-05 |
Similar Documents
| Publication | Publication Date | Title |
|---|---|---|
| EP0431014B1 (en) | Utility metering | |
| Pang et al. | Evaluation of dynamic programming based methods and multiple area representation for thermal unit commitments | |
| US6122603A (en) | Multi-utility energy control system with dashboard | |
| CN1751535B (en) | An energy efficient data acquisition system and computer controlled energy monitoring system incorporating the same | |
| CA2129476C (en) | Method of and system for order amount calculation | |
| CN104809665B (en) | A kind of power distribution network method for early warning based on improvement Apriori algorithm | |
| CN102222276A (en) | State maintenance method and device for secondary equipment of power grid | |
| David et al. | Dynamic tariffs: theory of utility-consumer interaction | |
| Jonnavithula et al. | Features that influence composite power system reliability worth assessment | |
| EP3693917A1 (en) | Distributed energy resource management device, management method, and management system | |
| Uturbey et al. | Dynamic optimal power flow approach to account for consumer response in short term hydrothermal coordination studies | |
| Bernstein et al. | The economic costs of electricity shortages: A case study of Egypt | |
| Tamsir | Impact assessment of costly remedial actions: Redispatching vs Countertrading | |
| CN109449940B (en) | Emergency control wide area coordination method for coping with dynamic process succession events | |
| Christen et al. | Technical Validation of the RLS Smart Grid Approach to Increase Power Grid Capacity without Physical Grid Expansion. | |
| Mapes | The effect of capacity limitations on safety stock | |
| Yang et al. | Optimal operation strategy of an industrial plant under deregulated electricity market | |
| Shikhin et al. | Significant Events Detection and Identification through Electrical Grid Load Profile | |
| Amelin et al. | On Monte Carlo simulation of electricity markets with uncertainties in precipitation and load forecasts | |
| Teke et al. | Determining Amounts of Energy Saver Devices in an Electronic Industry Using Fuzzy Linear Programming | |
| Fotuhi-Firuzabad et al. | A security based approach for generating unit scheduling | |
| Nelson | Load Management From A Power System Oprator's Perspective | |
| Danket et al. | Designing advance production planning and scheduling optimization model for reduce total cost of the cement production process under time-of-use electricity prices | |
| Kinsner et al. | The optimization of schedules of repairs and repair cut-offs in a power network through the automation of the planning process | |
| Rahman | An ex ante probabilistic study of market power with emphasis on the transmission constraints |
Legal Events
| Date | Code | Title | Description |
|---|---|---|---|
| PUAI | Public reference made under article 153(3) epc to a published international application that has entered the european phase |
Free format text: ORIGINAL CODE: 0009012 |
|
| 17P | Request for examination filed |
Effective date: 19910213 |
|
| AK | Designated contracting states |
Kind code of ref document: A1 Designated state(s): AT BE CH DE FR GB IT LI LU NL SE |
|
| 17Q | First examination report despatched |
Effective date: 19910814 |
|
| RBV | Designated contracting states (corrected) |
Designated state(s): AT BE CH DE FR IT LI LU NL SE |
|
| GRAA | (expected) grant |
Free format text: ORIGINAL CODE: 0009210 |
|
| AK | Designated contracting states |
Kind code of ref document: B1 Designated state(s): AT BE CH DE FR IT LI LU NL SE |
|
| PG25 | Lapsed in a contracting state [announced via postgrant information from national office to epo] |
Ref country code: IT Free format text: LAPSE BECAUSE OF FAILURE TO SUBMIT A TRANSLATION OF THE DESCRIPTION OR TO PAY THE FEE WITHIN THE PRE;WARNING: LAPSES OF ITALIAN PATENTS WITH EFFECTIVE DATE BEFORE 2007 MAY HAVE OCCURRED AT ANY TIME BEFORE 2007. THE CORRECT EFFECTIVE DATE MAY BE DIFFERENT FROM THE ONE RECORDED.SCRIBED TIME-LIMIT Effective date: 19930602 Ref country code: AT Effective date: 19930602 Ref country code: BE Effective date: 19930602 Ref country code: NL Effective date: 19930602 Ref country code: SE Effective date: 19930602 |
|
| REF | Corresponds to: |
Ref document number: 90164 Country of ref document: AT Date of ref document: 19930615 Kind code of ref document: T |
|
| REF | Corresponds to: |
Ref document number: 68906894 Country of ref document: DE Date of ref document: 19930708 |
|
| ET | Fr: translation filed | ||
| PG25 | Lapsed in a contracting state [announced via postgrant information from national office to epo] |
Ref country code: LU Free format text: LAPSE BECAUSE OF NON-PAYMENT OF DUE FEES Effective date: 19930831 |
|
| NLV1 | Nl: lapsed or annulled due to failure to fulfill the requirements of art. 29p and 29m of the patents act | ||
| PLBE | No opposition filed within time limit |
Free format text: ORIGINAL CODE: 0009261 |
|
| STAA | Information on the status of an ep patent application or granted ep patent |
Free format text: STATUS: NO OPPOSITION FILED WITHIN TIME LIMIT |
|
| 26N | No opposition filed | ||
| PGFP | Annual fee paid to national office [announced via postgrant information from national office to epo] |
Ref country code: CH Payment date: 19940720 Year of fee payment: 6 |
|
| PGFP | Annual fee paid to national office [announced via postgrant information from national office to epo] |
Ref country code: FR Payment date: 19950731 Year of fee payment: 7 |
|
| PGFP | Annual fee paid to national office [announced via postgrant information from national office to epo] |
Ref country code: DE Payment date: 19950809 Year of fee payment: 7 |
|
| PG25 | Lapsed in a contracting state [announced via postgrant information from national office to epo] |
Ref country code: LI Effective date: 19950831 Ref country code: CH Effective date: 19950831 |
|
| REG | Reference to a national code |
Ref country code: CH Ref legal event code: PL |
|
| PG25 | Lapsed in a contracting state [announced via postgrant information from national office to epo] |
Ref country code: FR Effective date: 19970430 |
|
| PG25 | Lapsed in a contracting state [announced via postgrant information from national office to epo] |
Ref country code: DE Effective date: 19970501 |
|
| REG | Reference to a national code |
Ref country code: FR Ref legal event code: ST |