EP0609922A2 - Computer detection of microcalcifications in mammograms - Google Patents
Computer detection of microcalcifications in mammograms Download PDFInfo
- Publication number
- EP0609922A2 EP0609922A2 EP94200015A EP94200015A EP0609922A2 EP 0609922 A2 EP0609922 A2 EP 0609922A2 EP 94200015 A EP94200015 A EP 94200015A EP 94200015 A EP94200015 A EP 94200015A EP 0609922 A2 EP0609922 A2 EP 0609922A2
- Authority
- EP
- European Patent Office
- Prior art keywords
- image
- spots
- derivative
- values
- measures
- Prior art date
- Legal status (The legal status is an assumption and is not a legal conclusion. Google has not performed a legal analysis and makes no representation as to the accuracy of the status listed.)
- Granted
Links
Images


Classifications
-
- G—PHYSICS
- G06—COMPUTING; CALCULATING OR COUNTING
- G06T—IMAGE DATA PROCESSING OR GENERATION, IN GENERAL
- G06T7/00—Image analysis
- G06T7/0002—Inspection of images, e.g. flaw detection
- G06T7/0012—Biomedical image inspection
-
- G—PHYSICS
- G16—INFORMATION AND COMMUNICATION TECHNOLOGY [ICT] SPECIALLY ADAPTED FOR SPECIFIC APPLICATION FIELDS
- G16H—HEALTHCARE INFORMATICS, i.e. INFORMATION AND COMMUNICATION TECHNOLOGY [ICT] SPECIALLY ADAPTED FOR THE HANDLING OR PROCESSING OF MEDICAL OR HEALTHCARE DATA
- G16H15/00—ICT specially adapted for medical reports, e.g. generation or transmission thereof
-
- G—PHYSICS
- G06—COMPUTING; CALCULATING OR COUNTING
- G06T—IMAGE DATA PROCESSING OR GENERATION, IN GENERAL
- G06T2207/00—Indexing scheme for image analysis or image enhancement
- G06T2207/30—Subject of image; Context of image processing
- G06T2207/30004—Biomedical image processing
- G06T2207/30068—Mammography; Breast
-
- G—PHYSICS
- G16—INFORMATION AND COMMUNICATION TECHNOLOGY [ICT] SPECIALLY ADAPTED FOR SPECIFIC APPLICATION FIELDS
- G16H—HEALTHCARE INFORMATICS, i.e. INFORMATION AND COMMUNICATION TECHNOLOGY [ICT] SPECIALLY ADAPTED FOR THE HANDLING OR PROCESSING OF MEDICAL OR HEALTHCARE DATA
- G16H30/00—ICT specially adapted for the handling or processing of medical images
- G16H30/20—ICT specially adapted for the handling or processing of medical images for handling medical images, e.g. DICOM, HL7 or PACS
Definitions
- the present invention relates generally to methods for aiding in the detection of cancer by utilizing computer analysis of radiologic images to identify spots corresponding to objects associated with malignancy.
- it relates to methods of aiding in the detection of breast cancer by computer identification of microcalcifications and clusters thereof in mammographic images. More generally, the method can be used for automatic detection of small features in digitized images.
- a method of computer identification of micro-calcifications in digitized mammogram images is known from US-A-4,907,156, which method is also applicable to a related problem of detection of spots in digitized chest X-ray images corresponding to lung nodules.
- spatial filtering was employed to deemphasize both low and very high spatial frequencies in the image attempting to increase the conspicuity of the microcalcifications.
- a difference image was formed of the results of application to the original image of a filter matched to a particular spot size and a median filter.
- An adaptive thresholding technique was used to label spots as calcifications, which spots also had to meet defined shape characteristics.
- the efficacy of the method of J. Dengler et al. is dependent on proper choices for various spatial filter parameters (including positive and negative kernel widths, weight and threshold for the DoG filtering) which generally determine a range of sizes of spots that are detected as microcalcifications. Because of the irregular and frequently elongated nature of the microcalcification shapes of interest, it is not believed advisable to employ a size selective spatial filter which significantly restricts the range of spot sizes detected, particularly in a manner which is substantially independent of their shape. Further it does not seem wise to select candidate microcalcifications by thresholding intensity values. Such criteria may fail to select relatively dull spots which nonetheless have sharp edges.
- various spatial filter parameters including positive and negative kernel widths, weight and threshold for the DoG filtering
- Edge extraction is important in the general field of computer vision.
- An algorithm is discussed in P. Saint-Marc et al., "Adaptive Smoothing: A General Tool for Early Vision” IEEE Transactions on Pattern Analysis and Machine Intelligence, Vol. 13, No. 6, pp. 514-529,1991, which tends to maintain edge definition in filtered range images.
- an object of the present invention to provide a method of aiding detection of cancer by utilizing computer detection of spots in digitized mammogram radiologic images in a manner which is not significantly dependent on the size of the spots and which preserves the locations of their edges or boundaries, from which edge locations, the spots are characterized by the computer as to whether they correspond to objects, in particular microcalcifications, of shape, edge contrast, brightness, and arrangement associated with malignancy. It is a further object of the present invention that such method involve a minimum number of parameters, which are where possible, computed from the image. More generally, it is an object of the invention to detect objects of a predetermined type in a digitized image.
- these objects are satisfied by, with respect to a generated mammogram image stored in a digital storage device or medium accessible to a computer, computing filtered second spatial derivative of intensity values at the pixels of the image, in the form of a Laplacian, the zero crossings of which indicate edges. Regions of negative Laplacian value (which are therefore on the locally brighter side of the edges) are labelled and connected as locally bright spots.
- a plurality of feature measures are computed indicative of the respective shapes, edge contrasts and brightnesses of these locally bright spots, and a weighted combination of these feature measures is used to identify those spots corresponding to objects of the predetermined type, i.e. to microcalcifications of a type associated with cancer. Thereafter, it is detected where the spots identified as microcalcifications are arranged in clusters, and the location of such clusters in the image are displayed on a monitor, or in some other human intelligible form.
- the Laplacian values are determined in a manner that preserves the locations of edges.
- first spatial derivative of intensity values in the X and Y directions i.e. gradient component values
- the first spatial derivative values in the X and Y directions are adaptive filtered by an iterative "adaptive smoothing" technique where in each iteration the strength or weakness of smoothing applied at each point in the image is determined from local conditions.
- measures of dispersion of differences between values of the first spatial derivative at adjoining pixel positions in the X and Y directions for the entire image are formed and smoothing applied to first spatial derivative values in the X and Y directions more strongly where there is little local variation in value relative to the respective dispersion measures, and more weakly where there is relatively great local variation.
- Values of the spatial derivative of the adaptively smoothed first derivative in X and Y directions are computed for each pixel position in the same respective directions to form second spatial derivative of intensity values in the X and Y directions.
- the Laplacian value is determined for each pixel position by adding the second spatial derivative values in the X and Y directions.
- Digitized images are readily available from imaging applications where X-ray image intensifier/camera chain or florescent image plate/laser readout or selenium plate/electrometer readout technologies are employed, without the necessity of scanning film. Such technologies are progressing in their spatial resolution and contrast sensitivities achieved and may soon find widespread use for mammographic applications. Presently, however, X-ray images of the human breast are generally obtained with film-screen technology. Based on studies by others of the resolution needed to properly represent individual microcalcifications in mammograms, available film scanners having spatial resolution of no worse than 0.1 mm per pixel and intensity amplitude resolution of at least 10 (and preferably 12) bits per pixel are required to produce a digitized image suitable for the purposes of the present invention.
- the generation of the digitized X-ray image and its storage, for example as an image data file, on a suitable machine readable medium accessible to a computer workstation (not shown) such as an optical or magnetical disk or RAM memory (not shown) forms the first step 10 in the method of the present invention.
- the computer workstation accesses the stored image information and performs various operations thereon, in the nature of image processing, in order to identify microcalcifications, and in particular to indicate clusters thereof. Such identification will aid early detection of breast cancer and could be used in a variety of operational modes as its efficacy is verified. Improving detection sufficiently to obviate the present practice of double reading would free significant radiologist reading resources.
- microcalcifications of a type associated with malignancy requires significant experience.
- the important and most commonly noted characteristics of microcalcifications of this type are that they are relatively bright spots (in film-screen mammography) usually irregular in shape, e.g. elongated, and/or pointed, have sharp edge contrast with their surrounds, and most importantly, occur in clusters of at least 3 to 5 per square cm. in the radiologic film image.
- the irregular nature of these microcalcifications of interest indicate that it is crucial to preserve the location of edges in the identified spots so that suitable feature measures for classifying the spot can be accurately determined.
- the Laplacian Of a Gaussian is a widely published example of a filtered second spatial derivative operator.
- the technique of using the Zero Crossings of the Filtered Second Derivative (ZCFSD) for detecting and locating edges is based on a significant body of theoretical literature.
- the filtering which is low pass, is designed to decrease the noise in the second derivative.
- the filter is Gaussian.
- such global spatial filtering has the disadvantage of moving edges away from their actual location in the image.
- a filtered second derivative is employed which is produced in a manner that its zero crossings are located at edges in the image.
- FIG. 1 An overview of the present inventive method is apparent from the basic flow chart of Figure 1 (Table I).
- the original radiologic image generated and stored in box or step 10 which image comprises a rectangular array of pixels having respective intensities at each pixel position, is accessible for further processing.
- An example of a portion of an actual original intensity image is shown in Figure 4a and of the intensities along a horizontal line therethrough in Figure 5a.
- the filtered second derivative thereof, in the form of a Laplacian is computed in box 12, in a manner preserving the edge locations as zero crossings and connected regions of negative second derivative proximate the zero crossings are labelled by box 14.
- feature measures are computed from the edge locations of the remaining locally bright spots. These feature measures are used in box 20 to identify or detect those of the locally bright spots which correspond to micro-calcifications of interest. Clusters containing at least three such microcalcifications in a square cm. are identified or detected in box 22. In box 24, these clusters are indicated by the computer in a human intelligible manner, e.g. on a CRT display (not shown) of the original image by circling, brightening or coloring the detected clusters on the display, thereby rendering them conspicuous.
- FIG. 2 The detail of the computation of the filtered second derivative is shown in Figure 2 (Table II).
- the first spatial derivatives of the original intensity image are computed in boxes 26 and 28 for the respective X and Y directions.
- the exemplary result of computation of the first spatial derivative in the X direction is shown in Figures 4b and 5b, giving the first Sobel derivative in the X-direction.
- These computations are made using the well known Sobel 3X3 gradient operators.
- Measures of the dispersions d x and d y of differences between first derivative values at adjoining pixel positions throughout the image in respective X and Y directions are determined in respective boxes 30 and 32.
- the first spatial derivatives in the X and Y directions are adaptive filtered in these directions by boxes 34 and 36, using an iterative adaptive smoothing, that adaptively smooths (in each iteration, convolves with a small averaging mask or kernel having locally adapted weights) first derivative values in the X and Y directions in a manner that there is relatively great smoothing applied where local variation in derivative values relative to the respective measures of dispersion d x and d y in these directions.
- a 3X3 averaging mask is used whose central relative weight to be applied to the first derivative value FD0 at the considered pixel position is unity and whose other eight relative weights to be applied to first derivatives FD S at surrounding pixel positions touching the considered pixel position by a pixel side or corner is: exp -((FD S - FD0)/d)2 where d is respectively d x and d y for smoothing operations in the respective X and Y directions.
- Spatial derivatives are computed in boxes 38 and 40 in respective X and Y directions of the adaptive filtered first spatial derivative of intensity values determined in boxes 34 and 36 to form filtered second derivative values in respective X and Y directions.
- Figures 4d and 5d illustrate the result of taking the spatial derivative, the second Sobel derivative, in the X direction of the adaptive filtered first spatial derivative in the X direction. These spatial derivatives or gradients use the Sobel gradient operators.
- the filtered second spatial derivative values in the respective X and Y directions are added in box 42 to form a Laplacian value at each pixel position.
- the Laplacian is illustrated in Figures 4e and 5e for the exemplary image portion.
- the boundaries of spots are determined from connected regions of negative Laplacian value. These are labelled in accordance with the flow chart of Figure 3.
- all pixel positions having negative Laplacian values are marked by a thresholding operation at the value zero. Those pixel positions having a Laplacian of less than zero are assigned a white value and those having non-negative Laplacian values are assigned a black value.
- block 46 the interiors of marked connected regions of pixels (closed contours) are filled with white values.
- Each connected region is assigned a unique associated number in block 48.
- Block 16 then deletes regions smaller than four pixels and one pixel wide regions or bridges from further consideration, by for example, assigning the deleted regions or pixels to the black level. There results a mask of candidate locally bright regions or spots as illustrated in Figures 4f and 5f for the exemplary image portion.
- microcalcifications are brighter than their surround, tend to have a compact shape, and they tend to have high edge gradients. It is true, however, that some micro-calcifications of interest may appear to violate the assumption of compactness. However, this measure has been included to discriminate microcalcifications from scratches in the film and many fibrous objects such as ducts, blood vessels and support fibers.
- the gradient measure G is computed by 1) for each pixel in the exterior and interior outline regions adding the absolute values of the first derivatives in the X and Y directions determined in boxes 26 and 28, as an approximation of gradient magnitude; 2) computing respective averages of these approximate gradient magnitudes for the pixels of the exterior and interior outline regions; and 3) choosing as the gradient measure G, the greater of the averages for these two regions.
- the detection in box 26 of whether the micro-calcifications identified in box 22 are isolated or grouped in spatial clusters utilizes two techniques. First, data points identifying the locations of the centroids of the microcalcifications are clustered using the single link hierarchical method. All data points that are contained within an area of less than 1 cm square are grouped together. If the reader is unfamiliar with the mathematics of data clustering, see A.K. Jain et al., "Algorithms for Clustering Data", chapter 3, pp. 72-80, Prentice-Hall, Englewood Cliffs, NJ, 1988. Clusters with fewer than three members are considered to be benign, while clusters with 3 or more members are suspicious for malignant disease. It is the suspect clusters which are, by box 26, indicated in a display of the original image.
Abstract
Description
- The present invention relates generally to methods for aiding in the detection of cancer by utilizing computer analysis of radiologic images to identify spots corresponding to objects associated with malignancy. In its more particular respects, it relates to methods of aiding in the detection of breast cancer by computer identification of microcalcifications and clusters thereof in mammographic images. More generally, the method can be used for automatic detection of small features in digitized images.
- Breast cancer is one of the primary causes of death for women in western societies. Because the vast majority of deaths due to cancer that originated in the breast could be prevented by early detection, several national health organizations in the United States now recommend that all women over the age of 40 have regular screening mammograms. In fact, the National Cancer Institute has set a goal of 80% compliance by the end of the decade. To reach this goal, the number of mammograms taken and read in the U.S. would have to double, and in some localities, more than triple. An increase of this magnitude would overload the current capacity to take and interpret mammograms.
- The reading or interpretation of screening mammograms is an art that requires extensive experience and attentiveness to detail. While the radiologist's primary sign for cancer is a mass visible on the mammogram, one of the more sensitive signs is the presence of small relatively bright spots (in film-screen mammography) corresponding to locally increased X-ray attenuation due to minute ( < 5mm in maximum dimension in the film image) deposits of calcium salts known as microcalcifications, each generally of irregular shape, and which are arranged in clusters. In fact, clustered microcalcifications are often the only sign indicating an early in situ malignancy. Unfortunately, these small spots generally appear in the images as obscured by gradations in background produced by surrounding tissue and their visibility is limited by the image's resolution, contrast and signal to noise ratio. Consequently, the probability of their detection by an experienced radiologist is not as high as desirable, making double independent readings a common practice to achieve acceptable results.
- A method of computer identification of micro-calcifications in digitized mammogram images is known from US-A-4,907,156, which method is also applicable to a related problem of detection of spots in digitized chest X-ray images corresponding to lung nodules. Therein, spatial filtering was employed to deemphasize both low and very high spatial frequencies in the image attempting to increase the conspicuity of the microcalcifications. In particular, a difference image was formed of the results of application to the original image of a filter matched to a particular spot size and a median filter. An adaptive thresholding technique was used to label spots as calcifications, which spots also had to meet defined shape characteristics.
- Accurate measurements of area, perimeter and shape of a spot are critical in classifying whether or not it corresponds to a microcalcification of a predetermined type, i.e. associated with malignancy. Yet, prior art methods applied to make spots more conspicuous in radiologic images, such as that above-described, generally fail to preserve the locations of the edges or boundaries of the spots. Global spatial filtering with, for example, a Gaussian shaped filter, tends to smear these edges.
- The problem of preservation of size and shape was addressed in J. Dengler et al. "Segmentation of Micro-calcifications in Mammograms", (citation presently unknown). Therein, Gaussian high pass spatial filtering was used to remove the low frequency structural noise and "Difference of Gaussian" (DoG) spatial filtering was used to locate bright spots within a small range of sizes. Because this processing smoothed the boundaries of the spots, a morphological filter known as a "top-hat" transformation was applied to the original image to attempt to extract the boundaries of the spots. The spots located by the DoG filtering were iteratively expanded in size by topologically unimportant pixels, although not beyond the spot boundaries given by the morphological filter operation.
- The efficacy of the method of J. Dengler et al. is dependent on proper choices for various spatial filter parameters (including positive and negative kernel widths, weight and threshold for the DoG filtering) which generally determine a range of sizes of spots that are detected as microcalcifications. Because of the irregular and frequently elongated nature of the microcalcification shapes of interest, it is not believed advisable to employ a size selective spatial filter which significantly restricts the range of spot sizes detected, particularly in a manner which is substantially independent of their shape. Further it does not seem wise to select candidate microcalcifications by thresholding intensity values. Such criteria may fail to select relatively dull spots which nonetheless have sharp edges.
- Edge extraction is important in the general field of computer vision. An algorithm is discussed in P. Saint-Marc et al., "Adaptive Smoothing: A General Tool for Early Vision" IEEE Transactions on Pattern Analysis and Machine Intelligence, Vol. 13, No. 6, pp. 514-529,1991, which tends to maintain edge definition in filtered range images.
- It is, inter alia, an object of the present invention to provide a method of aiding detection of cancer by utilizing computer detection of spots in digitized mammogram radiologic images in a manner which is not significantly dependent on the size of the spots and which preserves the locations of their edges or boundaries, from which edge locations, the spots are characterized by the computer as to whether they correspond to objects, in particular microcalcifications, of shape, edge contrast, brightness, and arrangement associated with malignancy. It is a further object of the present invention that such method involve a minimum number of parameters, which are where possible, computed from the image. More generally, it is an object of the invention to detect objects of a predetermined type in a digitized image.
- Briefly, these objects are satisfied by, with respect to a generated mammogram image stored in a digital storage device or medium accessible to a computer, computing filtered second spatial derivative of intensity values at the pixels of the image, in the form of a Laplacian, the zero crossings of which indicate edges. Regions of negative Laplacian value (which are therefore on the locally brighter side of the edges) are labelled and connected as locally bright spots. A plurality of feature measures are computed indicative of the respective shapes, edge contrasts and brightnesses of these locally bright spots, and a weighted combination of these feature measures is used to identify those spots corresponding to objects of the predetermined type, i.e. to microcalcifications of a type associated with cancer. Thereafter, it is detected where the spots identified as microcalcifications are arranged in clusters, and the location of such clusters in the image are displayed on a monitor, or in some other human intelligible form.
- The Laplacian values are determined in a manner that preserves the locations of edges. In particular, first spatial derivative of intensity values in the X and Y directions (i.e. gradient component values) are computed for each pixel position. Then, the first spatial derivative values in the X and Y directions are adaptive filtered by an iterative "adaptive smoothing" technique where in each iteration the strength or weakness of smoothing applied at each point in the image is determined from local conditions. In particular, measures of dispersion of differences between values of the first spatial derivative at adjoining pixel positions in the X and Y directions for the entire image are formed and smoothing applied to first spatial derivative values in the X and Y directions more strongly where there is little local variation in value relative to the respective dispersion measures, and more weakly where there is relatively great local variation. Values of the spatial derivative of the adaptively smoothed first derivative in X and Y directions are computed for each pixel position in the same respective directions to form second spatial derivative of intensity values in the X and Y directions. The Laplacian value is determined for each pixel position by adding the second spatial derivative values in the X and Y directions.
- Other objects, features and advantages of the present invention will become apparent upon perusal of the following detailed description when taken in conjunction with the appended drawing, wherein:
- Figure 1 is a basic flow chart of the method of the present invention;
- Figure 2 is a flow chart of the detail of a filtered second derivative computation block in Figure 1;
- Figure 3 is a flow chart of the detail of a connected negative region labelling block in Figure 1;
- Figures 4a through 4f are exemplary 2D images displaying pixel values at various stages of image processing in accordance with the flow chart of Figure 1, wherein, for the purpose of display, the intensities of the pixels of the images of Figures 4b through 4e are produced by adding a positive bias to their bipolar values equal to the largest negative value, so that a large negative value for a pixel appears as black; and
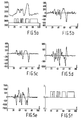
- Figures 5a through 5f are exemplary graphs of pixel value versus position along a horizontal line 5-5 in Figure 4a at the same stages of image processing as indicated in Figures 4a through 4f, respectively. The graph of Figure 5f also appears in Figure 5a as an aid in correlating between them.
- In the following preferred embodiments, reference is made to X-ray mammographs. It is to be understood that the same technique can also be applied in other types of images.
- Digitized images are readily available from imaging applications where X-ray image intensifier/camera chain or florescent image plate/laser readout or selenium plate/electrometer readout technologies are employed, without the necessity of scanning film. Such technologies are progressing in their spatial resolution and contrast sensitivities achieved and may soon find widespread use for mammographic applications. Presently, however, X-ray images of the human breast are generally obtained with film-screen technology. Based on studies by others of the resolution needed to properly represent individual microcalcifications in mammograms, available film scanners having spatial resolution of no worse than 0.1 mm per pixel and intensity amplitude resolution of at least 10 (and preferably 12) bits per pixel are required to produce a digitized image suitable for the purposes of the present invention. As shown in Figure 1 of the drawing, the generation of the digitized X-ray image and its storage, for example as an image data file, on a suitable machine readable medium accessible to a computer workstation (not shown) such as an optical or magnetical disk or RAM memory (not shown) forms the
first step 10 in the method of the present invention. The computer workstation accesses the stored image information and performs various operations thereon, in the nature of image processing, in order to identify microcalcifications, and in particular to indicate clusters thereof. Such identification will aid early detection of breast cancer and could be used in a variety of operational modes as its efficacy is verified. Improving detection sufficiently to obviate the present practice of double reading would free significant radiologist reading resources. - As previously noted, the detection of microcalcifications of a type associated with malignancy requires significant experience. The important and most commonly noted characteristics of microcalcifications of this type are that they are relatively bright spots (in film-screen mammography) usually irregular in shape, e.g. elongated, and/or pointed, have sharp edge contrast with their surrounds, and most importantly, occur in clusters of at least 3 to 5 per square cm. in the radiologic film image. The irregular nature of these microcalcifications of interest indicate that it is crucial to preserve the location of edges in the identified spots so that suitable feature measures for classifying the spot can be accurately determined.
- The Laplacian Of a Gaussian (LOG) is a widely published example of a filtered second spatial derivative operator. The technique of using the Zero Crossings of the Filtered Second Derivative (ZCFSD) for detecting and locating edges is based on a significant body of theoretical literature. The filtering, which is low pass, is designed to decrease the noise in the second derivative. Traditionally as in the LOG, the filter is Gaussian. As previously noted, such global spatial filtering has the disadvantage of moving edges away from their actual location in the image. In the present invention a filtered second derivative is employed which is produced in a manner that its zero crossings are located at edges in the image.
- An overview of the present inventive method is apparent from the basic flow chart of Figure 1 (Table I). Therein, the original radiologic image generated and stored in box or step 10, which image comprises a rectangular array of pixels having respective intensities at each pixel position, is accessible for further processing. An example of a portion of an actual original intensity image is shown in Figure 4a and of the intensities along a horizontal line therethrough in Figure 5a. The filtered second derivative thereof, in the form of a Laplacian, is computed in
box 12, in a manner preserving the edge locations as zero crossings and connected regions of negative second derivative proximate the zero crossings are labelled bybox 14. It may be recognized from examination of Figures 4e and 5e, which indicate the Laplacian in the image and along a line, that regions of negative second derivative (which are black in Figure 4e) next to a zero crossing are on the bright side of an edge in the original image. The output ofbox 14 is a mask as shown in Figures 4f and 5f wherein locally bright regions or spots are white and the balance of the mask is black. Thereafter, inbox 16, regions labelled bybox 14 that are smaller than four pixels are deleted or removed from further consideration as candidates for microcalcifications of interest, by for example being set to black in the mask of locally bright regions. Similarly, labelled regions or bridges between portions of labelled regions which are only one pixel in width are deleted. Any regions split thereby are separately labelled. Inbox 18, feature measures are computed from the edge locations of the remaining locally bright spots. These feature measures are used inbox 20 to identify or detect those of the locally bright spots which correspond to micro-calcifications of interest. Clusters containing at least three such microcalcifications in a square cm. are identified or detected inbox 22. Inbox 24, these clusters are indicated by the computer in a human intelligible manner, e.g. on a CRT display (not shown) of the original image by circling, brightening or coloring the detected clusters on the display, thereby rendering them conspicuous. The procedures in the foregoing overview will now be explained in more detail. - The detail of the computation of the filtered second derivative is shown in Figure 2 (Table II). Therein, the first spatial derivatives of the original intensity image are computed in
boxes respective boxes boxes 
where d is respectively dx and dy for smoothing operations in the respective X and Y directions. It is found experimentally that, inblocks boxes - Spatial derivatives are computed in
boxes boxes box 42 to form a Laplacian value at each pixel position. The Laplacian is illustrated in Figures 4e and 5e for the exemplary image portion. - The boundaries of spots are determined from connected regions of negative Laplacian value. These are labelled in accordance with the flow chart of Figure 3. In particular, in
box 44, all pixel positions having negative Laplacian values are marked by a thresholding operation at the value zero. Those pixel positions having a Laplacian of less than zero are assigned a white value and those having non-negative Laplacian values are assigned a black value. Inblock 46, the interiors of marked connected regions of pixels (closed contours) are filled with white values. Each connected region is assigned a unique associated number inblock 48.Block 16 then deletes regions smaller than four pixels and one pixel wide regions or bridges from further consideration, by for example, assigning the deleted regions or pixels to the black level. There results a mask of candidate locally bright regions or spots as illustrated in Figures 4f and 5f for the exemplary image portion. - For the purpose of discrimination of spots corresponding to mirocalcifications, it is assumed that microcalcifications are brighter than their surround, tend to have a compact shape, and they tend to have high edge gradients. It is true, however, that some micro-calcifications of interest may appear to violate the assumption of compactness. However, this measure has been included to discriminate microcalcifications from scratches in the film and many fibrous objects such as ducts, blood vessels and support fibers.
- Hence, in
block 20, several measures are computed on the mask of locally bright regions or spots and their surrounding pixels which are indicative of the aforementioned characteristics or features, namely brightness (B), shape (S) and edge gradients (G). First, separate exterior and interior outline regions are grown as 4-connected neighborhoods around the boundary of the spot (i.e. pixels just within the spot and pixels just outside the spot that touch its boundary by a side of the pixel). The brightness measure (B) is computed as the average intensity of all pixels comprising the spot. To determine the shape measure S, there is first computed the area A of the spot, as the number of pixels comprising the spot, and the perimeter P of the spot, as the greater of the number of pixels comprising the exterior and interior outline regions. The shape measure S (which increases as a shape becomes less compact) is:
- The gradient measure G is computed by 1) for each pixel in the exterior and interior outline regions adding the absolute values of the first derivatives in the X and Y directions determined in
boxes - The feature measures are relatively weighted to give good results in classifying those spots for which the following inequality is true to be microcalcifications (where ln is natural logarithm):

- The detection in
box 26 of whether the micro-calcifications identified inbox 22 are isolated or grouped in spatial clusters utilizes two techniques. First, data points identifying the locations of the centroids of the microcalcifications are clustered using the single link hierarchical method. All data points that are contained within an area of less than 1 cm square are grouped together. If the reader is unfamiliar with the mathematics of data clustering, see A.K. Jain et al., "Algorithms for Clustering Data", chapter 3, pp. 72-80, Prentice-Hall, Englewood Cliffs, NJ, 1988. Clusters with fewer than three members are considered to be benign, while clusters with 3 or more members are suspicious for malignant disease. It is the suspect clusters which are, bybox 26, indicated in a display of the original image. - While the present invention has been described in particular detail in relation to identification of microcalcifications in mammographic images, it should also be appreciated that its principles have broad general applicability to the identification of spots in radiologic images which correspond to objects associated with malignancy, e.g. lung nodules in chest X-rays. Consequently, numerous modifications are possible in the details given which are within the intended spirit and scope. For example, the radiologic images might be the negative of those discussed with objects producing greater X-ray attenuation than their surround being locally dark.
-
Table I, Legend to Figure 1: 10: generate and store digitized mammograms 12: compute filtered second derivative 14: label connected negative regions 16: delete connected regions smaller than 4 pixels and regions or bridges 1 pixel wide 18: compute feature measures 20: identify microcalcifications 22: detect clusters 24: indicate detected clusters in a display Table II, Legend to Figure 2 26: compute the first Sobel derivative in the X direction 28: compute the first Sobel derivative in the Y direction 30: computer the dispersion measure dx of adjacent first derivative differences in the X direction 32: compute the dispersion measure dy of adjacent first derivative differences in the Y direction 34: adaptive filter in the X direction by iterative application of an adaptive smoothing mask 36: adaptive filter in the Y direction by iterative application of an adaptive smoothing mask 38: compute the second Sobel derivative in the X direction 40: compute the second Sobel derivative in the Y direction 42: sum the X and Y second derivatives Table III, Legend to Figure 3 44: mark all negative valued pixels 46: identify the pixels that belong in each connected group 48: label each region with a unique number.
Claims (5)
- A method for the detection of objects of a predetermined type in an image stored as a two-dimensional array of pixel positions with respective digitized intensity values, the method comprising
computing filtered second spatial derivative of intensity values for pixel positions of the image, in a manner which preserves the locations of edges of any spots in said image different in intensity from their surroundings as zero crossings in values of said second derivative;
computing a plurality of measures of features of one or more identified spots, said plurality of measures being indicative of at least shape and edge gradient of said spots; and
based on a determination from said measures of features computed, identifying which of said spots correspond to objects of said predetermined type. - A method for aiding detection of cancer, comprising:
generating a radiologic image of a region of human anatomy, said image comprising a two dimensional array of pixel positions having respective digitized intensity values; storing said image in a digital storage device; and automatically performing the following steps with a computer having access to the storage device:
computing filtered second spatial derivative of intensity values for pixel positions of the radiologic image, in a manner which preserves the locations of edges of any spots in said image different in intensity from their surrounds as zero crossings in values of said second derivative;
computing a plurality of measures of features of one or more identified spots, said plurality of measures being indicative of at least shape and edge gradient of said spots; and
based on a determination from said measures of features computed, identifying which of said spots correspond to objects of a type associated with malignancy. - The cancer detection aiding method as claimed in Claim 1, wherein said radiologic image is a mammogram and said objects are microcalcifications, said method further comprising:
identifying one or more clusters of said spots identified as corresponding to microcalcifications of a type associated with malignancy; and
providing a human intelligible indication of location in the radiologic image of said identified one or more clusters. - The cancer detection aiding method as claimed in Claim 2 or 3, wherein said filtered second derivative is computed as follows:
computing first spatial derivative of intensity values at pixel positions in said radiologic image;
iteratively adaptive smoothing the first spatial derivative values in a manner that an adaptive smoothed first derivative value for a considered pixel position is arrived at by adaptive weighting first derivative values at adjoining pixel positions to achieve a relatively great smoothing effect when such adjoining pixel positions have first spatial derivative values which are relatively similar to the first spatial derivative value of the considered pixel position and to achieve relatively little or no smoothing effect when such adjoining pixel positions have first spatial derivative values which are relatively different from the first spatial derivative value at the considered pixel position; and
computing spatial derivative values of the adaptive smoothed first spatial derivative values to form filtered second spatial derivative of intensity values. - A device for assisting the detection of objects of a predetermined type in an image, the device comprising
a memory for the storage of the image as a two-dimensional array of pixel positions with respective digitized intensity values,
display means for the display of said image and of human intelligible indication on said image
and processing means having access to said memory and said display, the processing means being arranged for
computing filtered second spatial derivative of intensity values for pixels of the image stored in said memory in a manner which preserves the locations of edges of any spots in said image different in intensity from their surroundings as zero crossings in values of said second derivative;
computing a plurality of measures of features of identified one or more spots, said plurality of measures being indicative of at least shape and edge gradient of said spots; and
based on a determination from said measures of features computed, identifying and indicating on said display which of said spots correspond to objects of said predetermined type.
Applications Claiming Priority (2)
| Application Number | Priority Date | Filing Date | Title |
|---|---|---|---|
| US3071 | 1993-01-11 | ||
| US08/003,071 US5365429A (en) | 1993-01-11 | 1993-01-11 | Computer detection of microcalcifications in mammograms |
Publications (3)
| Publication Number | Publication Date |
|---|---|
| EP0609922A2 true EP0609922A2 (en) | 1994-08-10 |
| EP0609922A3 EP0609922A3 (en) | 1996-01-31 |
| EP0609922B1 EP0609922B1 (en) | 2000-08-23 |
Family
ID=21703969
Family Applications (1)
| Application Number | Title | Priority Date | Filing Date |
|---|---|---|---|
| EP94200015A Expired - Lifetime EP0609922B1 (en) | 1993-01-11 | 1994-01-05 | Computer detection of microcalcifications in mammograms |
Country Status (3)
| Country | Link |
|---|---|
| US (1) | US5365429A (en) |
| EP (1) | EP0609922B1 (en) |
| DE (1) | DE69425594T2 (en) |
Cited By (25)
| Publication number | Priority date | Publication date | Assignee | Title |
|---|---|---|---|---|
| WO1996016534A2 (en) * | 1994-11-25 | 1996-06-06 | Sophisview Technologies, Ltd. | System and method for diagnosis of living tissue diseases |
| EP0738988A1 (en) * | 1995-04-20 | 1996-10-23 | Laboratoires D'electronique Philips S.A.S. | Image processing device and process for automatic object detection in digital images |
| EP0766205A1 (en) * | 1995-09-29 | 1997-04-02 | Laboratoires D'electronique Philips S.A.S. | Image processing process and device for detecting regions with a predetermined cancer type in an intensity image |
| US5854851A (en) * | 1993-08-13 | 1998-12-29 | Sophis View Technologies Ltd. | System and method for diagnosis of living tissue diseases using digital image processing |
| WO1999047046A1 (en) * | 1998-03-20 | 1999-09-23 | Barbara Ann Karmanos Cancer Institute | Multidimensional detection and characterization of pathologic tissues |
| EP1037166A1 (en) * | 1999-03-16 | 2000-09-20 | Philips Corporate Intellectual Property GmbH | Method for the detection of contours in an X-Ray image |
| US6385474B1 (en) | 1999-03-19 | 2002-05-07 | Barbara Ann Karmanos Cancer Institute | Method and apparatus for high-resolution detection and characterization of medical pathologies |
| US6837854B2 (en) | 2002-12-18 | 2005-01-04 | Barbara Ann Karmanos Cancer Institute | Methods and systems for using reference images in acoustic image processing |
| FR2863749A1 (en) * | 2003-12-10 | 2005-06-17 | Ge Med Sys Global Tech Co Llc | Radiological image e.g. mammography image, processing method for detecting e.g. lesion, involves localizing particles, each constituted by cluster of pixels, susceptible to constitute microcalcification sign on radiological image |
| US6926672B2 (en) | 2002-12-18 | 2005-08-09 | Barbara Ann Karmanos Cancer Institute | Electret acoustic transducer array for computerized ultrasound risk evaluation system |
| US6984210B2 (en) | 2002-12-18 | 2006-01-10 | Barbara Ann Karmanos Cancer Institute | Diagnostic analysis of ultrasound data |
| WO2010034968A1 (en) * | 2008-09-29 | 2010-04-01 | Medicsight Plc. | Computer-implemented lesion detection method and apparatus |
| US7693254B2 (en) | 2006-02-16 | 2010-04-06 | General Electric Company | X-ray device and image-processing method |
| GB2468164A (en) * | 2009-02-27 | 2010-09-01 | Medicsight Plc | Characterising of image geometry using derivatives |
| US8376946B2 (en) | 2002-05-16 | 2013-02-19 | Barbara Ann Karamanos Cancer Institute | Method and apparatus for combined diagnostic and therapeutic ultrasound system incorporating noninvasive thermometry, ablation control and automation |
| US9763641B2 (en) | 2012-08-30 | 2017-09-19 | Delphinus Medical Technologies, Inc. | Method and system for imaging a volume of tissue with tissue boundary detection |
| US9814441B2 (en) | 2010-02-12 | 2017-11-14 | Delphinus Medical Technologies, Inc. | Method of characterizing tissue of a patient |
| US10123770B2 (en) | 2013-03-13 | 2018-11-13 | Delphinus Medical Technologies, Inc. | Patient support system |
| US10143443B2 (en) | 2014-05-05 | 2018-12-04 | Delphinus Medical Technologies, Inc. | Method for representing tissue stiffness |
| US10201324B2 (en) | 2007-05-04 | 2019-02-12 | Delphinus Medical Technologies, Inc. | Patient interface system |
| US10278672B2 (en) | 2010-02-12 | 2019-05-07 | Delphinus Medical Technologies, Inc. | Method of characterizing the pathological response of tissue to a treatment plan |
| US10285667B2 (en) | 2014-08-05 | 2019-05-14 | Delphinus Medical Technologies, Inc. | Method for generating an enhanced image of a volume of tissue |
| CN111008988A (en) * | 2020-03-04 | 2020-04-14 | 执鼎医疗科技(杭州)有限公司 | Meibomian gland image processing method |
| US10743837B2 (en) | 2014-08-04 | 2020-08-18 | Delphinus Medical Technologies, Inc. | Ultrasound waveform tomography method and system |
| CN110996772B (en) * | 2017-08-15 | 2024-04-02 | 玛雷迪夫美国公司 | Breast cancer detection |
Families Citing this family (41)
| Publication number | Priority date | Publication date | Assignee | Title |
|---|---|---|---|---|
| JP2832269B2 (en) * | 1992-09-14 | 1998-12-09 | 三井金属鉱業株式会社 | Three-dimensional particle detection method and device |
| US6574357B2 (en) | 1993-09-29 | 2003-06-03 | Shih-Ping Wang | Computer-aided diagnosis method and system |
| US6266435B1 (en) * | 1993-09-29 | 2001-07-24 | Shih-Ping Wang | Computer-aided diagnosis method and system |
| WO1995018561A2 (en) * | 1993-12-30 | 1995-07-13 | Philips Electronics Nv | Automatic segmentation and skinline detection in digital mammograms |
| JPH07299053A (en) * | 1994-04-29 | 1995-11-14 | Arch Dev Corp | Computer diagnosis support method |
| US5579360A (en) * | 1994-12-30 | 1996-11-26 | Philips Electronics North America Corporation | Mass detection by computer using digital mammograms of the same breast taken from different viewing directions |
| JP3596786B2 (en) * | 1995-01-24 | 2004-12-02 | 富士写真フイルム株式会社 | Abnormal shadow candidate detection method |
| US5586160A (en) * | 1995-03-20 | 1996-12-17 | The Regents Of The University Of California | Automated analysis for microcalcifications in high resolution digital mammograms |
| US5857030A (en) * | 1995-08-18 | 1999-01-05 | Eastman Kodak Company | Automated method and system for digital image processing of radiologic images utilizing artificial neural networks |
| US5615243A (en) * | 1996-03-12 | 1997-03-25 | University Of Pittsburgh | Identification of suspicious mass regions in mammograms |
| US5987094A (en) * | 1996-10-30 | 1999-11-16 | University Of South Florida | Computer-assisted method and apparatus for the detection of lung nodules |
| US5768333A (en) * | 1996-12-02 | 1998-06-16 | Philips Electronics N.A. Corporation | Mass detection in digital radiologic images using a two stage classifier |
| US5757880A (en) * | 1997-01-08 | 1998-05-26 | Colomb; Denis | Apparatus, article of manufacture, and method for creation of an uncompressed image of compressed matter |
| US6246782B1 (en) | 1997-06-06 | 2001-06-12 | Lockheed Martin Corporation | System for automated detection of cancerous masses in mammograms |
| US5994713A (en) * | 1997-06-25 | 1999-11-30 | Quantum Imaging Corp. | Filmless photon imaging apparatus |
| US5999639A (en) * | 1997-09-04 | 1999-12-07 | Qualia Computing, Inc. | Method and system for automated detection of clustered microcalcifications from digital mammograms |
| US6137898A (en) * | 1997-08-28 | 2000-10-24 | Qualia Computing, Inc. | Gabor filtering for improved microcalcification detection in digital mammograms |
| US6970587B1 (en) | 1997-08-28 | 2005-11-29 | Icad, Inc. | Use of computer-aided detection system outputs in clinical practice |
| US7308126B2 (en) * | 1997-08-28 | 2007-12-11 | Icad, Inc. | Use of computer-aided detection system outputs in clinical practice |
| US6996549B2 (en) | 1998-05-01 | 2006-02-07 | Health Discovery Corporation | Computer-aided image analysis |
| WO1999057683A1 (en) * | 1998-05-04 | 1999-11-11 | The Johns Hopkins University | Method and apparatus for segmenting small structures in images |
| US6173034B1 (en) * | 1999-01-25 | 2001-01-09 | Advanced Optical Technologies, Inc. | Method for improved breast x-ray imaging |
| US6801645B1 (en) | 1999-06-23 | 2004-10-05 | Icad, Inc. | Computer aided detection of masses and clustered microcalcifications with single and multiple input image context classification strategies |
| EP1356419B1 (en) * | 2000-11-22 | 2014-07-16 | MeVis Medical Solutions AG | Graphical user interface for display of anatomical information |
| US6694046B2 (en) * | 2001-03-28 | 2004-02-17 | Arch Development Corporation | Automated computerized scheme for distinction between benign and malignant solitary pulmonary nodules on chest images |
| US7231071B2 (en) * | 2001-09-13 | 2007-06-12 | Fujifilm Corporation | Abnormal shadow detecting system |
| US7397937B2 (en) * | 2001-11-23 | 2008-07-08 | R2 Technology, Inc. | Region growing in anatomical images |
| DE10239343A1 (en) * | 2002-08-28 | 2004-03-11 | Philips Intellectual Property & Standards Gmbh | Process for processing a skin impression image |
| US6731782B2 (en) * | 2002-10-02 | 2004-05-04 | Virtualscopics, Llc | Method and system for automatic identification and quantification of abnormal anatomical structures in medical images |
| US20040114829A1 (en) * | 2002-10-10 | 2004-06-17 | Intelligent System Solutions Corp. | Method and system for detecting and correcting defects in a digital image |
| US7430309B2 (en) * | 2004-02-09 | 2008-09-30 | Institut De Cardiologie De Montreal | Computation of a geometric parameter of a cardiac chamber from a cardiac tomography data set |
| JP5312803B2 (en) | 2005-02-11 | 2013-10-09 | コーニンクレッカ フィリップス エヌ ヴェ | Imaging method and computer tomography apparatus for computed tomography |
| WO2007000940A1 (en) * | 2005-06-28 | 2007-01-04 | Konica Minolta Medical & Graphic, Inc. | Abnormal shadow candidate detecting method, abnormal shadow candidate detecting device |
| WO2007029235A2 (en) * | 2005-09-05 | 2007-03-15 | Algosoft Limited | Automatic digital film and video restoration |
| KR100646828B1 (en) | 2005-10-08 | 2006-11-23 | 건국대학교 산학협력단 | System for measurement mass size on breast mammogram and method therefor |
| US8086002B2 (en) * | 2007-04-27 | 2011-12-27 | Three Palm Software | Algorithms for selecting mass density candidates from digital mammograms |
| US8870771B2 (en) | 2007-05-04 | 2014-10-28 | Barbara Ann Karmanos Cancer Institute | Method and apparatus for categorizing breast density and assessing cancer risk utilizing acoustic parameters |
| JP5820383B2 (en) | 2009-10-30 | 2015-11-24 | コーニンクレッカ フィリップス エヌ ヴェKoninklijke Philips N.V. | Three-dimensional analysis of lesions represented by image data |
| FR2956496B1 (en) * | 2010-02-17 | 2012-03-09 | Commissariat Energie Atomique | METHOD FOR ONLINE MEASUREMENT OF IONIZING RADIATION |
| WO2012085818A1 (en) | 2010-12-23 | 2012-06-28 | Koninklijke Philips Electronics N.V. | Mammography calcium score |
| CN110177287A (en) * | 2019-06-11 | 2019-08-27 | 广州虎牙科技有限公司 | A kind of image procossing and live broadcasting method, device, equipment and storage medium |
Citations (2)
| Publication number | Priority date | Publication date | Assignee | Title |
|---|---|---|---|---|
| US4907156A (en) * | 1987-06-30 | 1990-03-06 | University Of Chicago | Method and system for enhancement and detection of abnormal anatomic regions in a digital image |
| US5133020A (en) * | 1989-07-21 | 1992-07-21 | Arch Development Corporation | Automated method and system for the detection and classification of abnormal lesions and parenchymal distortions in digital medical images |
Family Cites Families (7)
| Publication number | Priority date | Publication date | Assignee | Title |
|---|---|---|---|---|
| US4515165A (en) * | 1980-02-04 | 1985-05-07 | Energy Conversion Devices, Inc. | Apparatus and method for detecting tumors |
| US4618990A (en) * | 1984-11-15 | 1986-10-21 | General Electric Company | Edge enhancement filtering for digital fluorography images |
| US4851984A (en) * | 1987-08-03 | 1989-07-25 | University Of Chicago | Method and system for localization of inter-rib spaces and automated lung texture analysis in digital chest radiographs |
| FR2622714B1 (en) * | 1987-10-29 | 1993-01-08 | Goumot Pierre Alain | MAMMOGRAPHY ANALYSIS PROCESS |
| US5003979A (en) * | 1989-02-21 | 1991-04-02 | University Of Virginia | System and method for the noninvasive identification and display of breast lesions and the like |
| US5212637A (en) * | 1989-11-22 | 1993-05-18 | Stereometrix Corporation | Method of investigating mammograms for masses and calcifications, and apparatus for practicing such method |
| US5142557A (en) * | 1990-12-21 | 1992-08-25 | Photometrics Ltd. | CCD and phosphor screen digital radiology apparatus and method for high resolution mammography |
-
1993
- 1993-01-11 US US08/003,071 patent/US5365429A/en not_active Expired - Fee Related
-
1994
- 1994-01-05 DE DE69425594T patent/DE69425594T2/en not_active Expired - Fee Related
- 1994-01-05 EP EP94200015A patent/EP0609922B1/en not_active Expired - Lifetime
Patent Citations (2)
| Publication number | Priority date | Publication date | Assignee | Title |
|---|---|---|---|---|
| US4907156A (en) * | 1987-06-30 | 1990-03-06 | University Of Chicago | Method and system for enhancement and detection of abnormal anatomic regions in a digital image |
| US5133020A (en) * | 1989-07-21 | 1992-07-21 | Arch Development Corporation | Automated method and system for the detection and classification of abnormal lesions and parenchymal distortions in digital medical images |
Non-Patent Citations (4)
| Title |
|---|
| IEEE TRANSACTIONS ON PATTERN ANALYSIS AND MACHINE INTELLIGENCE, vol. 13, no. 6, June 1991 USA, pages 514-529, SAINT-MARC ET AL 'Adaptive Smoothing: A General Tool for Early Vision' * |
| IEEE TRANSACTIONS ON PATTERN ANALYSIS AND MACHINE INTELLIGENCE, vol. PAMI-6, no. 1, January 1984 pages 58-68, HARALICK 'Digital Step Edges from Zero Crossing of Second Directional Derivatives' * |
| PHYSICS IN MEDICINE AND BIOLOGY, vol. 35, no. 8, August 1990 LONDON GB, pages 1111-1118, XP 000159686 DAVIES ET AL 'Automatic Computer Detection of Clustered Calcifications in Digital Mammograms' * |
| SYSTEMS & COMPUTERS IN JAPAN, vol. 20, no. 11, November 1989 NEW YORK US, pages 67-75, XP 000128845 YABASHI ET AL 'Extraction and Computational Estimation of Malignant Microcalcification on Mammography' * |
Cited By (40)
| Publication number | Priority date | Publication date | Assignee | Title |
|---|---|---|---|---|
| US5854851A (en) * | 1993-08-13 | 1998-12-29 | Sophis View Technologies Ltd. | System and method for diagnosis of living tissue diseases using digital image processing |
| US5970164A (en) * | 1994-08-11 | 1999-10-19 | Sophisview Technologies, Ltd. | System and method for diagnosis of living tissue diseases |
| WO1996016534A3 (en) * | 1994-11-25 | 1996-08-29 | Sophisview Technologies Ltd | System and method for diagnosis of living tissue diseases |
| WO1996016534A2 (en) * | 1994-11-25 | 1996-06-06 | Sophisview Technologies, Ltd. | System and method for diagnosis of living tissue diseases |
| EP0738988A1 (en) * | 1995-04-20 | 1996-10-23 | Laboratoires D'electronique Philips S.A.S. | Image processing device and process for automatic object detection in digital images |
| FR2733336A1 (en) * | 1995-04-20 | 1996-10-25 | Philips Electronique Lab | METHOD AND DEVICE FOR PROCESSING IMAGES FOR AUTOMATIC DETECTION OF OBJECTS IN DIGITAL IMAGES |
| EP0766205A1 (en) * | 1995-09-29 | 1997-04-02 | Laboratoires D'electronique Philips S.A.S. | Image processing process and device for detecting regions with a predetermined cancer type in an intensity image |
| US6728567B2 (en) | 1998-03-20 | 2004-04-27 | Barbara Ann Karmanos Cancer Institute | Method and apparatus for high-resolution detection and characterization of medical pathologies |
| WO1999047046A1 (en) * | 1998-03-20 | 1999-09-23 | Barbara Ann Karmanos Cancer Institute | Multidimensional detection and characterization of pathologic tissues |
| EP1037166A1 (en) * | 1999-03-16 | 2000-09-20 | Philips Corporate Intellectual Property GmbH | Method for the detection of contours in an X-Ray image |
| US6385474B1 (en) | 1999-03-19 | 2002-05-07 | Barbara Ann Karmanos Cancer Institute | Method and apparatus for high-resolution detection and characterization of medical pathologies |
| US8376946B2 (en) | 2002-05-16 | 2013-02-19 | Barbara Ann Karamanos Cancer Institute | Method and apparatus for combined diagnostic and therapeutic ultrasound system incorporating noninvasive thermometry, ablation control and automation |
| US6926672B2 (en) | 2002-12-18 | 2005-08-09 | Barbara Ann Karmanos Cancer Institute | Electret acoustic transducer array for computerized ultrasound risk evaluation system |
| US6984210B2 (en) | 2002-12-18 | 2006-01-10 | Barbara Ann Karmanos Cancer Institute | Diagnostic analysis of ultrasound data |
| US7285092B2 (en) | 2002-12-18 | 2007-10-23 | Barbara Ann Karmanos Cancer Institute | Computerized ultrasound risk evaluation system |
| US6837854B2 (en) | 2002-12-18 | 2005-01-04 | Barbara Ann Karmanos Cancer Institute | Methods and systems for using reference images in acoustic image processing |
| JP2005169122A (en) * | 2003-12-10 | 2005-06-30 | Ge Medical Systems Global Technology Co Llc | Method for radiograph processing |
| FR2863749A1 (en) * | 2003-12-10 | 2005-06-17 | Ge Med Sys Global Tech Co Llc | Radiological image e.g. mammography image, processing method for detecting e.g. lesion, involves localizing particles, each constituted by cluster of pixels, susceptible to constitute microcalcification sign on radiological image |
| US7630534B2 (en) | 2003-12-10 | 2009-12-08 | Ge Medical Systems Global Technology Company, Llc | Method for radiological image processing |
| US7693254B2 (en) | 2006-02-16 | 2010-04-06 | General Electric Company | X-ray device and image-processing method |
| US10201324B2 (en) | 2007-05-04 | 2019-02-12 | Delphinus Medical Technologies, Inc. | Patient interface system |
| WO2010034968A1 (en) * | 2008-09-29 | 2010-04-01 | Medicsight Plc. | Computer-implemented lesion detection method and apparatus |
| GB2468164A (en) * | 2009-02-27 | 2010-09-01 | Medicsight Plc | Characterising of image geometry using derivatives |
| US9014447B2 (en) | 2009-02-27 | 2015-04-21 | Samsung Electronics Co., Ltd. | System and method for detection of lesions in three-dimensional digital medical image |
| GB2468164B (en) * | 2009-02-27 | 2014-08-13 | Samsung Electronics Co Ltd | Computer-aided detection of lesions |
| US9814441B2 (en) | 2010-02-12 | 2017-11-14 | Delphinus Medical Technologies, Inc. | Method of characterizing tissue of a patient |
| US10231696B2 (en) | 2010-02-12 | 2019-03-19 | Delphinus Medical Technologies, Inc. | Method of characterizing tissue of a patient |
| US10278672B2 (en) | 2010-02-12 | 2019-05-07 | Delphinus Medical Technologies, Inc. | Method of characterizing the pathological response of tissue to a treatment plan |
| US11399798B2 (en) | 2010-02-12 | 2022-08-02 | Delphinus Medical Technologies, Inc. | Method of characterizing tissue of a patient |
| US9763641B2 (en) | 2012-08-30 | 2017-09-19 | Delphinus Medical Technologies, Inc. | Method and system for imaging a volume of tissue with tissue boundary detection |
| US11064974B2 (en) | 2013-03-13 | 2021-07-20 | Delphinus Medical Technologies, Inc. | Patient interface system |
| US10123770B2 (en) | 2013-03-13 | 2018-11-13 | Delphinus Medical Technologies, Inc. | Patient support system |
| US10143443B2 (en) | 2014-05-05 | 2018-12-04 | Delphinus Medical Technologies, Inc. | Method for representing tissue stiffness |
| US11147537B2 (en) | 2014-05-05 | 2021-10-19 | Delphinus Medical Technologies, Inc. | Method for representing tissue stiffness |
| US10743837B2 (en) | 2014-08-04 | 2020-08-18 | Delphinus Medical Technologies, Inc. | Ultrasound waveform tomography method and system |
| US11298111B2 (en) | 2014-08-05 | 2022-04-12 | Delphinus Medical Technologies, Inc. | Method for generating an enhanced image of a volume of tissue |
| US10285667B2 (en) | 2014-08-05 | 2019-05-14 | Delphinus Medical Technologies, Inc. | Method for generating an enhanced image of a volume of tissue |
| CN110996772B (en) * | 2017-08-15 | 2024-04-02 | 玛雷迪夫美国公司 | Breast cancer detection |
| CN111008988B (en) * | 2020-03-04 | 2020-07-03 | 执鼎医疗科技(杭州)有限公司 | Meibomian gland image processing method |
| CN111008988A (en) * | 2020-03-04 | 2020-04-14 | 执鼎医疗科技(杭州)有限公司 | Meibomian gland image processing method |
Also Published As
| Publication number | Publication date |
|---|---|
| DE69425594D1 (en) | 2000-09-28 |
| EP0609922A3 (en) | 1996-01-31 |
| EP0609922B1 (en) | 2000-08-23 |
| US5365429A (en) | 1994-11-15 |
| DE69425594T2 (en) | 2001-05-23 |
Similar Documents
| Publication | Publication Date | Title |
|---|---|---|
| EP0609922B1 (en) | Computer detection of microcalcifications in mammograms | |
| Kobatake et al. | Computerized detection of malignant tumors on digital mammograms | |
| US6640001B2 (en) | Method and apparatus for fast detection of lesions | |
| US5815591A (en) | Method and apparatus for fast detection of spiculated lesions in digital mammograms | |
| US5579360A (en) | Mass detection by computer using digital mammograms of the same breast taken from different viewing directions | |
| US5572565A (en) | Automatic segmentation, skinline and nipple detection in digital mammograms | |
| Dengler et al. | Segmentation of microcalcifications in mammograms | |
| EP0576961B1 (en) | Method for automatic foreground and background detection in digital radiographic images | |
| US6198838B1 (en) | Method and system for detection of suspicious lesions in digital mammograms using a combination of spiculation and density signals | |
| US5768406A (en) | Mass detection in digital X-ray images using multiple threshold levels to discriminate spots | |
| KR100870412B1 (en) | Ultrasound system for forming 3d fetus ultrasound image based on fetus surface image extracted by svm-based texture classification and method for the same | |
| US6185320B1 (en) | Method and system for detection of lesions in medical images | |
| US5832103A (en) | Automated method and system for improved computerized detection and classification of massess in mammograms | |
| US5586160A (en) | Automated analysis for microcalcifications in high resolution digital mammograms | |
| US6738500B2 (en) | Method and system for detecting small structures in images | |
| WO1995018561A2 (en) | Automatic segmentation and skinline detection in digital mammograms | |
| Antonelli et al. | Segmentation and reconstruction of the lung volume in CT images | |
| US7155041B2 (en) | Anomalous shadow detection system | |
| Zhao | Rule-based morphological feature extraction of microcalcifications in mammograms | |
| Rajkumar et al. | Automated mammogram segmentation using seed point identification and modified region growing algorithm | |
| Hikmat et al. | Automatic detection of stellate lesions in digital mammograms using multi-scale sift | |
| JP2001346787A (en) | Questionable image detecting method, and detecting system | |
| te Brake et al. | Discrete dynamic contour model for mass segmentation in digital mammograms | |
| Lai et al. | Automated detection of breast tumors | |
| Jones et al. | Automatic Detection of Stellate Lesions in Digital Mammograms Using Multi-scale SIFT |
Legal Events
| Date | Code | Title | Description |
|---|---|---|---|
| PUAI | Public reference made under article 153(3) epc to a published international application that has entered the european phase |
Free format text: ORIGINAL CODE: 0009012 |
|
| AK | Designated contracting states |
Kind code of ref document: A2 Designated state(s): DE FR GB NL |
|
| RAP1 | Party data changed (applicant data changed or rights of an application transferred) |
Owner name: N.V. PHILIPS' GLOEILAMPENFABRIEKEN |
|
| PUAL | Search report despatched |
Free format text: ORIGINAL CODE: 0009013 |
|
| AK | Designated contracting states |
Kind code of ref document: A3 Designated state(s): DE FR GB NL |
|
| 17P | Request for examination filed |
Effective date: 19960731 |
|
| RAP3 | Party data changed (applicant data changed or rights of an application transferred) |
Owner name: KONINKLIJKE PHILIPS ELECTRONICS N.V. |
|
| 17Q | First examination report despatched |
Effective date: 19990326 |
|
| RIC1 | Information provided on ipc code assigned before grant |
Free format text: 6G 06K 9/46 A, 6G 06T 7/00 B, 6A 61B 6/00 B |
|
| GRAG | Despatch of communication of intention to grant |
Free format text: ORIGINAL CODE: EPIDOS AGRA |
|
| GRAG | Despatch of communication of intention to grant |
Free format text: ORIGINAL CODE: EPIDOS AGRA |
|
| GRAH | Despatch of communication of intention to grant a patent |
Free format text: ORIGINAL CODE: EPIDOS IGRA |
|
| GRAH | Despatch of communication of intention to grant a patent |
Free format text: ORIGINAL CODE: EPIDOS IGRA |
|
| GRAA | (expected) grant |
Free format text: ORIGINAL CODE: 0009210 |
|
| AK | Designated contracting states |
Kind code of ref document: B1 Designated state(s): DE FR GB NL |
|
| PG25 | Lapsed in a contracting state [announced via postgrant information from national office to epo] |
Ref country code: NL Free format text: LAPSE BECAUSE OF FAILURE TO SUBMIT A TRANSLATION OF THE DESCRIPTION OR TO PAY THE FEE WITHIN THE PRESCRIBED TIME-LIMIT Effective date: 20000823 Ref country code: FR Free format text: LAPSE BECAUSE OF FAILURE TO SUBMIT A TRANSLATION OF THE DESCRIPTION OR TO PAY THE FEE WITHIN THE PRESCRIBED TIME-LIMIT Effective date: 20000823 |
|
| REF | Corresponds to: |
Ref document number: 69425594 Country of ref document: DE Date of ref document: 20000928 |
|
| EN | Fr: translation not filed | ||
| PGFP | Annual fee paid to national office [announced via postgrant information from national office to epo] |
Ref country code: GB Payment date: 20010130 Year of fee payment: 8 |
|
| NLV1 | Nl: lapsed or annulled due to failure to fulfill the requirements of art. 29p and 29m of the patents act | ||
| PGFP | Annual fee paid to national office [announced via postgrant information from national office to epo] |
Ref country code: DE Payment date: 20010321 Year of fee payment: 8 |
|
| PLBE | No opposition filed within time limit |
Free format text: ORIGINAL CODE: 0009261 |
|
| STAA | Information on the status of an ep patent application or granted ep patent |
Free format text: STATUS: NO OPPOSITION FILED WITHIN TIME LIMIT |
|
| 26N | No opposition filed | ||
| REG | Reference to a national code |
Ref country code: GB Ref legal event code: IF02 |
|
| PG25 | Lapsed in a contracting state [announced via postgrant information from national office to epo] |
Ref country code: GB Free format text: LAPSE BECAUSE OF NON-PAYMENT OF DUE FEES Effective date: 20020105 |
|
| PG25 | Lapsed in a contracting state [announced via postgrant information from national office to epo] |
Ref country code: DE Free format text: LAPSE BECAUSE OF NON-PAYMENT OF DUE FEES Effective date: 20020801 |
|
| GBPC | Gb: european patent ceased through non-payment of renewal fee |
Effective date: 20020105 |