BACKGROUND OF THE INVENTION
The present invention relates to a method of
performance monitoring which captures and displays
performance data in a computer system which connects two
or more computers with a network, a computer system
therefor and a program storage medium therefor, and
especially to a performance monitoring method suitable
for a parallel computer or a distributed system.
In a parallel computer or a distributed system,
their operations become very complex compared with a
sequential computer, because computers called nodes,
which compose it, operate cooperatively in parallel, and
the operations of the nodes depend on those of other
nodes, as exemplified by internode-communication. In
order to use such a parallel computer effectively and to
educe enough performance of the parallel computer, it is
necessary to grasp accurately not only the operation of
each node but also the complex operation status of the
parallel computer including the causal relation among
operations of nodes and the balance of loads among the
nodes, and to make use of that information to tune the
programs being executed.
As for prior art which supports the grasping of
operation status of a computer, the following two
methods have been chiefly used. The first one is
adopted, for example, by PerfView produced by Hewlett-Packard
Co., and it measures performance data of each
node of a distributed system related to the operation
status of the node such as the operation status of CPU,
the state of use of the memory, and the communication
frequency of the network. The measured performance data
is stored in the storage device in the node, such as a
magnetic disk storage device and so on. The performance
data stored in each node is further accumulated in one
computer connected to the distributed system and is
displayed graphically or so, to aid visual grasp of the
performance data.
The second one is represented, for example, by
Visualization Tool produced by IBM, a process which
captures performance data is invoked on each node of a
parallel computer, and a display process invoked on a
controlling computer connected to the parallel computer
through the network receives performance data from the
capturing process of each node in real time and displays
the performance data received from each node. For
instance, refer to "IBM Parallel Environment for AIX
Operation and Use Version 2.1.0," pp. 263-265, 1995
(Document Number GC23-3891-00), issued by International
Business Machines Corp.
In general, a parallel computer or a distributed
system is shared by two or more users. Therefore, it is
preferable for two or more users to be able to monitor
performance data of such a computer through the network
in real-time. According to the first method,
performance data of each node can be accumulated in the
storage device, but the operation status of the
distributed system cannot be grasped in real time,
because the performance data is analyzed and is
displayed, after the measurement of the performance data
is finished. According to the second method, it is
possible for the display process to receive performance
data from the capturing process on each node in real
time and to display it, but the reference document
mentioned above does not disclose concretely a method of
monitoring the performance data of the same
computer (monitoring target) by two or more users.
A method which allows monitoring of a distributed computer
system by two or more users is disclosed in US-5,432,932
from which the first part of claim 1 starts out.
This method is implemented by a server program (data supplier)
that runs as a daemon on a server system, and by one
or more client programs (data consumers) which provide the
monitoring facilities to the users. The data supplier daemon
collects performance data only upon a user's request. Upon
request from a user, it gathers the performance data requested
and sends it to the user's data consumer. Therefore,
the load to the data supplier increases with increasing
number of users.
A method for monitoring a distibuted MPP computer
system is also disclosed in the PROCEEDINGS OF THE
FIRST AIZU INTERNATIONAL SYMPOSIUM ON PARALLEL
ALGORITHMS/ARCHITECTURE SYNTHESIS, 15 - 17
March 1995, FUKUSHIMA, JAPAN, pages 78 - 84,
XP000672397, HANSEN O.; KRAMMER J.: "A
Scalable Performance Analysis Tool for Power PC
Based MPP Systems". The variable load resulting
from the users' demand is not discussed.
But when performance data of the same monitoring
target is monitored by two or more users, it is
preferable that the load to the monitoring
target due to monitoring of the monitoring
target itself does not increase as the number
of the monitoring users increases.
SUMMARY OF THE INVENTION
Therefore, it is an object of the present
invention to provide a method of monitoring computer
performance which is adapted for monitoring by two or
more users in real time, with suppressing increase of
the load to a computer system subject to monitoring (monitoring target) due to the
performance measurement thereof.
This object is solved by the method set forth in claim 1.
The subclaims are directed to preferred embodiments of
the invention.
To achieve the above-mentioned object, according
to an embodiment of the present invention, a computer of the monitoring
target captures performance data of its own repeatedly
and transmits it to a computer for operation status
monitoring through a network. A relaying process,
invoked on this computer for operation status monitoring,
receives and transfers the received performance data to
one, two or more utilizing processes invoked on the same
or different computers. The performance data measured
includes plural performance data for plural measurement
items. The utilizing processes may be display processes
or logging processes. When a display process receives
the performance data transferred by the relaying process,
it displays part of the performance data corresponding
to part of the plural measurement items on a display
device connected to the computer on which the display
process is invoked. When a logging process receives the
performance data transferred by the display process, it
stores all of the performance data into a storage device
connected to the computer on which the logging process
is invoked.
According to one preferable mode of operation of
the present invention, when the computer subject to monitoring
is a parallel computer, performance data which a
capturing process invoked on each node of the parallel
computer has captured is collected by a collecting
process invoked on a predetermined one node, connected
to the network, in a parallel computer, and is further
transferred to the relaying process.
BRIEF DESCRIPTION OF THE DRAWINGS
Fig. 1 is a schematic diagram of a parallel
computer performance monitoring system according to a preferred embodiment of the
present invention.
Fig. 2 is a module diagram of a capturing
process in the parallel computer performance monitoring
system of Fig. 1.
Fig. 3 is a module diagram of a collecting
process in the parallel computer performance monitoring
system of Fig. 1.
Fig. 4 is a module diagram of a relaying process
in the parallel computer performance monitoring system
of Fig. 1.
Fig. 5 is a module diagram of a display process
and a logging process in the parallel computer
performance monitoring system of Fig. 1.
Fig. 6A is a flow chart of part of the
processing procedure of a parallel computer performance
monitoring method adopted in the system of Fig. 1.
Fig. 6B is a flow chart of another part of the
processing procedure of a parallel computer performance
monitoring method adopted in the system of Fig. 1.
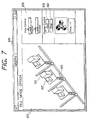
Fig. 7 shows one example of a display screen of
performance data.
Fig. 8 shows another example of a display screen
of performance data.
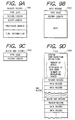
Fig. 9A shows an example of the form of a header
record in a block which a logging process stores in a
storage device.
Fig. 9B shows an example of the form of a usual
data record in the block which the logging process
stores in the storage device.
Fig. 9C shows an example of the form of a block
end record in the block which the logging process stores
in the storage device.
Fig. 9D shows an example of the form of a file
which the logging process stores in the storage device.
Fig. 10 is a flow chart of the re-display
processing procedure of the stored data.
Fig. 11 shows an example of a control screen to
control the display function of the stored log data.
Fig. 12 is a schematic diagram of a parallel
computer to which the performance monitoring method by
an embodiment of the present invention is applied.
Fig. 13 is a schematic diagram of another
parallel computer to which the performance monitoring
method by an embodiment of the present invention is applied.
DESCRIPTION OF THE EMBODIMENTS
A performance monitoring method according to the
present invention will be explained in more details with
reference to one or several embodiments or their
modifications shown in the drawings. The same or like
numerals represent the same or like elements. With the
second or later embodiment, differences between it and
the first embodiment will be mainly explained.
FIRST EMBODIMENT
Referring to Fig. 12, the parallel computer 1
comprises plural nodes 2 and at least one internal
network 5 which connects those nodes 2. Each node is
composed of at least one processor 2A and a memory 2B,
etc.. The memory 2B of each node holds a program which
the processor 2A of the node executes as well as data
for the program. Each node or part of the nodes further
has a peripheral device such as a magnetic storage
device, but the peripheral device is not shown for
simplification. One specific node of the parallel
computer 1 is connected to the external network 21. Two
or more computers 11 can be connected to the external
network 21. The above-mentioned one node and these
computers communicate mutually by way of the network 21.
The parallel computer 1 is a computer subject to monitoring
and the two computers 11 connected to the
external network 21 are examples of the computers used
for monitoring. Other computers connected to the
network 21 are not shown in Fig. 12 for simplification.
Each computer 11 is composed of the processor 11A and
the memory 11B. The input/output device 12 which
contains display device, the keyboard and so on, and the
storage device 13 such as a magnetic disk storage device
are connected to the computer 11. Each processor is
controlled by a suitable operating system (OS), for
instance, UNIX (registered trademark of X/Open Company
Limited in the United States of America and other
countries).
The five kinds of processes which compose the
monitoring system in the present embodiment and the
relations between the processes are shown in Fig. 1.
The capturing process 4 is executed on each node 2 of
the parallel computer 1. This capturing process 4
captures performance data of each node 2 repeatedly at a
constant time interval. The collecting process 3 is
executed on the specific node connected to the external
network 21 among two or more nodes 2 of the parallel
computer 1. The collecting process collects the
performance data of each node which the capturing
process 4 on each node has captured and transmits it to
one monitoring computer 11.
On the other hand, the relaying process 15, the
display process 16, and the logging process 17 are
invoked on this one monitoring computer 11. The
relaying process 15 is invoked on only one of the
monitoring computers 11, and transmits and receives data
with the collecting process 3. The display process 16
and the logging process 17 are invoked by one user or
two or more users. The user or users can invoke as many
display processes 16 or logging processes as they
require. These processes can receive the performance
data distributed by the relaying process 15. The
display process displays on the display device in the
input/output device 12, part of the distributed
performance data corresponding to part of the plural
measurement items. The logging process stores the whole
of the distributed performance data in storage device 13.
These display process 16 and logging process 17 need not
be invoked necessarily on the monitoring computer 11 on
which the relaying process 15 has been invoked, but can
be invoked on other computers connected to the
monitoring computer 11 by way of the network 21.
Moreover, two or more display processes 16 can be
invoked on any one monitoring computer 11. Similarly,
it is also possible to invoke two or more logging
processes 17 on the monitoring computer 11.
Next, it will be explained how each process of
the present monitoring system cooperatively operates, by
referring to the flow chart of Figs. 6A and 6B and to
the internal structure of the five processes shown in
Figs. 2 to 5. The collecting process 3 is invoked on
the above-mentioned specific node 2, connected to the
external network 21, in the parallel computer 1 (step
521 (Fig. 6A)). Usually, the invocation of this
collecting process 3 is executed by inputting a
collecting process invocation command to the parallel
computer 1, by the system administrator. The collecting
process 3 executes initialization when invoked. For
instance, the configuration definition file 208 (Fig. 3)
is read. The file describes the configuration of the
parallel computer 1, such as the number of nodes,
attribute of each node, and the number of measuring
nodes. The attribute of each node includes the address
of each node and the peripheral device description as to
whether a peripheral device like a magnetic disk storage
device is attached to the node. When the initialization
ends, the collecting process 3 waits for the connection
request from the relaying process 15 which will be
invoked on one monitoring computer 11.
Next, the relaying process 15 is invoked on one
monitoring computer 11 (step 541). Usually, the
invocation of the relaying process 15 is executed by
entering a relaying process invocation command from the
monitoring computer 11 by the system administrator.
This relaying process 15 can be invoked on any arbitrary
computer connected to the parallel computer 1 by way of
the network 21. It is a normal practice, however, to
invoke the relaying process on a specific computer
accessible by a group of users, such as a control
workstation for the parallel computer 1, because there
is a possibility that the present process is connected
from two or more display processes invoked on plural
computers by two or more users. The system
administrator inputs, as an argument of the process
invocation command for this relaying process 15, a
parameter such as an Internet Protocol address
information of the parallel computer 1 (or, its host
name) needed when a connection request is to be supplied
to the collecting process 3, and a time interval of
capturing performance data. The Invoked relaying
process 15 issues a connection request to the collecting
process 3 by the connection routine 305 of Fig. 4 (step
542). The connection request can be implemented by the
connect system call used in UNIX. At this point,
Internet Protocol address information of the parallel
computer 1 given as an argument of the invocation
command is used as identification information of the
collecting process 3 to which the connection request is
to be issued.
In the collecting process 3 which has received
the connection request, the connection routine 202, 204
executes connection to the connection routine 305 (Fig.
4) in the relaying process 15, thereby enabling the
collecting process 3 to transmit and receive data to or
from the relaying process 15 (step 522). After
completion of the connection, the collecting process 3
transmits to the relaying process 15, the configuration
definition of the parallel computer 1 previously read
from the configuration definition file 208 (step 523).
The present system exchanges data requests, by
transferring messages between the processes which
compose the system. In the present embodiment, a
message is comprised of byte series of variable-length.
The first byte is an identifier field which holds an
identifier indicative of a kind of the message, and the
succeeding data field holds the body of the data. A
message may be comprised of only the identifier field.
For transmission of the configuration definition
by the step 523 above, the internal processing routine
207 (Fig. 3) in the collecting process 3 forms a message,
which includes the configuration definition, in the
input/output buffer 203 provided in correspondence to
the relaying process 15. That is, the identifier field
holds an identifier of one byte which shows that the
present message includes the configuration definition
and the data field holds the Internet Protocol address
of the monitoring computer 11. The message composed
like this is sent to the relaying process 15 by using
the send system call of UNIX through the network 21.
When the relaying process 15 receives this
message from the collecting process 3, the input
analysis routine 306 (Fig. 4) detects, based upon the
identifier in the message, that the message is about the
configuration definition of the parallel computer 1.
The input analysis routine 306 further calculates the
sizes of the input/output buffers 301,302 necessary for
transferring performance data, based upon the number of
nodes included in the configuration definition. The
calculated sizes are used when those input/output
buffers are allocated later on. One input/ output buffer
301 or 302 is allocated corresponding to each display
process 16 or logging process 17 which will be invoked
later on. The sizes of these input/output buffers only
have to be equal to or grater than the length of the
performance data captured at one time step by one
capturing process 4 in one node in the parallel computer
1, multiplied by the number of nodes.
Next, the relaying process 15 requests the
collecting process 3 to invoke the capturing process 4
in each node (step 543). Concretely, the relaying
process 15 transmits a message which contains a request
identifier indicative of the invocation request, to the
collecting process 3, similarly to the transfer of the
computer configuration definition. When the collecting
process 3 receives it, the input analysis routine 205
identifies the content of the request from the
identifier.
In response to the request to invoke the
capturing process 4 given by the relaying process 15,
the collecting process 3 invokes the capturing process 4
on each node 2, using the node address in the
configuration definition previously received (step 524).
The remote shell functionality of UNIX is used for the
invocation. When invoked (step 501), the capturing
process 4 executes initialization including execution of
connection with the collecting process 3 by the
connection routine 100 (Fig. 2), by using the connect
system call of UNIX. Thereafter, the capturing process
4 waits for a monitoring start-up to be requested by the
collecting process 3.
When connection with the collecting process 3 by
the capturing process 4 on each node has been
established, the collecting process 3 notifies the
relaying process 15 of completion of the invocation
processing. In response to the notification, the
relaying process 15 requests the collecting process 3 to
start monitoring (step 544). The message which the
relaying process 15 transmits to the collecting process
3 to request the start-up of monitoring includes an
identifier indicative of the kind of the request and
information on the time interval for capturing the
performance data.
At receipt of the start request message, the
collecting process 3 transfers a start-up request
message to the capturing process 4 in each node (step
525). When the capturing process 4 is invoked, the
counter control/reading routine 104 issues the select
system call, and the capturing process 4 shifts into the
state of waiting for message arrival. When the
capturing process 4 detects message arrival based upon a
return from the select system call, the processing of
the capturing process 4 moves to the input analysis
routine 102. The input analysis routine 102 issues the
receive system call and reads the message which has
arrived, into the input/output buffer 101.
When the input analysis routine 102 confirms
that the identifier at the first field of the message is
the monitoring start-up request identifier, the input
analysis routine 102 takes out the time interval for
capturing performance data included in the message, and
returns to the counter control/reading routine 104,
using this time interval as a return value. When the
capturing process 4 receives the capturing start request
and the capturing process 4 reads the capturing time
interval included in the request, the counter
control/reading routine 104 sets this capturing time
interval in the clock generating routine 107, and the
clock generating routine 107 generates an interrupt into
the counter control/reading routine 104 at the given
time interval set in the clock generating routine 107.
Whenever the counter control/reading routine 104
receives the interrupt from the clock generating routine
107, the counter control/reading routine 104 issues a
function call such as the rstat system call which is the
system call of UNIX for capturing performance data, and
captures performance data from the OS 105 (step 502).
The performance data to be captured are for plural
measurement items, and the number and kinds of the
measurable items are predetermined depending on the
specification of the above-mentioned function call.
Usually, performance data such as the CPU availability
within a unit time, the memory utilization ratio, the
magnetic disk storage device access frequency, and the
communication count by the network (that is, the
transmission count and the receive count) can be
obtained.
OS 105 reads these performance data from the
software counter 106 within the kernel and from hardware
counters 108 in the node, and returns them as output
arguments of the rstat system call. When the counter
control/reading routine 104 of the capturing process 4
has captured performance data, the counter
control/reading routine 104 stores the captured
performance data into the input/output buffer 101, and
hands the control to the output control routine 103.
The output control routine 103 issues the send system
call, thereby transmitting the content of the
input/output buffer 101 to the collecting process 3
through the internal network 5 (step 503).
In the collecting process 3, the internal
processing routine 207 (Fig. 3) monitors arrival of a
message from the capturing process 4 on one of the nodes,
by using a select function which is the system call of
the OS. The message is one which contains individual
performance data of one of the nodes. When the arrival
of the message is confirmed, the internal processing
routine 207 invokes the input analysis routine 205. The
input analysis routine 205 issues the receive system
call and reads the individual performance data included
in the received message into the input/output buffer 201.
Then, the input analysis routine 205 stores the
identifier of the capturing process which has sent the
message, and checks whether the performance data has
been transmitted from all of the capturing processes 4
on the nodes, and returns the control to the internal
processing routine 207. If there is at least one
capturing process 4 which has not transmitted
performance data yet, the internal processing routine
207 issues the select system call and continues to
monitor arrival of a message which contains individual
performance data from that capturing process 4.
If individual performance data has arrived at
the collecting process 3 from all the capturing
processes 4 invoked on the nodes 2, the internal
processing routine 207 copies all the individual
performance data held in the input/output buffers 201
provided for all the capturing processes 4 on all the
nodes 2, into the input/output buffer 203 provided for
the relaying process 15, and assembles those copied
individual performance data into one message. The
message includes a request identifier and succeeding
series of plural individual performance data which have
been sent from the capturing processes 4 on the nodes 2.
Next, the internal processing routine 207
invokes the output control routine 206. The output
control routine 206 issues the send system call of UNIX
and transmits the message which contains the performance
data to the relaying process 15 (step 526).
In the relaying process 15, the internal
processing routine 308 issues the select system call of
UNIX and waits for message arrival from the collecting
process 3. When the internal processing routine 308
detects arrival of the message from the collecting
process 3, it shifts the control to the input analysis
routine 306. The input analysis routine 306 issues the
receive system call of UNIX and reads the performance
data in the message into the input/output buffer 304
which is provided in correspondence to the collecting
process 3 (step 545).
After receipt of the performance data, the
relaying process 15 confirms whether the display process
16 or the logging process 17 is connected to itself.
When any of the display process 16 and the logging
process 17 is not connected to the relaying process 15,
the following transfer processing of the received
performance data is not executed.
When at least one display process 16 is
connected to the relaying process 15, the relaying
process 15 copies the message from the input/output
buffer 304 into the input/output buffer 301 which is
connected to the display process 16 with one to one
correspondence, thus distributing the performance data
to the display process 16 connected to the input/output
buffer 301.
If there are plural input/output buffers 301 to
which plural display processes 16 are connected, the
relaying process 15 distributes the performance data to
all the display processes 16 in the same way. When a
logging process 17 is connected to the relaying process
15, the input/output buffer 301 provided in
correspondence to the logging process 17 is used. The
details of the present distribution processing will be
described later on.
Thus, the user of the present monitoring system
can use the display process 16 or the logging process 17,
if he invokes the display process 16 or the logging
process 17 after the capturing process 4, the collecting
process 3, and the relaying process 15 are invoked by
the system administrator. In this case, the other
computer 11 for monitoring shown in Fig. 1 may be placed
on user's desktop. Thus, it is possible to monitor the
performance data of the parallel computer 1, from a
computer which the system administrator controls and a
personal general purpose computer provided in a remote
location from the former computer. In the present
specification, a general-purpose computer is also called
a computer for monitoring, if it is used for the
monitoring.
In the present embodiment, the relaying process
15 can be invoked on an arbitrary computer, and the
display process 16 or the logging process 17 which uses
the performance data can be invoked on an arbitrary
computer. Performance data for plural measurement items
predetermined beforehand is captured, without depending
on measurement items which the individual display
process 16 requests, and thereafter, the display process
16 selects and uses performance data for the specific
measurement items from the distributed performance data.
If enough number of measurement items are captured by
default, the performance data selected therefrom can
fulfill the user's request.
In addition, all the performance data for plural
predetermined measurement items captured are stored in
the storage device when a logging process is connected
to the relaying process 15, so that a user can select
performance data for an arbitrary measurement item later
on. For this use, too, the performance data for
predetermined measurement items are captured without
depending on measurement items which a user selects.
In addition, the collecting process, the
capturing process, and the relaying process are invoked
independently of the invocation of a display process or
a logging process. The relaying process distributes
performance data captured by the capturing processes to
a display process or a logging process, when the latter
is invoked. As a result, even if presence of an invoked
display process or the number of the invoked display
processes changes, the relaying process, the collecting
process and the capturing processes only have to execute
the same processing.
The operation of the display process 16 is as
follows. The user of the present monitoring system
invokes the display process 16 on a monitoring computer
11 which he uses (step 561 (Fig. 6B)). At that time,
the user has to be informed of the Internet Protocol
address of the computer on which the relaying process 15
is invoked beforehand, and specifies it as an argument
of invocation of the display process 16. When two or
more users use the present monitoring system, they
usually use different monitoring computers. For
instance, two users use different ones of the two
monitoring computers 11 shown in Fig. 1. In the present
embodiment, two or more display processes can be invoked
on the same computer 11 which the same user uses.
At least one display process (a display process
of the first kind) is composed so as to selectively
display performance data for a measurement item
predetermined for the display process, among the
performance data for plural measurement items
distributed by the relaying process 15, using a
graphical symbol or a graphical representation
predetermined for the display processes.
Another display process (a display process of
the second kind) is composed so as to display
performance data for one or plural measurement items
which a user selects after invocation of the display
process, using a graphical symbol or a graphical
representation predetermined for the display process.
Two or more display processes of the second kind are
available in the present embodiment, and they are
composed so that they display a corresponding one of a
group of graphical representation of performance data,
and so that they can be invoked on the same computer for
monitoring.
In addition, a display process of either kind is
composed so as to request the relaying process to
transfer performance data, in response to instructing by
a user after the display process has been invoked.
Different display processes are prepared in
correspondence to different graphical representation of
data, so the structures of the display processes are
rather simple. As a result, in the present embodiment,
a user is required to invoke at least one display
process, if he desires to have performance data to be
displayed on a computer for monitoring. If he requests
display of performance data for plural measurement items,
he will be required to invoke plural display processes.
In that case, the user selects display processes of the
second kind, depending upon graphs he wants to use, and
points out a measurement item to be displayed by each
display process, after the display process is invoked.
In the invoked display process 16, the control
routine 403 executes initialization for the display
screen and initialization for connecting to the relaying
process 15, and then the control is shifted to the
connection routine 406, which issues a connection
request to the relaying process 15 (step 562). When the
relaying process 15 receives the connection request, the
connection routine 303 in the relaying process generates
the input/output buffer 301 and the request flag 302 in
correspondence to the display process and executes
connection to the display process (step 546). When
connection with the display process completes, and data
transfer therewith becomes possible, the relaying
process 15 transmits the configuration definition of the
parallel computer 1 received from the collecting process
3, to the display process 16 connected just now.
The display process 16 receives the
configuration definition, and executes securing of the
send/receive buffer 404 required to store performance
data which will be transferred later on, and calculates
the layout of a graph required to display performance
data of all the nodes, based upon the received
configuration definition. Then, the display process 16
displays a windows on the display device (step 563).
Fig. 7 shows an example of a window where
performance data for plural measurement items
predetermined for a display process (a display process
of the first kind) is displayed. The activity of one
node is shown by two boxes and a pair of two arrows. (601,
602, 603). The overall activity of the entire parallel
computer 1 is shown by arranging such graphical objects
for each node in the parallel computer 1. The heights
of two boxes 601, 602 correspond to the CPU utilization
and the memory utilization ratio on one node,
respectively. The lengths of the pair of two arrows 603
correspond to the transmission count and the receive
count between the node and the network 21.
The display window 610 is composed of a display
area 620 and a control area 630. The user controls the
display process by using the objects such as the buttons
640, 650 arranged in the control areas 630. Data
display is started when the button 640 is pushed, and
the display is stopped when the button 650 is pushed.
Fig. 8 is an example of a window displayed by
another display process (a display process of the second
kind) which displays on one screen, performance data for
one measurement item which a user selects. A bar graph
is displayed in the display area 620. The horizontal
axis 1711 of the bar graph corresponds to different
nodes, and one performance data for one measurement item
is mapped in the vertical axis 1712. A user selects a
measurement item for which the user wants to be mapped
to the vertical axis, from a list 1704 of measurement
items given in the control area 630. The buttons 640,
650 are similar to the case of Fig. 7.
When the user requests start of data display to
a display process which uses the display window 610 or
1700 shown in Fig. 7 or Fig. 8, by pushing the button
640 in the display window 610 or 1700, the display
process 16 transmits a message which requests transfer
of performance data, to the relaying process 15 (step
564). As mentioned above, in the relaying process 15,
the internal processing routine 308 issued the select
system call, and the relaying process 15 is in the state
of waiting for arrival of a message at the input/ output
buffer 301 or 304.
The select system call returns upon the arrival
of the performance data transfer request message from
the display process 16, and when the internal processing
routine 308 detects the arrival of this message, it
shifts the control to the input analysis routine 306.
The input analysis routine 306 issues the receive system
call and reads the request message into the input/output
buffer 301 connected to the display process. Next, the
output control routine 307 checks the identifier of the
request message, confirms that the message is a
performance data transfer request, and sets the request
flag 302 accompanying the input/output buffer 301. When
plural display processes 16 or plural logging processes
17 are invoked by the same user or by different users,
the relaying process 15 repeats all the processing
mentioned above for each connection to those processes.
The operation of the computer system after the
display process 16 is connected to the relaying process
15 and the display is started by the user's screen
operation will be explained below. The performance data
is transferred from the capturing process 4 to the
relaying process 15 by way of the collecting process 3,
by the above-mentioned procedure ( steps 504, 527, 548).
At this time, the relaying process 15 is in the state of
waiting for arrival of a message to the input/ output
buffer 301 or 304, after the select system call was
issued by the internal processing routine 308. In
response to arrival of the message containing the
performance data from the collecting process 3, the
select system call returns to the internal processing
routine 308, and the internal processing routine 308
moves the control to the input analysis routine 306.
The input analysis routine 306 issues the
receive system call and reads the message which has
arrived into the input/output buffer 304. The routine
306 further checks the identifier of the message,
confirms that the message is one which includes
performance data, and returns the processing to the
internal processing routine 308. The internal
processing routine 308 checks the request flags 302
which accompany the input/output buffers 301 connected
to the display processes 16 (step 547). If a request
flag 302 accompanying one of the input/output buffers
301 is set, the internal processing routine 308 memory-copies
the message which contains performance data from
the input/output buffer 304 into the one input/output
buffer 301, and calls the output control routine 307.
The output control routine 307 issues the send
system call, transfers the above-mentioned message
stored in the one input/output buffer 301 to the display
process 16 connected to the one input/output buffer 301,
and clears the request flag 302 which accompanies the
one input/output buffer 301 (step 549). The relaying
process 15 distributes the performance data to all the
display processes 16 connected to the relaying process
15, by repeating the processing mentioned above to the
request flags 302 provided for those display processes
16 connected. It is quite the same, when a logging
process is connected to the input/output buffer 301.
Because the relaying process 15 on the
monitoring computer 11 executes the processing for
distributing data to two or more display processes 16,
as was explained above, increase of the number of
invoked display processes 16 does not influence on the
capturing processes 4 and the collecting process 3 on
the parallel computer 1, and the load of the parallel
computer 1 of a monitoring target stays the same.
When the display process 16 receives the
transferred performance data from the relaying process
15, the display process 15 makes a display screen, by
referring to performance data for at least one
measurement item necessary for the display, among all
the received performance data, and draws the display
screen on the input/output device 12 (step 566). In
case of the display process 16 which has the window of
Fig. 7, the performance data necessary for the display
is performance data for three measurement items
predetermined by the display process such as the CPU
utilization, the memory utilization ratio and the
communication count. In case of the display process 16
which has the window of Fig. 8, the performance data
necessary for the display is performance data for one
measurement item which a user requested the display
process 16.
The display process 16 displays performance data
sent thereto one after another, by repeating the display
operation from steps 564 to 566. That is, the control
routine 403 of the display process 16 transmits a data
transfer request to the relaying process 15 (step 564).
A concrete operation at that time will be explained
later on. Thereafter, the control routine 403 shifts
into a waiting state for detecting either of the window
operation of a user and the arrival of the message which
contains performance data from the relaying process.
When the message which contains performance data arrives
at the relaying process 15, the control routine 403
issues the receive system call, reads the message into
the send/receive buffer 404 (step 565), and moves the
control to the input analysis routine 401.
The input analysis routine 401 confirms that the
identifier of the message sent from the relaying process
15 is an identifier of a message which contains
performance data. Next, the input analysis routine 401
invokes the drawing processing routine 402 and the
drawing processing routine 402 changes the height of the
graph in the window according to the received
performance data (step 566).
When the drawing ends, the processing returns to
the control routine 403. The control routine 403 makes
a performance data transfer request message for
performance data of the next time step, into the
send/receive buffer 404, issues the send system call,
and transmits this message to the relaying process 15
(step 564). The control routine 403 returns to the
above-mentioned waiting state again after this
transmitting.
On the other hand, stop of the display is
achieved by discontinuing transmission of the
performance data transfer request message which is
transmitted after drawing of the performance data for
each time step. When the user pushes the button 605 in
the display window 610, the control routine 403 goes out
of the above-mentioned waiting state and moves the
control to the input analysis routine 401. The input
analysis routine 401 analyzes the request and informs
the control routine 403 that the pushed button is the
stop button 650. The control routine 403 does not
transmit the performance data transfer request message
to the relaying process 15, after this state is detected.
The request flag 302 corresponding to the display
process 16 which does not transfer a performance data
transfer request message is not set. Therefore, the
relaying process 15 does not transmit the performance
data to such a display process 16. Therefore, the
display of the display process 16 stops.
Termination of the display process 16 is
executed by the menu operation of the display window 610.
As with the stop processing, the control routine 403
detects the window operation of user for termination,
goes out of the above-mentioned waiting state and moves
the control to the input analysis routine 401. The
input analysis routine 401 detects that a stop button is
selected from the menu and informs the control routine
403 of the result of the detection. The control routine
403 forms a termination notification message in the
send/receive buffer 404 and sends this message to the
relaying process 15 by the send system call (step 567).
When the relaying process 15 receives the
termination notification message, it disconnects the
display process 16, and releases the input/output buffer
301 and the request flag 302 both allocated to the
display process (step 550). When the connection is
released, the display process 16 executes termination
procedure (step 568), and quits (step 569).
If the connection to all the display processes
16 is closed, the system administrator can execute
termination of the relaying process 15. In order to
begin termination of the relaying process 15, it is
necessary to input an interrupt signal to the relaying
process 15, by using the interrupt function which is
offered by OS controlling the computer 11 on which the
relaying process 15 is invoked.
When the relaying process 15 receives the
interrupt signal, it issues a termination request to the
collecting process 3 (step 551). When the collecting
process 3 receives the termination request, it issues
termination requests to all the capturing processes 4
(step 528), and each capturing process 4 executes
termination, when it receives the termination request
(step 505). If the connection to all the capturing
processes 4 is closed, the collecting process 3 releases
the connection to the relaying process 15. Afterwards,
the collecting process 3 and the relaying process 15
execute termination independently and all processes of
the monitoring system will exit (step 529, 552).
Next, the method of storing performance data in
a storage device 13 by the logging process 17 and
displaying the stored data by the display process 16
will be explained. The logging process 17 shown in Fig.
5 is invoked by the user like the display process 16.
The connection routine 455 issues a connection request
to the relaying process 15, when the logging process 17
is invoked, connects to the relaying process 15
according to the same procedure as the display process
16 executed, and displays a control window (not shown in
the figure) to enable a user to control the operation of
the logging process 17. The display window is similar
to the display window, for instance, 610 (Fig. 7) of the
display process 16, and comprises the control area 630
but not the display area 620.
What the user can control by the control area
630 is selection of measurement items of performance
data items to be stored, designation of the name of a
file which stores the performance data, and indication
of the start and end timings of the storing operation.
When the user indicates start of data logging after he
specifies measurement items for performance data to be
stored and the file name which stores the data by the
operation on control area, the logging process 17
receives performance data just like the display process
16. The input analysis routine 451 confirms that the
identifier of a message sent from the relaying process
15 is an identifier for a message which contains
performance data.
This performance data is stored in the
send/receive buffer 452, and afterwards, this
performance data is reformatted into the form of log
data, by the data reformat routine 453 and is stored in
the storage device 13 such as a magnetic disk storage
device, etc., by the output routine 454.
As shown in Fig. 9D, the log file 1004 first
stores the configuration definition of the parallel
computer 1 such as the total number of nodes of the
parallel computer 1, the attribute of each node, and the
list of nodes which measured the performance data.
After that information, blocks are stored. Each block
corresponds to one of the nodes and one of the time
steps. Each block is composed of plural data records 1002 (Fig. 9B)
which hold performance data captured different
measurement items for the same node at the same step.
The header record 1001 shown in Fig. 9A and the
block end record 1003 shown in Fig. 9C are placed
respectively at the beginning and end of each block.
These records show the boundaries of the block. The
header record includes the block length which shows the
length of the entire block, the list of node numbers of
nodes which measured the performance data included in
the data records 1002 in the block, and time information
indicative of the time step at which the performance
data included in the data records 1002 was measured. In
addition, at the head of every record, there is the type
code by which the kind of the record is shown and the
record length which shows the length of the record.
The order of arrangement of the blocks is that a
block corresponding to one node and one time step is
first stored, and other blocks corresponding to other
nodes and the same time step are stored next. After all
blocks for all nodes for the time step are stored, then
blocks for the subsequent time steps are stored. The
performance data thus stored by the logging process 17
can be displayed by a display process 16. The display
process used for the display may be one which has
already been invoked and is in use for displaying the
performance data in the display window shown in Fig. 7
or Fig. 8, or the display process may be one which has
not been invoked yet.
The case will be explained below where a display
process already invoked is used to display the
performance data is used. The flow chart of Fig. 10
shows the procedure for displaying the stored data by
the display process 16 after it reads the stored data.
First of all, a user operates the input/output device 12
to input the file name of a file where the stored data
which should be displayed is stored (step 1101).
When the user then inputs the request to the
display process 16, for switch to the stored data
display mode, the display process 16 switches to the
stored data display mode (step 1102). At this time, the
display process 16 stops transmission of the performance
data transfer request to the relaying process 15, and
the input source switch routine 405 (Fig. 5) switches
its data input source from the relaying process 15 to
the specified file on the storage device 13.
When the display process 16 opens this file
(step 1104), the display process 16 reads the
configuration definition of the parallel computer 1 held
at the head of the file (step 1105). The display
process 16 saves the configuration definition which it
has used until that time into the buffer (not shown),
calculates the layout of a graph based on the
configuration definition newly read from the file, and
display the graph on the display screen.
Next, the display process 16 reads the file until its
end, counts a total number of blocks included in the
file, and divides this number of blocks with the number
of nodes included in the configuration definition newly
read, to calculate a total number of time steps at which
the stored blocks were measured (step 1106). Next, a
control screen of the log data display function is
displayed (step 1107).
Fig. 11 is one example of the control screen.
The file name read now is displayed in the file name
display field 902 and the number of time steps of the
log data calculated in the processing block 1106 is
displayed in the data count display field 903. The
start and end of the range of the time steps to be
displayed and the number of time steps to be skipped are
respectively inputted in the display range input field
904, 905, and 906. The slider 907 shows the time steps
of the data being displayed now, and movement of the
slider 907 can change the data displayed. The buttons
908, 909, 910, 911 are respectively ones for designating
the single frame step to a preceding time step frame,
stop of continuous display, start of continuous display,
and a single frame step to a succeeding time step frame.
When a user specifies the display time, that is,
the time step of data to be displayed by using such a
control screen 901 in step 1109, the display process 16
reads the content of the file and retrieves the data of
the corresponding time step (step 1110). And, the data
is drawn on the display device (step 1111).
If the continuous display is started by pushing
the button 910 of the control screen 901 in step 1109,
it is repeated to read the data for the one time step
succeeding to the data already read (step 1113) and to
display it (step 1114), until the last time step of the
display range specified by the display range input field
905 is reached or stop of the continuous display is
specified by the display button 909 (step 1112).
As for the time interval by which the display is
repeated, it is possible to adopt the method which
calculates it from the time information in the header
record 1001 stored in the file or the method of
specifying it beforehand, etc., but even if any of these
methods is adopted, time is measured by the clock
generating routine 407 in the display process 16 in Fig.
5 and the drawing processing is executed when the
specified time passes.
When the end of log data display function is
ordered from the input device of the mouse, etc., by
the user (step 1108), termination is executed (step
1115), and the input source switch routine 405 switches
its input source to the relaying process 15. As a
result, the display process 16 returns to a usual data
display mode. At this time, the display process 16
discards the configuration definition read from the file,
revives the configuration definition saved into the
buffer (not shown), and returns the graph on the display
area to the state of a real-time display displayed
before the display is switched to the log data display
mode.
As a result, if both the logging process 17 and
the display process 16 are invoked at the same, it is
possible to display the past data during the present
data is displayed in real time. Moreover, it is
possible to perform a postmortem analysis of the
operation status of the parallel computer 1, by using
the log data stored beforehand. It is possible to
invoke the logging processes 17 concurrently on plural
monitoring computers 11, so that those logging processes
concurrently store the performance data in the storage
device 13 included in those monitoring computers.
In addition, the logging process 17 is not
especially distinguished from the display process 16, if
seen from the relaying process 15. Therefore, the fact
that two or more display processes 16 can be invoked to
one display process means that two or more logging
processes 17 can be invoked to the one relaying process
15. Therefore, two or more users can concurrently use
the data logging function by invoking different logging
processes 17 concurrently, but the concurrent invocation
of those logging processes does not increase the load on
the parallel computer.
SECOND EMBODIMENT
The present invention can be applied also to a
parallel computer different from one used in the first
embodiment. In above-mentioned embodiment, only a
specific node in the parallel computer is connected to
the external network. However, there is one which
includes plural specific nodes connected to this
external network, among the parallel computers which
have already been developed. With such a parallel
computer. It is possible to provide collecting
processes respectively on those specific nodes and to
have the collection of the performance data and the
transfer of the data to the relaying process be shared
by those two or more collecting processes.
That is, the communication between the relaying
process and the collecting process invoked on each
specific node is used, so that the collecting process
requests part of the plural nodes including the specific
node to collect performance data, and transfer those
performance data captured by them to the relaying
process.
The load of each specific node in this second
embodiment is lower than the load of the one specific
node used in the first embodiment where the one specific
node collects performance data from all nodes. Even in
such a parallel computer, the load on the parallel
computer does not increase, when two or more users try
to monitor performance data of the parallel computer
concurrently.
THIRD EMBODIMENT
Nodes of another parallel computer which has
already been developed are divided into plural
partitions each containing two or more nodes. In this
case, each partition can execute one job by two or more
nodes in that partition, in parallel to other partitions.
Of course, it is possible to make two or more jobs be
executed in each partition. However, that parallel
computer is suitable for one user's occupying one
partition. It is effective in such a parallel computer
to monitor the operation situation of each partition
separately from other partitions.
In Fig. 13, for example, the parallel computer 1
is divided into the first partition and the second partition
100A, 100B. Among two or more nodes included in each
partition, a predetermined one node is connected to the
external network 21. The capturing process 4 is invoked
on each node and the collecting process 3 is invoked on
a specific node in each partition connected to the
external network 21. The first relaying process 15A is
invoked on the first monitoring computer 11 to monitor
performance data of the partition 1 and communicates
with the collecting process 3 invoked on the specific
node of the first partition.
In addition, the display process 16A or the
logging process 17A is invoked on the first monitoring
computer 11 and is connected with the first relaying
process 15A. As in the first embodiment, the display
process 16A or the logging process 17A receives the
distribution of performance data of the partition 100A from
the first relaying process 15A.
In addition, when another display process or
another logging process not shown in the figure is
invoked by other computers not shown in the figure, that
another display process or logging process also receives
the distribution of the performance data through the
first relaying process 15A. The second relaying process
15B and the display process 16B or the logging process
17B, and another display process or logging process not
shown in the figure are further invoked concerning the
other partition 100B, in the same way.
In this embodiment, performance data of each
partition can be captured independently of the other
partition. In addition, the load of the parallel
computer 1 still does not increase even when both a
display process and a logging process which monitor the
performance data of the same partition are invoked on
the same monitoring computer or when two or more display
processes which monitor the performance data of the same
partition are invoked on different monitoring computers.
FOURTH EMBODIMENT
The most extreme case of the second embodiment is one
in which all nodes of a parallel computer are connected
with the external network. In this case, a process is
invoked which has both the function of the capturing
process and the function of the collecting process
concurrently on each node, and the relaying process
communicates with and receives performance data of each
node from this process invoked on that node. In this
case, the same process for capturing performance data is
invoked on each node, imbalance of the load among the
nodes of the parallel computer is smaller than that of the first
embodiment.
FIFTH EMBODIMENT
The present invention can be similarly applied
to the distributed computer system composed of two or
more computers connected to the external network.
In this case, the capturing process is invoked on each
of the computers which belong to this distributed system.
The collecting process is invoked on one of the
computers, such as the computer which controls the
network, for instance. The relaying process is invoked
on one of plural computers which become monitoring
targets, among the computers belonging to the
distributed system. The display process or the logging
process is invoked on one of the computers of the
monitoring targets or on one of the other computers of
the distributed system different from those computers of the
monitoring targets. It is possible to invoke the
relaying process on one computer different from the
computers of the monitoring targets.
As a result, the communication between each
capturing process and the collecting process and the
communication between the collecting process and the
relaying process are executed through the external
network, unlike the first embodiment. It is the same,
however, as the first embodiment that two or more display
processes or logging processes can receive the
distribution of the performance data from the relaying
process.
MODIFICATIONS
The present invention is not limited to the
embodiments shown above but includes various
modifications including those to be illustrated below.
(1) Use of the high-speed internal communication
procedure in the parallel computer
It was assumed in the embodiments above that the
communication by TCP/IP was used in the communication
within the parallel computer, that is, at transfer of
performance data from the capturing process 4 to the
collecting process 3. There are many parallel computers
in which plural data are transferred in parallel to each
other by way of different paths in the internal network.
The internal communication procedure lighter and with
more high-speed than TCP/IP is often adopted in the
communication between nodes through the internal network.
In such a computer, it is effective to use the high-speed
internal communication protocol to the internode-communication,
from a view point of the speed-up of the
transferring of performance data, when the method of
transferring performance data captured by various nodes
to the collecting process invoked on one or part of the
nodes of the parallel computer is adopted as shown in
the first to third embodiments.
In this case, in the collecting process 3 shown
in Fig. 3, the input analysis routine 205 and the output
control routine 206 are replaced by a pair of the input
analysis routine and the output control routine both
adapted to the internal communication protocol and a
pair of the input analysis routine and the output
control routine both adapted to the external
communication protocol. These two pairs are used
selectively, depending upon the communication to be
executed is the internal communication or the external
communication. The input/ output buffer 201 and 203 are
respectively used by the first and second pairs.
For example, the data which has been transferred
from the capturing process 4 to the input/output buffer
201 by the internal communication procedure is received
by the input analysis routine adapted to the internal
communication and is passed to the internal processing
routine 207. The internal processing routine 207 calls
the output control routine 206 to communicate with the
relaying process 15 and transfers the data to the
routine 206. The output control routine 206 transmits
the data to the relaying process 15 by a protocol such
as TCP/IP which enables communication with the
monitoring computer 11.
According to the present modification, it is
possible to decrease the load on the parallel computer 1 as
compared to the case where all nodes of the parallel computer
use the external communication protocol with a
comparatively heavy load such as TCP/IP.
(2) Designation of items to be captured from the
relaying process
In the first embodiment, the measurement items which
the capturing process captures are decided beforehand
but these items can be specified from the relaying
process. To realize this, the system administrator
inputs information which specifies these items into the
computer 11, when the system administrator invokes the
relaying process on this computer.
(3) Selection by the relaying process, of part of the
measurement items of the captured performance data
In the first embodiment, the performance data for
plural measurement items (for instance, the CPU
utilization, the memory utilization ratio, the magnetic
disk storage device access frequency, and communication
count) captured by the capturing process are always
transferred to the display process 16 by way of the
collecting process 3 and the relaying process 15. If
the relaying process 15 selects performance data for
measurement items necessary for the display by the
display process and transfers them to the display
process 16, the transferred amount of data can be
decreased. To realize this operation, the display
process 16 notifies the relaying process 15 of
performance data which the display process 16 should
display, immediately after the display process is
invoked by a user and the connection is established with
the relaying process 15 (step 562 (Fig. 6B)).
The relaying process 15 stores the measurement
items which each display process needs. When the
internal processing routine 308 in the relaying process
15 memory-copies the performance data received from the
collecting process and held in the input/output buffer
304 into the input/output buffer 301 connected to the
display process, not all the received performance data
is copied but only performance data for measurement
items stored for the display process are selectively
copied.
(4) Selective capturing of performance data for selected
measurement items
In the first embodiment, the relaying process
requests the collecting process, independently of the
invocation of the display process or the logging process,
to collect performance data. However, it is possible to
make the relaying process, so that it issues this
request after either of the display process or the
logging process is invoked.
In that case, the display process or the logging
process notifies the relaying process of the measurement
items which a user has requested, and the relaying
process requests the collecting step of the computer of the
monitoring target to capture performance data for
measurement items which those processes have notified.
It is desirable to renew the measurement items
which the relaying process requests the collecting step,
when another display process or another logging process
is newly invoked, so that measurement items which the
process newly invoked requests should be add to the
requested measurement items. According to this method,
the amount of performance data to be captured decreases
because only necessary performance data are captured.
(5) Batch transmission of performance data captured for
plural time steps
In the first embodiment, performance data is
transmitted from the capturing process 4 to the display
process 16 every time step at which the data is captured,
but it is possible to transmit the performance data
captured at plural time steps are transmitted at a time.
The modification will be explained below.
In Fig. 2, when the output control routine 103
of the capturing process 4 receives data from the
counter control/reading routine 104, the routine 103
stores the data at the tail at that time in the
input/output buffer 101, and stores the total number of
records stored in the input/output buffer 101. When the
number of records in the input/output buffer 101 reaches
a predetermined value, the output control routine 103
transmits the data stored therein so far to the
collecting process 3 as one data. The collecting
process 3 and the relaying process 15 executes
operations similar to those in the first embodiment.
In Fig. 5, when the display process 16 receives
this data, it reads and displays the data for one time
step from the data in the send/receive buffer 404 at
regular intervals, by referring to the clock generating
routine 407. When the display process 16 finishes
processing all the data in the send/receive buffer 404,
it transmits a data request to the relaying process 15.
With respect to the logging process 17, there is no
change in its operation and it stores the data like the first
embodiment. As a result, it is possible to reduce the
transfer count of the captured data and to decrease the
communication load.
According to the present invention, the load of
the computer of the monitoring target does not almost
increase, even if the number of processes (the display
process or the logging process) which use performance
data captured by the computer of the monitoring target
increases.