EP0794433A1 - API estimate using multiple fluorescence measurements - Google Patents
API estimate using multiple fluorescence measurements Download PDFInfo
- Publication number
- EP0794433A1 EP0794433A1 EP97301396A EP97301396A EP0794433A1 EP 0794433 A1 EP0794433 A1 EP 0794433A1 EP 97301396 A EP97301396 A EP 97301396A EP 97301396 A EP97301396 A EP 97301396A EP 0794433 A1 EP0794433 A1 EP 0794433A1
- Authority
- EP
- European Patent Office
- Prior art keywords
- oil
- sample
- emission
- fluorescence
- solvent
- Prior art date
- Legal status (The legal status is an assumption and is not a legal conclusion. Google has not performed a legal analysis and makes no representation as to the accuracy of the status listed.)
- Withdrawn
Links
Images

Classifications
-
- E—FIXED CONSTRUCTIONS
- E21—EARTH DRILLING; MINING
- E21B—EARTH DRILLING, e.g. DEEP DRILLING; OBTAINING OIL, GAS, WATER, SOLUBLE OR MELTABLE MATERIALS OR A SLURRY OF MINERALS FROM WELLS
- E21B49/00—Testing the nature of borehole walls; Formation testing; Methods or apparatus for obtaining samples of soil or well fluids, specially adapted to earth drilling or wells
- E21B49/005—Testing the nature of borehole walls or the formation by using drilling mud or cutting data
-
- G—PHYSICS
- G01—MEASURING; TESTING
- G01N—INVESTIGATING OR ANALYSING MATERIALS BY DETERMINING THEIR CHEMICAL OR PHYSICAL PROPERTIES
- G01N21/00—Investigating or analysing materials by the use of optical means, i.e. using sub-millimetre waves, infrared, visible or ultraviolet light
- G01N21/62—Systems in which the material investigated is excited whereby it emits light or causes a change in wavelength of the incident light
- G01N21/63—Systems in which the material investigated is excited whereby it emits light or causes a change in wavelength of the incident light optically excited
- G01N21/64—Fluorescence; Phosphorescence
-
- G—PHYSICS
- G01—MEASURING; TESTING
- G01N—INVESTIGATING OR ANALYSING MATERIALS BY DETERMINING THEIR CHEMICAL OR PHYSICAL PROPERTIES
- G01N33/00—Investigating or analysing materials by specific methods not covered by groups G01N1/00 - G01N31/00
- G01N33/24—Earth materials
- G01N33/241—Earth materials for hydrocarbon content
-
- G—PHYSICS
- G01—MEASURING; TESTING
- G01N—INVESTIGATING OR ANALYSING MATERIALS BY DETERMINING THEIR CHEMICAL OR PHYSICAL PROPERTIES
- G01N33/00—Investigating or analysing materials by specific methods not covered by groups G01N1/00 - G01N31/00
- G01N33/26—Oils; viscous liquids; paints; inks
- G01N33/28—Oils, i.e. hydrocarbon liquids
- G01N33/2823—Oils, i.e. hydrocarbon liquids raw oil, drilling fluid or polyphasic mixtures
-
- G—PHYSICS
- G01—MEASURING; TESTING
- G01N—INVESTIGATING OR ANALYSING MATERIALS BY DETERMINING THEIR CHEMICAL OR PHYSICAL PROPERTIES
- G01N21/00—Investigating or analysing materials by the use of optical means, i.e. using sub-millimetre waves, infrared, visible or ultraviolet light
- G01N21/62—Systems in which the material investigated is excited whereby it emits light or causes a change in wavelength of the incident light
- G01N21/63—Systems in which the material investigated is excited whereby it emits light or causes a change in wavelength of the incident light optically excited
- G01N21/64—Fluorescence; Phosphorescence
- G01N2021/6417—Spectrofluorimetric devices
- G01N2021/6421—Measuring at two or more wavelengths
Definitions
- the invention is related to techniques for evaluating the hydrocarbon content and composition of an underground formation. More particularly, the invention relates to fluorescence measurements and to their use in characterizing oils/oil extracts to determine similarities of oils from different sources. Still more particularly this invention relates to a method of using a portable fluorometer in the field to provide a reliable value for the API gravity range ( ⁇ 5°) of in-situ liquid hydrocarbon.
- Ultra-violet fluorescence spectroscopy has long been used as a means for detecting aromatic hydrocarbons. Important applications for this technology include the measurement of petroleum hydrocarbons in samples such as drill cuttings, cores, and soil samples by fluorescence examination of solvent extracts of these solids.
- Fluorescence spectrophotometry is also used for oil prospecting via remote sensing or near surface sampling methods.
- U.S.G.S. Open-File Report 84-385, 34 pp (1984) in an article by M. E. Henry and T.S. Donovan entitled "Luminescence Properties and Chemical Geochemical Prospecting", there is a discussion of the technology for this use.
- the use of fluorescence techniques for geochemical prospecting is discussed in an article by C. F. Hebert entitled, “Geochemical Prospecting for Oil and Gas Using Hydrocarbon Fluorescence Techniques", 3RD Southern Cincinnati Univ. Symp. - Unconventional Methods in Exploration for Petroleum and Natural Gas, Processing, (1984) pp. 40-58.
- U.S. Patent No. 4,609,821 discloses a process to test for the presence of hydrocarbons within drill cuttings. This process is applicable only to oil base mud drill cuttings. The cuttings are excited with a wide range of UV wavelengths and the emitted radiation is recorded over a wide range of wavelengths to produce an analytical chemical profile. This profile of intensity over multiple wavelengths of excitation and emission radiation is compared with previous profiles to determine the presence of hydrocarbons not associated with the oil mud base.
- the method of U.S. 4,990,773, incorporated by reference herein in its entirety comprises determining the producibility of any hydrocarbons present in a formation by employing two solvents, one of which will solvate all petroleum fractions, including asphaltenes, and a second which will solvate most crude fractions without substantially solvating asphaltenes.
- An indication of producibility or viscosity can be obtained by comparing the ratio of the emission fluorescence of the two solvated samples with previous correlations.
- API gravity of oil One property of oil or oil samples which is a valuable tool to technicians is the API gravity of oil. Any information regarding oil gravity is extremely valuable in the decision making and planning required during the development of an oil production prospect, however it is generally not possible to obtain an accurate determination of the API gravity of oil in a production prospect in situ or in the field.
- the viscosity and volatility of a crude oil may vary widely with variations in API gravity particularly with respect to gravities above about 50 degrees.
- API gravity the change in viscosity which accompanies a change of from 11 to 12 degrees in API gravity is approximately 62 centipoises.
- the change in viscosity as the gravity changes from 18 to 19 degrees API is only approximately 3 centipoise. It is important to determine the oil gravity as precisely as possible and as early as possible in the pre-development economic studies of an oil production prospect.
- a calibration curve is prepared by retorting oils which have known gravities and similar chemical compositions and measuring the refraction indexes of the liquids condensed from the retorting.
- the gravity of the oil being tested is then determined by measuring the refractive index of its distillate and assuming that its gravity equals that of an oil of known gravity from which a distillate of similar refractive index is obtained.
- Patents in the art relating to the determination of API gravity include, for example, U.S. 3,753,654; 3,953,171; 4,153,415; and 4,248,599.
- the methods available have numerous disadvantages. Although direct measurements are, of course, the most accurate, they are also the most expensive and time consuming or require a relatively large sample.
- Numerous of the lighter or more volatile components of a crude oil may be cracked or depolymerized during a retorting operation in which the vapors are condensed to a liquid. Because of this a property such as refractive index of the distillate may vary from chemical composition and reactivity factors that are not related to the API gravity of the oil.
- the invention comprises a method of evaluating a sample of underground formation to determine the API gravity of any hydrocarbons present in the formation which comprises:
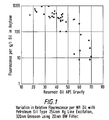
- Figure 1 is a graph which plots the variation in relative fluorescence per weight oil with petroleum oil of type 254nm Hg line excitation and 320nm emission using a 20 nm BW filter.
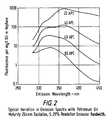
- Figure 2 is a plot of fluorescence per mg/l oil in heptane versus emission wavelength(nm) and shows the typical variation in emission spectra with petroleum oil maturity 254 excitation, 6.25% resolution emission band width.
- Figure 3 is a plot of actual fluorescence per mg/l oil versus calculated fluorescence per mg/l oil in heptane, and specifically shows actual versus calculated fluorescence per wt. oil using emission intensities at 290 nm and 365 nm(6.25% resolution) and 254 nm excitation.
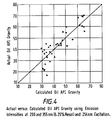
- Figure 4 is a plot of actual oil API gravity versus calculated oil API gravity, specifically showing actual oil API gravity using emission intensities at 290 and 365 nm(6.25% resolution) and 254 nm excitation.
- fluorescence is a phenomena wherein certain compounds, containing molecular arrangements generally referred to as chromophores, emit fluorescent radiation when excited by incoming light of certain wavelengths.
- TSF Total scanning (multiple excitation/emission wavelengths) fluorescence (TSF) measurements are used to further characterize oils/oil extracts and determine similarities of oils from different sources.
- TSF requires a relatively large, computer controlled, permanently installed instrument in a laboratory environment.
- total scanning fluorescence or 3-D fluorescence a sample is excited over a range of discrete wavelengths and the emitted radiation is recorded at various wavelengths (EM) for each sample.
- EM wavelengths
- Total scanning fluorescence has indicated that the optimum excitation and emission wavelengths for most crude oils fall below 400 nanometers. This is a region undetectable to the human eye.
- the optimum excitation wavelength for most crude oils is in the region of about 250 to 310 nanometers.
- the predominant portion of emitted radiation falls in the nonvisible ultraviolet region of about 300 to about 400 nanometers.
- QFTTM Single point (fixed excitation/emission wavelength) fluorescence measurements are used to determine the approximate quantity of oil in formation samples (QFTTM).
- QFTTM is the tradename for Quantitative Fluorescence Technique, a method for detecting oil in formations which was developed and patented by Texaco Inc. (U.S. Pat. No. 4,977,319).
- QFTTM can be accomplished with a relatively small, portable fluorometer, while TSF requires a relatively large, fixed instrument in a laboratory environment.
- the primary (most intense) peak for crude oils generally occurs in the spectral region between 300nm and 360nm.
- the position of the maximum fluorescence peak is dependent on the predominant fluorescing species(aromatics) found in the crude oil mixture.
- the two to four-ring aromatics and their derivatives have considerable overlap in the 320nm to 380nm spectral range.
- Most of the heavier polyaromatics consisting of five to six rings emit fluorescence to 400nm and extend into the visible range (410nm to 800nm).
- a reliable value for API gravity can be ascertained by solvating a known volume of an underground formation sample in a known volume of a solvent which will solvate hydrocarbons, quantitatively measuring with a changeable filter portable fluorometer the emission fluorescence of the solvated sample at two emission intensity points below an excitation wavelength of about 400 nm, characterizing the oil by the ratio of two emission intensities obtained at a fixed excitation wavelength;
- the solvent serves as a diluent.
- a wide variety of solvents capable of solvating hydrocarbons may be used in the invention.
- One suitable group of solvents is low molecular weight aliphatic hydrocarbons having more than four carbon atoms such as pentane, hexane, heptane, and higher.
- Chlorinated hydrocarbons such as methylene chloride, chloroform, carbon tetrachloride, trichloroethane, and others are also effective, however strong solvents may lessen the accuracy of the invention method due to their ability to dissolve other sample constituents than hydrocarbons.
- Aromatic solvents are generally not preferred because of their inherent fluorescence.
- oxygenated hydrocarbon solvents possessing hydrophilic and hydrophobic properties include, but are not limited to, methanol, ethanol, 1-propanol, 2-propanol(isopropanol), 2-methyl-2-propanol, and allyl alcohol.
- 2-propanol is capable of breaking through the water barrier while, at the same time, solvating the aromatic portion without extracting asphaltenes and other heavy fractions.
- Figure 1 shows a graph of relative intensities per gm/l oil versus API gravity for a series of reservoir oils diluted in heptane solvent. These values were obtained using 254 nm mercury line excitation and measuring the fluorescence at 320 nm with a 20 nm band-pass interference filter at 90 degrees to the excitation beam. Sample dilutions were adjusted such that absorption effects were less than about 5% relative. The general trend of decreasing fluorescence with increasing API gravity reflects the fact that oils tend to lose aromatic content as they mature. The 100-fold variation in intensity per wt. oil for this fixed point measurement requires that a reference oil similar to the sample oil be available for calibration purposes if absolute oil quantities are desired. In many cases however, the type as well as the amount of oil are unknown so that only relative oil amounts can be determined for those samples judged to contain the same oil type.
- Figure 2 presents 254 nm excitation emission spectra for four of the oils in Figure 1 which have widely differing yields. These scans were obtained from dilute heptane solutions with a grating spectrophotometer using 4 nm slit widths. The spectra have been artificially broadened to mimic the effect of using 6.25% resolution interference filters to demonstrate that high resolution is not required to detect spectral variations of interest.
- fluorescence yield decreases at all wavelengths but the percentage decrease is largest at the longer wavelengths. In compositional terms, this phenomena arises from preferential loss of the larger aromatic structures relative to the smaller.
- each oil has a unique, highly complex composition based on its detailed genesis, correlations of oil properties with specific spectral features are not perfect. Nonetheless estimation of some properties, fluorescent yield and API gravity in particular, can usefully be performed by characterizing the oil by the ratio of two intensities of differing emission wavelengths obtained at a fixed excitation (for example, by use of the 254 nm mercury line).
- Figure 4 compares actual to predicted oil gravities. Again, while the estimated gravity is of limited accuracy, it is adequate in field situations to be of value in formation evaluation. Since gravity is a bulk property while fluorescence examines only the aromatic oil fraction, the lack of precise correlation is not surprising. Inclusion of additional intensity emission wavelengths to the regression in fact yields only a modest increase in predictive accuracy.
Abstract
A method for evaluating the API gravity of a sample of underground formation which comprises:
- Solvating a known volume of an underground formation sample in a known volume of a solvent which will solvate hydrocarbons;
- Quantitatively measuring with a changeable filter portable fluorometer the emission fluorescence of the solvated sample at a fixed excitation wavelength with measurements of emission intensities at two points;
- determining the yield;
- applying regression analysis to a data base of oils to obtain an equation which results in an algorithm value; and
- interpreting the value of the algorithm to give a value for API gravity and estimate in-situ oil concentration.
Description
- The invention is related to techniques for evaluating the hydrocarbon content and composition of an underground formation. More particularly, the invention relates to fluorescence measurements and to their use in characterizing oils/oil extracts to determine similarities of oils from different sources. Still more particularly this invention relates to a method of using a portable fluorometer in the field to provide a reliable value for the API gravity range (±5°) of in-situ liquid hydrocarbon.
- Fluorescence has been used for decades as a logging technique for detecting oil in drill cuttings. For much of that time the method used to determine the presence of oil in drill cuttings was crude, wherein an operator exposed the cuttings sample to a broad spectrum ultraviolet light in order to see fluorescence which indicated the presence of oil.
- Ultra-violet fluorescence spectroscopy has long been used as a means for detecting aromatic hydrocarbons. Important applications for this technology include the measurement of petroleum hydrocarbons in samples such as drill cuttings, cores, and soil samples by fluorescence examination of solvent extracts of these solids.
- Molecular fluorescence is discussed in general in Principles of Instrumental Analysis, by Skoog, Douglas, Sanders College Publishing, Philadelphia (3rd ed. 1985), pp 225-240. The discussion in this reference indicates that the greatest fluorescence behavior occurs with compounds containing aromatic functional groups and includes a table which gives the UV fluorescence wavelengths associated with numerous benzene derivatives in ethanol solution. Also several analytical profiles of hydrocarbons are disclosed wherein fluorescence intensity is plotted over multiple excitation and emission wavelengths.
- Fluorescence spectrophotometry is also used for oil prospecting via remote sensing or near surface sampling methods. In U.S.G.S. Open-File Report 84-385, 34 pp (1984) , in an article by M. E. Henry and T.S. Donovan entitled "Luminescence Properties and Chemical Geochemical Prospecting", there is a discussion of the technology for this use. The use of fluorescence techniques for geochemical prospecting is discussed in an article by C. F. Hebert entitled, "Geochemical Prospecting for Oil and Gas Using Hydrocarbon Fluorescence Techniques", 3RD Southern Methodist Univ. Symp. - Unconventional Methods in Exploration for Petroleum and Natural Gas, Processing, (1984) pp. 40-58.
- The emission fluorescence of crude oil samples has been studied and recorded over various wavelengths, including ultraviolet wavelengths below 400nm. There have been "fingerprint" studies at, for example, Bartlesville Energy Technology Center, where the emission fluorescence of various types of crude oils has been recorded at different excitation wavelengths. Research of this type at the Department of Energy was related to earlier work by the Bureau of Mines to try to identify crude oil by emission fluorescence for the purpose of pollution control. See Chisholm, B. R., Eldering, H. G., Giering, L.P., and Horning, A.W. Total Luminescence Contour spectra of six topped crude oils, BETC/RI-76/15, a paper prepared for ERDA for the Bartlesville Energy Research Center in Bartlesville, Oklahoma, November 1976; and Brownrigg, J.T., and Hornig, A.W., Low Temperature Total Luminescence Contour Spectra of Six Topped Crude Oils and Their Vacuum Distillate and Residuum Fractions, BETC/RI - 78/13, a paper prepared for DOE for the Bartlesville Energy Technology Center, Bartlesville, Oklahoma, July 1978.
- Several patents in recent years disclose the use of fluorescence measurement in methods to test for the presence of hydrocarbons or to determine concentration or producibility.
- U.S. Patent No. 4,609,821 discloses a process to test for the presence of hydrocarbons within drill cuttings. This process is applicable only to oil base mud drill cuttings. The cuttings are excited with a wide range of UV wavelengths and the emitted radiation is recorded over a wide range of wavelengths to produce an analytical chemical profile. This profile of intensity over multiple wavelengths of excitation and emission radiation is compared with previous profiles to determine the presence of hydrocarbons not associated with the oil mud base.
- In U.S. Patent No. 4,977,319, incorporated by reference herein in its entirety, there is disclosed a method of determining the presence and concentration of hydrocarbons in a formation. The method involves the steps of solvating a sample in a known volume of solvent, measuring the emission fluorescence of the excited sample below about 400 nm, and comparing the emission fluorescence to previous correlations drawn between known hydrocarbon contents of samples and the emission fluorescence of the known samples in the solvent.
- The method of U.S. 4,990,773, incorporated by reference herein in its entirety, comprises determining the producibility of any hydrocarbons present in a formation by employing two solvents, one of which will solvate all petroleum fractions, including asphaltenes, and a second which will solvate most crude fractions without substantially solvating asphaltenes. An indication of producibility or viscosity can be obtained by comparing the ratio of the emission fluorescence of the two solvated samples with previous correlations.
- One property of oil or oil samples which is a valuable tool to technicians is the API gravity of oil. Any information regarding oil gravity is extremely valuable in the decision making and planning required during the development of an oil production prospect, however it is generally not possible to obtain an accurate determination of the API gravity of oil in a production prospect in situ or in the field.
- The viscosity and volatility of a crude oil may vary widely with variations in API gravity particularly with respect to gravities above about 50 degrees. For example, in a typical heavy oil prospect, the change in viscosity which accompanies a change of from 11 to 12 degrees in API gravity is approximately 62 centipoises. However, the change in viscosity as the gravity changes from 18 to 19 degrees API is only approximately 3 centipoise. It is important to determine the oil gravity as precisely as possible and as early as possible in the pre-development economic studies of an oil production prospect.
- Presently no methods are available for accurate or reliable estimates of in-situ API gravity in the field. The most closely related methods available include:
- (a) direct measurements on oil samples recovered from production tests obtained by formation fluid-sampling logging devices or the like;
- (b) measurements of the refractive index (RI) of oil retorted from cores or samples of the reservoir formation.
- In the latter method, a calibration curve is prepared by retorting oils which have known gravities and similar chemical compositions and measuring the refraction indexes of the liquids condensed from the retorting. The gravity of the oil being tested is then determined by measuring the refractive index of its distillate and assuming that its gravity equals that of an oil of known gravity from which a distillate of similar refractive index is obtained.
- Patents in the art relating to the determination of API gravity include, for example, U.S. 3,753,654; 3,953,171; 4,153,415; and 4,248,599. Generally the methods available have numerous disadvantages. Although direct measurements are, of course, the most accurate, they are also the most expensive and time consuming or require a relatively large sample. Numerous of the lighter or more volatile components of a crude oil may be cracked or depolymerized during a retorting operation in which the vapors are condensed to a liquid. Because of this a property such as refractive index of the distillate may vary from chemical composition and reactivity factors that are not related to the API gravity of the oil.
- It would be extremely advantageous in the art if it were possible to accurately estimate the API gravity of in situ oil. Reliable data would be a valuable planning tool during the development of an oil production prospect.
- In accordance with the foregoing the invention comprises a method of evaluating a sample of underground formation to determine the API gravity of any hydrocarbons present in the formation which comprises:
- solvating a known volume of an underground formation sample in a known volume of a solvent which will solvate hydrocarbons;
- quantitatively measuring with a changeable filter portable fluorometer the emission fluorescence of the solvated sample at a fixed excitation wavelength and measuring emission intensity at two points;
- determining the yield;
- applying regression analysis to a data base of oils to obtain an equation which results in an algorithm value; and
- interpreting the value of the algorithm to give a value for API gravity and concentration.
- Figure 1 is a graph which plots the variation in relative fluorescence per weight oil with petroleum oil of type 254nm Hg line excitation and 320nm emission using a 20 nm BW filter.
- Figure 2 is a plot of fluorescence per mg/l oil in heptane versus emission wavelength(nm) and shows the typical variation in emission spectra with
petroleum oil maturity 254 excitation, 6.25% resolution emission band width. - Figure 3 is a plot of actual fluorescence per mg/l oil versus calculated fluorescence per mg/l oil in heptane, and specifically shows actual versus calculated fluorescence per wt. oil using emission intensities at 290 nm and 365 nm(6.25% resolution) and 254 nm excitation.
- Figure 4 is a plot of actual oil API gravity versus calculated oil API gravity, specifically showing actual oil API gravity using emission intensities at 290 and 365 nm(6.25% resolution) and 254 nm excitation.
- In accordance with the foregoing we have found in the instant invention that for naturally occurring petroleum oils, systematic variations in emission spectra features can be related to fluorescence yield. In this invention portable fluorometers are used to characterize oil by the ratio of two intensities of differing emission wavelengths obtained at fixed excitation (for example by use of the 254 nm mercury line).
- As noted, fluorescence is a phenomena wherein certain compounds, containing molecular arrangements generally referred to as chromophores, emit fluorescent radiation when excited by incoming light of certain wavelengths. The chromophores contained in compounds such as the asphaltenic, aromatic and resin fractions of crude, fluoresce in the UV and visible portion of the electromagnetic spectrum when bombarded with radiation of the proper excitation wavelength.
- Total scanning (multiple excitation/emission wavelengths) fluorescence (TSF) measurements are used to further characterize oils/oil extracts and determine similarities of oils from different sources. TSF requires a relatively large, computer controlled, permanently installed instrument in a laboratory environment.
- In total scanning fluorescence or 3-D fluorescence a sample is excited over a range of discrete wavelengths and the emitted radiation is recorded at various wavelengths (EM) for each sample. Total scanning fluorescence has indicated that the optimum excitation and emission wavelengths for most crude oils fall below 400 nanometers. This is a region undetectable to the human eye. The optimum excitation wavelength for most crude oils is in the region of about 250 to 310 nanometers. The predominant portion of emitted radiation falls in the nonvisible ultraviolet region of about 300 to about 400 nanometers.
- Single point (fixed excitation/emission wavelength) fluorescence measurements are used to determine the approximate quantity of oil in formation samples (QFT™). QFT™ is the tradename for Quantitative Fluorescence Technique, a method for detecting oil in formations which was developed and patented by Texaco Inc. (U.S. Pat. No. 4,977,319). QFT™ can be accomplished with a relatively small, portable fluorometer, while TSF requires a relatively large, fixed instrument in a laboratory environment.
- By using a scale of fluorescence intensity and instrumentally measuring the fluorescence of a formation sample from cores or drill cuttings a number proportional to the hydrocarbon content of the sample can be derived, as discussed in U. S. 4,977,319, supra.
- The primary (most intense) peak for crude oils generally occurs in the spectral region between 300nm and 360nm. The position of the maximum fluorescence peak is dependent on the predominant fluorescing species(aromatics) found in the crude oil mixture.
- The two to four-ring aromatics and their derivatives have considerable overlap in the 320nm to 380nm spectral range. Most of the heavier polyaromatics consisting of five to six rings emit fluorescence to 400nm and extend into the visible range (410nm to 800nm).
- As indicated direct measurement on oil samples from production tests by logging devices, has certain limitations. This method is limited by a high degree of variation in fluorescence yield for naturally occurring oils. And, measurement of the refractive index of oil retorted from core samples does not lend itself to use in the field. Furthermore, when developing a new prospect, samples of similar oils may not be available for comparison.
- In the present invention it is found that for naturally occurring petroleum oils, systematic variations in emission spectra features can be related to fluorescence yield. A reliable value for API gravity can be ascertained by solvating a known volume of an underground formation sample in a known volume of a solvent which will solvate hydrocarbons, quantitatively measuring with a changeable filter portable fluorometer the emission fluorescence of the solvated sample at two emission intensity points below an excitation wavelength of about 400 nm,
characterizing the oil by the ratio of two emission intensities obtained at a fixed excitation wavelength; - determining the yield;
- applying regression analysis to a data base of oils to obtain an equation which results in an algorithm value; and
- interpreting the value of the algorithm to give a value for API gravity and concentration.
- Where the sample is oil, rather than a sample such as a side wall sample or drill cuttings, the solvent serves as a diluent.
- A wide variety of solvents capable of solvating hydrocarbons may be used in the invention. One suitable group of solvents is low molecular weight aliphatic hydrocarbons having more than four carbon atoms such as pentane, hexane, heptane, and higher. Chlorinated hydrocarbons such as methylene chloride, chloroform, carbon tetrachloride, trichloroethane, and others are also effective, however strong solvents may lessen the accuracy of the invention method due to their ability to dissolve other sample constituents than hydrocarbons. Aromatic solvents are generally not preferred because of their inherent fluorescence.
- Another group of solvents which is very useful has been identified and described in copending U.S. Serial No.08/637,982. This includes oxygenated hydrocarbon solvents possessing hydrophilic and hydrophobic properties. Examples include, but are not limited to, methanol, ethanol, 1-propanol, 2-propanol(isopropanol), 2-methyl-2-propanol, and allyl alcohol. In particular, 2-propanol is capable of breaking through the water barrier while, at the same time, solvating the aromatic portion without extracting asphaltenes and other heavy fractions.
- Figure 1 shows a graph of relative intensities per gm/l oil versus API gravity for a series of reservoir oils diluted in heptane solvent. These values were obtained using 254 nm mercury line excitation and measuring the fluorescence at 320 nm with a 20 nm band-pass interference filter at 90 degrees to the excitation beam. Sample dilutions were adjusted such that absorption effects were less than about 5% relative. The general trend of decreasing fluorescence with increasing API gravity reflects the fact that oils tend to lose aromatic content as they mature. The 100-fold variation in intensity per wt. oil for this fixed point measurement requires that a reference oil similar to the sample oil be available for calibration purposes if absolute oil quantities are desired. In many cases however, the type as well as the amount of oil are unknown so that only relative oil amounts can be determined for those samples judged to contain the same oil type.
- Figure 2 presents 254 nm excitation emission spectra for four of the oils in Figure 1 which have widely differing yields. These scans were obtained from dilute heptane solutions with a grating spectrophotometer using 4 nm slit widths. The spectra have been artificially broadened to mimic the effect of using 6.25% resolution interference filters to demonstrate that high resolution is not required to detect spectral variations of interest. In general, as oils mature (increase in API gravity), fluorescence yield decreases at all wavelengths but the percentage decrease is largest at the longer wavelengths. In compositional terms, this phenomena arises from preferential loss of the larger aromatic structures relative to the smaller.
- Because each oil has a unique, highly complex composition based on its detailed genesis, correlations of oil properties with specific spectral features are not perfect. Nonetheless estimation of some properties, fluorescent yield and API gravity in particular, can usefully be performed by characterizing the oil by the ratio of two intensities of differing emission wavelengths obtained at a fixed excitation (for example, by use of the 254 nm mercury line).
- For the determination of yield, the ratio of emission intensities at about 290 and 365 nm gives close to optimum correlation. For the purpose of illustration, a yield Y equal to the intensity average divided by the oil concentration will be used:

- Where
- EM1 = emission at 290 nm for 254 nm excitation
- EM2 = emission at 365 nm for 254 nm excitation
- Where
- R = EM1/EM2 = emission intensity ratio and
- std dev = 0.3223, r-squared = 0.961.
- In Figure 3 are plotted calculated versus actual yields for the oils included in the analyses. The standard deviation obtained indicates that, with 95% confidence, the actual yield can be calculated for equation (2) to within a factor of 1.9. While this uncertainty precludes use of the method for precise oil quantitation, it is substantially smaller than the 100-fold uncertainty seen for the single point technique.
- Regression of the same intensity ratio against API gravity gives the equation:

- with std. dev - 7.1 deg API, r-squared - 0.753
- Figure 4 compares actual to predicted oil gravities. Again, while the estimated gravity is of limited accuracy, it is adequate in field situations to be of value in formation evaluation. Since gravity is a bulk property while fluorescence examines only the aromatic oil fraction, the lack of precise correlation is not surprising. Inclusion of additional intensity emission wavelengths to the regression in fact yields only a modest increase in predictive accuracy.
- The numeric values for the equation coefficients given here are specific to the spectral response and calibration of the instrument used and are presented for illustrative purposes only. Emission spectra are artificially broadened to mimic use of 6.25% resolution filters rather than a precision grating monochromator.
- The following examples will further illustrate the novel method of determining API gravity and wt% from formation samples by the preferred embodiment and calculated using algorithms. These examples are given by way of illustration and not as limitations on the scope of the invention. Thus, it should be understood that the steps of the invention method may be varied to achieve similar results within the scope of the invention.
- 500 mg of cuttings were extracted with 5 ml. of heptane. Dilution by a factor of 1000 was required to bring the fluorescence to the linear response range. Measured intensity values in instrument units were:
EM1(290nm) =48.74 and EM2(365nm) = 1867
Calculated values:
R = 48.74/1867 = 0.0261 intensity ratio


- 500 mg of solids were extracted with 5 ml of heptane.
- Dilution by a factor of 200 was required to bring the fluorescence to the linear response range. Measured intensity values in instrument units were:
- EM1(290nm)=183.9 and EM2 (365nm) = 1607
- Calculated values:
- R = 183.9/1607 =0.1144 intensity ratio
- Assuming a core bulk density of 2.5 g/cc, the volume % of oil is estimated to be 3.7 2.5/0.79 = 12%.
- 500 mg of soil was extracted with 5 ml of heptane.
- Dilution by a factor of 10 was required to bring the fluorescence to the linear response range. Measured intensity values in instrument units were:
- EM1 (290 nm) = 97.56 and EM2 (365nm) = 1888 Calculated values:
- R = 97.56/1888 =0.0517 intensity ratio
Claims (18)
- A method for evaluating the API gravity and wt% oil of a sample of underground formation which comprises:adding a known volume of an underground formation sample to a known volume of a solvent;quantitatively measuring with a changeable filter portable fluorometer the emission fluorescence of the sample at a fixed excitation wavelength with measurements of emission intensities at two points;characterizing the oil by the ratio of two emission intensities obtained at a fixed excitation wavelength;determining the yield; andapplying regression analysis to a data base of oils to obtain an equation which results in an algorithm value.
- A method as claimed in Claim 1 which further comprises applying the method in the field.
- A method as claimed in Claim 1 or Claim 2 which further comprises interpreting the value of the algorithm to give a value for API gravity and estimated wt% of in situ oil.
- A method as claimed in any preceding claim wherein the underground formation sample is selected from the group consisting of drill cuttings and side wall samples.
- A method as claimed in any one of Claims 1 to 3 wherein the underground formation sample is oil.
- A method as claimed in Claim 5 wherein the oil is selected from wellhead oil and processed oil.
- A method as claimedin any one of claims 1 to 4 wherein the samples are drill cuttings.
- A method as claimed in any one of Claims 1 to 4 wherein the samples are side wall samples.
- A method as claimed in any one Claims 1 to 4 wherein the formation samples are solvated in a solvent which will solvate hydrocarbons.
- A method as claimed in Claim 5 wherein the solvent functions as a diluent.
- A method as claimed in any preceding Claim wherein the solvent is selected from the group consisting of normal alkanes and hydrophilic/polar solvents.
- A method as claimed in Claim 11 wherein the solvent is a normal alkane selected from the group consisting of hexane, heptane and pentane; or
a hydrophilic/polar solvent selected from the group consisting of methanol, ethanol, 2-propanol, 2-methyl-2-propanol, and combinations thereof. - A method as claimed in any preceding claim wherein the emission fluorescence is measured at a fixed excitation wavelength and emission intensity measurements at two different points.
- A method as claimed in Claim 13 wherein the excitation wavelength is 254 nm.
- A method as claimed in any preceding claim wherein the emission fluorescence is measured between 250 and 400 nanometers.
- A method as claimed in any preceding claim wherein the emission fluorescence is measured at 290 nm and at 365 nm.
- A method as claimed in any preceding claim wherein the method is used to determine the wt% of oil in the sample.
- A method for evaluating the API gravity and wt% oil of a sample of underground formation which comprises:adding a known volume of an underground formation sample in a known volume of a solvent;quantitatively measuring with a changeable filter portable fluorometer the emission fluorescence of the sample at a fixed excitation wavelength with measurements of emission intensities at two points;characterizing the oil by the ratio of two emission intensities obtained at a fixed excitation wavelength;determining the yield;applying regression analysis to a data base of oils to obtain an equation which results in an algorithm value, andinterpreting the value of the algorithm to give a value for API gravity and estimated wt% of in situ oil.
Applications Claiming Priority (2)
| Application Number | Priority Date | Filing Date | Title |
|---|---|---|---|
| US1283096P | 1996-03-05 | 1996-03-05 | |
| US12830 | 1996-03-05 |
Publications (1)
| Publication Number | Publication Date |
|---|---|
| EP0794433A1 true EP0794433A1 (en) | 1997-09-10 |
Family
ID=21756911
Family Applications (1)
| Application Number | Title | Priority Date | Filing Date |
|---|---|---|---|
| EP97301396A Withdrawn EP0794433A1 (en) | 1996-03-05 | 1997-03-03 | API estimate using multiple fluorescence measurements |
Country Status (5)
| Country | Link |
|---|---|
| US (1) | US5780850A (en) |
| EP (1) | EP0794433A1 (en) |
| CA (1) | CA2199115A1 (en) |
| ID (1) | ID19870A (en) |
| NO (1) | NO970986L (en) |
Cited By (18)
| Publication number | Priority date | Publication date | Assignee | Title |
|---|---|---|---|---|
| GB2502372A (en) * | 2012-05-26 | 2013-11-27 | Aker Subsea Ltd | Measuring emissivity and density of crude oil using a differential temperature measurement device |
| WO2016111956A1 (en) * | 2015-01-05 | 2016-07-14 | Saudi Arabian Oil Company | Characterization of crude oil and its fractions by fluorescence spectroscopy analysis |
| WO2016111962A1 (en) * | 2015-01-05 | 2016-07-14 | Saudi Arabian Oil Company | Characterization of crude oil by ultraviolet visible spectroscopy |
| US9778240B2 (en) | 2011-02-22 | 2017-10-03 | Saudi Arabian Oil Company | Characterization of crude oil by ultraviolet visible spectroscopy |
| US10031121B2 (en) | 2011-02-22 | 2018-07-24 | Saudi Arabian Oil Company | Characterization of an API gravity value of crude oil by ultraviolet visible spectroscopy |
| US10048194B2 (en) | 2012-02-21 | 2018-08-14 | Saudi Arabian Oil Company | Characterization of crude oil by ultraviolet visible spectroscopy |
| US10401344B2 (en) | 2015-01-05 | 2019-09-03 | Saudi Arabian Oil Company | Characterization of crude oil and its fractions by thermogravimetric analysis |
| US10571452B2 (en) | 2011-06-28 | 2020-02-25 | Saudi Arabian Oil Company | Characterization of crude oil by high pressure liquid chromatography |
| US10627345B2 (en) | 2015-01-05 | 2020-04-21 | Saudi Arabian Oil Company | Characterization of crude oil by near infrared spectroscopy |
| US10677718B2 (en) | 2011-02-22 | 2020-06-09 | Saudi Arabian Oil Company | Characterization of crude oil by near infrared spectroscopy |
| US10684239B2 (en) | 2011-02-22 | 2020-06-16 | Saudi Arabian Oil Company | Characterization of crude oil by NMR spectroscopy |
| US10725013B2 (en) | 2011-06-29 | 2020-07-28 | Saudi Arabian Oil Company | Characterization of crude oil by Fourier transform ion cyclotron resonance mass spectrometry |
| US10794821B2 (en) | 2015-01-05 | 2020-10-06 | Saudi Arabian Oil Company | Characterization of crude oil by ultraviolet visible spectroscopy |
| US10845355B2 (en) | 2015-01-05 | 2020-11-24 | Saudi Arabian Oil Company | Characterization of crude oil by fourier transform near infrared spectrometry |
| US11022588B2 (en) | 2011-02-22 | 2021-06-01 | Saudi Arabian Oil Company | Characterization of crude oil by simulated distillation |
| US11781988B2 (en) | 2022-02-28 | 2023-10-10 | Saudi Arabian Oil Company | Method to prepare virtual assay using fluorescence spectroscopy |
| US11781427B2 (en) | 2022-02-28 | 2023-10-10 | Saudi Arabian Oil Company | Method to prepare virtual assay using ultraviolet spectroscopy |
| US11913332B2 (en) | 2022-02-28 | 2024-02-27 | Saudi Arabian Oil Company | Method to prepare virtual assay using fourier transform infrared spectroscopy |
Families Citing this family (13)
| Publication number | Priority date | Publication date | Assignee | Title |
|---|---|---|---|---|
| US6507401B1 (en) | 1999-12-02 | 2003-01-14 | Aps Technology, Inc. | Apparatus and method for analyzing fluids |
| US6633043B2 (en) | 2002-01-30 | 2003-10-14 | Ezzat M. Hegazi | Method for characterization of petroleum oils using normalized time-resolved fluorescence spectra |
| US7526953B2 (en) * | 2002-12-03 | 2009-05-05 | Schlumberger Technology Corporation | Methods and apparatus for the downhole characterization of formation fluids |
| US7081615B2 (en) * | 2002-12-03 | 2006-07-25 | Schlumberger Technology Corporation | Methods and apparatus for the downhole characterization of formation fluids |
| KR100789724B1 (en) * | 2006-02-14 | 2008-01-02 | 한국과학기술연구원 | Method and apparatus for monitoring oil oxidation in real time by measuring fluorescence |
| AT517366B1 (en) | 2015-06-22 | 2017-07-15 | Technische Universität Wien | Method and device for determining a material property of a bitumen material |
| US10024835B2 (en) * | 2015-07-29 | 2018-07-17 | Advanced Sensors Limited | Apparatus for measuring a higher concentration of fluorescent materials in a liquid |
| JP2017207342A (en) * | 2016-05-17 | 2017-11-24 | シャープ株式会社 | Fluorescence detector |
| US10371633B2 (en) * | 2017-10-30 | 2019-08-06 | Saudi Arabian Oil Company | Determining a specific gravity of a sample |
| CN108801986B (en) * | 2018-03-05 | 2020-09-15 | 中海石油(中国)有限公司天津分公司 | Method for judging oil quality and fluid type by using three-dimensional quantitative fluorescence map derived parameters |
| US11199643B2 (en) | 2019-09-23 | 2021-12-14 | Halliburton Energy Services, Inc. | Machine learning approach for identifying mud and formation parameters based on measurements made by an electromagnetic imager tool |
| US11662288B2 (en) | 2020-09-24 | 2023-05-30 | Saudi Arabian Oil Company | Method for measuring API gravity of petroleum crude oils using angle-resolved fluorescence spectra |
| CN113138180B (en) * | 2021-04-14 | 2023-04-28 | 北京化工大学 | Fluorescent detection method for petroleum product condensation point |
Citations (5)
| Publication number | Priority date | Publication date | Assignee | Title |
|---|---|---|---|---|
| US4814614A (en) * | 1987-05-11 | 1989-03-21 | Mobil Oil Corporation | Method for characterizing oil-bearing inclusions via fluorescence microspectrophotometry |
| EP0344950A2 (en) * | 1988-06-03 | 1989-12-06 | Texaco Development Corporation | Method for determining oil content of an underground formation |
| US4990773A (en) * | 1988-12-01 | 1991-02-05 | Texaco Inc. | Method for determining the producibility of a hydrocarbon formation |
| US5049738A (en) * | 1988-11-21 | 1991-09-17 | Conoco Inc. | Laser-enhanced oil correlation system |
| WO1993010437A1 (en) * | 1991-11-20 | 1993-05-27 | Kabi Pharmacia Ab | A method relating to the quantification of a substance with the aid of fluorescence |
-
1996
- 1996-06-17 US US08/664,485 patent/US5780850A/en not_active Expired - Fee Related
-
1997
- 1997-03-03 EP EP97301396A patent/EP0794433A1/en not_active Withdrawn
- 1997-03-04 CA CA002199115A patent/CA2199115A1/en not_active Abandoned
- 1997-03-04 NO NO970986A patent/NO970986L/en not_active Application Discontinuation
- 1997-03-05 ID IDP970683A patent/ID19870A/en unknown
Patent Citations (6)
| Publication number | Priority date | Publication date | Assignee | Title |
|---|---|---|---|---|
| US4814614A (en) * | 1987-05-11 | 1989-03-21 | Mobil Oil Corporation | Method for characterizing oil-bearing inclusions via fluorescence microspectrophotometry |
| EP0344950A2 (en) * | 1988-06-03 | 1989-12-06 | Texaco Development Corporation | Method for determining oil content of an underground formation |
| US4977319A (en) * | 1988-06-03 | 1990-12-11 | Texaco Inc. | Method for determining oil content of an underground formation |
| US5049738A (en) * | 1988-11-21 | 1991-09-17 | Conoco Inc. | Laser-enhanced oil correlation system |
| US4990773A (en) * | 1988-12-01 | 1991-02-05 | Texaco Inc. | Method for determining the producibility of a hydrocarbon formation |
| WO1993010437A1 (en) * | 1991-11-20 | 1993-05-27 | Kabi Pharmacia Ab | A method relating to the quantification of a substance with the aid of fluorescence |
Cited By (22)
| Publication number | Priority date | Publication date | Assignee | Title |
|---|---|---|---|---|
| US11022588B2 (en) | 2011-02-22 | 2021-06-01 | Saudi Arabian Oil Company | Characterization of crude oil by simulated distillation |
| US9778240B2 (en) | 2011-02-22 | 2017-10-03 | Saudi Arabian Oil Company | Characterization of crude oil by ultraviolet visible spectroscopy |
| US10684239B2 (en) | 2011-02-22 | 2020-06-16 | Saudi Arabian Oil Company | Characterization of crude oil by NMR spectroscopy |
| US10031121B2 (en) | 2011-02-22 | 2018-07-24 | Saudi Arabian Oil Company | Characterization of an API gravity value of crude oil by ultraviolet visible spectroscopy |
| US10345285B2 (en) | 2011-02-22 | 2019-07-09 | Saudi Arabian Oil Company | Characterization of an aromaticity value of crude oil by ultraviolet visible spectroscopy |
| US10677718B2 (en) | 2011-02-22 | 2020-06-09 | Saudi Arabian Oil Company | Characterization of crude oil by near infrared spectroscopy |
| US10571452B2 (en) | 2011-06-28 | 2020-02-25 | Saudi Arabian Oil Company | Characterization of crude oil by high pressure liquid chromatography |
| US10725013B2 (en) | 2011-06-29 | 2020-07-28 | Saudi Arabian Oil Company | Characterization of crude oil by Fourier transform ion cyclotron resonance mass spectrometry |
| US10048194B2 (en) | 2012-02-21 | 2018-08-14 | Saudi Arabian Oil Company | Characterization of crude oil by ultraviolet visible spectroscopy |
| GB2502372A (en) * | 2012-05-26 | 2013-11-27 | Aker Subsea Ltd | Measuring emissivity and density of crude oil using a differential temperature measurement device |
| JP2018503820A (en) * | 2015-01-05 | 2018-02-08 | サウジ アラビアン オイル カンパニー | Characterization of crude oil and its fractions by fluorescence spectroscopy. |
| US10627345B2 (en) | 2015-01-05 | 2020-04-21 | Saudi Arabian Oil Company | Characterization of crude oil by near infrared spectroscopy |
| US10401344B2 (en) | 2015-01-05 | 2019-09-03 | Saudi Arabian Oil Company | Characterization of crude oil and its fractions by thermogravimetric analysis |
| CN107250771A (en) * | 2015-01-05 | 2017-10-13 | 沙特阿拉伯石油公司 | Pass through fluorescent spectrometry analysis and characterization crude oil and its fraction |
| WO2016111962A1 (en) * | 2015-01-05 | 2016-07-14 | Saudi Arabian Oil Company | Characterization of crude oil by ultraviolet visible spectroscopy |
| CN107250771B (en) * | 2015-01-05 | 2020-09-01 | 沙特阿拉伯石油公司 | Characterization of crude oil and its fractions by fluorescence spectroscopy analysis |
| US10794821B2 (en) | 2015-01-05 | 2020-10-06 | Saudi Arabian Oil Company | Characterization of crude oil by ultraviolet visible spectroscopy |
| US10845355B2 (en) | 2015-01-05 | 2020-11-24 | Saudi Arabian Oil Company | Characterization of crude oil by fourier transform near infrared spectrometry |
| WO2016111956A1 (en) * | 2015-01-05 | 2016-07-14 | Saudi Arabian Oil Company | Characterization of crude oil and its fractions by fluorescence spectroscopy analysis |
| US11781988B2 (en) | 2022-02-28 | 2023-10-10 | Saudi Arabian Oil Company | Method to prepare virtual assay using fluorescence spectroscopy |
| US11781427B2 (en) | 2022-02-28 | 2023-10-10 | Saudi Arabian Oil Company | Method to prepare virtual assay using ultraviolet spectroscopy |
| US11913332B2 (en) | 2022-02-28 | 2024-02-27 | Saudi Arabian Oil Company | Method to prepare virtual assay using fourier transform infrared spectroscopy |
Also Published As
| Publication number | Publication date |
|---|---|
| NO970986L (en) | 1997-09-08 |
| ID19870A (en) | 1998-08-13 |
| CA2199115A1 (en) | 1997-09-05 |
| NO970986D0 (en) | 1997-03-04 |
| US5780850A (en) | 1998-07-14 |
Similar Documents
| Publication | Publication Date | Title |
|---|---|---|
| US5780850A (en) | API estimate using multiple fluorescence measurements | |
| US4814614A (en) | Method for characterizing oil-bearing inclusions via fluorescence microspectrophotometry | |
| US5049738A (en) | Laser-enhanced oil correlation system | |
| Liu et al. | Quantitative fluorescence techniques for detecting residual oils and reconstructing hydrocarbon charge history | |
| EP0794432B1 (en) | Method for determining oil content of an underground formation using cuttings | |
| Munz | Petroleum inclusions in sedimentary basins: systematics, analytical methods and applications | |
| US4609821A (en) | Testing for the presence of native hydrocarbons down a borehole | |
| US7705982B2 (en) | Methods and apparatus for analyzing fluid properties of emulsions using fluorescence spectroscopy | |
| US6178815B1 (en) | Method to improve the quality of a formation fluid sample | |
| US4990773A (en) | Method for determining the producibility of a hydrocarbon formation | |
| CA2041970C (en) | Finding and evaluating rock specimens having classes of fluid inclusions for oil and gas exploration | |
| US4977319A (en) | Method for determining oil content of an underground formation | |
| US6420869B1 (en) | Method and apparatus for estimating NMR properties by near infrared spectra | |
| RU2356030C2 (en) | Method of processing signals resulted from optical analysis of fluid medium | |
| US20040099804A1 (en) | Oil reservoirs | |
| EP1604187B1 (en) | A method and apparatus for downhole quantification of methane using near infrared spectroscopy | |
| NO852613L (en) | ANALYSIS OF A MATERIAL FROM A DRILL. | |
| CN112666142B (en) | Method for predicting components and maturity of individual oil inclusion group | |
| Przyjalgowski et al. | Analysis of hydrocarbon-bearing fluid inclusions (HCFI) using time-resolved fluorescence spectroscopy | |
| Reyes | Application of fluorescence techniques for mud-logging analysis of oil drilled with oil-based muds | |
| DeLaune | Surface techniques to measure oil concentration while drilling | |
| RU2052094C1 (en) | Method of determination of relative discharges of oil pools exploited jointly | |
| US20230313680A1 (en) | Determination of downhole formation fluid contamination and certain component concentrations | |
| Bhui et al. | Maturity Assessment of Cambay Shale Formation (CSF) for Hydrocarbon Prospect: A Molecular Structure Approach with Optical Spectroscopy Study | |
| RU2786663C1 (en) | Method for identifying interlayer flows in the development of oil and gas condensate or oil fields |
Legal Events
| Date | Code | Title | Description |
|---|---|---|---|
| PUAI | Public reference made under article 153(3) epc to a published international application that has entered the european phase |
Free format text: ORIGINAL CODE: 0009012 |
|
| AK | Designated contracting states |
Kind code of ref document: A1 Designated state(s): GB IT |
|
| 17P | Request for examination filed |
Effective date: 19980214 |
|
| 17Q | First examination report despatched |
Effective date: 20010104 |
|
| STAA | Information on the status of an ep patent application or granted ep patent |
Free format text: STATUS: THE APPLICATION IS DEEMED TO BE WITHDRAWN |
|
| 18D | Application deemed to be withdrawn |
Effective date: 20010717 |