EP0893775A1 - Process and system for management of electrical power supply - Google Patents
Process and system for management of electrical power supply Download PDFInfo
- Publication number
- EP0893775A1 EP0893775A1 EP98305683A EP98305683A EP0893775A1 EP 0893775 A1 EP0893775 A1 EP 0893775A1 EP 98305683 A EP98305683 A EP 98305683A EP 98305683 A EP98305683 A EP 98305683A EP 0893775 A1 EP0893775 A1 EP 0893775A1
- Authority
- EP
- European Patent Office
- Prior art keywords
- utility
- power
- spot
- cost
- electric
- Prior art date
- Legal status (The legal status is an assumption and is not a legal conclusion. Google has not performed a legal analysis and makes no representation as to the accuracy of the status listed.)
- Ceased
Links
Images


Classifications
-
- H—ELECTRICITY
- H02—GENERATION; CONVERSION OR DISTRIBUTION OF ELECTRIC POWER
- H02J—CIRCUIT ARRANGEMENTS OR SYSTEMS FOR SUPPLYING OR DISTRIBUTING ELECTRIC POWER; SYSTEMS FOR STORING ELECTRIC ENERGY
- H02J3/00—Circuit arrangements for ac mains or ac distribution networks
- H02J3/008—Circuit arrangements for ac mains or ac distribution networks involving trading of energy or energy transmission rights
-
- G—PHYSICS
- G06—COMPUTING; CALCULATING OR COUNTING
- G06Q—INFORMATION AND COMMUNICATION TECHNOLOGY [ICT] SPECIALLY ADAPTED FOR ADMINISTRATIVE, COMMERCIAL, FINANCIAL, MANAGERIAL OR SUPERVISORY PURPOSES; SYSTEMS OR METHODS SPECIALLY ADAPTED FOR ADMINISTRATIVE, COMMERCIAL, FINANCIAL, MANAGERIAL OR SUPERVISORY PURPOSES, NOT OTHERWISE PROVIDED FOR
- G06Q10/00—Administration; Management
- G06Q10/06—Resources, workflows, human or project management; Enterprise or organisation planning; Enterprise or organisation modelling
-
- G—PHYSICS
- G06—COMPUTING; CALCULATING OR COUNTING
- G06Q—INFORMATION AND COMMUNICATION TECHNOLOGY [ICT] SPECIALLY ADAPTED FOR ADMINISTRATIVE, COMMERCIAL, FINANCIAL, MANAGERIAL OR SUPERVISORY PURPOSES; SYSTEMS OR METHODS SPECIALLY ADAPTED FOR ADMINISTRATIVE, COMMERCIAL, FINANCIAL, MANAGERIAL OR SUPERVISORY PURPOSES, NOT OTHERWISE PROVIDED FOR
- G06Q50/00—Systems or methods specially adapted for specific business sectors, e.g. utilities or tourism
- G06Q50/06—Electricity, gas or water supply
-
- Y—GENERAL TAGGING OF NEW TECHNOLOGICAL DEVELOPMENTS; GENERAL TAGGING OF CROSS-SECTIONAL TECHNOLOGIES SPANNING OVER SEVERAL SECTIONS OF THE IPC; TECHNICAL SUBJECTS COVERED BY FORMER USPC CROSS-REFERENCE ART COLLECTIONS [XRACs] AND DIGESTS
- Y02—TECHNOLOGIES OR APPLICATIONS FOR MITIGATION OR ADAPTATION AGAINST CLIMATE CHANGE
- Y02A—TECHNOLOGIES FOR ADAPTATION TO CLIMATE CHANGE
- Y02A30/00—Adapting or protecting infrastructure or their operation
-
- Y—GENERAL TAGGING OF NEW TECHNOLOGICAL DEVELOPMENTS; GENERAL TAGGING OF CROSS-SECTIONAL TECHNOLOGIES SPANNING OVER SEVERAL SECTIONS OF THE IPC; TECHNICAL SUBJECTS COVERED BY FORMER USPC CROSS-REFERENCE ART COLLECTIONS [XRACs] AND DIGESTS
- Y04—INFORMATION OR COMMUNICATION TECHNOLOGIES HAVING AN IMPACT ON OTHER TECHNOLOGY AREAS
- Y04S—SYSTEMS INTEGRATING TECHNOLOGIES RELATED TO POWER NETWORK OPERATION, COMMUNICATION OR INFORMATION TECHNOLOGIES FOR IMPROVING THE ELECTRICAL POWER GENERATION, TRANSMISSION, DISTRIBUTION, MANAGEMENT OR USAGE, i.e. SMART GRIDS
- Y04S50/00—Market activities related to the operation of systems integrating technologies related to power network operation or related to communication or information technologies
- Y04S50/10—Energy trading, including energy flowing from end-user application to grid
Definitions
- the present invention generally relates to a computer process and system for use in an electricity network to manage power supply by forecasting spot-market prices of electric power and trading transactions at different delivery points based on various technical and commercial criteria.
- Electricity is an essential part of our lives. If we took a moment to think of the services that would not exist if electricity were not available, we would be acknowledged. Almost every aspect of our modern lives involves electric power, from light bulbs and television sets to hospitals and automobile industries. Although we are used to having power whenever we need it, the processes and systems involved in delivering electricity require careful planning and sophisticated mathematical and forecasting models, in order to allow for various technical, environmental, and commercial considerations.
- Examples of technical considerations include the operating characteristic of power stations (which may not be able to respond instantly to demand changes), and capacitity limitations of the transmission network; an example of an environmental consideration is the weather, which has a strong impact on consumer demand for electric power; and an example of a commercial consideration is the action of a competitor (eg the amount and price of electricity which it is prepared to supply).
- a pitfall of deregulation is that the load on a utility system is becoming increasingly unpredictable. The reason is that trading transactions can change the load pattern significantly. For example, some utilities may sell more than 30% of their power generation to other utilities on certain days. Demand and supply in the market are functions of volatile electricity prices which in turn depend on highly unpredictable elements such as regional weather conditions and fuel prices.
- an ISO Independent System Operator
- One of the ISO responsibilities is to settle financially with the parties involved in transmitting electric power.
- the transmission cost depends on the proximity of the supplier and the congestion of the transmission lines as well as other operational factors.
- an ISO announces, twenty-four hours in advance, the load forecast on the system and asks interested suppliers to submit bids; i.e., amount of power to be delivered at each point and pricing information.
- the load forecast is given for each delivery point within the physical system. Bids are submitted to the Power Exchange or PX which then holds an auction to determine which suppliers to buy power from.
- the PX chooses the least expensive source of power, then the second least expensive, and so on. The process is repeated until the forecasted load on the system is met. Note that such a process ensures that the customers' demand for electricity is satisfied at a minimal cost.
- the bidding cost of last supplier chosen in the bidding process is the spot-market price for power at this delivery point. The PX performs this process for each delivery point in the system and at each hour of the day.
- Transmission charges are a function of the congestion of the power lines. These charges are calculated by ISO and billed to the different parties involved in trades. Note that suppliers who submit a bid with a high price may end up not selling any of their production. On the other hand, selling power at a low price may not create enough revenue for a generator. Given that no one knows in advance the amount of power that competitors may bid for, the electric-power market will become more uncertain and risky. The hope is that competition will force utilities to minimize their production costs which will, in turn, benefit consumers and the economy in general. This model also encourages individuals to invest money in the electric-power market.
- the invention provides a computer process for use in an electricity network to manage power supply by forecasting spot-market prices of electric power and trading transactions at different delivery points, said method comprising the steps of:
- Such a forecasting process provides the technical and commercial information necessary for producing or distributing power in order to achieve a satisfactory operation of the electricity network, and the provision of output probabilistic distributions in particular helps in effective risk managment.
- the process further comprises the step of defining different scenarios wherein the maximum generating capacity of each utility changes under said different scenarios, and also further comprises the step of using the input weather forecast to create a probabilistic distribution of load forecasts for each utility of interest.
- the input price functions may be given implicitly, for example by approximating a price function of a utility as a quadratic function which is convex, positive and increasing against certain data, or they may be given explicitly as a cost function of the generating units.
- the probabilistic distribution for the spot-market prices and for electric trades in the system are created by sampling from electric load, price functions and cost distributions to create a sequence of deterministic models, with the cost of operating an electric utility system being minimised under each sampled set of price functions, transmission costs and electric loads.
- the probabilistic distributions for spot prices and trades are determined by a bucketing process comprising the steps of:
- the invention further provides a system for use in an electricity network to manage power supply by forecasting spot-market prices of electric power and trading transactions at different delivery points, said system comprising:
- the invention provides a computer power trading and forecasting process for forecasting spot-market prices of electric power and trading transactions at different delivery points comprising the steps of:
- the probabilistic distributions of the transmission costs and capacities of power lines are created from historical data, and the probabilistic distributions for the spot-market prices and for electric trades in the system are created by sampling from electric load, price functions and cost distributions to create a sequence of deterministic models.
- the process further comprises the steps of minimizing the cost of operating an electric utility system under each sampled set of price functions, transmission costs and electric loads; and storing a resulting output.
- the sampling from electric load, transmission costs and cost distributions is performed using a random number generator.
- the computer implemented process described herein forecasts the spot-market prices and the trading transactions at different delivery points, providing the decision maker with probabilistic distributions for spot prices and trading to allow efficient risk management.
- the user of the process can be (1) a utility or an independent power supplier who is interested in using the trading and spot market information to decide which generating units to commit, how to price power, and the level of generation needed; or (2) a power broker who is interested in buying and selling power (but not producing) in order to maximize revenue.
- the computer implemented process uses the weather forecast in addition to other market information and provides probabilistic distributions for the power traded and spot-market prices, rather than a single estimate for the spot price and the power traded.
- Table 1 An example of the output of the computer implemented process is shown in Table 1 below; the information therein can be used for hedging against uncertainty, thereby allowing risk to be acceptably contained.
- the first column in the above table represents the spot market price.
- the second column contains the amount of power that may be traded. Note that for the same spot price, one may buy or sell different amounts of electric power. The likelihood of a transaction is given in the last column.
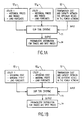
- FIG. 1A there are shown in block diagram form the relationship of the power trading and forecasting tool and its inputs and outputs.
- the tool can have different sets of input parameters, and two are described here by way of example.
- the first example is shown in Figure 1A.
- the tool 11 receives inputs from a plurality of utilities 12 1 to 12 n . These inputs include for each utility prices at which it sold power in the past and the corresponding amounts of power sold.
- the tool 11 receives as an input the transmission costs and the maximum transmission capacity for different lines in the transmission network 13.
- the output of tool 11 is the probabilistic distribution for trades and spot prices 14.
- the second set of input parameters is illustrated in Figure 1B. They include the operating cost curves of the different generators 12 1 to 12 n , estimates of the marginal profits, and electric load forecasts.
- the output is similar to that of Figure 1A.
- the inputs and outputs of the tool 11 are described in more detail below.
- the input to our system consists of (1) the generating capacity and price functions, f s / i,t , of utilities competing in the market, (2) the load forecast in the regions of interest, and (3) the transmission costs, c s / ( i,j ), t , charged by the ISO or other equivalent body to transmit electricity from node i to node j at time period t and the transmission capacity, u s / ( i,j ), t .
- f s / i,t For example, the capacity over the weekends is lower than regular days. 2.
- the value returned by f s / i,t is assumed to include the operating cost plus the profit margin of a utility. Note that f s / i,t may be given (a) implicitly or (b) explicitly.
- the problem of "guessing" the price function of a utility is not a simple one in a competitive environment. For example, one may observe a cost of $15 per MWH for a certain utility under a 12,000 MWH load on one day while observing an operating cost of $18 per MWH for the same utility under a similar load in another day.
- the reason for this discrepancy might be a generating unit that is going through maintenance, a failure of a generator in that utility, a large error in the load forecast which resulted in shortage of generation, or a shortage of certain fuel which may have forced the utility to use a more expensive fuel.
- One hopes that using a set of functions reflects accurately the uncertainty an observer may have regarding the operating cost of a utility For example, one scenario may represent a normal operating environment, another might be the cost observed when natural gas prices are high, a third may be the price function when there is a heat wave in the area, and so on. One can use as many scenarios as needed so that the uncertainty in f is approximated reasonably.
- Figure 2 shows a flow chart of the previous process applied to multiple utilities, 1,..., n , multiple scenarios, 1,..., S , and multiple periods, 1,..., T .
- the process starts in function block 201 in which the input data is passed to this procedure.
- These data are usually available from the power pool and assumed to be stored on the hard disk of our computer. In many cases, such data are available through the World Wide Web (WWW).
- WWW World Wide Web
- function block 205 the value of t is incremented by one.
- Decision block 206 compares t with T . If t ⁇ T , the execution is directed to function block 204; otherwise, the execution proceeds to function block 207. In function block 207 the value of the scenario index s is increased by one. Decision block 208 checks if s is greater than S . If the answer is no, then the execution is directed back to decision block 203. Otherwise, the execution continues to function block 209. In function block 209, the value of i is incremented by one. Decision block 210 directs the flow to function block 202 if i is less than or equal to n ; otherwise, the process terminates. As a result, we obtain a set of quadratic functions that can be used to approximate the price functions under different scenarios and during different time periods.
- the second case we discuss is that in which the price function is known explicitly. That is, for each generating unit owned by utility i, we know the operating range, the cost function within that range, the start-up cost, and any other characteristics relevant to a generator. We may also know the status of each generator. That is, we know if a generator is scheduled for maintenance and if it is unavailable due to mechanical problems. Furthermore, one may have historical information regarding the probability of failure of each unit. All of the previous information implicitly represents the cost structure of a utility. That is, we do not have an explicit representation of f s / i,t but we can compute the value of f s / i,t given the load and conditions of the generators.
- the generating units are sorted in the increasing order of their average costs which results in a convex piecewise linear function for operating the system of a utility.
- Figure 4 shows an example of such a function.
- the first, i.e., cheapest, generator is used to cover the load between 0 and its maximum capacity, G 1 .
- the second most economic generator is used to meet the electric load between the additional load up to the capacity of the second generator. That is, it covers the load between G 1 and G 1 + G 2 .
- the process is repeated until all the generating units of a utility are incorporated into the system.
- the resulting function is an approximation of the cost function of a utility and not its price function.
- the goal of any deregulated market is to force the competing entities to reduce their cost.
- the minimum cost at which a utility can sell its production, without losing money, is the production cost of its electricity.
- this pricing scheme does not generate any profit to the utility.
- each competitor usually sets a profit margin that is acceptable for him or her. This profit margin may be different for the different periods, t , of the planning horizon and under the various scenarios. For example, a profit margin of 1% may be acceptable in periods in which the market demand is low while a higher margin might be desirable if the demand is high.
- the margin can also change with the scenarios s . For example, if fuel prices are high, one may not be able to enforce high profit margins.
- the price function is then obtained by adding a linear term that takes into consideration the profit margin resulting in f s / i,t .
- a probability is associated with each scenario s . That is, a probability, p t s , is associated with each price function that reflects the likelihood of its occurrence in the future.
- the value of p t s can be approximated using the frequency of each of the functions f 1 / i,t ,..., f s t / i,t from the past.
- the user of the tool may adjust these probabilities using his or her intuition if there is a need to do so. 3.
- these tools require historical data for the load on the system of a utility and the corresponding weather conditions, i.e., maximum and minimum temperature during the day.
- Table 2 shows an example of this data.
- the first column is the date
- second column is the maximum temperature over the twenty-four hours of that day
- the third column is the minimum temperature during that day.
- the next twenty-four columns (only three are shown) provide the electric load in MWH at each hour of the day.
- a forecasting tool By passing this data to a forecasting tool, it can create a model that correlates the maximum and minimum temperatures to the load. These tools are also capable of incorporating the effect of time of day and day of year into the forecast.
- the historical data of any utility can be obtained in an electronic form from the power pool. In the future, the electric load of a delivery point, i.e., geographic region, will be posted on the World Wide Web. We do not discuss the forecasting process in this document. See, for example, R. H. Shumway, Applied Statistical Time Series Analysis, Prentice-Hall (1988), and A. C. Harvey, Forecasting, Structural Time Series Models and the Kalman Filter, Cambridge (1991). Note that the forecast is given usually for each hour of the coming week.
- a probabilistic distribution i.e., mean and standard deviation
- the weather forecast is usually available on the World Wide Web and can be imported by our system easily to pass it on to the forecasting system. 4.
- Our notation permits changing the transmission cost from one period to another. It also allows using multiple cost scenarios depending on the status of the electric system.
- MWH maximum transmission capacity
- a power line by its ends or nodes i and j .
- Each node, i is assumed to have a generating utility, i.e., a set of generators, associated with it and an external demand.
- G s / i,t the upper capacity of the generating utility, G s / i,t , at node i can be set to zero to model a demand center.
- the external load, d k / i,t can be set to zero.
- the computer implemented tool described herein uses the probabilistic distributions of the electric load and of the cost function of each utility to build probabilistic distributions for the spot-market prices and for the electric trades in the system. Due to the use of discrete random variables, i.e., finite S t and K t , one can consider all combinations of s and k at each hour. The problem of cost minimization while satisfying demand and profit margins is then solved for each one of these combinations to produce a spot-market price and to compute the trades. The results can be bucketed to form a distribution of the spot prices and trades. Given that the number of combinations at each time period is S t ⁇ K t , it may be hard to perform all of the previous calculations in a reasonable time.
- sampling process i.e., simulation
- the sampling process is an approximation of the exhaustive one described above.
- the sampling process is repeated until a reasonable approximation is reached of the distributions of trades and spot prices or until a maximum number, L, of samples is chosen.
- function block 54 calls the sampling procedure of Figure 6 which returns a set of price functions, electric loads, and transmission capacities and costs.
- the data are then used to construct the problem of minimizing (2) subject to the constraints of equation (3) and other system constraints. We do not discuss the solution process here. Any commercial package that supports quadratic programming could be used.
- function block 54 of Figure 5 calls the process of Figure 6 which performs the sampling.
- the sampling process is performed using a uniform random number generator.
- Uniform random number generators are available on most computers and under any programming language.
- the C programming language provides the function rand as part of its standard library header. See B. W. Kernighan and D. M. Ritchie, The C Programming Language, Prentice Hall, 1988.
- the probability of the different scenarios, p s t is used in conjunction with the electric-load probabilities, ⁇ t k , to come up with a sample.
- the process of Figure 6 receives from the calling process (function block 54 of Figure 5) the value of t.
- function block 601 a random number x between 0 and 1 is sampled from the uniform distribution.
- Function block 602 defines a variable, y , and sets its value to zero.
- the variable y is used to compute the cumulative joint distribution at any given k and s .
- the value of the scenario counter, s is set to 1.
- Function block 603 sets the value of k to 1.
- decision block 604 the value of the cumulative probability, y, is compared to x. If x is less than or equal to y , then the functions f s / i,t and loads d k / i,t are returned to the calling routine (function block 54) to be used in the optimization problem. Otherwise, the value of k is incremented by 1 in function block 605.
- Decision block 606 checks if k has reached its maximum limit of K t .
- Function block 609 updates the value of y by adding p s -1 / t ⁇ k -1 / t to it. The execution then loops back to function block 603.
- Function block 610 is reached from decision block 604 when the value of x is less than the cumulative distribution at the point ( k,s ).
- the previous process is called bucketing and is described in the flow chart of Figure 7.
- the process requires a number of buckets (i.e., ranges) which is defined by the user and the lower limit, u j , of each range.
- Function block 71 sets the number of observations (so far) in each range or bucket to 0.
- the process then moves to function block 72 in which the value of ⁇ l / i,t is compared against the values of u j to find the index j for which u j ⁇ ⁇ l / i,t ⁇ u j +1 .
- the value of the counter m j is incremented by 1 in function block 73 to account for sample j .
- Function block 74 increases the value of l by 1; i.e., we are ready to process a new sample if any.
- Decision block 75 checks if l is less than L. If this is the case, then we have more samples to study and the process moves back to function block 72. Otherwise, we have completed classifying ⁇ l / i,t into the appropriate buckets. Finally, function block divides the frequency, m j , by L to obtain the relative frequency for each range or the probability.
Abstract
A computer implemented tool forecasts the spot price of electric
power in a deregulated market and the amounts of power that may be traded
in this market. The computer implemented tool makes these forecasts at
different delivery points, providing probabilistic distributions for spot
prices and trading, to allow proper risk management of power supply
within the electricity network.

Description
The present invention generally relates to a computer process and
system for use in an electricity network to manage power supply by
forecasting spot-market prices of electric power and trading transactions
at different delivery points based on various technical and commercial
criteria.
Electricity is an essential part of our lives. If we took a moment
to think of the services that would not exist if electricity were not
available, we would be amazed. Almost every aspect of our modern lives
involves electric power, from light bulbs and television sets to
hospitals and automobile industries. Although we are used to having power
whenever we need it, the processes and systems involved in delivering
electricity require careful planning and sophisticated mathematical and
forecasting models, in order to allow for various technical,
environmental, and commercial considerations. Examples of technical
considerations include the operating characteristic of power stations
(which may not be able to respond instantly to demand changes), and
capacitity limitations of the transmission network; an
example of an environmental consideration is the weather, which has a
strong impact on consumer demand for electric power; and an example of a
commercial consideration is the action of a competitor (eg the amount and
price of electricity which it is prepared to supply).
Lately, due to rising costs of energy and discrepancies in its
price among different regions of the country, the legal framework
surrounding the electric-power industry in the USA has changed (a process
known as deregulation). This change has opened the door for utilities to
compete with each other and against independent suppliers regardless of
their geographic location. Although this change will benefit the
consumer, utilities are going to face a highly unpredictable market and
will need to make tough decisions regarding power generation and
delivery. The current picture of a single utility controlling the market
in a specific region will soon disappear. Instead, there will be power
producers who sell their product to a power pool; and power suppliers who
will buy power from this pool and in turn sell it to their customers.
Although the full picture of the power industry after deregulation is not
yet known, it is clear that utilities need to prepare themselves for an
open market in which buying and selling power are to be considered when
scheduling their generating units. The main reason behind such
deregulation is to reduce the high price of electric energy. Initial
steps towards deregulation were taken in 1978 with the passage in the USA
of the Public Utilities Regulatory Policy Act. This act encouraged non-utility
generation and required utilities to buy power from independent
generators. The Energy Policy Act of 1992 took deregulation a step
further by mandating open access to the transmission system for
wholesalers.
Currently, electricity is sold as a service that is delivered to
specified points. For example, one typically expects to receive electric
power via a meter outside the house. We pay for this service regardless
of its producer or which power lines it followed. That is, an electricity
bill indicates the total usage of electricity in kilowatt hours (KWH) and
the service price per KWH without incorporating any other details into
the pricing scheme. Deregulation in the USA is changing this picture by
unbundling the electric power into generation and transmission. In the
future, one will pay a production cost and a transmission fee. There will
be several power suppliers from whom electric power may be purchased.
Suppliers may have different pricing mechanisms. For instance, there
might be a discount for using power off-peak periods or for signing a
long-term contract with the supplier. Power producers will compete with
each other to minimize their costs so that they can sell their product to
more customers and maximize their profit.
The hope is that deregulation will result in cheaper prices and
play a part in improving the economy by encouraging investment in
electric utilities. The size of the electric industry is expected to grow
after deregulation as was the case with the telecommunications industry.
The telecommunications industry's revenue shot up from $81 billion to
$170 billion within ten years of deregulation.
A pitfall of deregulation is that the load on a utility system is
becoming increasingly unpredictable. The reason is that trading
transactions can change the load pattern significantly. For example, some
utilities may sell more than 30% of their power generation to other
utilities on certain days. Demand and supply in the market are functions
of volatile electricity prices which in turn depend on highly
unpredictable elements such as regional weather conditions and fuel
prices.
There are two components for any competitive environment: physical
and commercial. In the case of electricity, the physical component
already exists in the form of transmission lines and all consumers have
physical access to the market. The commercial component consists of the
ability of buyers and suppliers to execute trades over the physical
network. One should also ensure that anyone who is interested in joining
this market has nondiscriminatory access to the physical network. In this
environment, suppliers and consumers have the freedom to contract with
each other under negotiated terms and conditions. To ensure the delivery
of the power traded, they need a mechanism to ensure the physical
delivery of the electricity. Also, they may need to rely on a spot market
to buy or sell additional electricity.
Although the new environment in the USA encourages competition,
power transmission will remain regulated there for the time being in
order to maintain a reliable system. The transmission lines in each state
or region will be controlled by an independent entity called an
Independent System Operator or ISO. One of the ISO responsibilities is to
settle financially with the parties involved in transmitting electric
power. The transmission cost depends on the proximity of the supplier and
the congestion of the transmission lines as well as other operational
factors. To maintain a reliable system, an ISO announces, twenty-four
hours in advance, the load forecast on the system and asks interested
suppliers to submit bids; i.e., amount of power to be delivered at each
point and pricing information. The load forecast is given for each
delivery point within the physical system. Bids are submitted to the
Power Exchange or PX which then holds an auction to determine which
suppliers to buy power from. For each delivery point, the PX chooses the
least expensive source of power, then the second least expensive, and so
on. The process is repeated until the forecasted load on the system is
met. Note that such a process ensures that the customers' demand for
electricity is satisfied at a minimal cost. The bidding cost of last
supplier chosen in the bidding process is the spot-market price for power
at this delivery point. The PX performs this process for each delivery
point in the system and at each hour of the day.
After agreeing on the production schedule, the ISO studies the
schedule to make sure that it is feasible; i.e., it does not exceed the
capacity of the transmission lines. Transmission charges are a function
of the congestion of the power lines. These charges are calculated by ISO
and billed to the different parties involved in trades. Note that
suppliers who submit a bid with a high price may end up not selling any
of their production. On the other hand, selling power at a low price may
not create enough revenue for a generator. Given that no one knows in
advance the amount of power that competitors may bid for, the
electric-power market will become more uncertain and risky. The hope is
that competition will force utilities to minimize their production costs
which will, in turn, benefit consumers and the economy in general. This
model also encourages individuals to invest money in the electric-power
market. For instance, if the charges across a certain power line are
relatively high due to congestion, an investor may build an alternative
power line in the hope of benefitting from the high-traffic in that
region. The result, of course, is a reduction in the transmission cost in
that region and an increase in the reliability of the system.
It will be appreciated that the USA is not alone in introducing
deregulation. For example, in the UK, the formerly public electricity
utility (a monopoly) has been split at privatisation into competing
generators, and multiple distributors. Again, whilst such deregulation is
expected to lead to lower prices, it significantly adds to the complexity
of operating in the electricity network. In particular, it will be
recognised that in the face of deregulation, the proper management of
electric power supply requires accurate forecasting in order to avoid
technical and/or commercial failure (the former represented by the
failure of the network as a whole to meet consumer demand, the latter by
the economic demise of a power generator or distributor).
Accordingly, the invention provides a computer process for use in
an electricity network to manage power supply by forecasting spot-market
prices of electric power and trading transactions at different delivery
points, said method comprising the steps of:
Such a forecasting process provides the technical and commercial
information necessary for producing or distributing power in order to
achieve a satisfactory operation of the electricity network, and the
provision of output probabilistic distributions in particular helps in
effective risk managment.
It is preferred that the process further comprises the step of
defining different scenarios wherein the maximum generating capacity of
each utility changes under said different scenarios, and also further
comprises the step of using the input weather forecast to create a
probabilistic distribution of load forecasts for each utility of
interest.
The input price functions may be given implicitly, for example by
approximating a price function of a utility as a quadratic function which
is convex, positive and increasing against certain data, or they may be
given explicitly as a cost function of the generating units.
In a preferred embodiment, the probabilistic distribution for the
spot-market prices and for electric trades in the system are created by
sampling from electric load, price functions and cost distributions to
create a sequence of deterministic models, with the cost of operating an
electric utility system being minimised under each sampled set of price
functions, transmission costs and electric loads.
Further in the preferred embodiment, the probabilistic
distributions for spot prices and trades are determined by a bucketing
process comprising the steps of:
The invention further provides a system for use in an electricity
network to manage power supply by forecasting spot-market prices of
electric power and trading transactions at different delivery points,
said system comprising:
Viewed from another aspect the invention provides a computer power
trading and forecasting process for forecasting spot-market prices of
electric power and trading transactions at different delivery points
comprising the steps of:
In a preferred embodiment, the probabilistic distributions of the
transmission costs and capacities of power lines are created from
historical data, and the probabilistic distributions for the spot-market
prices and for electric trades in the system are created by sampling from
electric load, price functions and cost distributions to create a
sequence of deterministic models. Preferably, the process further
comprises the steps of minimizing the cost of operating an electric
utility system under each sampled set of price functions, transmission
costs and electric loads; and storing a resulting output. The sampling
from electric load, transmission costs and cost distributions is
performed using a random number generator.
Thus the computer implemented process described herein forecasts
the spot-market prices and the trading transactions at different delivery
points, providing the decision maker with probabilistic distributions for
spot prices and trading to allow efficient risk management. The user of
the process can be (1) a utility or an independent power supplier who is
interested in using the trading and spot market information to decide
which generating units to commit, how to price power, and the level of
generation needed; or (2) a power broker who is interested in buying and
selling power (but not producing) in order to maximize revenue. The
computer implemented process uses the weather forecast in addition to
other market information and provides probabilistic distributions for the
power traded and spot-market prices, rather than a single estimate for
the spot price and the power traded. An example of the output of the
computer implemented process is shown in Table 1 below; the information
therein can be used for hedging against uncertainty, thereby allowing
risk to be acceptably contained.
The first column in the above table represents the spot market price. The
second column contains the amount of power that may be traded. Note that
for the same spot price, one may buy or sell different amounts of
electric power. The likelihood of a transaction is given in the last
column.
| $ | MWH | Pr. |
| 12.00 | -50 | 10 |
| 12.00 | -40 | 5 |
| 12.00 | -30 | 5 |
| 12.50 | -40 | 15 |
| 12.50 | -30 | 10 |
| 13.00 | -30 | 5 |
| 13.00 | -20 | 10 |
| 17.50 | 40 | 5 |
| 17.50 | 50 | 5 |
| 18.00 | 50 | 15 |
| 18.00 | 60 | 10 |
| 18.00 | 70 | 5 |
It will be appreciated that it is desirable to use all available
historical, competitive, and weather information to produce the most
accurate output, although the data that is actually available for
different utilities may differ from one region to another. For example,
some utilities are required, by the power pool, to post the status of
their generating units by the end of the week. These requirements differ
significantly between power pools. Also, data that are currently public,
such as hourly loads, may not be available in the near future.
Accordingly, the tool can be operated in a flexible manner in accordance
with the amount of information that is in fact available.
A preferred embodiment of the invention will now be described in
detail by way of example only with reference to the following drawings:
This application is related in subject matter to U.S. Patent
Application Serial No. 08/869,561 (IBM Docket YO997-032) filed June 5,
1997, by Samer Takriti for "RISK MANAGEMENT SYSTEM FOR ELECTRIC
UTILITIES". This earlier application is incorporated herein by reference,
and a copy of this earlier application is available on the file of the
present application.
Referring now to the drawings, and more particularly to Figures 1A
and 1B, there are shown in block diagram form the relationship of the
power trading and forecasting tool and its inputs and outputs. The tool
can have different sets of input parameters, and two are described here
by way of example. The first example is shown in Figure 1A. In this case,
we are given the historical data of selling prices and amounts of power
sold by each utility. The tool 11 receives inputs from a plurality of
utilities 121 to 12 n . These inputs include for each utility prices at
which it sold power in the past and the corresponding amounts of power
sold. In addition, the tool 11 receives as an input the transmission
costs and the maximum transmission capacity for different lines in the
transmission network 13. The output of tool 11 is the probabilistic
distribution for trades and spot prices 14.
The second set of input parameters is illustrated in Figure 1B.
They include the operating cost curves of the different generators 121 to
12 n , estimates of the marginal profits, and electric load forecasts. The
output is similar to that of Figure 1A. The inputs and outputs of the
tool 11 are described in more detail below.
Since the details of the deregulated market may vary from country
to country, and so cannot be completely defined, the input parameters,
data available about utilities and their generators, are not necessarily
known in advance. To avoid this difficulty, we describe the input
parameters in general terms so that our tool can handle any electric
power market. The input to our system consists of (1) the generating
capacity and price functions, f s / i,t , of utilities competing in the
market, (2) the load forecast in the regions of interest, and (3) the
transmission costs, c s / (i,j),t, charged by the ISO or other equivalent body
to transmit electricity from node i to node j at time period t and the
transmission capacity, u s / (i,j),t . Note that all of our notations contain
the superscript s. This is the scenario index, a concept that is
described in further detail in the above referenced US patent application
and which shall be clarified through the following discussion. Here is a
detailed description of the input parameters.
1. The maximum generating capacity, G s / i,t , of each utility, i, competing within the market. Note that this capacity is not necessarily the total generating capacity of all generators owned by a utility. For example, some units may be unavailable due to maintenance during certain days. Also, depending on the season and availability of fuel, the capacity may change. The scenario index, s, allows a certain utility to have different possible capacities. The capacity could also change depending on t over the planning horizon, usually one week or 168 periods. For example, the capacity over the weekends is lower than regular days.
2. The price functions, f s / i,t at which utility i is willing to sell its power at time t under sbenario s . The value returned by f s / i,t is assumed to include the operating cost plus the profit margin of a utility. Note that f s / i,t may be given (a) implicitly or (b) explicitly.
We may not know the exact cost structure of a utility but may be
able to approximate its operating cost by a quadratic function. For
instance, we may observe that a utility, i, priced its power at time t
and under a certain load at λ s / i,t $/MWH. By observing the price offered by
a utility for its power over time, one may construct an approximation of
the cost structure of this utility. The simplest way to do so is to
collect the different data points of price versus load and fit a
quadratic curve using least squares. Our experience indicates that the
quadratic approximation is a good one for most utilities. Of course, if
one observes a certain profile for the cost structure of a utility, one
may consider a different function to be fit.
The problem of "guessing" the price function of a utility is not a
simple one in a competitive environment. For example, one may observe a
cost of $15 per MWH for a certain utility under a 12,000 MWH load on one
day while observing an operating cost of $18 per MWH for the same utility
under a similar load in another day. The reason for this discrepancy
might be a generating unit that is going through maintenance, a failure
of a generator in that utility, a large error in the load forecast which
resulted in shortage of generation, or a shortage of certain fuel which
may have forced the utility to use a more expensive fuel. Regardless of
the reason, building the price function f s / i,t of a utility i may be
impossible if one has to use a single value for the cost under a given
load. To handle this difficulty, our model permits the use of more than
one price function, f s / i,t , at any time period t. For a given time period
t, we allow the price function to be any of the functions f 1 / i,t...f s / i,t
where St is the number of different functions available at time t. That
is, we model the cost function of a utility i at each time period t by a
set of cost functions. The index s is read as scenario. One hopes that
using a set of functions reflects accurately the uncertainty an observer
may have regarding the operating cost of a utility. For example, one
scenario may represent a normal operating environment, another might be
the cost observed when natural gas prices are high, a third may be the
price function when there is a heat wave in the area, and so on. One can
use as many scenarios as needed so that the uncertainty in f is
approximated reasonably.
Given a set of observations, λ j,s / i,t, j=1,...J s / i,t, of the prices of
utility i at time t under certain conditions s, we find the pricing
profile that best-fits this utility using a least square approach. Here
is a pseudocode of this process.
- Initialization. Get a set of prices, λ j,s / i,t , offered by utility i at time t under scenario s. Let x j,s / i,t be the amount of electricity generated by the electric utility for these price offers.
- Least Squares. The approximating function must be quadratic,
convex, positive, and increasing. To find the function that
best-fits our data while satisfying the previous constraints, we
solve the following quadratic program:

The previous optimization model can be solved efficiently using any
quadratic programming approach. See, for example, R. W. Cottle, J. S.
Pang, and R. e. Stone, The Linear Complementary Problem, Academic Press,
1992, and K. G. Murty, Linear Complementarity, Linear and Nonlinear
Programming, Helderman Verlag, 1988.
Figure 2 shows a flow chart of the previous process applied to
multiple utilities, 1,...,n, multiple scenarios, 1,...,S, and multiple
periods, 1,...,T. The process starts in function block 201 in which the
input data is passed to this procedure. The input data are the historical
prices, λ j,s / i,t , j=1,..., J s / i,t , and the corresponding amounts of power
generated, x j,s / i,t . These data are usually available from the power pool
and assumed to be stored on the hard disk of our computer. In many cases,
such data are available through the World Wide Web (WWW). At this stage,
the counter i is set to one. The process then moves to function block 202
in which the counter s is set to one. Function block 203 sets the value
of t to one. The process then proceeds to function block 204 in which the
quadratic program of equation (1) is constructed and solved. We do not
discuss the solution approach here. Most optimization packages provide
specialized routines for handling such problems. We suggest using the
Optimization Subroutine Library of IBM which provides a specialized
function, EKKQSLV, for this operation. As a result, we obtain the values
of a s / i,t , b s / i,t and c s / i,t, which are used to approximate the price function,
i.e., production plus profit margin, for any generation requirement. In
function block 205, the value of t is incremented by one. Decision block
206 compares t with T. If t≤T, the execution is directed to function
block 204; otherwise, the execution proceeds to function block 207. In
function block 207 the value of the scenario index s is increased by one.
Decision block 208 checks if s is greater than S. If the answer is no,
then the execution is directed back to decision block 203. Otherwise, the
execution continues to function block 209. In function block 209, the
value of i is incremented by one. Decision block 210 directs the flow to
function block 202 if i is less than or equal to n; otherwise, the
process terminates. As a result, we obtain a set of quadratic functions
that can be used to approximate the price functions under different
scenarios and during different time periods.
The second case we discuss is that in which the price function is
known explicitly. That is, for each generating unit owned by utility i,
we know the operating range, the cost function within that range, the
start-up cost, and any other characteristics relevant to a generator. We
may also know the status of each generator. That is, we know if a
generator is scheduled for maintenance and if it is unavailable due to
mechanical problems. Furthermore, one may have historical information
regarding the probability of failure of each unit. All of the previous
information implicitly represents the cost structure of a utility. That
is, we do not have an explicit representation of f s / i,t but we can compute
the value of f s / i,t given the load and conditions of the generators. Note
that in the current electric-power industry in the USA, the previous data
are known to the general public. It is available on the World Wide Web
and can be obtained in the form of a database stored on a floppy disk.
However, due to competition, this information will not be available in
the near future in which case we need to rely on the implicit
representation mentioned above.
To build a set of functions, f, that approximate the cost structure
of a utility under different circumstances, we sort the generators in the
increasing order of their average generating cost. This is done by adding
the start-up cost of a unit to its operating cost at the maximum
operating level and dividing by its maximum operating level. To clarify
the previous approximation, the cost function of Figure 3A is used. To
approximate this function, the start-up cost is added to the value of the
function at the maximum operating level, G. Then, the average cost of
this unit is computed by dividing the new cost at G by G. As a result, a
generator has a linear cost function that passes through the origin and
its operating range is anywhere between 0 and G (see Figure 3B). The
generating units are sorted in the increasing order of their average
costs which results in a convex piecewise linear function for operating
the system of a utility. Figure 4 shows an example of such a function.
The first, i.e., cheapest, generator is used to cover the load between 0
and its maximum capacity, G 1. The second most economic generator is used
to meet the electric load between the additional load up to the capacity
of the second generator. That is, it covers the load between G 1 and G 1+G 2.
The process is repeated until all the generating units of a utility are
incorporated into the system. Note that we can build different functions
to reflect the different operating conditions of a utility. For example,
if some generators are not available, then we have a different function.
Another example is the case in which a generator uses gas as its primary
fuel. In this case, the cost function can be affected by gas prices in
the market. Hence, we can create different functions (and different
approximations) to model different market conditions.
Note that the resulting function is an approximation of the cost
function of a utility and not its price function. To obtain the price
function from the cost function we need to estimate the profit margin of
a utility. The goal of any deregulated market is to force the competing
entities to reduce their cost. The minimum cost at which a utility can
sell its production, without losing money, is the production cost of its
electricity. However, this pricing scheme does not generate any profit to
the utility. To avoid the problem of zero profit, each competitor usually
sets a profit margin that is acceptable for him or her. This profit
margin may be different for the different periods, t, of the planning
horizon and under the various scenarios. For example, a profit margin of
1% may be acceptable in periods in which the market demand is low while a
higher margin might be desirable if the demand is high. The margin can
also change with the scenarios s. For example, if fuel prices are high,
one may not be able to enforce high profit margins. The price function is
then obtained by adding a linear term that takes into consideration the
profit margin resulting in f s / i,t .
To reflect the importance of each scenario and to make the model
more complete, a probability is associated with each scenario s. That is,
a probability, pt s , is associated with each price function that reflects
the likelihood of its occurrence in the future. The value of pt s can be
approximated using the frequency of each of the functions f 1 / i,t ,..., f s t / i,t
from the past. Of course, the user of the tool may adjust these
probabilities using his or her intuition if there is a need to do so.
3. Using the weather forecast, create a load forecast for each utility of interest. Usually, these tools require historical data for the load on the system of a utility and the corresponding weather conditions, i.e., maximum and minimum temperature during the day. Table 2 shows an example of this data.
The first column is the date, second column is the maximum temperature
over the twenty-four hours of that day, and the third column is the
minimum temperature during that day. The next twenty-four columns (only
three are shown) provide the electric load in MWH at each hour of the
day. By passing this data to a forecasting tool, it can create a model
that correlates the maximum and minimum temperatures to the load. These
tools are also capable of incorporating the effect of time of day and day
of year into the forecast. The historical data of any utility can be
obtained in an electronic form from the power pool. In the future, the
electric load of a delivery point, i.e., geographic region, will be
posted on the World Wide Web. We do not discuss the forecasting process
in this document. See, for example, R. H. Shumway, Applied Statistical
Time Series Analysis, Prentice-Hall (1988), and A. C. Harvey,
Forecasting, Structural Time Series Models and the Kalman Filter,
Cambridge (1991). Note that the forecast is given usually for each hour
of the coming week. The forecasting tool also provides a probabilistic
distribution, i.e., mean and standard deviation, for the load at each
hour. That is, using the weather forecast, one can obtain for each
utility a probabilistic distribution for its load at each hour of the
planning horizon. If the forecasting tool provides a continuous
distribution for the load at each time period, the continuous
distribution can be approximated by a discrete one. The number of
discrete realizations at time t is assumed to be Kt . Each demand
realization, d k / i,t , i=1,...,n, has a probability of πt k that reflects the
likelihood of its occurrence.
3. Using the weather forecast, create a load forecast for each utility of interest. Usually, these tools require historical data for the load on the system of a utility and the corresponding weather conditions, i.e., maximum and minimum temperature during the day. Table 2 shows an example of this data.
| Load vs. Weather Data | |||||||
| | Max | Min | 1 | 2 | 3 | ... | |
| 5/25/95 | 65 | 43 | 2101 | 2090 | 1045 | ||
| 5/26/95 | 68 | 44 | 2173 | 2120 | 1932 | ||
| 5/27/95 | 74 | 53 | 2318 | 2292 | 2056 |
The weather forecast is usually available on the World Wide Web and
can be imported by our system easily to pass it on to the forecasting
system.
4. Transmission c s / (i,j),t, , in the different power lines of the electrical system. Our notation permits changing the transmission cost from one period to another. It also allows using multiple cost scenarios depending on the status of the electric system. We assume that for each transmission line (i,j) we know the maximum transmission capacity MWH which we denote by u s / (i,j),t. If a power line is not available during a certain period, we can set its capacity, u s / (i,j),t , to zero. Note that we define a power line by its ends or nodes i and j. To simplify the task of representing the electric network and its delivery and generating points, we assume that there are n nodes in the network. Each node, i, is assumed to have a generating utility, i.e., a set of generators, associated with it and an external demand. Clearly, the upper capacity of the generating utility, G s / i,t , at node i can be set to zero to model a demand center. For a generating node, the external load, d k / i,t , can be set to zero. For transmittal or transshipment nodes, we set both generation and demand to zero.
4. Transmission c s / (i,j),t, , in the different power lines of the electrical system. Our notation permits changing the transmission cost from one period to another. It also allows using multiple cost scenarios depending on the status of the electric system. We assume that for each transmission line (i,j) we know the maximum transmission capacity MWH which we denote by u s / (i,j),t. If a power line is not available during a certain period, we can set its capacity, u s / (i,j),t , to zero. Note that we define a power line by its ends or nodes i and j. To simplify the task of representing the electric network and its delivery and generating points, we assume that there are n nodes in the network. Each node, i, is assumed to have a generating utility, i.e., a set of generators, associated with it and an external demand. Clearly, the upper capacity of the generating utility, G s / i,t , at node i can be set to zero to model a demand center. For a generating node, the external load, d k / i,t , can be set to zero. For transmittal or transshipment nodes, we set both generation and demand to zero.
The transmission cost and capacity in the United States are posted
on the World Wide Web as required by the Federal Energy Regulatory
Commission. We assume that our system can access the transmission costs
and capacities for the different regions of interest.
The computer implemented tool described herein uses the
probabilistic distributions of the electric load and of the cost function
of each utility to build probabilistic distributions for the spot-market
prices and for the electric trades in the system. Due to the use of
discrete random variables, i.e., finite St and Kt , one can consider all
combinations of s and k at each hour. The problem of cost minimization
while satisfying demand and profit margins is then solved for each one of
these combinations to produce a spot-market price and to compute the
trades. The results can be bucketed to form a distribution of the spot
prices and trades. Given that the number of combinations at each time
period is St ×Kt , it may be hard to perform all of the previous
calculations in a reasonable time. Instead, one can sample from the
electric-load and cost distributions to create a sequence of
deterministic models. The sampling process (i.e., simulation) is an
approximation of the exhaustive one described above. The sampling process
is repeated until a reasonable approximation is reached of the
distributions of trades and spot prices or until a maximum number, L, of
samples is chosen.
Consider the market equilibrium at time t under a sample of price
functions fi , i=1,...,n, transmission costs ci,j , i=1,...,n, j=1,...,n,
and loads di , i=1,...,n. We drop the indices t, s and k to simplify
notations. Due to the competition resulting from the bidding process, we
expect the spot price to be the minimum cost at which the demand can be
met while all suppliers satisfy their profit margins. In other words, one
needs to minimize the cost of supplying power,
 The decision variable xi represents the amount of power produced by
supplier i while yi,j represents the amount of power flowing from i to j.
Note that if two nodes are not connected directly with a transmission
line, then the capacity of this line is set to zero. The minimization of
(2) must be solved subject to Kirchhoff-law which requires that the total
power flowing into a node must be equal to total power flowing out of
this node. Mathematically, this condition is written as
The decision variable xi represents the amount of power produced by
supplier i while yi,j represents the amount of power flowing from i to j.
Note that if two nodes are not connected directly with a transmission
line, then the capacity of this line is set to zero. The minimization of
(2) must be solved subject to Kirchhoff-law which requires that the total
power flowing into a node must be equal to total power flowing out of
this node. Mathematically, this condition is written as
 where di is assumed to be zero for nodes that do not have electric load
and maximum generation, Gi , is zero for nodes that do not have any
generation. To satisfy the transmission capacity, we require that
0≤yi,j ≤ui,j , i=1,...,n, j=1,...,n. Also, given the maximum generating
capacity of utility i, we must satisfy the
where di is assumed to be zero for nodes that do not have electric load
and maximum generation, Gi , is zero for nodes that do not have any
generation. To satisfy the transmission capacity, we require that
0≤yi,j ≤ui,j , i=1,...,n, j=1,...,n. Also, given the maximum generating
capacity of utility i, we must satisfy the constraint 0≤xi ≤Gi , i=1,...,n.
One can enforce other constraints such as the maximum capacity of a node.
Due to convexity, the minimization of (2) can be solved easily.
See, for example, M. S. Bazaraa and C. M. Shetty, Nonlinear Programming:
Theory and Algorithms, John Wiley & Sons, Inc., 1979. If the price
functions, fi , are quadratic, one can use a speedy quadratic programming
approach as described by R. W. Cottle et al. and K. G. Murty, ibid. Note
that by solving (2) one obtains the amount of power to be generated and
transported from each supplier to each demand point. One also obtains the
dual variables or the Lagrange multipliers associated with the
constraints of equation (3). The dual variable associated with delivery
point i represents the marginal cost of power at point i. That is, it is
an estimate of the spot-market price at i under the given demand and
price functions.
We repeat the previous process by sampling a new set of price
functions and electric loads then resolving the model. The sampling
process continues until changes in the distribution of spot prices and
the decision variables xi,j are within a pre-specified threshold. Another
possibility is to repeat the process for a fixed number, L, of samples.
The flow chart of Figure 5 describes the sampling process. It
starts in function block 51 in which the time index, t, is set to 1. The
process then proceeds to function block 52 in which the sample counter,
ℓ, is set to one. Note that whenever we select a new sample, i.e., price
functions, transmission costs, and transmission capacities, the value of
ℓ is incremented by one (function block 56). In decision block 53, we
check if we have reached the maximum number of samples, L. If the answer
is yes, i.e., ℓ=L, then the process proceeds to decision block 56 in
which we move to a new time period in the planning horizon. If ℓ≤L, then
the process moves to function block 54 in which a new set of price
functions (one for each utility) and electric loads at the different
nodes of the network is sampled. This step, function block 54, calls the
sampling procedure of Figure 6 which returns a set of price functions,
electric loads, and transmission capacities and costs. The data are then
used to construct the problem of minimizing (2) subject to the
constraints of equation (3) and other system constraints. We do not
discuss the solution process here. Any commercial package that supports
quadratic programming could be used. As an output for the optimization,
we obtain the amount of power flowing in the different lines of the
network, y ℓ / (i,j),t , and the marginal costs, π ℓ / i,t , corresponding to
equation (3) at the different nodes of the system. The process is then
directed to function block 53 in which a new sample is generated. After
reaching the maximum number of samples in decision block 53, the process
moves to function block 56 in which the time counter, t, is incremented
by 1. In decision block 57, if t≤T, then the process goes back to
function block 52; otherwise, the process terminates. At the end of the
process of Figure 5, we have for each time period a set of L values for
the spot-market prices at nodes i=1,...,n. We also have a set of possible
power flows between the different nodes in the transmission system.
Note that function block 54 of Figure 5 calls the process of Figure
6 which performs the sampling. The sampling process is performed using a
uniform random number generator. Uniform random number generators are
available on most computers and under any programming language. For
example, the C programming language provides the function rand as part of
its standard library header. See B. W. Kernighan and D. M. Ritchie, The C
Programming Language, Prentice Hall, 1988. The probability of the
different scenarios, ps t , is used in conjunction with the electric-load
probabilities, π t k , to come up with a sample. The process of Figure 6
receives from the calling process (function block 54 of Figure 5) the
value of t. In function block 601, a random number x between 0 and 1 is
sampled from the uniform distribution. Function block 602 defines a
variable, y, and sets its value to zero. The variable y is used to
compute the cumulative joint distribution at any given k and s. The value
of the scenario counter, s, is set to 1. Function block 603 sets the
value of k to 1. In decision block 604, the value of the cumulative
probability, y, is compared to x. If x is less than or equal to y, then
the functions f s / i,t and loads d k / i,t are returned to the calling routine
(function block 54) to be used in the optimization problem. Otherwise,
the value of k is incremented by 1 in function block 605. Decision block
606 checks if k has reached its maximum limit of Kt . If k≤Kt , then the
value of the cumulative probability, y, is increased by p s / tπ k-1 / t and the
execution is sent back to decision block 604. Otherwise, the value of s
is increased by 1 in function block 608. Function block 609 updates the
value of y by adding p s-1 / tπ k-1 / t to it. The execution then loops back to
function block 603. Function block 610 is reached from decision block 604
when the value of x is less than the cumulative distribution at the point
(k,s).
At termination of the simulation runs, we have the spot prices or
marginal costs, λ ℓ / i,t at each point i, i=1,...,n, and at each time
period of the planning horizon. Here, the superscript ℓ indicates the
sample index. We also obtain the power flow, y ℓ / (i,j),t , in the different
transmission lines of the power network. Note that if y ℓ / (i,j),t is greater
than zero, then node i is transmitting power to node j under sample ℓ of
our simulation. Of course, if y ℓ / (i,j),t>0, then y ℓ / (j,i),t=0. . To get the
probabilistic distribution of the spot-market prices, λ ℓ / i,t , we perform
the following steps.
- Create ranges for λ ℓ / i,t . For example, we may want to have intervals of $5/MWH width. That is, we have the intervals (0-5], (5-10], (10-15],....
- Count the number of λ ℓ / i,t that falls within each range. We normalize these numbers to obtain a probability for each range.
- The resulting histogram is an approximation of the probability distribution of the marginal cost at delivery point i at time t.
The previous process is called bucketing and is described in the
flow chart of Figure 7. The process requires a number of buckets (i.e.,
ranges) which is defined by the user and the lower limit, uj , of each
range. We can assume that there is an extra range (after the last one
defined by the user) that covers the range up to infinity. Function block
71 sets the number of observations (so far) in each range or bucket to 0.
The process then moves to function block 72 in which the value of λ ℓ / i,t is
compared against the values of uj to find the index j for which
uj ≤ λ ℓ / i,t ≤u j+1. The value of the counter mj is incremented by 1 in function
block 73 to account for sample j. Function block 74 increases the value
of ℓ by 1; i.e., we are ready to process a new sample if any. Decision
block 75 checks if ℓ is less than L. If this is the case, then we have
more samples to study and the process moves back to function block 72.
Otherwise, we have completed classifying λ ℓ / i,t into the appropriate
buckets. Finally, function block divides the frequency, mj, by L to
obtain the relative frequency for each range or the probability.
We can follow similar steps to create probabilistic distributions
for the amounts of power traded, y ℓ / (i,j),t , across the different power
lines, (i,j). The resulting distributions can be helpful to the decision
maker in deciding the amount of power to be generated and its price. For
a power broker, these distributions can be used to sign buying and
selling contracts with different suppliers and consumers.
Claims (10)
- A computer process for use in an electricity network to manage power supply by forecasting spot-market prices of electric power and trading transactions at different delivery points, said method comprising the steps of:inputting maximum generating capacities of each utility competing within the market, price functions at which a utility is willing to sell its power at a given time period, a weather forecast, and a transmission cost and transmission capacity in different power lines of the electrical system;using probabilistic distributions of electric load and the price function of each utility and transmission cost and transmission capacity between different utilities to build probabilistic distributions for the spot-market prices and for electric trades in the system; andoutputting probabilistic distributions for spot prices and trades at a plurality of time periods of a planning horizon and for a plurality of delivery points to assist in said supply management.
- The computer process of claim 1, further comprising the step of defining different scenarios wherein the maximum generating capacity of each utility changes under said different scenarios.
- The computer process of claim 1 or 2, further comprising the step of using the input weather forecast to create a probabilistic distribution of load forecasts for each utility of interest.
- The computer process of any preceding claim, wherein the input price functions are given implicitly.
- The computer process of claim 4, wherein a price function of a utility is approximated by a quadratic function which is convex, positive and increasing.
- The computer process of any of claims 1 to 3 wherein the input price functions are given explicitly as a cost function of the generating units.
- The computer process of any preceding claim, wherein the probabilistic distributions for the spot-market prices and for electric trades in the system are created by sampling from electric load, price functions and cost distributions to create a sequence of deterministic models.
- The computer process of claim 7, further comprising the step of minimizing the cost of operating an electric utility system under each sampled set of price functions, transmission costs and electric loads.
- The computer process of claim 7 or 8 wherein the probabilistic distributions for spot prices and trades are determined by a bucketing process comprising the steps of:creating ranges of spot prices;counting the number of spot prices that fall within each range and normalizing the counted numbers to obtain a probability for each range;and generating a histogram of the probabilities of each range as an approximation of the probability distribution of the marginal cost at each delivery point at a given time.
- A system for use in an electricity network to manage power supply by forecasting spot-market prices of electric power and trading transactions at different delivery points, said system comprising:means for inputting maximum generating capacities of each utility competing within the market, price functions at which a utility is willing to sell its power at a given time period, a weather forecast, and a transmission cost and transmission capacity in different power lines of the electrical system;means for using probabilistic distributions of electric load and the price function of each utility and transmission cost and transmission capacity between different utilities to build probabilistic distributions for the spot-market prices and for electric trades in the system; andmeans for outputting probabilistic distributions for spot prices and trades at a plurality of time periods of a planning horizon and for a plurality of delivery points to assist in said supply management.
Applications Claiming Priority (2)
| Application Number | Priority Date | Filing Date | Title |
|---|---|---|---|
| US08/897,808 US5974403A (en) | 1997-07-21 | 1997-07-21 | Power trading and forecasting tool |
| US897808 | 1997-07-21 |
Publications (1)
| Publication Number | Publication Date |
|---|---|
| EP0893775A1 true EP0893775A1 (en) | 1999-01-27 |
Family
ID=25408459
Family Applications (1)
| Application Number | Title | Priority Date | Filing Date |
|---|---|---|---|
| EP98305683A Ceased EP0893775A1 (en) | 1997-07-21 | 1998-07-16 | Process and system for management of electrical power supply |
Country Status (2)
| Country | Link |
|---|---|
| US (1) | US5974403A (en) |
| EP (1) | EP0893775A1 (en) |
Cited By (7)
| Publication number | Priority date | Publication date | Assignee | Title |
|---|---|---|---|---|
| EP1247201A2 (en) * | 1999-12-23 | 2002-10-09 | Accenture LLP | A method for managing a utility service utilizing a network |
| EP1350199A1 (en) * | 2000-10-27 | 2003-10-08 | Manugistics, Inc. | Supply chain demand forecasting and planning |
| US7249068B1 (en) * | 2000-06-30 | 2007-07-24 | Hewlett-Packard Development Company, L.P. | Spot market-based inventory planning |
| WO2009109591A1 (en) * | 2008-03-04 | 2009-09-11 | International Business Machines Corporation | Method and system for efficient commodity distribution and production |
| US8504463B2 (en) | 1997-02-24 | 2013-08-06 | Geophonic Networks, Inc. | Bidding for energy supply |
| CN106485605A (en) * | 2016-12-05 | 2017-03-08 | 北京耀能科技有限公司 | Clean energy resource electricity step price forward purchasing platform and control method |
| CN113177692A (en) * | 2021-04-06 | 2021-07-27 | 长沙理工大学 | Annual plan completion risk assessment method for state directive electric quantity |
Families Citing this family (120)
| Publication number | Priority date | Publication date | Assignee | Title |
|---|---|---|---|---|
| US7485040B2 (en) * | 1996-12-18 | 2009-02-03 | Walker Digital, Llc | Methods and apparatus for advertising in gaming device |
| US6282575B1 (en) * | 1997-12-11 | 2001-08-28 | Intel Corporation | Routing mechanism for networks with separate upstream and downstream traffic |
| US6122603A (en) * | 1998-05-29 | 2000-09-19 | Powerweb, Inc. | Multi-utility energy control system with dashboard |
| US6636893B1 (en) | 1998-09-24 | 2003-10-21 | Itron, Inc. | Web bridged energy management system and method |
| US6963854B1 (en) * | 1999-03-05 | 2005-11-08 | Manugistics, Inc. | Target pricing system |
| US7634442B2 (en) * | 1999-03-11 | 2009-12-15 | Morgan Stanley Dean Witter & Co. | Method for managing risk in markets related to commodities delivered over a network |
| US7634443B2 (en) * | 1999-03-11 | 2009-12-15 | Morgan Stanley Dean Witter & Co. | Method for managing risk in markets related to commodities delivered over a network |
| US7716102B1 (en) * | 1999-03-11 | 2010-05-11 | Morgan Stanley Dean Witter & Co. | Method for managing risk in markets related to commodities delivered over a network |
| US6862580B1 (en) * | 1999-06-11 | 2005-03-01 | Robert M. Ford | System and method for managing tier-priced commodity transactions |
| EP1242932A4 (en) * | 1999-07-15 | 2004-04-07 | Ebidenergy Com | User interface to facilitate, analyze and manage resource consumption |
| US7062460B1 (en) * | 1999-10-12 | 2006-06-13 | Enduse.Com Llc | On-line auction method and system facilitating the sale of multiple product units at prices varying with volume |
| CA2387634A1 (en) * | 1999-10-12 | 2001-04-19 | General Hydrogen Corporation | Hydrogen/electric energy distribution system |
| US7085739B1 (en) * | 1999-10-20 | 2006-08-01 | Accenture Llp | Method and system for facilitating, coordinating and managing a competitive marketplace |
| US6876991B1 (en) | 1999-11-08 | 2005-04-05 | Collaborative Decision Platforms, Llc. | System, method and computer program product for a collaborative decision platform |
| US8032409B1 (en) | 1999-11-22 | 2011-10-04 | Accenture Global Services Limited | Enhanced visibility during installation management in a network-based supply chain environment |
| US6606744B1 (en) | 1999-11-22 | 2003-08-12 | Accenture, Llp | Providing collaborative installation management in a network-based supply chain environment |
| US7716077B1 (en) | 1999-11-22 | 2010-05-11 | Accenture Global Services Gmbh | Scheduling and planning maintenance and service in a network-based supply chain environment |
| US7124101B1 (en) | 1999-11-22 | 2006-10-17 | Accenture Llp | Asset tracking in a network-based supply chain environment |
| US7130807B1 (en) | 1999-11-22 | 2006-10-31 | Accenture Llp | Technology sharing during demand and supply planning in a network-based supply chain environment |
| US8271336B2 (en) | 1999-11-22 | 2012-09-18 | Accenture Global Services Gmbh | Increased visibility during order management in a network-based supply chain environment |
| US6671818B1 (en) | 1999-11-22 | 2003-12-30 | Accenture Llp | Problem isolation through translating and filtering events into a standard object format in a network based supply chain |
| US7139728B2 (en) * | 1999-12-30 | 2006-11-21 | Rod Rigole | Systems and methods for online selection of service providers and management of service accounts |
| US7346568B1 (en) * | 2000-01-26 | 2008-03-18 | Robert Cadoux | Serially staged, initial public stock offering method |
| US7430459B1 (en) * | 2000-02-01 | 2008-09-30 | Motorola, Inc. | System and method to control distributed power generation network |
| US6848995B1 (en) * | 2000-03-06 | 2005-02-01 | Walker Digital, Llc | System to determine casino offers |
| US7373320B1 (en) | 2000-03-30 | 2008-05-13 | Mcdonough Timothy Francis | Mechanism and business method for implementing a service contract futures exchange |
| US7171374B1 (en) * | 2000-04-11 | 2007-01-30 | Consensis, Llc | Utility resource aggregation and allocation |
| US6697951B1 (en) | 2000-04-26 | 2004-02-24 | General Electric Company | Distributed electrical power management system for selecting remote or local power generators |
| US7062361B1 (en) | 2000-05-02 | 2006-06-13 | Mark E. Lane | Method and apparatus for controlling power consumption |
| WO2001090925A2 (en) | 2000-05-25 | 2001-11-29 | Tradescape Technologies, L.L.C. | Solutions server |
| US6741989B1 (en) * | 2000-06-07 | 2004-05-25 | Ge Capital Services Structured Finance Group, Inc. | Web-based method and system for exchanging information among partners |
| US7194434B2 (en) * | 2000-06-15 | 2007-03-20 | Sergio Piccioli | Method for predictive determination of financial investment performance |
| AUPQ957600A0 (en) * | 2000-08-21 | 2000-09-14 | Perera, Anil Lasantha Michael | Method to enable customers to respond to prices in a pool type market |
| US6868293B1 (en) | 2000-09-28 | 2005-03-15 | Itron, Inc. | System and method for energy usage curtailment |
| US6577962B1 (en) * | 2000-09-28 | 2003-06-10 | Silicon Energy, Inc. | System and method for forecasting energy usage load |
| US6681156B1 (en) * | 2000-09-28 | 2004-01-20 | Siemens Aktiengesellschaft | System and method for planning energy supply and interface to an energy management system for use in planning energy supply |
| KR100700817B1 (en) * | 2000-09-29 | 2007-03-27 | 마쯔시다덴기산교 가부시키가이샤 | Power supply/demand control system |
| US7130802B1 (en) * | 2000-10-02 | 2006-10-31 | Ninesigma, Inc. | Systems and methods for facilitating research and development |
| US8458059B2 (en) * | 2000-12-13 | 2013-06-04 | Capguard.Com, Inc. | Apparatus and method for assessing market conditions |
| AU2002231164A1 (en) * | 2000-12-22 | 2002-07-08 | Seabron Adamson | Systems and methods for trading electrical transmission rights |
| US6882904B1 (en) | 2000-12-29 | 2005-04-19 | Abb Technology Ag | Communication and control network for distributed power resource units |
| FI20010114A (en) * | 2001-01-18 | 2002-07-19 | Gaia Group Oy | Procedure at power plants |
| US6845274B2 (en) * | 2001-01-24 | 2005-01-18 | Koninklijke Philips Electronics N.V. | Communication port control module for lighting systems |
| AU2002242033A1 (en) * | 2001-02-16 | 2002-09-04 | Idax, Inc. | Decision support for automated power trading |
| US20030036937A1 (en) * | 2001-03-06 | 2003-02-20 | Mohammad Shahidehpour | Method for control and coordination of independent tasks using benders decomposition |
| US20030036990A1 (en) * | 2001-03-14 | 2003-02-20 | Sprehe Paul R. | Method and system for financing natural gas utility inventories in underground reservoirs |
| US20040215348A1 (en) * | 2001-04-09 | 2004-10-28 | Ilic Marija D. | Tie-line flow control system and method for implementing inter-regional transactions |
| US7039575B2 (en) * | 2001-04-12 | 2006-05-02 | Ge Capital Services Structured Finance Group, Inc. | Methods and systems for the evaluation of power generating facilities |
| US20030041038A1 (en) * | 2001-05-10 | 2003-02-27 | Spool Peter R. | Business management system and method for a deregulated electric power market in a shortage situation |
| US6778882B2 (en) * | 2001-05-10 | 2004-08-17 | Siemens Westinghouse Power Corporation | Business management system and method for a deregulated electric power market with sharing of supply chain data |
| US20030041017A1 (en) * | 2001-05-10 | 2003-02-27 | Spool Peter R. | Business management system and method for a deregulated electric power market using consumer selected special offers |
| US7873442B2 (en) * | 2002-05-20 | 2011-01-18 | The Energy Authority, Inc. | System and method for managing and optimizing power use |
| US9811061B1 (en) * | 2001-05-18 | 2017-11-07 | The Energy Authority, Inc. | Method for management and optimization of hydropower generation and consumption |
| US8117107B2 (en) * | 2001-06-29 | 2012-02-14 | Hewlett-Packard Development Company, L.P. | Method for auction based simulation to extract demand curve |
| US7249088B2 (en) * | 2001-07-11 | 2007-07-24 | Hewlett-Packard Development Company, L.P. | Joint estimation of bidders' risk attitudes and private information |
| US7702561B2 (en) * | 2001-07-31 | 2010-04-20 | International Business Machines Corporation | Automatic method for generating a mathematical program to identify an optimal all-or-nothing bid set for procurement-related reverse auctions |
| JP4584579B2 (en) * | 2001-08-24 | 2010-11-24 | バイオ−ラッド ラボラトリーズ,インコーポレイティド | Biometric quality management process |
| US20030055677A1 (en) * | 2001-09-14 | 2003-03-20 | Automated Energy, Inc. | Utility monitoring and management system |
| US7801794B2 (en) * | 2001-09-21 | 2010-09-21 | Omx Technology Ab | Efficient electricity system |
| US20030189420A1 (en) * | 2001-09-28 | 2003-10-09 | Hiroyuki Hashimoto | Method for assisting in planning of power supply schedule |
| US20040044442A1 (en) * | 2001-12-28 | 2004-03-04 | Bayoumi Deia Salah-Eldin | Optimized dispatch planning of distributed resources in electrical power systems |
| US20030182250A1 (en) * | 2002-03-19 | 2003-09-25 | Mohammad Shihidehpour | Technique for forecasting market pricing of electricity |
| US20040122764A1 (en) * | 2002-03-27 | 2004-06-24 | Bernie Bilski | Capped bill systems, methods and products |
| US7139733B2 (en) * | 2002-04-12 | 2006-11-21 | International Business Machines Corporation | Method and structure for bid winning probability estimation and pricing model |
| US7474995B2 (en) * | 2002-05-03 | 2009-01-06 | Sungard Energy Systems Inc. | Valuing and optimizing scheduling of generation assets |
| US7389209B2 (en) * | 2002-05-03 | 2008-06-17 | Sungard Energy Systems Inc. | Valuing and optimizing scheduling of generation assets for a group of facilities |
| US20040034584A1 (en) * | 2002-05-12 | 2004-02-19 | Cory John Raborg | System and method for implementing risk management strategies in regulated and/or deregulated energy markets |
| US20040102986A1 (en) * | 2002-05-24 | 2004-05-27 | Mehran Mehregany | Method and system for offering and commercializing proposals |
| SE0201651D0 (en) * | 2002-06-03 | 2002-06-03 | Om Technology Ab | An energy trading system |
| US7702564B2 (en) * | 2002-06-19 | 2010-04-20 | Hewlett-Packard Development Company, L.P. | Determining a demand function for an item |
| US20040133462A1 (en) * | 2002-09-05 | 2004-07-08 | Smith Claude D. | Computer system and method for producing integrated product forecasts |
| US7747339B2 (en) * | 2002-10-03 | 2010-06-29 | Hewlett-Packard Development Company, L.P. | Managing procurement risk |
| US8463616B2 (en) * | 2002-10-15 | 2013-06-11 | Invensys Systems, Inc. | Scheduling a process according to time-varying input prices |
| US7337122B2 (en) * | 2003-01-14 | 2008-02-26 | Mirant Americas, Inc. | Method for producing a superior insurance model for commodity event risk |
| US6925364B1 (en) * | 2003-02-13 | 2005-08-02 | Hewlett-Packard Development Company, L.P. | Power market approach for device cooling |
| US7676376B2 (en) * | 2003-03-10 | 2010-03-09 | U-Haul International, Inc. | Rate and distribution system |
| JP3791503B2 (en) * | 2003-03-12 | 2006-06-28 | 株式会社日立製作所 | Power generation plan / power trading plan creation method, apparatus and program |
| EP1618642A1 (en) * | 2003-04-15 | 2006-01-25 | Gridex Power Pty Ltd | A cellular minigrid |
| US20040215394A1 (en) * | 2003-04-24 | 2004-10-28 | Carpenter Richard Lee | Method and apparatus for advanced prediction of changes in a global weather forecast |
| US20040225486A1 (en) * | 2003-05-08 | 2004-11-11 | Mullis Vance Condary | System for generating a resultant model for a power system |
| US7454270B2 (en) * | 2003-05-13 | 2008-11-18 | Siemens Power Transmission & Distribution, Inc. | Dynamic economic dispatch for the management of a power distribution system |
| US20040230533A1 (en) * | 2003-05-16 | 2004-11-18 | Benco David S. | Pro-rated consumable resource governor |
| US20050021386A1 (en) * | 2003-07-23 | 2005-01-27 | Mills Lloyd Paul | Method and system for forecasting a potential cost of an indirect procurement commodity |
| JP4078275B2 (en) * | 2003-09-26 | 2008-04-23 | 株式会社日立製作所 | Method and apparatus for supporting determination of fuel price for power generation |
| US20040215529A1 (en) * | 2004-04-16 | 2004-10-28 | Foster Andre E. | System and method for energy price forecasting automation |
| US20050283346A1 (en) * | 2004-05-24 | 2005-12-22 | Elkins Harold E Ii | Distributed generation modeling system and method |
| US20050004858A1 (en) * | 2004-08-16 | 2005-01-06 | Foster Andre E. | Energy advisory and transaction management services for self-serving retail electricity providers |
| US7551984B1 (en) * | 2005-03-04 | 2009-06-23 | First Energy Corp. | Method of tracking power outages |
| US20070288403A1 (en) * | 2006-06-13 | 2007-12-13 | Honeywell International Inc. | Risk management in energy services |
| US20080033786A1 (en) * | 2006-08-04 | 2008-02-07 | General Electric Company | Power generation mix forecasting modeling method |
| US20090030758A1 (en) | 2007-07-26 | 2009-01-29 | Gennaro Castelli | Methods for assessing potentially compromising situations of a utility company |
| US20090307117A1 (en) * | 2008-06-09 | 2009-12-10 | Greiner Kevin A | Utility services payment system, methods and apparatus |
| US7930070B2 (en) * | 2008-09-25 | 2011-04-19 | Kingston Consulting, Inc. | System, method, and module capable of curtailing energy production within congestive grid operating environments |
| US9396462B2 (en) * | 2008-12-22 | 2016-07-19 | General Electric Company | System and method for roaming billing for electric vehicles |
| US20100161393A1 (en) * | 2008-12-22 | 2010-06-24 | Nathan Bowman Littrell | Systems and methods for charging an electric vehicle within a parking area |
| US9505317B2 (en) * | 2008-12-22 | 2016-11-29 | General Electric Company | System and method for electric vehicle charging and billing using a wireless vehicle communication service |
| US9030153B2 (en) * | 2008-12-22 | 2015-05-12 | General Electric Company | Systems and methods for delivering energy to an electric vehicle with parking fee collection |
| US8583551B2 (en) * | 2008-12-22 | 2013-11-12 | General Electric Company | Systems and methods for prepaid electric metering for vehicles |
| US20100156349A1 (en) * | 2008-12-22 | 2010-06-24 | Nathan Bowman Littrell | System and method for pay as you go charging for electric vehicles |
| US8315930B2 (en) | 2008-12-22 | 2012-11-20 | General Electric Company | Systems and methods for charging an electric vehicle using broadband over powerlines |
| US20100161518A1 (en) * | 2008-12-22 | 2010-06-24 | Nathan Bowman Littrell | Electricity storage controller with integrated electricity meter and methods for using same |
| US20110071882A1 (en) * | 2009-09-22 | 2011-03-24 | International Business Machines Corporation | Method and system for intermediate to long-term forecasting of electric prices and energy demand for integrated supply-side energy planning |
| US8471406B2 (en) * | 2009-11-02 | 2013-06-25 | General Electric Company | Controllable energy utilization system and associated method |
| JP5446922B2 (en) * | 2010-01-25 | 2014-03-19 | ソニー株式会社 | Power management apparatus, electronic device, and electronic device registration method |
| JP5587641B2 (en) * | 2010-03-10 | 2014-09-10 | パナソニック株式会社 | Power supply system |
| US9093840B2 (en) * | 2010-07-02 | 2015-07-28 | Alstom Technology Ltd. | System tools for integrating individual load forecasts into a composite load forecast to present a comprehensive synchronized and harmonized load forecast |
| US8412559B2 (en) | 2011-01-19 | 2013-04-02 | United Parcel Service Of America, Inc. | Systems and methods for improved calculation of coefficient for price sensitivity |
| WO2012101656A2 (en) * | 2011-01-27 | 2012-08-02 | Indian Institute Of Technology, Bombay | A system and method for electricity price forecasting |
| US10127568B2 (en) * | 2011-04-04 | 2018-11-13 | The Catholic University Of America | Systems and methods for improving the accuracy of day-ahead load forecasts on an electric utility grid |
| US20130151022A1 (en) * | 2011-12-07 | 2013-06-13 | General Electric Company | Systems and Methods for Assessing Future Power Plant Capabilities |
| US8457800B2 (en) | 2012-01-19 | 2013-06-04 | General Compression, Inc. | System and method for conserving energy resources through storage and delivery of renewable energy |
| US9429924B2 (en) * | 2012-06-26 | 2016-08-30 | International Business Machines Corporation | Controlling power generators and chillers |
| US10366403B2 (en) * | 2012-10-15 | 2019-07-30 | International Business Machines Corporation | Distributed forecasting and pricing system |
| CN104091210B (en) * | 2014-07-01 | 2017-06-23 | 国家电网公司 | A kind of transaction optimization method transregional transprovincially based on financial path optimization |
| JP2019532206A (en) * | 2016-08-09 | 2019-11-07 | エムエイチアイ ヴェスタス オフショア ウィンド エー/エス | Wind turbine control method and system |
| US20180225684A1 (en) * | 2017-02-03 | 2018-08-09 | General Electric Company | Strategic operation of variable generation power plants |
| DE202018006783U1 (en) * | 2017-09-25 | 2022-12-20 | Asahi Kasei Kabushiki Kaisha | Hydrogen production planning device and program |
| US10504195B2 (en) * | 2017-11-13 | 2019-12-10 | Mitsubishi Electric Research Laboratories, Inc. | System and method for decentralized energy production |
| US11055732B2 (en) * | 2018-09-12 | 2021-07-06 | Mitsubishi Electric Research Laboratories, Inc. | Day-ahead joint generation scheduling and bidding optimization for power plants |
| AU2021255929A1 (en) | 2020-04-14 | 2022-11-10 | The Catholic University Of America | Systems and methods for improving load energy forecasting in the presence of distributed energy resources |
Citations (3)
| Publication number | Priority date | Publication date | Assignee | Title |
|---|---|---|---|---|
| US5237507A (en) * | 1990-12-21 | 1993-08-17 | Chasek Norman E | System for developing real time economic incentives to encourage efficient use of the resources of a regulated electric utility |
| US5621654A (en) * | 1994-04-15 | 1997-04-15 | Long Island Lighting Company | System and method for economic dispatching of electrical power |
| WO1997038385A1 (en) * | 1996-04-10 | 1997-10-16 | Dominion Resources, Inc. | System and method for providing communications between energy suppliers, energy purchasers and transportation providers |
-
1997
- 1997-07-21 US US08/897,808 patent/US5974403A/en not_active Expired - Lifetime
-
1998
- 1998-07-16 EP EP98305683A patent/EP0893775A1/en not_active Ceased
Patent Citations (3)
| Publication number | Priority date | Publication date | Assignee | Title |
|---|---|---|---|---|
| US5237507A (en) * | 1990-12-21 | 1993-08-17 | Chasek Norman E | System for developing real time economic incentives to encourage efficient use of the resources of a regulated electric utility |
| US5621654A (en) * | 1994-04-15 | 1997-04-15 | Long Island Lighting Company | System and method for economic dispatching of electrical power |
| WO1997038385A1 (en) * | 1996-04-10 | 1997-10-16 | Dominion Resources, Inc. | System and method for providing communications between energy suppliers, energy purchasers and transportation providers |
Non-Patent Citations (2)
| Title |
|---|
| KNUTSON K ET AL: "IREMM-an inter-regional electric market model for forecasting the price of bulk power transactions applicable to long term planning", POWER-GEN'92. 5TH INTERNATIONAL CONFERENCE AND EXHIBITION FOR THE POWER GENERATING INDUSTRIES, ORLANDO, FL, USA, 17-19 NOV. 1992, 1992, Houston, TX, USA, Penwell Conferences and Exhibitions, USA, pages 17 - 26 vol.5, XP002080849 * |
| WU C W ET AL: "Estimating residential air conditioner loads using consumer survey information", APSCOM - 93. 2ND INTERNATIONAL CONFERENCE ON ADVANCES IN POWER SYSTEM CONTROL, OPERATION AND MANAGEMENT (CONF. PUBL. NO.388), PROCEEDINGS OF APSCOM'93 - 2ND INTERNATIONAL CONFERENCE ON ADVANCES IN POWER SYSTEMS CONTROL, OPERATION AND MANAGEMENT, HONG, ISBN 0-85296-569-9, 1993, London, UK, IEE, UK, pages 962 - 966 vol.2, XP002080850 * |
Cited By (10)
| Publication number | Priority date | Publication date | Assignee | Title |
|---|---|---|---|---|
| US8504463B2 (en) | 1997-02-24 | 2013-08-06 | Geophonic Networks, Inc. | Bidding for energy supply |
| US8527389B2 (en) | 1997-02-24 | 2013-09-03 | Geophonic Networks, Inc. | Bidding for energy supply to resellers and their customers |
| EP1247201A2 (en) * | 1999-12-23 | 2002-10-09 | Accenture LLP | A method for managing a utility service utilizing a network |
| US7249068B1 (en) * | 2000-06-30 | 2007-07-24 | Hewlett-Packard Development Company, L.P. | Spot market-based inventory planning |
| EP1350199A1 (en) * | 2000-10-27 | 2003-10-08 | Manugistics, Inc. | Supply chain demand forecasting and planning |
| EP1350199A4 (en) * | 2000-10-27 | 2006-12-20 | Manugistics Inc | Supply chain demand forecasting and planning |
| WO2009109591A1 (en) * | 2008-03-04 | 2009-09-11 | International Business Machines Corporation | Method and system for efficient commodity distribution and production |
| CN106485605A (en) * | 2016-12-05 | 2017-03-08 | 北京耀能科技有限公司 | Clean energy resource electricity step price forward purchasing platform and control method |
| CN106485605B (en) * | 2016-12-05 | 2023-05-16 | 华北电力大学 | Clean energy electricity stepped electricity price pre-purchase platform and control method |
| CN113177692A (en) * | 2021-04-06 | 2021-07-27 | 长沙理工大学 | Annual plan completion risk assessment method for state directive electric quantity |
Also Published As
| Publication number | Publication date |
|---|---|
| US5974403A (en) | 1999-10-26 |
Similar Documents
| Publication | Publication Date | Title |
|---|---|---|
| US5974403A (en) | Power trading and forecasting tool | |
| Gabriel et al. | Optimal price and quantity determination for retail electric power contracts | |
| Ni et al. | Optimal integrated generation bidding and scheduling with risk management under a deregulated power market | |
| Hao | A study of basic bidding strategy in clearing pricing auctions | |
| Denton et al. | Managing market risk in energy | |
| Birge | Option methods for incorporating risk into linear capacity planning models | |
| Dahlgren et al. | Risk assessment in energy trading | |
| Gedra | Optional forward contracts for electric power markets | |
| Lobel et al. | Optimal long-term supply contracts with asymmetric demand information | |
| Shahidehpour et al. | Market operations in electric power systems: forecasting, scheduling, and risk management | |
| Xu et al. | Power portfolio optimization in deregulated electricity markets with risk management | |
| US6021402A (en) | Risk management system for electric utilities | |
| Pineda et al. | Using electricity options to hedge against financial risks of power producers | |
| EP1363219A1 (en) | Price evaluation system and method for derivatives, risk management system and method for power exchange | |
| JP2019082935A (en) | Management device and management method | |
| JP2018163516A (en) | Transaction planning apparatus and transaction planning method | |
| US20060026096A1 (en) | Method for managing risk in markets related to commodities delivered over a network | |
| Divényi et al. | Algorithm design for European electricity market clearing with joint allocation of energy and control reserves | |
| Joo et al. | Option valuation applied to implementing demand response via critical peak pricing | |
| Alangi et al. | Can the European intraday market be designed as a congestion management tool? | |
| JP7323673B2 (en) | Management device and management method | |
| Perakis et al. | Multiperiod models with capacities in competitive supply chain | |
| Kristiansen | Risk management in electricity markets emphasizing transmission congestion | |
| Neuhoff et al. | Bidding structures and trading arrangements for flexibility across EU power markets | |
| Liu et al. | New methods for electric energy contract decision making |
Legal Events
| Date | Code | Title | Description |
|---|---|---|---|
| PUAI | Public reference made under article 153(3) epc to a published international application that has entered the european phase |
Free format text: ORIGINAL CODE: 0009012 |
|
| AK | Designated contracting states |
Kind code of ref document: A1 Designated state(s): DE FR GB |
|
| AX | Request for extension of the european patent |
Free format text: AL;LT;LV;MK;RO;SI |
|
| 17P | Request for examination filed |
Effective date: 19990607 |
|
| AKX | Designation fees paid |
Free format text: DE FR GB |
|
| 17Q | First examination report despatched |
Effective date: 20000818 |
|
| STAA | Information on the status of an ep patent application or granted ep patent |
Free format text: STATUS: THE APPLICATION HAS BEEN REFUSED |
|
| 18R | Application refused |
Effective date: 20070318 |