EP0969283A1 - A method for processing measuring values - Google Patents
A method for processing measuring values Download PDFInfo
- Publication number
- EP0969283A1 EP0969283A1 EP98111692A EP98111692A EP0969283A1 EP 0969283 A1 EP0969283 A1 EP 0969283A1 EP 98111692 A EP98111692 A EP 98111692A EP 98111692 A EP98111692 A EP 98111692A EP 0969283 A1 EP0969283 A1 EP 0969283A1
- Authority
- EP
- European Patent Office
- Prior art keywords
- peaks
- signal
- structuring element
- signal portions
- measuring values
- Prior art date
- Legal status (The legal status is an assumption and is not a legal conclusion. Google has not performed a legal analysis and makes no representation as to the accuracy of the status listed.)
- Withdrawn
Links
Images


Classifications
-
- G—PHYSICS
- G01—MEASURING; TESTING
- G01N—INVESTIGATING OR ANALYSING MATERIALS BY DETERMINING THEIR CHEMICAL OR PHYSICAL PROPERTIES
- G01N30/00—Investigating or analysing materials by separation into components using adsorption, absorption or similar phenomena or using ion-exchange, e.g. chromatography or field flow fractionation
- G01N30/02—Column chromatography
- G01N30/86—Signal analysis
- G01N30/8624—Detection of slopes or peaks; baseline correction
-
- G—PHYSICS
- G01—MEASURING; TESTING
- G01N—INVESTIGATING OR ANALYSING MATERIALS BY DETERMINING THEIR CHEMICAL OR PHYSICAL PROPERTIES
- G01N30/00—Investigating or analysing materials by separation into components using adsorption, absorption or similar phenomena or using ion-exchange, e.g. chromatography or field flow fractionation
- G01N30/02—Column chromatography
- G01N30/86—Signal analysis
- G01N30/8603—Signal analysis with integration or differentiation
- G01N30/8617—Filtering, e.g. Fourier filtering
-
- G—PHYSICS
- G01—MEASURING; TESTING
- G01N—INVESTIGATING OR ANALYSING MATERIALS BY DETERMINING THEIR CHEMICAL OR PHYSICAL PROPERTIES
- G01N30/00—Investigating or analysing materials by separation into components using adsorption, absorption or similar phenomena or using ion-exchange, e.g. chromatography or field flow fractionation
- G01N30/02—Column chromatography
- G01N30/86—Signal analysis
- G01N30/8624—Detection of slopes or peaks; baseline correction
- G01N30/8631—Peaks
-
- G—PHYSICS
- G06—COMPUTING; CALCULATING OR COUNTING
- G06F—ELECTRIC DIGITAL DATA PROCESSING
- G06F2218/00—Aspects of pattern recognition specially adapted for signal processing
- G06F2218/02—Preprocessing
Abstract

Description
- The invention relates to a method for processing one-dimensional or two-dimensional representations of measuring values, such as chromatograms or spectra or electropherograms. Such a method can be used, for example, to determine the peaks in a chromatogram representing chromatographically separated sample substances.
- Spectra and chromatograms are often disturbed by an underlying drifting and noisy baseline. It is then particularly difficult to localize the peaks in the spectrum or chromatogram and to evaluate their area. This leads to inaccurate measuring results. First, errors in the location of a spectral or chromatographic peak may lead to errors in the type of substance being determined. Second, errors in the area of the peaks lead to errors in the quantitative amount of the substances being determined.
- In order to cope with the mentioned problems, it is known to use curve-fitting techniques, wherein idealized curves are fitted to the measured spectrum or chromatogram. From these fitted curves, information about the location and the area of the peaks can be derived.
- In view of the prior art, it is an object of the invention to provide a method for processing measuring values which permits a more precise and reproducible localization of peaks and determination of the peak areas.
- It is another object of the invention to provide a method for processing measuring values which does not require idealized assumptions about the shapes of the peaks.
- According to the present invention, these objects are achieved by a method comprising the following steps:
- a) filtering, by a data processing means, the measuring values by employing a morphological or median filter, wherein said filter uses a structuring element and wherein said filtering step comprises the decomposition of said measuring values into a series of decomposed signal portions, said decomposed signal portions resulting from the use of different structuring elements, respectively, and
- b) analysing said decomposed signal portions with regard to any peaks corresponding to peaks in said representation of measuring values.
-
- According to the invention, it has been found, surprisingly, that morphological or median filters can be employed advantageously for analyzing one-dimensional or two-dimensional representations of measuring values, in particular chromatograms or spectra. In accordance with an embodiment of the invention, the original measuring values, for example the chromatogram, are decomposed into various signal portions, wherein different decomposed signal portions correspond to different structuring elements used for the decomposition. From the various decomposed signal portions, the precise locations and the areas of the peaks can be determined. The invention can also be used for analyzing electropherograms, i.e., representations of measuring values obtained by an electrophoretic separation process, such as capillary electrophoresis.
- In a preferred embodiment for analyzing chromatograms, the structuring element is an elliptical structuring element and the width of the structuring element is changed successively during various iterations of the filtering process, such as to produce different decomposed signal portions.
- The method of the invention has several advantages. A first advantage is that only few parameters are needed. According to an embodiment of the invention, a very good approximation of the ideal signal can be achieved with only three estimated parameters: a) minimal height, b) minimal width, and c) maximal width.
- A second advantage of the method of the invention is its robustness. The method can treat nearly any kind of signal on the basis of only very few estimated parameters. For example, the method of the invention yields accurate and linear results for signals with nearly any kind of baseline and signal-to-noise ratio. In this connection, the term "accurate" is to be understood in terms of relative error, and the term "linear" is to be understood with regard to variation of the height and area of the peaks. According to the invention, the baseline drift can be eliminated completely, noise is drastically reduced and the evaluation of the peaks is satisfactory.
- A third advantage of the method of the invention is that it does not deform the peaks. It substantially preserves the foots, shoulders or any other features of the peaks without any prior assumptions about shapes being required. Unlike the classical applications of mathematical morphology, the present invention does not just use mathematical morphology to recognize patterns or to detect objects, but it actually extracts peaks and thus enables a further, more detailed analysis, such as separation of overlapping peaks, determination of peak areas, and other analyses.
- Furthermore, the method of the invention integrates with a filtering part a part for precisely localizing and evaluating the areas of the peaks. Thus, it is not necessary to use additional specialized software and the results become more accurate. The invention thus provides for automatic recognition of the peaks in a chromatogram or spectrum while respecting the areas of the peaks.
- The morphological filters (i.e., non-linear filters) used in the invention are representing information in terms of shapes and not in terms of frequency as most of their standard linear counterparts. This leads to a better preservation of sharp edges and renders the method of the invention especially appropriate for peak recognition. Thus it offers in many cases (such as edge detection, noise removal) a better alternative to the classical frequency based approach. Moreover, such filters are easily adjustable to the data dimensions: one-dimensional signals, images or higher dimensional signals can be treated equally well. The mentioned morphological filters offer a great versatility. Due to the possibility to choose the reference form, i.e. the structuring element, and due to the virtually unlimited possibilities of combining basic operators, one can customize the filters to treat a wide range of problems.
- An important aspect of the present invention is the discovery that special types of mathematical filters can be used in chromatography or spectrophotometry for signal analysis, yielding unexpected advantages. Some types of mathematical filters are described, in a different context than the present invention, in the following publications:
J. Serra, "Image Analysis and Mathematical Morphology", London (1981); D. Wilson et al., "Morphological Restoration of Atomic Force Microscopy Images", Langmuir 1995, 11, 265-272.
Another prior art method for processing measuring values is known from: G. Pearson, "A General Baseline-Recognition and Baseline-Flattening Algorithm", Journal of Magnetic Resonance, 27, 265-272 (1997). - In the following, embodiments of the invention will be explained in detail with reference to the drawings.
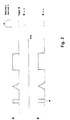
- Figure 1
- illustrates some operations used in morphological filters .
- Figure 2
- shows the effect of morphological operations on a signal.
- Figure 3
- illustrates results achieved with a method of the invention in analyzing chromatograms.
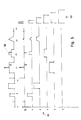
- Figure 4
- illustrates the localization of peaks in a chromatogram from the pre-processed signal.
- Figure 5
- illustrates the principle of a sieve filter.
- The method of the invention deals with the processing of measuring values, such as a chromatogram produced by a liquid chromatograph. The chromatogram typically consists of a collection of data points representing the variation of a detector signal measured at the outlet of the chromatographic separation column as a function of time. The data points are processed by a digital data processing means which may be integrated with the liquid chromatograph or which may be a separate unit connected to the chromatograph. The measured and the processed chromatograms as well as peak locations and peak areas resulting from the processing can be displayed on a display screen and/or printed out by request of a user. When using the invention in connection with a spectrophotometer, the measuring values comprise a collection of data points representing intensities at different wavelengths. The spectrophotometer can be used, for example, to perform a spectral analysis of the substances eluting from the separation column of a liquid chromatograph or of a capillary electrophoresis device.
- The method of the invention makes use of morphological filters. Some morphological filters have been developed in morphological mathematics which is a theory for analyzing data with regard to form and structure. Morphological filters are non-linear filters representing information in terms of shape and not in terms of frequency as most of the standard linear filters. With morphological filters, the analysis is performed with the help of an adapted element, the "structuring element". An introduction to morphological mathematics can be found in the above mentioned textbook by J. Serra. In the following, some terms of morphological mathematics which will be used in the subsequent description will be explained.
- Basic operators in morphological mathematics are dilation ⊕, erosion ⊖, closing and opening. For the explanation of these operators, reference is now made to Figure 1A-C. In Figure 1A-C, reference sign M denotes the signal which is to be filtered, and L denotes the structuring element with a reference point marked by a dot. The umbra of a signal is defined as all the values "under" the signal surface, i.e. the grey part in Figure 1A.
- The dilation M⊕L of the signal M by the element L is defined by the following formula:
- The dilation operation can be understood graphically (Figure 1C) as placing the reference point of the element L on all points within the umbra of M. L thus describes an output umbra which defines the dilated signal M⊕L.
- The erosion of the signal M by the structuring element L , i.e. the operation M⊖L is described by the following formula:
- The erosion operation can also be understood as moving vertically , for each point, the structuring element L such that it remains entirely in the umbra of M. This is illustrated in Figure 1B.
- The aforementioned two basic operators can be combined to obtain the closing operator (•) and the opening operator (o) as illustrated in Figures 2A and 2B. M denotes the original signal and L the structuring element L. The dotted curve in Figure 2A is the result of the opening operation, and the dotted curve in Figure 2B is the result of the closing operation. The opening operation as illustrated in Figure 2A consists in first eroding and then dilating the signal M with the same structuring element L:
- The closing operation as illustrated in Figure 2B consist in first dilating and then eroding the signal M with the same structuring element L:
- The opening operation can also be illustrated by the following analogy. The operation corresponds to a process wherein one takes an object whose top surface is described by the structuring element, presses the object upwards against the underside surface of the signal and moves it along the signal. Finally, the curve described by the highest positions of the object corresponds to the opened signal. Thus, positive features of the signal that are smaller than the structuring element are eliminated. Figure 2A shows how the structuring element L is pressed, according to the mentioned analogy, from below in the triangular and rectangular elements of the signal.
In case of a spherical structuring element, the opening operation is called "rolling ball algorithm". - In the following, the term "sieve" will be explained. A morphological filter can roughly be considered as a method for extracting all the features from a signal which are, first, either positive or negative and, second, wider than the structuring element. To get a full lengthy description of a signal it is easy to imagine that one may decompose it on various levels, each corresponding to a fixed size of the features. This is called a sieve. It is obtained by the following method:
- 1. Filter the signal Sn-1 with the structuring element Ln.
- 2. Subtract the filtered signal Sn from the original signal to gain the residues Rn.
- 3. Increase the width of the structuring element (respecting its form) from one (n = n + 1) and iterate the process. The sieve based on the filter ψn (n being the width of the structuring element) is defined as follows:
-
- The collection of residues (Ri) (i = 1,2,...,n) plus possibly the last filtered signal Sn + 1 then represent the signal with its features classified amongst the residues according to their width.
- Figure 5 illustrates a sieve filter with an example. The original signal to be filtered is labeled with
reference numeral 50.Block 51 depicts a sieve decomposition of thesignal 50 using a morphological filter. The various levels ½ , 1, 2, 3, 4, 5 inblock 51 are generated by varying the width of thestructuring element 52. The widths of thestructuring element 52 are schematically illustrated at the right of each level. The width of the structuring element is successively increased from the first to the last level. As can be seen, theoriginal signal 50 is thus decomposed into various levels, from which the peaks in the signal are clearer apparent and from which quantitative analyses of the peaks can be made. - A useful property of sieve filters is the relatively small influence of noise on the final result. Typically, high-frequency (or short-term noise) is for the greatest part concentrated on the very first levels of the sieve, corresponding to the small structuring elements. Therefore, it can be easily removed from the final result, moreover, it does not unduly influence the other levels of the sieve.
- The sieve filters are also able to compactly describe and efficiently classify the different features contained in the original signal. In contrast to matched filters or wavelet analysis, these filters are binding the features with edges. That means that peaks, baseline or any noticeable feature would be found in a few number of levels and always at the same place, limited by the edges of the selected feature.
- The method of the invention is particularly useful for analyzing chromatograms, as will be described in the following. The data set representing the chromatogram is first submitted to an opening morphological filter with an adapted structuring element. The structuring element is adapted with regard to the minimal height of the expected peak. First, the structuring element is chosen so as to be very small in terms of length. The filter lets pass only the elements contained in the data set which are of larger width than the structuring element. The filtered curve is subtracted from the original data set, thus giving the first residue. The process is then iterated with the elements growing in length. As a result, the residues are describing on the first levels the high-frequency noise, which can also be described as small non-smooth parts of the signal. Then, the chromatographic peaks appear, and on levels corresponding to structuring elements wider than the maximal peak width, drift and baseline of the chromatogram can be found. The useful signal is easily gained back by adding the residues of the middle levels. In this connection, "middle levels" corresponds to a size of the structuring element between the minimal and maximum width of the peak.
- In the filtered signal, the locations of the peaks are then roughly estimated with the help of the minimal height parameter. This parameter can typically be chosen by a user such that it is greater than the noise level, but smaller than the smallest peak. Any value in this range leads to good results, but it is preferred to keep some distance from the limits of the range.
- The underlying peak area is then evaluated by precisely locating the peaks in the residues of the sieve and adding the involved surface. The peak localization in this embodiment has been performed in two steps, i.e., by an initial coarse localization and a subsequent fine localization, in order to achieve localization faster and more reliably.
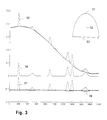
- Figure 3 illustrates in more detail the results which can be achieved with the invention in connection with chromatograms. The horizontal axis is the time axis, the indicated numbers are data points. The vertical axis represents the intensity.
The original curve, i.e., thechromatogram 35, is shown at the top of Figure
3. The ideal signal is denoted withreference numeral 36, and the signal resulting from the filtering is denoted withreference numeral 37. Together with the filteredsignal 37, acurve 38 is shown , which indicates the deviation between the filteredsignal 37 and theideal signal 36. - In the embodiment illustrated in Figure 3, an
elliptical structuring element 31 is used. On the various levels of the sieve, theheight 32 of the structuring element is kept constant while the "radius" orwidth 33 is decreasing throughout the levels of the sieve. An elliptical structuring element has certain advantages for analyzing chromatograms because there is typically a great difference between vertical and horizontal resolution in chromatograms. The operator used in this embodiment is a basic opening operator as defined above. - Processing the levels of the sieve:
The range of levels (i.e., the range of widths of the structuring elements corresponding to each level) used to rebuild the signal is critical to eliminate undesired effects without distorting the peaks. The minimal peak width and the maximal peak width provides the range of levels that are to be selected. The minimal peak width is determined by the resolution of the chromatographic apparatus and the maximal peak width is a parameter to be chosen as being smaller than the wander and baseline variations. The maximal peak width is typically chosen by the user. The other levels typically contain only short term or long term noise effects and can be dumped. Within that range, levels are to be correctly spaced, that means that the increase of the structuring element is dimensioned such that the levels will contain a satisfying image of the peaks. In a practical example, for peaks varying between 24 and 250 data points in length, the "radius" of the elliptical structuring element is made to vary between 10 and 300 data points in steps of 10 for a height corresponding approximately to 10 times the minimal peak height. - A further improvement can be made by introducing a threshold in the levels. This removes minor contributions which are most of the time due to noisy effects. The criterion can be the median value of the considered level, with a threshold value proportional to it.
- When side effects are present, a further improvement can be achieved by widening the signal beyond its start and end points by extending its end values for the maximal size of the structuring element. This is illustrated in Figure 4, wherein the
ranges - With the sieve method of the invention, the error is minimal and a significant improvement is made in terms of reproducibility and linearity as compared to known filters. Furthermore, the sieve filter is particularly resistant to noise. Other useful features are the flatness and the absence of horizontal offset.
- Through the sieve process, access is gained to a lot more information than actually used just for eliminating unwanted noises. In particular, by analyzing the levels, a precise location of the peaks can be extracted. Based on this knowledge, a simple addition of the peaks' values will give a good approximation of the area under the peaks. That means that a complete analysis of the signal is performed, completing the first filtering and avoiding the need of further software.
- The following algorithm can be used for integrating the peak areas. For explaining the algorithm, reference will be made to Figure 4, wherein the upper part shows a filtered signal and the lower part shows the extracted peaks.
- 1. Points that belong to the peaks according to the criterion "value is greater than half the minimal peak height" are marked in the reconstructed signal (Figure 4, threshold line 41).
- 2. For each marked point, the adjoining areas of non-zero terms are searched in the various levels. The values found are added to form a new signal.
- 3. The non-zero parts of the newly gained signal are separated, each
corresponding to a peak, hereby giving precisely the locations of the
peaks. This is illustrated in the lower part of Figure 4 by the dots, such
as
dots points -
- Various modifications to the above described embodiment are possible. For example, different morphological filters having other structuring elements (such as a segment or a Gausssian element) could be used. Also, more elaborated operators can be used. Instead of a morphological filter, a related but non-morphological filter, such as a median filter could be used.
- Modifications are also possible with regard to choice and use of the levels. For example, the space and range of the levels may vary. Furthermore, other methods to identify the peaks, for example a gradient method can be used.
Claims (7)
- A method for processing one-dimensional or two-dimensional data sets representing or derived from measuring values, such as chromatograms, electropherograms, or spectra,
characterized by the following steps:a) filtering, by a data processing means, said data sets (50) by employing a morphological or median filter, wherein said filter uses a structuring element and wherein said filtering step comprises the decomposition of said data sets into a series of decomposed signal portions, said decomposed signal portions (52a, 52b, ...) resulting from the use of different structuring elements, respectively, andb) analyzing said decomposed signal portions with regard to any peaks corresponding to peaks in said data sets representing or derived from said measuring values. - A method as in claim 1, comprising a step of determining the positions of said peaks in said decomposed signal portions.
- A method as in claim 1 or 2, additionally comprising a step of determining the area of said peaks in said decomposed signal portions.
- A method as in any of the preceding claims, wherein said filter is a morphological filter comprising a structuring element and an operator.
- A method as in claim 4, wherein said structuring element is an elliptical structuring element.
- A method as in claim 4 or 5, wherein said operator is an operator performing an opening operation.
- A method as in any of the preceding claims, wherein different decomposed signal portions (52a, 52b, ...) are generated by varying the width of the structuring element in a predetermined way.
Priority Applications (1)
| Application Number | Priority Date | Filing Date | Title |
|---|---|---|---|
| EP98111692A EP0969283A1 (en) | 1998-06-25 | 1998-06-25 | A method for processing measuring values |
Applications Claiming Priority (1)
| Application Number | Priority Date | Filing Date | Title |
|---|---|---|---|
| EP98111692A EP0969283A1 (en) | 1998-06-25 | 1998-06-25 | A method for processing measuring values |
Publications (1)
| Publication Number | Publication Date |
|---|---|
| EP0969283A1 true EP0969283A1 (en) | 2000-01-05 |
Family
ID=8232170
Family Applications (1)
| Application Number | Title | Priority Date | Filing Date |
|---|---|---|---|
| EP98111692A Withdrawn EP0969283A1 (en) | 1998-06-25 | 1998-06-25 | A method for processing measuring values |
Country Status (1)
| Country | Link |
|---|---|
| EP (1) | EP0969283A1 (en) |
Cited By (12)
| Publication number | Priority date | Publication date | Assignee | Title |
|---|---|---|---|---|
| WO2002086491A1 (en) * | 2001-04-19 | 2002-10-31 | Varian, Inc. | Method and system for classifying chromatograms |
| US6787761B2 (en) * | 2000-11-27 | 2004-09-07 | Surromed, Inc. | Median filter for liquid chromatography-mass spectrometry data |
| EP1467204A2 (en) * | 2003-04-09 | 2004-10-13 | ISCO, Inc. | Method and apparatus to enhance the signal to noise ratio in chromatography |
| US6835927B2 (en) | 2001-10-15 | 2004-12-28 | Surromed, Inc. | Mass spectrometric quantification of chemical mixture components |
| US6937330B2 (en) | 1999-04-23 | 2005-08-30 | Ppd Biomarker Discovery Sciences, Llc | Disposable optical cuvette cartridge with low fluorescence material |
| US6989100B2 (en) | 2002-05-09 | 2006-01-24 | Ppd Biomarker Discovery Sciences, Llc | Methods for time-alignment of liquid chromatography-mass spectrometry data |
| EP1657542A1 (en) * | 2004-10-22 | 2006-05-17 | Agilent Technologies Inc. (a Delaware Corporation) | Nonlinear filtering of time dependent surface plasmon resonance shift sensing |
| EP1940536A2 (en) * | 2005-10-25 | 2008-07-09 | Waters Investments Limited | Baseline modeling in chromatography |
| FR2950145A1 (en) * | 2009-09-14 | 2011-03-18 | Inst Francais Du Petrole | Chromatographic signal analyzing method for use during quantitative analysis of products in e.g. chemical industry, involves determining start time and end time of elution peaks by determining positions of minima of chromatographic signal |
| CN102680080A (en) * | 2012-05-03 | 2012-09-19 | 中国科学技术大学 | Unsteady-state signal detection method based on improved self-adaptive morphological filtering |
| GB2520684A (en) * | 2013-11-27 | 2015-06-03 | Micromass Ltd | Method for measurement of ion events |
| JP2021521440A (en) * | 2018-04-18 | 2021-08-26 | アジレント・テクノロジーズ・インクAgilent Technologies, Inc. | Analysis of blank tests for chromatograph performance |
Citations (2)
| Publication number | Priority date | Publication date | Assignee | Title |
|---|---|---|---|---|
| EP0395481A2 (en) * | 1989-04-25 | 1990-10-31 | Spectra-Physics, Inc. | Method and apparatus for estimation of parameters describing chromatographic peaks |
| US5098536A (en) * | 1991-02-01 | 1992-03-24 | Beckman Instruments, Inc. | Method of improving signal-to-noise in electropherogram |
-
1998
- 1998-06-25 EP EP98111692A patent/EP0969283A1/en not_active Withdrawn
Patent Citations (2)
| Publication number | Priority date | Publication date | Assignee | Title |
|---|---|---|---|---|
| EP0395481A2 (en) * | 1989-04-25 | 1990-10-31 | Spectra-Physics, Inc. | Method and apparatus for estimation of parameters describing chromatographic peaks |
| US5098536A (en) * | 1991-02-01 | 1992-03-24 | Beckman Instruments, Inc. | Method of improving signal-to-noise in electropherogram |
Non-Patent Citations (4)
| Title |
|---|
| A. W. MOORE ET AL.: "Median Filtering for Removal of Low-Frequency Background Drift", ANALYTICAL CHEMISTRY., vol. 65, no. 2, 15 January 1993 (1993-01-15), COLUMBUS US, pages 188 - 191, XP002086223 * |
| D. L. WILSON ET AL., LANGMUIR, vol. 11, no. 1, January 1995 (1995-01-01), pages 265 - 272, XP002086222 * |
| M. M. SKOLNICK: "Application of Morphological Transformations to the Analysis of Two-Dimensional Electrophoretic Gels of Biological Materials", COMPUTER VISION GRAPHICS AND IMAGE PROCESSING., vol. 35, no. 3, September 1986 (1986-09-01), MA US, pages 306 - 332, XP002086220 * |
| Q. WANG ET AL.: "Application of median-type filtering to image segmentation in electrophoresis", SPIE BIOMEDICAL IMAGE PROCESSING II, vol. 1450, 1991, san jose,ca,us, pages 47 - 58, XP002086221 * |
Cited By (22)
| Publication number | Priority date | Publication date | Assignee | Title |
|---|---|---|---|---|
| US6937330B2 (en) | 1999-04-23 | 2005-08-30 | Ppd Biomarker Discovery Sciences, Llc | Disposable optical cuvette cartridge with low fluorescence material |
| US6787761B2 (en) * | 2000-11-27 | 2004-09-07 | Surromed, Inc. | Median filter for liquid chromatography-mass spectrometry data |
| US6936814B2 (en) | 2000-11-27 | 2005-08-30 | Surromed, Llc | Median filter for liquid chromatography-mass spectrometry data |
| AU2002307141B2 (en) * | 2001-04-19 | 2006-07-20 | Varian, Inc. | Method and system for analysing chromatograms |
| US6816789B2 (en) | 2001-04-19 | 2004-11-09 | Varian, Inc. | Method and system for analyzing chromatograms |
| WO2002086491A1 (en) * | 2001-04-19 | 2002-10-31 | Varian, Inc. | Method and system for classifying chromatograms |
| US7087896B2 (en) | 2001-10-15 | 2006-08-08 | Ppd Biomarker Discovery Sciences, Llc | Mass spectrometric quantification of chemical mixture components |
| US6835927B2 (en) | 2001-10-15 | 2004-12-28 | Surromed, Inc. | Mass spectrometric quantification of chemical mixture components |
| US6989100B2 (en) | 2002-05-09 | 2006-01-24 | Ppd Biomarker Discovery Sciences, Llc | Methods for time-alignment of liquid chromatography-mass spectrometry data |
| EP1467204A3 (en) * | 2003-04-09 | 2005-02-09 | ISCO, Inc. | Method and apparatus to enhance the signal to noise ratio in chromatography |
| EP1467204A2 (en) * | 2003-04-09 | 2004-10-13 | ISCO, Inc. | Method and apparatus to enhance the signal to noise ratio in chromatography |
| EP1657542A1 (en) * | 2004-10-22 | 2006-05-17 | Agilent Technologies Inc. (a Delaware Corporation) | Nonlinear filtering of time dependent surface plasmon resonance shift sensing |
| US7230714B2 (en) | 2004-10-22 | 2007-06-12 | Agilent Technologies, Inc. | Nonlinear filtering for events in SPR sensing |
| EP1940536A2 (en) * | 2005-10-25 | 2008-07-09 | Waters Investments Limited | Baseline modeling in chromatography |
| EP1940536A4 (en) * | 2005-10-25 | 2009-06-17 | Waters Technologies Corp | Baseline modeling in chromatography |
| US8511140B2 (en) | 2005-10-25 | 2013-08-20 | Waters Technologies Corporation | Baseline modeling in chromatography |
| FR2950145A1 (en) * | 2009-09-14 | 2011-03-18 | Inst Francais Du Petrole | Chromatographic signal analyzing method for use during quantitative analysis of products in e.g. chemical industry, involves determining start time and end time of elution peaks by determining positions of minima of chromatographic signal |
| CN102680080A (en) * | 2012-05-03 | 2012-09-19 | 中国科学技术大学 | Unsteady-state signal detection method based on improved self-adaptive morphological filtering |
| CN102680080B (en) * | 2012-05-03 | 2014-09-10 | 中国科学技术大学 | Unsteady-state signal detection method based on improved self-adaptive morphological filtering |
| GB2520684A (en) * | 2013-11-27 | 2015-06-03 | Micromass Ltd | Method for measurement of ion events |
| GB2520684B (en) * | 2013-11-27 | 2020-05-20 | Micromass Ltd | Method for measurement of ion events |
| JP2021521440A (en) * | 2018-04-18 | 2021-08-26 | アジレント・テクノロジーズ・インクAgilent Technologies, Inc. | Analysis of blank tests for chromatograph performance |
Similar Documents
| Publication | Publication Date | Title |
|---|---|---|
| EP0969283A1 (en) | A method for processing measuring values | |
| Tsai et al. | Derivative analysis of hyperspectral data | |
| US6936814B2 (en) | Median filter for liquid chromatography-mass spectrometry data | |
| Shen et al. | An effective thin cloud removal procedure for visible remote sensing images | |
| Kovesi | Image features from phase congruency | |
| Shao et al. | Wavelet transform and its applications in high performance liquid chromatography (HPLC) analysis | |
| MX2007000064A (en) | Automatic background removal for input data. | |
| Hollingsworth et al. | Comparative visualization for comprehensive two-dimensional gas chromatography | |
| CN108682008A (en) | A kind of Leukocyte Image clarity evaluation method and device | |
| Shao et al. | Wavelet analysis in analytical chemistry | |
| Gebrekidan et al. | Refinement of spectra using a deep neural network: Fully automated removal of noise and background | |
| Ijemaru et al. | Image processing system using MATLAB-based analytics | |
| Ko | Fingerprint enhancement by spectral analysis techniques | |
| Bhargava et al. | Route to higher fidelity FT-IR imaging | |
| Li et al. | A streak detection approach for comprehensive two-dimensional gas chromatography based on image analysis | |
| US10670458B2 (en) | Method for acquiring and forming a spectrometry image by adapted spatial sampling | |
| Pollatou | An automated method for removal of striping artifacts in fluorescent whole-slide microscopy | |
| JPH07270387A (en) | Multichannel chromatograph analyzing method and apparatus | |
| Yeap et al. | Adaptive tuning piecewise cubic Hermite interpolation with Wiener filter in wavelet domain for scanning electron microscope images | |
| Sao et al. | Edge extraction using zero-frequency resonator | |
| KR102650686B1 (en) | Apparatus for measuring object volume using 3d image equipment and method thereof | |
| KR101440236B1 (en) | METHOD FOR ANALYZING X-Ray FLUORESCENCE AND METHOD FOR REMOVING BACKGROUND | |
| Stultz et al. | Discussion of techniques that separate orthogonal data produced by Ronchi cross grating patterns | |
| Datta et al. | Information density based image binarization for text document containing graphics | |
| Vaz et al. | A vision-based system for automatic growing ring detection and measurement |
Legal Events
| Date | Code | Title | Description |
|---|---|---|---|
| PUAI | Public reference made under article 153(3) epc to a published international application that has entered the european phase |
Free format text: ORIGINAL CODE: 0009012 |
|
| 17P | Request for examination filed |
Effective date: 19990527 |
|
| AK | Designated contracting states |
Kind code of ref document: A1 Designated state(s): DE GB |
|
| AX | Request for extension of the european patent |
Free format text: AL;LT;LV;MK;RO;SI |
|
| AKX | Designation fees paid |
Free format text: DE GB |
|
| RAP1 | Party data changed (applicant data changed or rights of an application transferred) |
Owner name: AGILENT TECHNOLOGIES, INC. |
|
| RAP1 | Party data changed (applicant data changed or rights of an application transferred) |
Owner name: AGILENT TECHNOLOGIES INC. |
|
| RAP1 | Party data changed (applicant data changed or rights of an application transferred) |
Owner name: AGILENT TECHNOLOGIES INC. A DELAWARE CORPORATION |
|
| RAP1 | Party data changed (applicant data changed or rights of an application transferred) |
Owner name: AGILENT TECHNOLOGIES, INC. (A DELAWARE CORPORATION |
|
| 17Q | First examination report despatched |
Effective date: 20050217 |
|
| STAA | Information on the status of an ep patent application or granted ep patent |
Free format text: STATUS: THE APPLICATION IS DEEMED TO BE WITHDRAWN |
|
| 18D | Application deemed to be withdrawn |
Effective date: 20050628 |