EP1400818A2 - Fracture monitoring using pressure-frequency analysis - Google Patents
Fracture monitoring using pressure-frequency analysis Download PDFInfo
- Publication number
- EP1400818A2 EP1400818A2 EP03255785A EP03255785A EP1400818A2 EP 1400818 A2 EP1400818 A2 EP 1400818A2 EP 03255785 A EP03255785 A EP 03255785A EP 03255785 A EP03255785 A EP 03255785A EP 1400818 A2 EP1400818 A2 EP 1400818A2
- Authority
- EP
- European Patent Office
- Prior art keywords
- frequency
- fracture
- data
- pressure
- monitoring method
- Prior art date
- Legal status (The legal status is an assumption and is not a legal conclusion. Google has not performed a legal analysis and makes no representation as to the accuracy of the status listed.)
- Granted
Links
- 238000012544 monitoring process Methods 0.000 title claims description 35
- 238000004458 analytical method Methods 0.000 title claims description 13
- 238000000034 method Methods 0.000 claims abstract description 117
- 230000008569 process Effects 0.000 claims abstract description 45
- 238000001228 spectrum Methods 0.000 claims abstract description 26
- 238000001914 filtration Methods 0.000 claims abstract description 19
- 230000004044 response Effects 0.000 claims abstract description 19
- 230000003247 decreasing effect Effects 0.000 claims abstract description 10
- 239000012530 fluid Substances 0.000 claims description 43
- 230000015572 biosynthetic process Effects 0.000 claims description 21
- 238000005086 pumping Methods 0.000 claims description 10
- 230000005534 acoustic noise Effects 0.000 abstract description 4
- 230000001131 transforming effect Effects 0.000 abstract description 2
- 206010017076 Fracture Diseases 0.000 description 117
- 208000010392 Bone Fractures Diseases 0.000 description 108
- 238000005755 formation reaction Methods 0.000 description 19
- 238000005516 engineering process Methods 0.000 description 14
- 239000004576 sand Substances 0.000 description 11
- 230000000638 stimulation Effects 0.000 description 7
- 230000006399 behavior Effects 0.000 description 6
- 238000007789 sealing Methods 0.000 description 6
- 230000007423 decrease Effects 0.000 description 5
- 238000011161 development Methods 0.000 description 5
- 230000006870 function Effects 0.000 description 5
- 229930195733 hydrocarbon Natural products 0.000 description 5
- 150000002430 hydrocarbons Chemical class 0.000 description 4
- 238000004519 manufacturing process Methods 0.000 description 4
- 239000004215 Carbon black (E152) Substances 0.000 description 3
- 230000008859 change Effects 0.000 description 3
- 230000000875 corresponding effect Effects 0.000 description 3
- 230000000694 effects Effects 0.000 description 3
- 238000002474 experimental method Methods 0.000 description 3
- 238000005070 sampling Methods 0.000 description 3
- 238000011282 treatment Methods 0.000 description 3
- 230000009471 action Effects 0.000 description 2
- 238000013459 approach Methods 0.000 description 2
- 238000010276 construction Methods 0.000 description 2
- 230000001276 controlling effect Effects 0.000 description 2
- 238000013500 data storage Methods 0.000 description 2
- 238000000354 decomposition reaction Methods 0.000 description 2
- 230000001419 dependent effect Effects 0.000 description 2
- 239000000463 material Substances 0.000 description 2
- 239000000203 mixture Substances 0.000 description 2
- 238000012856 packing Methods 0.000 description 2
- 230000009467 reduction Effects 0.000 description 2
- 230000009466 transformation Effects 0.000 description 2
- 208000006670 Multiple fractures Diseases 0.000 description 1
- 235000009413 Ratibida columnifera Nutrition 0.000 description 1
- 241000510442 Ratibida peduncularis Species 0.000 description 1
- 208000013201 Stress fracture Diseases 0.000 description 1
- 238000009825 accumulation Methods 0.000 description 1
- 239000002253 acid Substances 0.000 description 1
- 150000007513 acids Chemical class 0.000 description 1
- 230000003321 amplification Effects 0.000 description 1
- 238000000429 assembly Methods 0.000 description 1
- 230000000712 assembly Effects 0.000 description 1
- 230000008901 benefit Effects 0.000 description 1
- 230000005540 biological transmission Effects 0.000 description 1
- 239000002131 composite material Substances 0.000 description 1
- 238000010924 continuous production Methods 0.000 description 1
- 238000007796 conventional method Methods 0.000 description 1
- 230000002596 correlated effect Effects 0.000 description 1
- 238000013480 data collection Methods 0.000 description 1
- 230000003111 delayed effect Effects 0.000 description 1
- 238000001514 detection method Methods 0.000 description 1
- 238000011156 evaluation Methods 0.000 description 1
- 230000001747 exhibiting effect Effects 0.000 description 1
- 239000008187 granular material Substances 0.000 description 1
- 125000001183 hydrocarbyl group Chemical group 0.000 description 1
- 230000003116 impacting effect Effects 0.000 description 1
- 238000011221 initial treatment Methods 0.000 description 1
- 238000009434 installation Methods 0.000 description 1
- 238000011835 investigation Methods 0.000 description 1
- 238000012986 modification Methods 0.000 description 1
- 230000004048 modification Effects 0.000 description 1
- 238000003199 nucleic acid amplification method Methods 0.000 description 1
- 239000011236 particulate material Substances 0.000 description 1
- 230000035699 permeability Effects 0.000 description 1
- 238000004445 quantitative analysis Methods 0.000 description 1
- 229910052704 radon Inorganic materials 0.000 description 1
- SYUHGPGVQRZVTB-UHFFFAOYSA-N radon atom Chemical compound [Rn] SYUHGPGVQRZVTB-UHFFFAOYSA-N 0.000 description 1
- 238000010223 real-time analysis Methods 0.000 description 1
- 238000011084 recovery Methods 0.000 description 1
- 238000000518 rheometry Methods 0.000 description 1
- 238000012216 screening Methods 0.000 description 1
- 230000035945 sensitivity Effects 0.000 description 1
- 238000010008 shearing Methods 0.000 description 1
- 238000004088 simulation Methods 0.000 description 1
- 239000007787 solid Substances 0.000 description 1
- 230000003595 spectral effect Effects 0.000 description 1
- 238000010561 standard procedure Methods 0.000 description 1
- 230000004936 stimulating effect Effects 0.000 description 1
- 238000012546 transfer Methods 0.000 description 1
- 239000011800 void material Substances 0.000 description 1
Images


Classifications
-
- E—FIXED CONSTRUCTIONS
- E21—EARTH DRILLING; MINING
- E21B—EARTH DRILLING, e.g. DEEP DRILLING; OBTAINING OIL, GAS, WATER, SOLUBLE OR MELTABLE MATERIALS OR A SLURRY OF MINERALS FROM WELLS
- E21B49/00—Testing the nature of borehole walls; Formation testing; Methods or apparatus for obtaining samples of soil or well fluids, specially adapted to earth drilling or wells
-
- E—FIXED CONSTRUCTIONS
- E21—EARTH DRILLING; MINING
- E21B—EARTH DRILLING, e.g. DEEP DRILLING; OBTAINING OIL, GAS, WATER, SOLUBLE OR MELTABLE MATERIALS OR A SLURRY OF MINERALS FROM WELLS
- E21B43/00—Methods or apparatus for obtaining oil, gas, water, soluble or meltable materials or a slurry of minerals from wells
- E21B43/25—Methods for stimulating production
- E21B43/26—Methods for stimulating production by forming crevices or fractures
-
- G—PHYSICS
- G01—MEASURING; TESTING
- G01V—GEOPHYSICS; GRAVITATIONAL MEASUREMENTS; DETECTING MASSES OR OBJECTS; TAGS
- G01V1/00—Seismology; Seismic or acoustic prospecting or detecting
- G01V1/40—Seismology; Seismic or acoustic prospecting or detecting specially adapted for well-logging
- G01V1/44—Seismology; Seismic or acoustic prospecting or detecting specially adapted for well-logging using generators and receivers in the same well
- G01V1/48—Processing data
- G01V1/50—Analysing data
Definitions
- This invention relates generally to fracturing subterranean formations and to fracture monitoring methods.
- fractures created in subterranean formations There are various uses for fractures created in subterranean formations.
- fractures may be formed in a hydrocarbon-bearing formation to facilitate recovery of oil or gas through a well communicating with the formation.
- Fractures can be formed by pumping a fracturing fluid into a well and against a selected surface of a formation intersected by the well. Pumping occurs such that a sufficient hydraulic pressure is applied against the formation to break or separate the earthen material to initiate a fracture in the formation.
- a fracture typically has a narrow opening that extends laterally from the well.
- the fracturing fluid typically carries a granular or particulate material, referred to as "sand" or “proppant,” into the opening of the fracture. This material remains in the fracture after the fracturing process is finished.
- the proppant in the fracture holds the separated earthen walls of the formation apart to keep the fracture open and provides flow paths through which hydrocarbons from the formation can flow at increased rates relative to flow rates through the unfractured formation.
- acids are used to create uneven surfaces so that the fracture does not completely close, thus still providing effective flow channels through the fracture.
- Such a fracturing process is intended to stimulate (that is, enhance) hydrocarbon production from the fractured formation. Unfortunately, this does not always happen because the fracturing process can damage rather than help the formation (for example, proppant can clog the fracture tip to produce a "screenout" condition).
- Stimulating wells that behave nicely allows service companies and operators to follow standard procedures commonly performed on such wells. No special attention needs to be placed upon specifics, such as how the fracture behaves; decisions and actions are based upon the experience the industry has acquired over many years.
- fracture behavior is an important aspect in fracturing technology.
- Many techniques are available for pre-stimulation simulations and post-stimulation analyses of fracture behavior; however, few techniques address fracture behavior during the stimulation process itself
- Various fracture behaviors such as fracture extension, ballooning, and tip screenout are often not known to the operator until after it is too late or even after the job is completed.
- the invention provides a fracture monitoring method, comprising: creating frequency spectrum data in response to a pressure in a well sensed over time during a fracturing process performed on the well; and determining from the frequency spectrum data at least one characteristic of a fracture formed by the fracturing process.
- a fracture monitoring method comprising: sensing pressure over time during a fracturing process performed on a well such that pressure data is obtained; making a frequency analysis of the pressure data, including making a waterfall plot of frequency data obtained in response to the pressure data; and using the waterfall plot to determine at least one characteristic of a fracture formed by the fracturing process.
- the invention also includes a computer-implemented fracture monitoring method, comprising: receiving in a computer pressure data obtained over time from a well undergoing a fracturing process; performing in the computer a transform on pressure data received in the computer to provide frequency data for selected times of the pressure data; and using the frequency data to determine whether a fracture created by the fracturing process is extending, including determining decreasing and increasing frequency sections within the frequency data.
- the invention further includes a fracturing method, comprising: pumping a fracturing fluid into a well such that a fracture in an adjacent formation forms and pressure signals are generated; sensing the pressure signals; determining frequencies at various times of the sensed pressure signals; creating a plot of the frequencies at the various times; and determining from the plot whether the fracture is extending into the formation.
- Certain changes occurring downhole during a fracturing process such as fracture extension, send different pressure frequency spectra and wave intensities to the surface.
- these signals can be processed to reveal information about one or more aspects of the downhole environment. That is, capturing and evaluating generated and reflected pressure waves during fracturing enables personnel to monitor, in real time or later, what happens downhole during fracturing.
- any time a fracture extends there is a sudden burst of acoustic noise embodied in a pressure wave or signal. Noise coming from other sources also contributes to this signal.
- a Fourier transform for example, one can monitor this acoustic noise.
- this is implemented with a waterfall plot of frequency spectra at successive time slices of the original signal.
- a ridge of decreasing frequencies indicates fracture extension and a ridge of increasing frequencies indicates either closure or sand/proppant backing up in the fracture.
- a fracture monitoring method in accordance with the present invention comprises: creating frequency spectrum data in response to a pressure in a well sensed over time during a fracturing process performed on the well; and determining from the frequency spectrum data at least one characteristic of a fracture formed by the fracturing process.
- This can include one or more of the following, for example: determining, in response to a declining frequency defined in the frequency spectrum data, that the fracture is being extended by the fracturing process; determining, in response to an increasing frequency defined in the frequency spectrum data, that the fracture is effectively not being extended by the fracturing process; and determining, in response to an increasing frequency defined in the frequency spectrum, that proppant is backing up in the fracture.
- creating frequency spectrum data includes applying a frequency transform to data of the sensed pressure.
- frequency transform include a Fourier Transform in general and a Short Time Fourier Transform in particular.
- Creating frequency spectrum data can also include filtering data of the sensed pressure.
- filtering includes wavelet filtering in one embodiment of the present invention.
- a fracture monitoring method of the present invention can also be defined as comprising: sensing pressure over time during a fracturing process performed on a well such that pressure data is obtained; making a frequency analysis of the pressure data, including making a waterfall plot of frequency data obtained in response to the pressure data; and using the waterfall plot to determine at least one characteristic of a fracture formed by the fracturing process.
- Using the waterfall plot in one embodiment of the present invention includes identifying one or both of (1) a declining ridge section for a selected frequency range over a period of time and (2) an increasing ridge section for the selected frequency range.
- the present invention can also be defined as a computer-implemented fracture monitoring method, comprising: receiving in a computer pressure data obtained over time from a well undergoing a fracturing process; performing in the computer a transform on pressure data received in the computer to provide frequency data for selected times of the pressure data; and using the frequency data to determine whether a fracture created by the fracturing process is extending, including determining decreasing and increasing frequency sections within the frequency data.
- a fracturing method of the present invention broadly comprises: pumping a fracturing fluid into a well such that a fracture in an adjacent formation forms and pressure signals are generated; sensing the pressure signals; determining frequencies at various times of the sensed pressure signals; creating a plot of the frequencies at the various times; and determining from the plot whether the fracture is extending into the formation. This can further comprise controlling further pumping of the fracturing fluid in response to determining whether the fracture is extending.
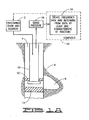
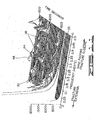
- FIG. 1A A fracturing process using a method of the present invention is represented in FIG. 1A.
- This includes pumping a fracturing fluid 2 into a well 4 such that a fracture 6 in an adjacent formation 8 forms and pressure signals are generated.
- the fracturing fluid 2 can be of any suitable type known in the art, and it is pumped into the well 4 in any suitable manner known in the art.
- FIG. 1A the placement of the fracturing fluid is shown as occurring through a tubing string 10 that extends into a region of the well 4 that is isolated in known manner by suitable known sealing devices 12, 14 (for example, packers).
- This isolated region enables the fracturing fluid 2 to be exerted against the desired portion of the formation 8 and thereby initiate and extend the fracture 6 (only one wing of which fracture is shown in that a fracture typically extends in two (typically opposite) directions from the wellbore).
- the present invention is not limited to any particular fracturing fluid or fracturing fluid placement technique; therefore, other fracturing fluid and delivery can be used.
- One non-limiting example is of the type represented in FIG. 1B; here, fracturing fluid is pumped through tubing string 10 outside an inner tubing string 10a (in the FIG. 1B application, tubing string 10a can be referred to as a "deadstring") disposed within the tubing string 10.
- adstring tubing string 10a
- pressure is sensed through the deadstring.
- hydrajet fracturing technology with which fractures can be placed in cased or open vertical, deviated or horizontal well sections without the use of sealing devices such as packers and bridge plugs. In this process, represented in FIG.
- a dual-flow system in which both outer tubing string 10 and inner tubing string 10a deliver fracturing fluid through a hydrajet tool, which can also function as a perforating tool (when the hole is cased or lined) and as a sealing device using the Bernoulli principle.
- the sealing provided is a dynamic sealing process achieved by fluid velocity. This velocity, which is created through the jetting tool, propels fluid at velocities greater than 650 feet/second. Therefore, according to Bernoulli, pressures around the jet are quite low.
- annular fluid may enter the high-velocity fluid stream into the fracture, or, because the sealing is not absolute, the jet fluid may leak off into the annulus.
- the fracturing method of the present invention further comprises sensing pressure signals that arise during the pumping of the fracturing fluid and resultant fracture creation.
- Sensing of pressure can occur using any suitable technique. For example, sensing can occur downhole with real-time data telemetry to the surface or delayed transfer (for example, by data storage downhole and retrieval of the downhole sensing device or by data storage downhole and later telemetry to the surface).
- Such downhole sensing can be in any suitable location typically selected dependent on the specific fracturing fluid placement technique used (for example, in the tubing string (see, for example, FIG. 1A); in the isolated region (see, for example, FIG.
- the fluid delivery system is typically the largest supplier of sound/pressure waves inside the wellbore. These pressure waves are delivered downhole by high-pressure fluids. In at least the hydrajet fracturing process, high-pressure fluid energy is transformed into high kinetic energy, and a high-frequency pressure wave is mixed into this accumulation of sound energy. In conventional fracturing technologies, these pressure/sound waves are transmitted through the treating string, but in the hydrajet fracturing approach, the annulus may serve as the better transmission conduit. In other jobs, downhole gauge readings may provide the better data to evaluate.
- the pressure signal is provided to the surface, typically in the form of an electrical signal, as indicated by reference numeral 16 in FIG. 1.
- the pressure to be sensed can change over time and that the pressure can include pressure components of various frequencies. Certain of these frequencies might be amplified by certain shape factors and dimensions of the well cavity and the fracture. For example, as the fracture 6 of the FIG. 1 illustrations grows, dominating frequencies within the composite pressure may change during the fracturing process. As a fracture develops, typically certain frequency components are amplified and the complex mixture of pressure/sound waves is transmitted back to the surface.
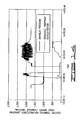
- the fracturing method being described with reference to the FIG. 1 illustrations also comprises, as indicated at reference numeral 18, determining frequencies at various times of the sensed pressure signals and determining from such data at least one characteristic of the fracture 6 formed by the fracturing process.
- a suitable computer 20 that provides an output signal to be used to control the overall fracturing process, such as controlling the pumping of the fracturing fluid or the formulating of the fracturing fluid, for example.
- An example of such a computer 20 includes types of conventional data acquisition systems used at well sites in the oil and gas industry as known in the art, but programmed (in software or firmware) using known programming techniques to implement the desired functions of the present invention as described herein.
- fracture behavior including positioning of sand or proppants
- the computer 20 receives pressure data obtained over time from the well undergoing the fracturing process (well 4 in the illustrations of FIG. 1). Receiving such pressure data is indicated in FIG. 2 by reference numeral 22. Using the present invention, such data is transformed to frequency data at selected sampling times related to the time aspect of the pressure data; this is indicated in FIG. 2 by the reference numeral 24. From the frequency data, frequency related changes over time are identified as indicated at reference numeral 26 in FIG. 2. In a particular implementation of the present invention, decreasing or increasing ("or" being inclusive as encompassing either or both) frequency sections are identified, which decreasing/increasing is used to determine one or more characteristics of the fracture as indicated by reference numeral 27 in FIG. 2.
- frequency spectrum data is created in response to pressure in the well sensed over time during the fracturing process performed on the well.
- transform methods are known in the mathematical and engineering world, such as Hilbert, Wigner and Radon Transforms, and of course Fourier Transforms.
- Fourier transform methods are popular in the engineering world and are particularly suitable in the present invention.
- this includes performing in the computer 20 (for the FIG. 1 example) a Short Time Fourier Transform (STFT) on the pressure data received in the computer; this provides frequency data for selected times of the pressure data.
- STFT Short Time Fourier Transform
- Wavelet technology can also be used, such as by being performed before doing the transform but in a manner to focus the later applied transform and analysis on a selected frequency range.
- the aforementioned increasing or decreasing sections are identified.
- This identification can be performed within the computer 20, for example, such as using suitable programming to compare respective frequency spectra over the selected time slices used during the transformation from pressure to frequency data.
- Another identification technique includes obtaining a graphical output, such as can be provided from suitably programmed computer 20, for example, that creates a plot of the frequencies of short bursts at the various times using the STFT approach. For example, Fourier transformation is performed on a set of data points from the pressure data at a time n to the pressure data at a time m (P n to P m ), the next one for P n+k to P m+k where k is greater than 1, etc. for the number of pressure "slices" desired.
- One specific type of plot is a waterfall plot, such as of a type described further below. Note that a waterfall plot helps the human mind capture the phenomenon; while computers may not need such methods to do its decision making steps.
- determining at least one characteristic of the fracture from the frequency data includes determining, in response to a declining frequency defined by the frequency spectrum data, that the fracture is being extended by the fracturing process. This can be obtained, for example, from a waterfall plot mentioned above if in such plot there is a section of declining frequency over a period of time.
- determining at least one characteristic of the fracture includes determining, in response to an increasing frequency defined by the frequency spectrum data, that the fracture is not being extended by the fracturing process.
- Such increasing frequency information has been specifically related both to a fracture closing and to proppant backing up in the fracture (such as in a tip screenout event). This can be obtained, for example, from a waterfall plot mentioned above if in such plot there is a section of increasing frequency over a period of time.
- suitable filtering can be used to focus on selected, significant frequency ranges, for example.
- Wavelet technology for example, can be used. Particularly suitable applications, but not limiting ones, include when pressure data is too complex, too noisy, or continually changing with time. Wavelets have been used in geological studies in which sound traveling through complex structures is evaluated differently from the present invention to determine the actual shape, construction, and composition of the formation. Pressure transients from a wellbore have also been evaluated differently from the present invention by using wavelet technology. In the present invention, it is contemplated that wavelets can allow closer investigation into a suspected data set or can validate a supposition created using the aforementioned Fourier analysis of the present invention, for example.
- Well A was a vertical well that was proppant stimulated through the annulus. This well was about 8,408 feet deep (measured depth/true vertical depth).
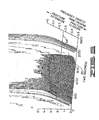
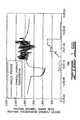
- FIG. 3 shows the waterfall plot of the Fourier transform charts obtained using pressure data for well A sensed through the annulus for an arrangement as in FIG. 1B.
- Each chart section of FIG. 3 was computed with a 16-second interval between each waterfall element. That is, each curve in the drawing represents one STFT chart of a time slot in time.
- the wellbore depth/length (natural) frequency component is shown as a straight dotted line 28 in FIG. 3.
- Fracture extension or growth (increased true cavity depth) on the plot of FIG. 3 (and subsequently illustrated waterfall plots) is defined as frequency reductions, while closure or proppant front progression to the wellbore (decreased true cavity depth) is defined by frequency increase.
- the solid line 30 in FIG. 3 follows these variations and indicates that fracture development occurs after the 500-second point. For example, line segment 30a read against the frequency scale indicates a decrease from above 0.226 Hz to about 0.12 Hz, so there is fracture extension during the corresponding time; and line segment 30b read against the frequency scale indicates an increase back to about 0.226 Hz, so there is fracture closure or proppant buildup during the corresponding time.
- the substantially unchanging frequency segment of line 30 between segments 30a and 30b indicates unchanging boundaries (for example, the fracture is not extending, or it is extending but sand is building up at the same velocity so that the boundary appears to be not extending). Additionally, a few minor closures or minor screenouts occur throughout the job.
- the pressure data used for FIG. 3 was the annulus pressure data.
- FIG. 4 is similar to FIG. 3 with the exception that the data is much cleaner.
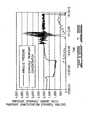
- Well B was a vertical well with depth of 6,952 feet and treated using the same manner and same installation as Well A. During this time, the recording equipment was placed in the dead string (tubing) while fracturing was done through the annulus. The stimulation treatment was performed so that a screenout would occur at the end of the job to improve fracture conductivity.
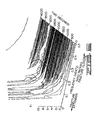
- the STFT stacked chart or waterfall plot obtained as part of the present invention is shown in FIG. 5.
- the natural frequency related to the wellbore depth and a sound speed of 3,800 feet/second as above can be computed as 0.273 Hz, as illustrated with the dotted line 34.
- the sound speed changes from fluid to fluid and also is very dependent upon pressure and compressibility.
- the extending of the fracture is clearly represented by this plot (see frequency front; as frequencies get lower), as is a massive screenout at the end of the job (frequency suddenly gets higher prior to the end of the job, significantly exceeding the 0.273 Hz line 34, as indicated by reference number 35).
- a relatively new fracturing technique known as hydrajet fracturing (for example, one such technique is provided by Halliburton Energy Services under the mark "Surgifrac"), employs two different flow streams, one through the tubing and the other through the annulus as represented in FIG. 1C.
- the inner tubing flow stream is pumped at tremendously high pressures and high flow rates (high horsepower) through jetting equipment; while the annulus flow stream between the inner and outer tubing strings is pumped at lower pressures and lower horsepower.
- Each of these fluid streams contributes to the noise in the system.
- Well C was slightly deviated and had a measured depth of about 10,300 feet. Lease crude was used as the primary treatment fluid.
- the input signal here, the pressure data
- the pressure data is decomposed into two sectors, which decomposition occurs in known manner to effectively filter using a selected wavelet function high/low pass filter.
- Each of these sectors are further decomposed into two sectors. After a few levels of such decompositions, sectors become sufficiently narrow or focused as to their frequency ranges; and for this application, a stacked plot using wavelets that were derived around the 0.2 Hz sector is shown in FIG. 7.
- the wellbore natural frequency is about 0.2.
- noise elements with frequencies around 0.2 are amplified while the others are impeded to essentially zero.
- frequencies away from the wellbore basic frequencies are eliminated or filtered by use of wavelet technology to improve clarity as fractures extend from the wellbore.
- Known wavelet filters include gaussian, mexican hat, morlets, daubechies, and many more forms well known in the art, and the present invention is not limited to any particular wavelet filter. Using this filtering the effects of the high level, lower frequencies, are drastically reduced; and frequencies of interest (such as the frequency front discussed earlier) are now represented by frequency peaks.
- FIG. 8 shows the plot region indicating that the fracture starts to close
- FIG. 9 shows the other side of this plot as screenout is in progress. The high peaks in these plots form an almost straight ridge on the left side of FIG. 8 and on the right side of FIG. 9, which is observed from the other side of FIG. 8.
- the other peak also forms a straight ridge; and this ridge is quite straight, centering and staying stationary at 0.2 (thus probably reflecting from the wellbore fracture entry correlated to our earlier mentioned wellbore function; note that this stationary behavior at 0.2 can be better seen from FIG. 9).
- the ridge formed by the high peaks moves slowly toward the lower frequency.
- an apparent ridge connects to the tall ridge on the left, which probably relates to the fracture extension. This is indicated by arrow 42a.
- the flow rate was reduced by 1.5 barrels per minute (BPM) and suddenly, the ridge stayed stationary if not slightly moving to a higher frequency.
- Well D was a horizontal well stimulated using hydrajet fracturing technology.
- the well's true vertical depth was approximately 6,500 feet with measured depth of about 8,704 feet.
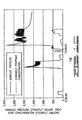
- a first fracturing treatment produced the annulus pressure and the downhole proppant concentration data as shown in FIG. 10.
- a stacked Fourier plot created later from this data of FIG. 10 for this stimulation stage is shown in FIG. 11.
- Solid line 44 identifies the fracture tip movement or the proppant front movement.
- Sharp peaks, such as at 48, identify tremendous white noise, which often indicates something major has occurred, such as initial fracture development.
- good fracture growth is shown to have been obtained; however, as a certain fracture length was achieved, leakoff became substantial and the fracture slowly stopped growing as indicated by the graph at reference numeral 50.
- the boost pressure was increased to stagnation pressure, which reopened the fracture (more white nose) as indicated at reference numeral 52 in the plot of FIG. 11.
- FIGS. 14 and 15 A third fracture of well D is shown in FIGS. 14 and 15, and a fourth stage of fracturing in well D is shown in FIGS. 16 and 17.
- the fracture fronts are indicated to grow as planned, as observed by the solid fracture front line 62 (FIG. 15) and 66 (FIG. 17). Note again in the present invention, that fractures are taken to grow if the front line moves to the low frequency side of the wellbore natural frequency line (dotted lines 60, 64 in FIGS. 15, 17, respectively)
- FIGS. 18 and 19 relate to a fifth fracturing in well D, with FIG. 18 representing recorded pressure and proppant concentration data at the time, and FIG. 19 showing a later developed waterfall plot using the earlier data.
- FIG. 18 indicates that something happened during this job because proppant concentrations suddenly jump to about 12.5 pounds per gallon (1b/gal).
- FIG. 19 shows that screenout occurred almost instantaneously after the sudden increase of proppant concentration downhole. This is evident by the curve 68 moving rapidly to the right (no evidence of staying within the left side of the dotted line) and also the tremendous noise activities 70 at high frequencies.
- a particular implementation of the present invention includes using a waterfall plot to identify at least one of a declining ridge section for a selected frequency range over a period of time and an increasing ridge section for the selected frequency range.
- using the waterfall plot includes identifying a section of declining frequency over a first period of time and a section of increasing frequency over a second period of time. This information indicates either fracture growth (declining ridge) or fracture growth stoppage such as, for example, closure or screenout (increasing ridge).
Abstract
Description
- This invention relates generally to fracturing subterranean formations and to fracture monitoring methods.
- There are various uses for fractures created in subterranean formations. In the oil and gas industry, for example, fractures may be formed in a hydrocarbon-bearing formation to facilitate recovery of oil or gas through a well communicating with the formation.
- Fractures can be formed by pumping a fracturing fluid into a well and against a selected surface of a formation intersected by the well. Pumping occurs such that a sufficient hydraulic pressure is applied against the formation to break or separate the earthen material to initiate a fracture in the formation.
- A fracture typically has a narrow opening that extends laterally from the well. To prevent such opening from closing too much when the fracturing fluid pressure is relieved, the fracturing fluid typically carries a granular or particulate material, referred to as "sand" or "proppant," into the opening of the fracture. This material remains in the fracture after the fracturing process is finished. Ideally, the proppant in the fracture holds the separated earthen walls of the formation apart to keep the fracture open and provides flow paths through which hydrocarbons from the formation can flow at increased rates relative to flow rates through the unfractured formation. In another application, acids are used to create uneven surfaces so that the fracture does not completely close, thus still providing effective flow channels through the fracture.
- Such a fracturing process is intended to stimulate (that is, enhance) hydrocarbon production from the fractured formation. Unfortunately, this does not always happen because the fracturing process can damage rather than help the formation (for example, proppant can clog the fracture tip to produce a "screenout" condition).
- Stimulating wells that behave nicely (for example, wells that are easily stimulated) allows service companies and operators to follow standard procedures commonly performed on such wells. No special attention needs to be placed upon specifics, such as how the fracture behaves; decisions and actions are based upon the experience the industry has acquired over many years.
- However, as the hydrocarbon supply decreases and demand for it increases, the hunt for hydrocarbons becomes more challenging. New technologies, such as fluid chemistry and rheology, or even new stimulation techniques enter the marketplace. These techniques claim to provide better fracture creation, better conductivities, permeability modifications, and more. As these technologies are used, new methods for evaluating the effectiveness of the treatments are needed.
- In at least these more challenging situations, fracture behavior is an important aspect in fracturing technology. Many techniques are available for pre-stimulation simulations and post-stimulation analyses of fracture behavior; however, few techniques address fracture behavior during the stimulation process itself Various fracture behaviors, such as fracture extension, ballooning, and tip screenout are often not known to the operator until after it is too late or even after the job is completed.
- We have now devised a real-time analysis or monitoring of fractures.
- In one aspect, the invention provides a fracture monitoring method, comprising: creating frequency spectrum data in response to a pressure in a well sensed over time during a fracturing process performed on the well; and determining from the frequency spectrum data at least one characteristic of a fracture formed by the fracturing process.
- In another aspect, there is provided a fracture monitoring method, comprising: sensing pressure over time during a fracturing process performed on a well such that pressure data is obtained; making a frequency analysis of the pressure data, including making a waterfall plot of frequency data obtained in response to the pressure data; and using the waterfall plot to determine at least one characteristic of a fracture formed by the fracturing process.
- The invention also includes a computer-implemented fracture monitoring method, comprising: receiving in a computer pressure data obtained over time from a well undergoing a fracturing process; performing in the computer a transform on pressure data received in the computer to provide frequency data for selected times of the pressure data; and using the frequency data to determine whether a fracture created by the fracturing process is extending, including determining decreasing and increasing frequency sections within the frequency data.
- The invention further includes a fracturing method, comprising: pumping a fracturing fluid into a well such that a fracture in an adjacent formation forms and pressure signals are generated; sensing the pressure signals; determining frequencies at various times of the sensed pressure signals; creating a plot of the frequencies at the various times; and determining from the plot whether the fracture is extending into the formation.
- Certain changes occurring downhole during a fracturing process, such as fracture extension, send different pressure frequency spectra and wave intensities to the surface. In accordance with the present invention, these signals can be processed to reveal information about one or more aspects of the downhole environment. That is, capturing and evaluating generated and reflected pressure waves during fracturing enables personnel to monitor, in real time or later, what happens downhole during fracturing.
- Any time a fracture extends, there is a sudden burst of acoustic noise embodied in a pressure wave or signal. Noise coming from other sources also contributes to this signal. By converting the time based pressure signal to a frequency base using a Fourier transform, for example, one can monitor this acoustic noise. In a particular implementation of the present invention, this is implemented with a waterfall plot of frequency spectra at successive time slices of the original signal. In such a waterfall plot, and in accordance with the present invention, a ridge of decreasing frequencies indicates fracture extension and a ridge of increasing frequencies indicates either closure or sand/proppant backing up in the fracture. By summing the area under the spectral plot, one can also get an indication of the energy drop as the fracture extends and sudden rise at a screen out.
- A fracture monitoring method in accordance with the present invention comprises: creating frequency spectrum data in response to a pressure in a well sensed over time during a fracturing process performed on the well; and determining from the frequency spectrum data at least one characteristic of a fracture formed by the fracturing process. This can include one or more of the following, for example: determining, in response to a declining frequency defined in the frequency spectrum data, that the fracture is being extended by the fracturing process; determining, in response to an increasing frequency defined in the frequency spectrum data, that the fracture is effectively not being extended by the fracturing process; and determining, in response to an increasing frequency defined in the frequency spectrum, that proppant is backing up in the fracture.
- In one embodiment, creating frequency spectrum data includes applying a frequency transform to data of the sensed pressure. Examples of frequency transform include a Fourier Transform in general and a Short Time Fourier Transform in particular.
- Creating frequency spectrum data can also include filtering data of the sensed pressure. Such filtering includes wavelet filtering in one embodiment of the present invention.
- A fracture monitoring method of the present invention can also be defined as comprising: sensing pressure over time during a fracturing process performed on a well such that pressure data is obtained; making a frequency analysis of the pressure data, including making a waterfall plot of frequency data obtained in response to the pressure data; and using the waterfall plot to determine at least one characteristic of a fracture formed by the fracturing process. Using the waterfall plot in one embodiment of the present invention includes identifying one or both of (1) a declining ridge section for a selected frequency range over a period of time and (2) an increasing ridge section for the selected frequency range.
- The present invention can also be defined as a computer-implemented fracture monitoring method, comprising: receiving in a computer pressure data obtained over time from a well undergoing a fracturing process; performing in the computer a transform on pressure data received in the computer to provide frequency data for selected times of the pressure data; and using the frequency data to determine whether a fracture created by the fracturing process is extending, including determining decreasing and increasing frequency sections within the frequency data.
- A fracturing method of the present invention broadly comprises: pumping a fracturing fluid into a well such that a fracture in an adjacent formation forms and pressure signals are generated; sensing the pressure signals; determining frequencies at various times of the sensed pressure signals; creating a plot of the frequencies at the various times; and determining from the plot whether the fracture is extending into the formation. This can further comprise controlling further pumping of the fracturing fluid in response to determining whether the fracture is extending.
- Other aspects consistent with the foregoing are included in further definitions of the present invention.
- In order that the invention may be more fully understood, reference will be made to the accompanying drawings of preferred embodiments, wherein:
- FIG. 1A represents one type of fracturing process using a method of the present invention.
- FIG. 1B represents another type of fracturing process using a method of the present invention.
- FIG. 1C represents still another type of fracturing process using a method of the present invention.
- FIG. 2 is a flow chart of procedures of the present invention.
- FIG. 3 shows an example of a waterfall plot for a well A in accordance with the present invention.
- FIG. 4 shows another example of a waterfall plot for well A in accordance with the present invention.
- FIG. 5 shows an example of a waterfall plot for a well B in accordance with the present invention.
- FIG. 6 shows an example of a waterfall plot for a well C in accordance with the present invention.
- FIG. 7 shows an example of a waterfall plot for well C in accordance with the present invention, including use of wavelet technology.
- FIG. 8 shows another example of a waterfall plot for well C in accordance with the present invention, including use of wavelet technology and focusing on part of the plot shown in FIG. 7.
- FIG. 9 shows a view from the other side of the plot of FIG. 8.
- FIG. 10 shows plots of annulus pressure and downhole proppant concentration data for a first fracture of a well D.
- FIG. 11 shows a waterfall plot created from the data of FIG. 10 in accordance with the present invention.
- FIG. 12 shows plots of annulus pressure and downhole proppant concentration data for a second fracture of well D.
- FIG. 13 shows a waterfall plot created from the data of FIG. 12 in accordance with the present invention.
- FIG. 14 shows plots of annulus pressure and downhole proppant concentration data for a third fracture of well D.
- FIG. 15 shows a waterfall plot created from the data of FIG. 14 in accordance with the present invention.
- FIG. 16 shows plots of annulus pressure and downhole proppant concentration data for a fourth fracture of well D.
- FIG. 17 shows a waterfall plot created from the data of FIG. 16 in accordance with the present invention.
- FIG. 18 shows plots of annulus pressure and downhole proppant concentration data for a fifth fracture of well D.
- FIG. 19 shows a waterfall plot created from the data of FIG. 18 in accordance with the present invention.
-
- A fracturing process using a method of the present invention is represented in FIG. 1A. This includes pumping a fracturing
fluid 2 into a well 4 such that afracture 6 in anadjacent formation 8 forms and pressure signals are generated. The fracturingfluid 2 can be of any suitable type known in the art, and it is pumped into thewell 4 in any suitable manner known in the art. In FIG. 1A, the placement of the fracturing fluid is shown as occurring through atubing string 10 that extends into a region of thewell 4 that is isolated in known manner by suitable known sealingdevices 12, 14 (for example, packers). This isolated region enables the fracturingfluid 2 to be exerted against the desired portion of theformation 8 and thereby initiate and extend the fracture 6 (only one wing of which fracture is shown in that a fracture typically extends in two (typically opposite) directions from the wellbore). - The present invention is not limited to any particular fracturing fluid or fracturing fluid placement technique; therefore, other fracturing fluid and delivery can be used. One non-limiting example is of the type represented in FIG. 1B; here, fracturing fluid is pumped through
tubing string 10 outside aninner tubing string 10a (in the FIG. 1B application,tubing string 10a can be referred to as a "deadstring") disposed within thetubing string 10. In the FIG. 1B representation, pressure is sensed through the deadstring. Another non-limiting example is hydrajet fracturing technology, with which fractures can be placed in cased or open vertical, deviated or horizontal well sections without the use of sealing devices such as packers and bridge plugs. In this process, represented in FIG. 1C, a dual-flow system is used in which bothouter tubing string 10 andinner tubing string 10a deliver fracturing fluid through a hydrajet tool, which can also function as a perforating tool (when the hole is cased or lined) and as a sealing device using the Bernoulli principle. The sealing provided is a dynamic sealing process achieved by fluid velocity. This velocity, which is created through the jetting tool, propels fluid at velocities greater than 650 feet/second. Therefore, according to Bernoulli, pressures around the jet are quite low. Depending on local conditions, annular fluid may enter the high-velocity fluid stream into the fracture, or, because the sealing is not absolute, the jet fluid may leak off into the annulus. - The fracturing method of the present invention, with whatever fracturing fluid and delivery that may be selected, further comprises sensing pressure signals that arise during the pumping of the fracturing fluid and resultant fracture creation. Sensing of pressure can occur using any suitable technique. For example, sensing can occur downhole with real-time data telemetry to the surface or delayed transfer (for example, by data storage downhole and retrieval of the downhole sensing device or by data storage downhole and later telemetry to the surface). Such downhole sensing can be in any suitable location typically selected dependent on the specific fracturing fluid placement technique used (for example, in the tubing string (see, for example, FIG. 1A); in the isolated region (see, for example, FIG. 1B); or in the annulus if it communicates with the pressure (see, for example, FIG. 1C). Alternatively or additionally, sensing can occur at the surface. Consider, for example, that the fluid delivery system is typically the largest supplier of sound/pressure waves inside the wellbore. These pressure waves are delivered downhole by high-pressure fluids. In at least the hydrajet fracturing process, high-pressure fluid energy is transformed into high kinetic energy, and a high-frequency pressure wave is mixed into this accumulation of sound energy. In conventional fracturing technologies, these pressure/sound waves are transmitted through the treating string, but in the hydrajet fracturing approach, the annulus may serve as the better transmission conduit. In other jobs, downhole gauge readings may provide the better data to evaluate. In general, however, any sensing technique and equipment suitable for detecting the desired pressure signal(s) with adequate sensitivity/resolution can be used. Whatever pressure sensing is used, the pressure signal is provided to the surface, typically in the form of an electrical signal, as indicated by
reference numeral 16 in FIG. 1. - It is known that the pressure to be sensed can change over time and that the pressure can include pressure components of various frequencies. Certain of these frequencies might be amplified by certain shape factors and dimensions of the well cavity and the fracture. For example, as the
fracture 6 of the FIG. 1 illustrations grows, dominating frequencies within the composite pressure may change during the fracturing process. As a fracture develops, typically certain frequency components are amplified and the complex mixture of pressure/sound waves is transmitted back to the surface. Thus, in accordance with the present invention, the fracturing method being described with reference to the FIG. 1 illustrations also comprises, as indicated atreference numeral 18, determining frequencies at various times of the sensed pressure signals and determining from such data at least one characteristic of thefracture 6 formed by the fracturing process. This can be performed, at least in part, using asuitable computer 20 that provides an output signal to be used to control the overall fracturing process, such as controlling the pumping of the fracturing fluid or the formulating of the fracturing fluid, for example. An example of such acomputer 20 includes types of conventional data acquisition systems used at well sites in the oil and gas industry as known in the art, but programmed (in software or firmware) using known programming techniques to implement the desired functions of the present invention as described herein. In accordance with the present invention, fracture behavior, including positioning of sand or proppants, can be used bysuch computer 20 to determine whether or not to increase flow rate or decrease proppant flow when the fracture is trying to close or screening out prematurely, or to decrease flow rate or increase proppant flow when screenout is desired. - In using the
computer 20, for example, in accordance with the present invention, thecomputer 20 receives pressure data obtained over time from the well undergoing the fracturing process (well 4 in the illustrations of FIG. 1). Receiving such pressure data is indicated in FIG. 2 byreference numeral 22. Using the present invention, such data is transformed to frequency data at selected sampling times related to the time aspect of the pressure data; this is indicated in FIG. 2 by thereference numeral 24. From the frequency data, frequency related changes over time are identified as indicated atreference numeral 26 in FIG. 2. In a particular implementation of the present invention, decreasing or increasing ("or" being inclusive as encompassing either or both) frequency sections are identified, which decreasing/increasing is used to determine one or more characteristics of the fracture as indicated byreference numeral 27 in FIG. 2. - In making a frequency analysis of the pressure data by transforming the pressure-time data into frequency data, frequency spectrum data is created in response to pressure in the well sensed over time during the fracturing process performed on the well. Many transform methods are known in the mathematical and engineering world, such as Hilbert, Wigner and Radon Transforms, and of course Fourier Transforms. Fourier transform methods are popular in the engineering world and are particularly suitable in the present invention. In a particular implementation, this includes performing in the computer 20 (for the FIG. 1 example) a Short Time Fourier Transform (STFT) on the pressure data received in the computer; this provides frequency data for selected times of the pressure data. Wavelet technology can also be used, such as by being performed before doing the transform but in a manner to focus the later applied transform and analysis on a selected frequency range.
- To use the frequency data in accordance with a particular implementation of the present invention, the aforementioned increasing or decreasing sections are identified. This identification can be performed within the
computer 20, for example, such as using suitable programming to compare respective frequency spectra over the selected time slices used during the transformation from pressure to frequency data. Another identification technique includes obtaining a graphical output, such as can be provided from suitably programmedcomputer 20, for example, that creates a plot of the frequencies of short bursts at the various times using the STFT approach. For example, Fourier transformation is performed on a set of data points from the pressure data at a time n to the pressure data at a time m (Pn to Pm), the next one for Pn+k to Pm+k where k is greater than 1, etc. for the number of pressure "slices" desired. One specific type of plot is a waterfall plot, such as of a type described further below. Note that a waterfall plot helps the human mind capture the phenomenon; while computers may not need such methods to do its decision making steps. - In a particular implementation of the present invention, determining at least one characteristic of the fracture from the frequency data includes determining, in response to a declining frequency defined by the frequency spectrum data, that the fracture is being extended by the fracturing process. This can be obtained, for example, from a waterfall plot mentioned above if in such plot there is a section of declining frequency over a period of time.
- Another characteristic that can be determined is related to an increasing frequency. That is, determining at least one characteristic of the fracture includes determining, in response to an increasing frequency defined by the frequency spectrum data, that the fracture is not being extended by the fracturing process. Such increasing frequency information has been specifically related both to a fracture closing and to proppant backing up in the fracture (such as in a tip screenout event). This can be obtained, for example, from a waterfall plot mentioned above if in such plot there is a section of increasing frequency over a period of time.
- The foregoing has considered the present invention in the context of a fracturing method. Following is more detailed information relevant to this, as well as to specifically the fracture monitoring method portion of the present invention.
- Some important aspects of a fracture stimulation process are the measured depth of the well and the fact that fractures increase the size of the contained cavity or control volume. Fracture closure decreases this volume. Additionally, the sand or proppant filling the fracture reduces the void space. However, the measured depth of the well remains the same during the stimulation process. Therefore, a natural frequency component related to the well depth is defined by the following equation:
- Data exhibiting frequencies lower than the one calculated in accordance with the above equation is taken as coming from inside the fracture because a frequency lower than the measured distance-related natural frequency indicates a larger distance than the measured depth of the well. On the other hand, frequencies higher than the natural frequency associated with the measured depth could be random noise or noise reflected from inside the fracture to the wellbore wall (that is, a distance shorter than the measured depth). Fracture growth or closure or packing of sand is a continuous process during which changing pressures occur downhole. The present invention obtains frequencies from such pressures using numerous transformed data sets, such as in a particular implementation using several Fourier charts created as a function of time. In accordance with the present invention, such stacked charts, or waterfall plots, quickly illustrate trends or movements in the fracture, allowing them to be identified quickly.
- To facilitate the transform analysis, suitable filtering can be used to focus on selected, significant frequency ranges, for example. Wavelet technology, for example, can be used. Particularly suitable applications, but not limiting ones, include when pressure data is too complex, too noisy, or continually changing with time. Wavelets have been used in geological studies in which sound traveling through complex structures is evaluated differently from the present invention to determine the actual shape, construction, and composition of the formation. Pressure transients from a wellbore have also been evaluated differently from the present invention by using wavelet technology. In the present invention, it is contemplated that wavelets can allow closer investigation into a suspected data set or can validate a supposition created using the aforementioned Fourier analysis of the present invention, for example.
- Well A was a vertical well that was proppant stimulated through the annulus. This well was about 8,408 feet deep (measured depth/true vertical depth).
- Using the speed of sound through diesel fluid at about 3,800 feet/second and the equation set forth above, the natural frequency at the wellbore is approximately 0.226 Hz (F = 3,800 / (2 x 8,408)). FIG. 3 shows the waterfall plot of the Fourier transform charts obtained using pressure data for well A sensed through the annulus for an arrangement as in FIG. 1B. Each chart section of FIG. 3 was computed with a 16-second interval between each waterfall element. That is, each curve in the drawing represents one STFT chart of a time slot in time. The wellbore depth/length (natural) frequency component is shown as a straight dotted
line 28 in FIG. 3. In this waterfall plot, locations are identified where a certain frequency amplitude exceeds a certain threshold; and the frequency movement or trend is then tracked as time progresses. Note that in the Fourier plot, amplitudes (or energy level) of lower frequency signals are greater than for higher frequencies. This is due to the fact that fluids in the wellbore tend to dampen or filter out high frequencies quickly. In the plot, we define points where frequency energy level begins to be noticeable as a "frequency front" or "wave front". With a short time interval, trends can be easily identified. In FIG. 3, these trends are represented by asolid line 30 that follows the frequency front. Identification of these trends may sometimes be difficult, and faster data-collection rates may be necessary. In many fracturing jobs, pressure data is obtained at one data set per second. Considering the natural frequency equation given above and sampling rate, frequency detection limitations, even faster sampling may be needed in shallow wells (such as wells less than 3,800 feet deep for a speed of sound in fluid factor of 3,800 feet/second). - Fracture extension or growth (increased true cavity depth) on the plot of FIG. 3 (and subsequently illustrated waterfall plots) is defined as frequency reductions, while closure or proppant front progression to the wellbore (decreased true cavity depth) is defined by frequency increase. The
solid line 30 in FIG. 3 follows these variations and indicates that fracture development occurs after the 500-second point. For example,line segment 30a read against the frequency scale indicates a decrease from above 0.226 Hz to about 0.12 Hz, so there is fracture extension during the corresponding time; andline segment 30b read against the frequency scale indicates an increase back to about 0.226 Hz, so there is fracture closure or proppant buildup during the corresponding time. The substantially unchanging frequency segment ofline 30 betweensegments - Well A also had open production tubing (as at
tubing string 10a in FIG. 1B) through which bottomhole data was recorded. Because the fluid column did not change, downhole pressure could be recorded accurately. Obtaining the Fourier transform plots (every 16 seconds) on this data set results in the plot shown in FIG. 4. The resulting plot is much cleaner and noise effects are minimized as pressure pulses from the pumps, for example, have to travel a long distance from surface to downhole. The frequency trend is presented as asolid line 32 in this chart. The generation of the microfracture at the beginning of the job is also quite apparent in FIG. 4. Note that FIG. 4 is similar to FIG. 3 with the exception that the data is much cleaner. As each wave front depends largely upon the identifiable threshold, the Fourier wave front represented bylines - Well B was a vertical well with depth of 6,952 feet and treated using the same manner and same installation as Well A. During this time, the recording equipment was placed in the dead string (tubing) while fracturing was done through the annulus. The stimulation treatment was performed so that a screenout would occur at the end of the job to improve fracture conductivity.
- The STFT stacked chart or waterfall plot obtained as part of the present invention is shown in FIG. 5. The natural frequency related to the wellbore depth and a sound speed of 3,800 feet/second as above can be computed as 0.273 Hz, as illustrated with the dotted
line 34. Note that the sound speed changes from fluid to fluid and also is very dependent upon pressure and compressibility. Additionally, the extending of the fracture is clearly represented by this plot (see frequency front; as frequencies get lower), as is a massive screenout at the end of the job (frequency suddenly gets higher prior to the end of the job, significantly exceeding the 0.273 Hzline 34, as indicated by reference number 35). - As seen in FIGS. 3 through 5, the plots are quite straightforward in conventional fracturing technologies. With "conventional fracturing" it assumes that, as in FIGS. 1A and 1B, a single stream of fluid is pumped in a tubing (typically the production tubing, for example) which is open ended within the wellbore or pumped straight into the wellbore when the tubing does not exist or if no packer assemblies are installed at the end of the production tubing. An "unconventional" or "new" fracturing technique is discussed in the next paragraph. Although the plots are still qualitative in nature, they are relatively clean from other noises. In another example discussed below, jetting energy contributes a tremendous amount of noise, thus making evaluation more difficult.
- A relatively new fracturing technique, known as hydrajet fracturing (for example, one such technique is provided by Halliburton Energy Services under the mark "Surgifrac"), employs two different flow streams, one through the tubing and the other through the annulus as represented in FIG. 1C. The inner tubing flow stream is pumped at tremendously high pressures and high flow rates (high horsepower) through jetting equipment; while the annulus flow stream between the inner and outer tubing strings is pumped at lower pressures and lower horsepower. Each of these fluid streams contributes to the noise in the system. As there is a high pressure differential across the hydrajet tool jet nozzles, fluid is accelerated to a very high velocity (up to 600-700 feet/second) which causes tremendous shearing action between the jet and the wellbore fluid; this creates tremendously high levels of noise in the system. In addition to this, the jet impacting on the wellbore walls substantially increases the noise levels, which can mask other noise components which may be needed to analyze using the present invention. Unlike conventional techniques, this new technique also generates multiple fractures at many locations in the well, and each of these fractures contributes some noise components which may affect analytical capabilities. Following are two examples of the present invention as later applied to data from two hydrajet fracture jobs.
- Well C was slightly deviated and had a measured depth of about 10,300 feet. Lease crude was used as the primary treatment fluid.
- Using a speed of sound of approximately 4,000 feet/second, a wellbore natural frequency of about 0.2 Hz is obtained. The fracture development can be observed in the Fourier transform chart in FIG. 6, which was created based on the previously obtained pressure data for Well C.
- As busy as FIG. 6 is, confirming what actually happened may be done as shown by the line representing the frequency or wave front as done earlier. However, throughout the plot, there are occasionally high level bursts of noise which seems like white noise (having all frequencies present). To investigate further, wavelets are used. Using wavelet technology, the input signal (here, the pressure data) is decomposed into two sectors, which decomposition occurs in known manner to effectively filter using a selected wavelet function high/low pass filter. Each of these sectors are further decomposed into two sectors. After a few levels of such decompositions, sectors become sufficiently narrow or focused as to their frequency ranges; and for this application, a stacked plot using wavelets that were derived around the 0.2 Hz sector is shown in FIG. 7. Note that, as discussed earlier, the wellbore natural frequency is about 0.2. By selecting the area around 0.2, noise elements with frequencies around 0.2 are amplified while the others are impeded to essentially zero. Essentially, frequencies away from the wellbore basic frequencies are eliminated or filtered by use of wavelet technology to improve clarity as fractures extend from the wellbore. Known wavelet filters include gaussian, mexican hat, morlets, daubechies, and many more forms well known in the art, and the present invention is not limited to any particular wavelet filter. Using this filtering the effects of the high level, lower frequencies, are drastically reduced; and frequencies of interest (such as the frequency front discussed earlier) are now represented by frequency peaks. From the frequency peaks, we can identify slow movements of these peaks in the stacked plots and these moving peaks can be seen as ridges. Using these ridges can give better quantitative definition to the selected results (quantitatively as to relationship to frequency in the plot and possibly as to quantitative analysis or information that can be derived therefrom). In FIG. 7, the tremendous amount of "stray" noise coming from turbulence, etc., causes a flurry of peaks which makes the selection of the "real" ridge difficult. However, concentrating on ridges that originate from the 0.2 area (which is the wellbore surface) the fracture development is clearly demonstrated by
arrow 36, until the perturbation by an experiment that had been performed on the well (two successive reductions of annular flow rate by 1.5 barrels/minute each).Arrow 36 marks a declining ridge of the waterfall plot, thereby indicating fracture growth;arrow 38 marks an increasing ridge, thereby indicating screenout due to the experiment; andarrow 40 indicates a subsequent fracture growth period, when annular flow rate had been restored. - An interesting phenomenon exists during the "flow perturbation" experiment. To show this more clearly, a stacked wavelet plot was created and focused around the time the flow perturbations were made (that is, a portion of the plot of slices shown in FIG. 7 was focused on). Again, frequencies away from the wellbore basic frequencies are eliminated or filtered. This plot is shown in FIGS. 8 and 9 (which have their own time references, thus marked differently than in FIG. 7). FIG. 8 shows the plot region indicating that the fracture starts to close, while FIG. 9 shows the other side of this plot as screenout is in progress. The high peaks in these plots form an almost straight ridge on the left side of FIG. 8 and on the right side of FIG. 9, which is observed from the other side of FIG. 8. The other peak also forms a straight ridge; and this ridge is quite straight, centering and staying stationary at 0.2 (thus probably reflecting from the wellbore fracture entry correlated to our earlier mentioned wellbore function; note that this stationary behavior at 0.2 can be better seen from FIG. 9). The ridge formed by the high peaks moves slowly toward the lower frequency. In FIG. 8, an apparent ridge connects to the tall ridge on the left, which probably relates to the fracture extension. This is indicated by arrow 42a. At the time corresponding with the end of the arrow 42a, the flow rate was reduced by 1.5 barrels per minute (BPM) and suddenly, the ridge stayed stationary if not slightly moving to a higher frequency. It can be theorized that the fracture is extending a little, but counteracted by sand packing (front distance remains the same). When the flow is again reduced by 1.5 BPM, the frequency peak suddenly increases rapidly, even exceeding the 0.2 frequency. This indicates sudden closure of the fracture combined with sand screenout rapidly moving in the direction of the wellbore, and some of the sand, after a few seconds, starts to "populate" the wellbore. This is indicated by
arrow 42b in FIGS. 8 and 9. The flow rate was again increased, and immediately the ridge moved back to below the 0.2 mark (seearrow 42c in FIG. 9). One aspect of these two plots of FIGS. 8 and 9 is that the wellbore frequency and the fracture-tip frequency have high peaks and their values are fixed during the stoppage. As soon as sand buildup becomes significant, the frequency is replaced by a weaker front, which may indicate that the sand pack is not yet consolidated. - Well D was a horizontal well stimulated using hydrajet fracturing technology. The well's true vertical depth was approximately 6,500 feet with measured depth of about 8,704 feet.
- A first fracturing treatment produced the annulus pressure and the downhole proppant concentration data as shown in FIG. 10. A stacked Fourier plot created later from this data of FIG. 10 for this stimulation stage is shown in FIG. 11.
Solid line 44 identifies the fracture tip movement or the proppant front movement. Sharp peaks, such as at 48, identify tremendous white noise, which often indicates something major has occurred, such as initial fracture development. In the beginning, good fracture growth is shown to have been obtained; however, as a certain fracture length was achieved, leakoff became substantial and the fracture slowly stopped growing as indicated by the graph atreference numeral 50. The boost pressure was increased to stagnation pressure, which reopened the fracture (more white nose) as indicated atreference numeral 52 in the plot of FIG. 11. In general, a good, but not large, fracture trend occurred, shown byarrow 46 in FIG. 11. - After the first fracture was completed, the coiled tubing moved the jetting tool to a second fracture location. The annulus pressure and downhole proppant concentrations for this second fracturing are plotted in FIG. 12. In this stage, no distinct difficulties are observable in the fracture development, as indicated by the left movement of
solid line 54 in FIG. 13, which figure shows a waterfall plot later developed from the data of FIG. 12. Toward the end of the stage, there seems to be a confusing situation -- one curve shows more extension (see reference numeral 56), but thepeaks 58 on the right side of the figure could also be interpreted as the continuation of the curve. In this case, a late minor screenout may have occurred at the end of the stage. - A third fracture of well D is shown in FIGS. 14 and 15, and a fourth stage of fracturing in well D is shown in FIGS. 16 and 17. In FIGS. 15 and 17, the fracture fronts are indicated to grow as planned, as observed by the solid fracture front line 62 (FIG. 15) and 66 (FIG. 17). Note again in the present invention, that fractures are taken to grow if the front line moves to the low frequency side of the wellbore natural frequency line (dotted
lines - FIGS. 18 and 19 relate to a fifth fracturing in well D, with FIG. 18 representing recorded pressure and proppant concentration data at the time, and FIG. 19 showing a later developed waterfall plot using the earlier data. FIG. 18 indicates that something happened during this job because proppant concentrations suddenly jump to about 12.5 pounds per gallon (1b/gal). FIG. 19 shows that screenout occurred almost instantaneously after the sudden increase of proppant concentration downhole. This is evident by the
curve 68 moving rapidly to the right (no evidence of staying within the left side of the dotted line) and also thetremendous noise activities 70 at high frequencies. - From the foregoing, a particular implementation of the present invention includes using a waterfall plot to identify at least one of a declining ridge section for a selected frequency range over a period of time and an increasing ridge section for the selected frequency range. In at least some applications, using the waterfall plot includes identifying a section of declining frequency over a first period of time and a section of increasing frequency over a second period of time. This information indicates either fracture growth (declining ridge) or fracture growth stoppage such as, for example, closure or screenout (increasing ridge).
- Thus, the present invention is well adapted to carry out the objects and attain the ends and advantages mentioned above as well as those inherent therein. While preferred embodiments of the invention have been described for the purpose of this disclosure, changes in the construction and arrangement of parts and the performance of steps can be made by those skilled in the art.
Claims (34)
- A fracture monitoring method, comprising: creating frequency spectrum data in response to a pressure in a well sensed over time during a fracturing process performed on the well; and determining from the frequency spectrum data at least one characteristic of a fracture formed by the fracturing process.
- A fracture monitoring method as defined in claim 1, wherein determining at least one characteristic includes determining, in response to a declining frequency defined in the frequency spectrum data, that the fracture is being extended by the fracturing process.
- A fracture monitoring method as defined in claim 2, wherein determining at least one characteristic further includes determining, in response to an increasing frequency defined in the frequency spectrum data, that the fracture is closing or that proppant is backing up in the fracture.
- A fracture monitoring method as defined in claim 1, wherein determining at least one characteristic includes determining, in response to an increasing frequency defined in the frequency spectrum data, that the fracture is effectively not being extended by the fracturing process.
- A fracture monitoring method as defined in claim 1, wherein determining at least one characteristic includes determining, in response to an increasing frequency defined in the frequency spectrum, that proppant is backing up in the fracture.
- A fracture monitoring method as defined in claim 1, wherein creating frequency spectrum data includes applying a frequency transform to data of the sensed pressure.
- A fracture monitoring method as defined in claim 1, wherein creating frequency spectrum data includes filtering data of the sensed pressure.
- A fracture monitoring method as defined in claim 7, wherein creating frequency spectrum data further includes applying a frequency transform to the filtered data of the sensed pressure.
- A fracture monitoring method as defined in claim 7, wherein filtering includes wavelet filtering.
- A fracture monitoring method as defined in claim 9, wherein creating frequency spectrum data further includes applying a frequency transform to the wavelet filtered data of the sensed pressure.
- A fracture monitoring method as defined in claim 6, 8 or 10, wherein the frequency transform is a Fourier Transform, preferably a Short Time Fourier Transform.
- A fracture monitoring method, comprising: sensing pressure over time during a fracturing process performed on a well such that pressure data is obtained; making a frequency analysis of the pressure data, including making a waterfall plot of frequency data obtained in response to the pressure data; and using the waterfall plot to determine at least one characteristic of a fracture formed by the fracturing process.
- A fracture monitoring method as defined in claim 12, wherein using the waterfall plot includes identifying at least one of a declining ridge section for a selected frequency range over a period of time and an increasing ridge section for the selected frequency range, or identifying a section of declining frequency within a selected frequency range over a first period of time and a section of increasing frequency within the selected frequency range over a second period of time.
- A fracture monitoring method as defined in claim 12, wherein using the waterfall plot includes determining a section of declining frequency for a frequency range over a period of time, or determining a section of increasing frequency for a frequency range over a period of time.
- A fracture monitoring method as defined in claim 12, which further comprises filtering the pressure data; and making a frequency analysis on the filtered pressure data.
- A fracture monitoring method as defined in claim 12, wherein making a frequency analysis further includes applying a frequency transform to the filtered pressure data to provide transform data for use in making the waterfall plot.
- A fracture monitoring method as defined in claim 15, wherein filtering includes wavelet filtering.
- A fracture monitoring method as defined in claim 17, wherein making a frequency analysis further includes applying a frequency transform to the wavelet filtered pressure data to provide transform data for use in making the waterfall plot.
- A fracture monitoring method as defined in claim 12, wherein making a frequency analysis further includes applying a frequency transform to the pressure data to provide transform data for use in making the waterfall plot.
- A fracture monitoring method as defined in claim 16, 18 or 19, wherein the frequency transform is a Fourier Transform, preferably a Short Time Fourier Transform.
- A computer-implemented fracture monitoring method, comprising: receiving in a computer pressure data obtained over time from a well undergoing a fracturing process; performing in the computer a transform on pressure data received in the computer to provide frequency data for selected times of the pressure data; and using the frequency data to determine whether a fracture created by the fracturing process is extending, including determining decreasing and increasing frequency sections within the frequency data.
- A computer-implemented fracture monitoring method as defined in claim 21, wherein using the frequency data further includes creating a waterfall plot of the frequency data over the selected times.
- A computer-implemented fracture monitoring method as defined in claim 21, wherein: the method further comprises filtering the pressure data in the computer; and performing a transform is performed on the filtered pressure data.
- A computer-implemented fracture monitoring method as defined in claim 23, wherein filtering includes wavelet filtering.
- A computer-implemented fracture monitoring method as defined in claim 21, 23 or 24, wherein the transform is a Fourier Transform, preferably a Short Time Fourier Transform.
- A fracturing method, comprising: pumping a fracturing fluid into a well such that a fracture in an adjacent formation forms and pressure signals are generated; sensing the pressure signals; determining frequencies at various times of the sensed pressure signals; creating a plot of the frequencies at the various times; and determining from the plot whether the fracture is extending into the formation.
- A fracturing method as defined in claim 26, wherein determining whether the fracture is extending includes identifying frequency range sections of increasing frequency and frequency range sections of decreasing frequency.
- A fracturing method as defined in claim 26, further comprising controlling further pumping of the fracturing fluid in response to determining whether the fracture is extending.
- A fracturing method as defined in claim 28, wherein: the method further comprises filtering the sensed pressure signals to provide filtered pressure data signals; and determining frequencies is performed on the filtered pressure data signals.
- A fracturing method as defined in claim 29, wherein determining frequencies includes applying a frequency transform to the filtered pressure data signals.
- A fracturing method as defined in claim 29, wherein filtering includes wavelet filtering.
- A fracturing method as defined in claim 31, wherein determining frequencies includes applying a frequency transform to the wavelet filtered pressure data signals.
- A fracturing method as defined in claim 26, wherein determining frequencies includes applying a frequency transform to the sensed pressure signals.
- A fracturing method as defined in claim 30, 32 or 33, wherein the frequency transform is a Fourier Transform, preferably a Short Time Fourier Transform.
Applications Claiming Priority (2)
| Application Number | Priority Date | Filing Date | Title |
|---|---|---|---|
| US251301 | 2002-09-20 | ||
| US10/251,301 US7100688B2 (en) | 2002-09-20 | 2002-09-20 | Fracture monitoring using pressure-frequency analysis |
Publications (3)
| Publication Number | Publication Date |
|---|---|
| EP1400818A2 true EP1400818A2 (en) | 2004-03-24 |
| EP1400818A3 EP1400818A3 (en) | 2004-12-01 |
| EP1400818B1 EP1400818B1 (en) | 2013-03-06 |
Family
ID=29250295
Family Applications (1)
| Application Number | Title | Priority Date | Filing Date |
|---|---|---|---|
| EP03255785A Expired - Lifetime EP1400818B1 (en) | 2002-09-20 | 2003-09-16 | Fracture monitoring using pressure-frequency analysis |
Country Status (8)
| Country | Link |
|---|---|
| US (1) | US7100688B2 (en) |
| EP (1) | EP1400818B1 (en) |
| AR (1) | AR041085A1 (en) |
| AU (1) | AU2003248434B2 (en) |
| BR (1) | BR0303292A (en) |
| CA (1) | CA2440247C (en) |
| MX (1) | MXPA03008530A (en) |
| NO (1) | NO334626B1 (en) |
Cited By (12)
| Publication number | Priority date | Publication date | Assignee | Title |
|---|---|---|---|---|
| WO2005103766A2 (en) * | 2004-04-23 | 2005-11-03 | Schlumberger Canada Limited | Method and system for monitoring of fluid-filled domains in a medium based on interface waves propagating along their surfaces |
| KR100707389B1 (en) * | 2004-09-06 | 2007-04-13 | 한국건설기술연구원 | Apparatus and method for evaluating integrity of concrete structure using sound wave analysis |
| US7302849B2 (en) | 2004-04-23 | 2007-12-04 | Schlumberger Technology Corporation | Method and system for monitoring of fluid-filled domains in a medium based on interface waves propagating along their surfaces |
| US7754659B2 (en) | 2007-05-15 | 2010-07-13 | Georgia-Pacific Chemicals Llc | Reducing flow-back in well treating materials |
| US8003214B2 (en) | 2006-07-12 | 2011-08-23 | Georgia-Pacific Chemicals Llc | Well treating materials comprising coated proppants, and methods |
| WO2010136764A3 (en) * | 2009-05-27 | 2011-09-29 | Qinetiq Limited | Fracture monitoring |
| US8058213B2 (en) | 2007-05-11 | 2011-11-15 | Georgia-Pacific Chemicals Llc | Increasing buoyancy of well treating materials |
| WO2011145985A1 (en) * | 2010-05-21 | 2011-11-24 | Schlumberger Canada Limited | A method of real time diagnostic of fracture operations with combination of tube waves and microseismic monitoring. |
| US8133587B2 (en) | 2006-07-12 | 2012-03-13 | Georgia-Pacific Chemicals Llc | Proppant materials comprising a coating of thermoplastic material, and methods of making and using |
| WO2016162799A1 (en) * | 2015-04-07 | 2016-10-13 | Eni S.P.A. | Method and system for the multimodal and multiscale analysis of geophysical data by transformation into musical attributes |
| US11313211B2 (en) | 2017-11-13 | 2022-04-26 | Shear Frac Group, Llc | Hydraulic fracturing |
| US11365618B2 (en) | 2020-02-28 | 2022-06-21 | Shear Frac Group, Llc | Hydraulic fracturing |
Families Citing this family (51)
| Publication number | Priority date | Publication date | Assignee | Title |
|---|---|---|---|---|
| US6978211B2 (en) * | 2003-12-08 | 2005-12-20 | Halliburton Energy Services, Inc. | Methods and systems for using wavelet analysis in subterranean applications |
| US7825073B2 (en) * | 2004-07-13 | 2010-11-02 | Halliburton Energy Services, Inc. | Treatment fluids comprising clarified xanthan and associated methods |
| US7237612B2 (en) * | 2004-11-17 | 2007-07-03 | Halliburton Energy Services, Inc. | Methods of initiating a fracture tip screenout |
| US9915131B2 (en) * | 2007-03-02 | 2018-03-13 | Schlumberger Technology Corporation | Methods using fluid stream for selective stimulation of reservoir layers |
| US20090120633A1 (en) * | 2007-11-13 | 2009-05-14 | Earl Webb | Method for Stimulating a Well Using Fluid Pressure Waves |
| GB2467695B (en) * | 2007-12-05 | 2012-12-19 | Schlumberger Holdings | Method and apparatus for off-rig processing rig sensor data |
| US7963325B2 (en) * | 2007-12-05 | 2011-06-21 | Schlumberger Technology Corporation | Method and system for fracturing subsurface formations during the drilling thereof |
| US8714244B2 (en) * | 2007-12-18 | 2014-05-06 | Schlumberger Technology Corporation | Stimulation through fracturing while drilling |
| US7819188B2 (en) * | 2007-12-21 | 2010-10-26 | Schlumberger Technology Corporation | Monitoring, controlling and enhancing processes while stimulating a fluid-filled borehole |
| EP2307666A2 (en) * | 2008-05-20 | 2011-04-13 | Oxane Materials, Inc. | Method of manufacture and the use of a functional proppant for determination of subterranean fracture geometries |
| US8069923B2 (en) * | 2008-08-12 | 2011-12-06 | Halliburton Energy Services Inc. | Top suction fluid end |
| US8439116B2 (en) | 2009-07-24 | 2013-05-14 | Halliburton Energy Services, Inc. | Method for inducing fracture complexity in hydraulically fractured horizontal well completions |
| US8960292B2 (en) * | 2008-08-22 | 2015-02-24 | Halliburton Energy Services, Inc. | High rate stimulation method for deep, large bore completions |
| US9796918B2 (en) | 2013-01-30 | 2017-10-24 | Halliburton Energy Services, Inc. | Wellbore servicing fluids and methods of making and using same |
| US9016376B2 (en) | 2012-08-06 | 2015-04-28 | Halliburton Energy Services, Inc. | Method and wellbore servicing apparatus for production completion of an oil and gas well |
| US8631872B2 (en) * | 2009-09-24 | 2014-01-21 | Halliburton Energy Services, Inc. | Complex fracturing using a straddle packer in a horizontal wellbore |
| US8887803B2 (en) | 2012-04-09 | 2014-11-18 | Halliburton Energy Services, Inc. | Multi-interval wellbore treatment method |
| US8146416B2 (en) * | 2009-02-13 | 2012-04-03 | Schlumberger Technology Corporation | Methods and apparatus to perform stress testing of geological formations |
| US20110061869A1 (en) * | 2009-09-14 | 2011-03-17 | Halliburton Energy Services, Inc. | Formation of Fractures Within Horizontal Well |
| US8453764B2 (en) | 2010-02-01 | 2013-06-04 | Aps Technology, Inc. | System and method for monitoring and controlling underground drilling |
| US8606521B2 (en) | 2010-02-17 | 2013-12-10 | Halliburton Energy Services, Inc. | Determining fluid pressure |
| US9678236B2 (en) | 2010-04-27 | 2017-06-13 | Halliburton Energy Services, Inc. | Fracture characterization by interferometric drillbit imaging, time reversal imaging of fractures using drill bit seismics, and monitoring of fracture generation via time reversed acoustics and electroseismics |
| US9227204B2 (en) | 2011-06-01 | 2016-01-05 | Halliburton Energy Services, Inc. | Hydrajetting nozzle and method |
| US20120305679A1 (en) * | 2011-06-01 | 2012-12-06 | Halliburton Energy Services, Inc. | Hydrajetting nozzle and method |
| US9677337B2 (en) | 2011-10-06 | 2017-06-13 | Schlumberger Technology Corporation | Testing while fracturing while drilling |
| US9695654B2 (en) | 2012-12-03 | 2017-07-04 | Halliburton Energy Services, Inc. | Wellhead flowback control system and method |
| US9127526B2 (en) | 2012-12-03 | 2015-09-08 | Halliburton Energy Services, Inc. | Fast pressure protection system and method |
| EP2929135B1 (en) * | 2013-02-21 | 2020-04-15 | Halliburton Energy Services Inc. | Systems and methods for optimized well creation in a shale formation |
| USD843381S1 (en) | 2013-07-15 | 2019-03-19 | Aps Technology, Inc. | Display screen or portion thereof with a graphical user interface for analyzing and presenting drilling data |
| US10472944B2 (en) | 2013-09-25 | 2019-11-12 | Aps Technology, Inc. | Drilling system and associated system and method for monitoring, controlling, and predicting vibration in an underground drilling operation |
| US10385686B2 (en) | 2014-10-28 | 2019-08-20 | Eog Resources, Inc. | Completions index analysis |
| US10385670B2 (en) | 2014-10-28 | 2019-08-20 | Eog Resources, Inc. | Completions index analysis |
| CN104950074B (en) * | 2015-05-21 | 2016-09-14 | 中国科学院力学研究所 | Decomposition of hydrate seepage flow causes the shake out experimental technique measured and experimental provision |
| US10590758B2 (en) | 2015-11-12 | 2020-03-17 | Schlumberger Technology Corporation | Noise reduction for tubewave measurements |
| WO2017223007A1 (en) * | 2016-06-20 | 2017-12-28 | Schlumberger Technology Corporation | Tube wave analysis of well communication |
| CN109564296B (en) | 2016-07-01 | 2021-03-05 | 斯伦贝谢技术有限公司 | Method and system for detecting objects in a well reflecting hydraulic signals |
| WO2018034802A1 (en) * | 2016-08-17 | 2018-02-22 | Well-Smart Technologies Global, Inc. | Power wave optimization for oil and gas extracting processes |
| WO2018111231A1 (en) | 2016-12-13 | 2018-06-21 | Halliburton Energy Services, Inc. | Enhancing subterranean formation stimulation and production using target downhole wave shapes |
| US11261721B2 (en) * | 2016-12-30 | 2022-03-01 | Halliburton Energy Services, Inc. | Techniques for evaluating borehole subsurface geologies using Stoneley waves |
| US11506021B2 (en) * | 2017-06-15 | 2022-11-22 | Schlumberger Technology Corporation | Dynamic field operations system |
| CN107368629B (en) * | 2017-06-22 | 2021-06-01 | 北京理工大学 | Method for identifying fluid-solid coupling vibration parameters of pressure reducing valve |
| US11415716B2 (en) | 2017-11-01 | 2022-08-16 | Colorado School Of Mines | System and method of locating downhole objects in a wellbore |
| CA3075993C (en) | 2017-12-12 | 2022-05-10 | Halliburton Energy Services, Inc. | Overpressure mitigation systems for hydraulic fracturing |
| CN110761778B (en) * | 2018-07-25 | 2022-09-23 | 中国石油化工股份有限公司 | Fracturing fracture monitoring method and system based on sound waves |
| US11162344B2 (en) * | 2019-07-01 | 2021-11-02 | Saudi Arabian Oil Company | Acid fracturing treatments in hydrocarbon-bearing formations in close proximity to wet zones |
| WO2021020986A1 (en) * | 2019-07-31 | 2021-02-04 | Schlumberger Canada Limited | A method of determining depths of wellbore reflectors |
| CN111175128B (en) * | 2020-01-13 | 2022-03-11 | 西南石油大学 | Compact sandstone tensile strength prediction method based on spectral analysis |
| CN113074861B (en) * | 2021-01-04 | 2022-10-04 | 中国石油天然气股份有限公司 | Stratum fracture time monitoring method, device, equipment and storage medium |
| CN113356823B (en) * | 2021-06-29 | 2023-06-20 | 中国石油大学(北京) | Crack initiation method, device and system and controller |
| CN114063194B (en) * | 2021-11-18 | 2023-10-03 | 核工业北京地质研究院 | Baseline drift correction method and system for natural potential curve |
| CN116856895A (en) * | 2023-07-06 | 2023-10-10 | 安徽井上天华科技有限公司 | Edge calculation data processing method based on high-frequency pressure crack monitoring |
Citations (7)
| Publication number | Priority date | Publication date | Assignee | Title |
|---|---|---|---|---|
| US4458245A (en) * | 1979-10-11 | 1984-07-03 | Agence Nationale De Valorisation De La Recherche (Anvar) | Method and apparatus for exploring earth and rocky formations |
| US4858130A (en) * | 1987-08-10 | 1989-08-15 | The Board Of Trustees Of The Leland Stanford Junior University | Estimation of hydraulic fracture geometry from pumping pressure measurements |
| EP0456424A2 (en) * | 1990-05-07 | 1991-11-13 | Halliburton Company | Method of determining fracture characteristics of subsurface formations |
| EP0476758A2 (en) * | 1990-09-19 | 1992-03-25 | Sofitech N.V. | Detection of fracturing events using derivatives of fracturing pressures |
| US5206836A (en) * | 1986-03-20 | 1993-04-27 | Gas Research Institute | Method of determining position and dimensions of a subsurface structure intersecting a wellbore in the earth |
| US5417103A (en) * | 1993-11-10 | 1995-05-23 | Hunter; Roger J. | Method of determining material properties in the earth by measurement of deformations due to subsurface pressure changes |
| US6192316B1 (en) * | 1999-05-26 | 2001-02-20 | Atlantic Richfield Company | Fracture discrimination using borehole frequency response of stoneley waves |
Family Cites Families (5)
| Publication number | Priority date | Publication date | Assignee | Title |
|---|---|---|---|---|
| US4802144A (en) | 1986-03-20 | 1989-01-31 | Applied Geomechanics, Inc. | Hydraulic fracture analysis method |
| US4783769A (en) * | 1986-03-20 | 1988-11-08 | Gas Research Institute | Method of determining position and dimensions of a subsurface structure intersecting a wellbore in the earth |
| GB8907522D0 (en) * | 1989-04-04 | 1989-05-17 | British Petroleum Co Plc | Fracture investigation by resonance sweeping technique |
| US5771170A (en) * | 1994-02-14 | 1998-06-23 | Atlantic Richfield Company | System and program for locating seismic events during earth fracture propagation |
| US5963508A (en) * | 1994-02-14 | 1999-10-05 | Atlantic Richfield Company | System and method for determining earth fracture propagation |
-
2002
- 2002-09-20 US US10/251,301 patent/US7100688B2/en not_active Expired - Lifetime
-
2003
- 2003-08-28 AR ARP030103126A patent/AR041085A1/en not_active Application Discontinuation
- 2003-08-29 BR BR0303292-2A patent/BR0303292A/en not_active IP Right Cessation
- 2003-09-01 AU AU2003248434A patent/AU2003248434B2/en not_active Ceased
- 2003-09-09 CA CA2440247A patent/CA2440247C/en not_active Expired - Fee Related
- 2003-09-15 NO NO20034073A patent/NO334626B1/en not_active IP Right Cessation
- 2003-09-16 EP EP03255785A patent/EP1400818B1/en not_active Expired - Lifetime
- 2003-09-19 MX MXPA03008530A patent/MXPA03008530A/en active IP Right Grant
Patent Citations (7)
| Publication number | Priority date | Publication date | Assignee | Title |
|---|---|---|---|---|
| US4458245A (en) * | 1979-10-11 | 1984-07-03 | Agence Nationale De Valorisation De La Recherche (Anvar) | Method and apparatus for exploring earth and rocky formations |
| US5206836A (en) * | 1986-03-20 | 1993-04-27 | Gas Research Institute | Method of determining position and dimensions of a subsurface structure intersecting a wellbore in the earth |
| US4858130A (en) * | 1987-08-10 | 1989-08-15 | The Board Of Trustees Of The Leland Stanford Junior University | Estimation of hydraulic fracture geometry from pumping pressure measurements |
| EP0456424A2 (en) * | 1990-05-07 | 1991-11-13 | Halliburton Company | Method of determining fracture characteristics of subsurface formations |
| EP0476758A2 (en) * | 1990-09-19 | 1992-03-25 | Sofitech N.V. | Detection of fracturing events using derivatives of fracturing pressures |
| US5417103A (en) * | 1993-11-10 | 1995-05-23 | Hunter; Roger J. | Method of determining material properties in the earth by measurement of deformations due to subsurface pressure changes |
| US6192316B1 (en) * | 1999-05-26 | 2001-02-20 | Atlantic Richfield Company | Fracture discrimination using borehole frequency response of stoneley waves |
Non-Patent Citations (3)
| Title |
|---|
| DOZIER G.C., DOWELL, SUTTON T.W.: "Real-Tim Pressure Diagnostics Used To Improve Pretreatment Frac Design: Case Studies in the Antrim Shale" SOCIETY OF PETROLEUM ENGINEERS, SPE, 1 - 28 February 2000, pages 20-26, XP002295588 * |
| HOLZHAUSEN G.R., EGAN H.N.: "Detection and Control of Hydraulic Fractures in Water Injection Wells" SOCIETY OF PETROLEUM ENGINEERS, SPE, 8 - 10 April 1987, pages 379-386, XP002295589 * |
| SURJAATMADJA J.B., STEPHENSON S., HALLIBURTON, BHAUMIK C. ET AL.: "Analysis of Generated and Reflected Pressure Waves during Fracturing Reveals Fracture Behavior" SOCIETY OF PETROLEUM ENGINEERS, SPE, 29 September 2002 (2002-09-29) - 2 October 2002 (2002-10-02), pages 1-19, XP009036336 * |
Cited By (33)
| Publication number | Priority date | Publication date | Assignee | Title |
|---|---|---|---|---|
| WO2005103766A2 (en) * | 2004-04-23 | 2005-11-03 | Schlumberger Canada Limited | Method and system for monitoring of fluid-filled domains in a medium based on interface waves propagating along their surfaces |
| WO2005103766A3 (en) * | 2004-04-23 | 2006-02-09 | Schlumberger Ca Ltd | Method and system for monitoring of fluid-filled domains in a medium based on interface waves propagating along their surfaces |
| US7302849B2 (en) | 2004-04-23 | 2007-12-04 | Schlumberger Technology Corporation | Method and system for monitoring of fluid-filled domains in a medium based on interface waves propagating along their surfaces |
| KR100707389B1 (en) * | 2004-09-06 | 2007-04-13 | 한국건설기술연구원 | Apparatus and method for evaluating integrity of concrete structure using sound wave analysis |
| US8003214B2 (en) | 2006-07-12 | 2011-08-23 | Georgia-Pacific Chemicals Llc | Well treating materials comprising coated proppants, and methods |
| US8133587B2 (en) | 2006-07-12 | 2012-03-13 | Georgia-Pacific Chemicals Llc | Proppant materials comprising a coating of thermoplastic material, and methods of making and using |
| US8058213B2 (en) | 2007-05-11 | 2011-11-15 | Georgia-Pacific Chemicals Llc | Increasing buoyancy of well treating materials |
| US7754659B2 (en) | 2007-05-15 | 2010-07-13 | Georgia-Pacific Chemicals Llc | Reducing flow-back in well treating materials |
| GB2511656A (en) * | 2009-05-27 | 2014-09-10 | Optasense Holdings Ltd | Fracture monitoring |
| RU2537419C2 (en) * | 2009-05-27 | 2015-01-10 | Оптасенс Холдингз Лимитед | Monitoring of hydrofrac |
| NO345867B1 (en) * | 2009-05-27 | 2021-09-20 | Optasense Holdings Ltd | Monitoring of cracks |
| CN102597421A (en) * | 2009-05-27 | 2012-07-18 | 秦内蒂克有限公司 | Fracture monitoring |
| AU2016203552B2 (en) * | 2009-05-27 | 2017-12-14 | Optasense Holdings Limited | Fracture monitoring |
| GB2511657A (en) * | 2009-05-27 | 2014-09-10 | Optasense Holdings Ltd | Fracture monitoring |
| GB2511656B (en) * | 2009-05-27 | 2014-12-31 | Optasense Holdings Ltd | Fracture monitoring |
| GB2483584B (en) * | 2009-05-27 | 2014-12-31 | Optasense Holdings Ltd | Fracture monitoring |
| GB2511657B (en) * | 2009-05-27 | 2014-12-31 | Optasense Holdings Ltd | Fracture monitoring |
| WO2010136764A3 (en) * | 2009-05-27 | 2011-09-29 | Qinetiq Limited | Fracture monitoring |
| CN104295290A (en) * | 2009-05-27 | 2015-01-21 | 光学感应器控股有限公司 | Fracture monitoring |
| US8950482B2 (en) | 2009-05-27 | 2015-02-10 | Optasense Holdings Ltd. | Fracture monitoring |
| AU2010252797B2 (en) * | 2009-05-27 | 2016-03-03 | Optasense Holdings Limited | Fracture monitoring |
| CN102597421B (en) * | 2009-05-27 | 2016-03-30 | 光学感应器控股有限公司 | Fracturing monitoring |
| RU2648743C2 (en) * | 2009-05-27 | 2018-03-28 | Оптасенс Холдингз Лимитед | Formation hydraulic fracturing monitoring |
| CN104295290B (en) * | 2009-05-27 | 2017-04-12 | 光学感应器控股有限公司 | Fracture monitoring |
| AU2016203553B2 (en) * | 2009-05-27 | 2017-12-14 | Optasense Holdings Limited | Fracture monitoring |
| US9689254B2 (en) | 2009-05-27 | 2017-06-27 | Optasense Holdings Limited | Well monitoring by means of distributed sensing means |
| WO2011145985A1 (en) * | 2010-05-21 | 2011-11-24 | Schlumberger Canada Limited | A method of real time diagnostic of fracture operations with combination of tube waves and microseismic monitoring. |
| US9658357B2 (en) | 2010-05-21 | 2017-05-23 | Schlumberger Technology Corporation | Method of real time diagnostic of fracture operations with combination of tube waves and microseismic monitoring |
| RU2455665C2 (en) * | 2010-05-21 | 2012-07-10 | Шлюмбергер Текнолоджи Б.В. | Method of diagnostics of formation hydraulic fracturing processes on-line using combination of tube waves and microseismic monitoring |
| WO2016162799A1 (en) * | 2015-04-07 | 2016-10-13 | Eni S.P.A. | Method and system for the multimodal and multiscale analysis of geophysical data by transformation into musical attributes |
| US11313211B2 (en) | 2017-11-13 | 2022-04-26 | Shear Frac Group, Llc | Hydraulic fracturing |
| US11365618B2 (en) | 2020-02-28 | 2022-06-21 | Shear Frac Group, Llc | Hydraulic fracturing |
| US11572776B2 (en) | 2020-02-28 | 2023-02-07 | Shea Frac Group, LLC | Hydraulic fracturing |
Also Published As
| Publication number | Publication date |
|---|---|
| BR0303292A (en) | 2004-08-24 |
| EP1400818A3 (en) | 2004-12-01 |
| AU2003248434B2 (en) | 2008-03-06 |
| US20040206494A1 (en) | 2004-10-21 |
| NO20034073L (en) | 2004-03-22 |
| NO20034073D0 (en) | 2003-09-15 |
| CA2440247C (en) | 2013-12-03 |
| AR041085A1 (en) | 2005-04-27 |
| CA2440247A1 (en) | 2004-03-20 |
| MXPA03008530A (en) | 2004-07-23 |
| AU2003248434A1 (en) | 2004-04-08 |
| US7100688B2 (en) | 2006-09-05 |
| EP1400818B1 (en) | 2013-03-06 |
| NO334626B1 (en) | 2014-04-28 |
Similar Documents
| Publication | Publication Date | Title |
|---|---|---|
| CA2440247C (en) | Fracture monitoring using pressure-frequency analysis | |
| US6724687B1 (en) | Characterizing oil, gasor geothermal wells, including fractures thereof | |
| US11215049B2 (en) | Detecting downhole events using acoustic frequency domain features | |
| AU2017230727B2 (en) | Hydraulic fracture monitoring by low-frequency DAS | |
| US11053791B2 (en) | Detecting downhole sand ingress locations | |
| Cramer et al. | Integrating distributed acoustic sensing, treatment-pressure analysis, and video-based perforation imaging to evaluate limited-entry-treatment effectiveness | |
| US9803467B2 (en) | Well screen-out prediction and prevention | |
| US6408943B1 (en) | Method and apparatus for placing and interrogating downhole sensors | |
| US8567496B2 (en) | System and method for managing a subterranean formation | |
| US10774635B2 (en) | Restimulation process using coiled tubing and fiber optics | |
| Parkhonyuk et al. | Measurements while fracturing: nonintrusive method of hydraulic fracturing monitoring | |
| CA3030117C (en) | Determining characteristics of a fracture | |
| US9447669B2 (en) | Pulsed acoustic impact for facilitation of oil and gas extracting | |
| Panjaitan et al. | Qualifying diversion in multi clusters horizontal well hydraulic fracturing in haynesville shale using water hammer analysis, step-down test and microseismic data | |
| Mondal et al. | Uncertainties in Step-down Test Interpretation for Evaluating Completions Effectiveness and Near Wellbore Complexities | |
| US20220186605A1 (en) | Detecting operational anomalies for continuous hydraulic fracturing monitoring | |
| CA2988218C (en) | Power wave optimization for oil and gas extracting processes | |
| Alobaid et al. | Comprehensive Design and Diagnostic Approach for Horizontal Completions in Carbonate Environment | |
| Singh et al. | A comprehensive review of fracture-driven interaction in unconventional oil and gas plays: Characterization, real-time diagnosis, and impact on production | |
| US11708759B2 (en) | Instrumented bridge plugs for downhole measurements | |
| Surjaatmadja et al. | Analysis of generated and reflected pressure waves during fracturing reveals fracture behavior | |
| Clark et al. | Diagnostic Applications of Borehole Hydraulic Signal Processing | |
| Reeves et al. | Stimulation technology in the Antrim Shale | |
| Oparin et al. | Nonintrusive Rapid Evaluation of Fracture Isolation in Plug-And-Perf Completions Based on Data Science Methodology | |
| Banthia et al. | Use of Surface Derived Pressure Measurements for the Cost-Effective Reservoir Surveillance of Waterflood Operations in the Permian Basin |
Legal Events
| Date | Code | Title | Description |
|---|---|---|---|
| PUAI | Public reference made under article 153(3) epc to a published international application that has entered the european phase |
Free format text: ORIGINAL CODE: 0009012 |
|
| AK | Designated contracting states |
Kind code of ref document: A2 Designated state(s): AT BE BG CH CY CZ DE DK EE ES FI FR GB GR HU IE IT LI LU MC NL PT RO SE SI SK TR |
|
| AX | Request for extension of the european patent |
Extension state: AL LT LV MK |
|
| PUAL | Search report despatched |
Free format text: ORIGINAL CODE: 0009013 |
|
| AK | Designated contracting states |
Kind code of ref document: A3 Designated state(s): AT BE BG CH CY CZ DE DK EE ES FI FR GB GR HU IE IT LI LU MC NL PT RO SE SI SK TR |
|
| AX | Request for extension of the european patent |
Extension state: AL LT LV MK |
|
| 17P | Request for examination filed |
Effective date: 20050128 |
|
| AKX | Designation fees paid |
Designated state(s): DE DK FR GB IT NL |
|
| 17Q | First examination report despatched |
Effective date: 20101202 |
|
| GRAP | Despatch of communication of intention to grant a patent |
Free format text: ORIGINAL CODE: EPIDOSNIGR1 |
|
| GRAS | Grant fee paid |
Free format text: ORIGINAL CODE: EPIDOSNIGR3 |
|
| GRAA | (expected) grant |
Free format text: ORIGINAL CODE: 0009210 |
|
| AK | Designated contracting states |
Kind code of ref document: B1 Designated state(s): DE DK FR GB IT NL |
|
| REG | Reference to a national code |
Ref country code: GB Ref legal event code: FG4D |
|
| REG | Reference to a national code |
Ref country code: DE Ref legal event code: R096 Ref document number: 60343422 Country of ref document: DE Effective date: 20130502 |
|
| REG | Reference to a national code |
Ref country code: DE Ref legal event code: R082 Ref document number: 60343422 Country of ref document: DE Representative=s name: WEISSE, RENATE, DIPL.-PHYS. DR.-ING., DE |
|
| REG | Reference to a national code |
Ref country code: NL Ref legal event code: VDEP Effective date: 20130306 |
|
| PG25 | Lapsed in a contracting state [announced via postgrant information from national office to epo] |
Ref country code: NL Free format text: LAPSE BECAUSE OF FAILURE TO SUBMIT A TRANSLATION OF THE DESCRIPTION OR TO PAY THE FEE WITHIN THE PRESCRIBED TIME-LIMIT Effective date: 20130306 |
|
| PLBE | No opposition filed within time limit |
Free format text: ORIGINAL CODE: 0009261 |
|
| STAA | Information on the status of an ep patent application or granted ep patent |
Free format text: STATUS: NO OPPOSITION FILED WITHIN TIME LIMIT |
|
| PG25 | Lapsed in a contracting state [announced via postgrant information from national office to epo] |
Ref country code: DK Free format text: LAPSE BECAUSE OF FAILURE TO SUBMIT A TRANSLATION OF THE DESCRIPTION OR TO PAY THE FEE WITHIN THE PRESCRIBED TIME-LIMIT Effective date: 20130306 |
|
| 26N | No opposition filed |
Effective date: 20131209 |
|
| PG25 | Lapsed in a contracting state [announced via postgrant information from national office to epo] |
Ref country code: IT Free format text: LAPSE BECAUSE OF FAILURE TO SUBMIT A TRANSLATION OF THE DESCRIPTION OR TO PAY THE FEE WITHIN THE PRESCRIBED TIME-LIMIT Effective date: 20130306 |
|
| REG | Reference to a national code |
Ref country code: DE Ref legal event code: R097 Ref document number: 60343422 Country of ref document: DE Effective date: 20131209 |
|
| GBPC | Gb: european patent ceased through non-payment of renewal fee |
Effective date: 20130916 |
|
| REG | Reference to a national code |
Ref country code: FR Ref legal event code: ST Effective date: 20140530 |
|
| PG25 | Lapsed in a contracting state [announced via postgrant information from national office to epo] |
Ref country code: GB Free format text: LAPSE BECAUSE OF NON-PAYMENT OF DUE FEES Effective date: 20130916 |
|
| PG25 | Lapsed in a contracting state [announced via postgrant information from national office to epo] |
Ref country code: FR Free format text: LAPSE BECAUSE OF NON-PAYMENT OF DUE FEES Effective date: 20130930 |
|
| PGFP | Annual fee paid to national office [announced via postgrant information from national office to epo] |
Ref country code: DE Payment date: 20150930 Year of fee payment: 13 |
|
| REG | Reference to a national code |
Ref country code: DE Ref legal event code: R119 Ref document number: 60343422 Country of ref document: DE |
|
| PG25 | Lapsed in a contracting state [announced via postgrant information from national office to epo] |
Ref country code: DE Free format text: LAPSE BECAUSE OF NON-PAYMENT OF DUE FEES Effective date: 20170401 |