EP1522847A1 - Analytical method for determining crystallographic phases of a sample - Google Patents
Analytical method for determining crystallographic phases of a sample Download PDFInfo
- Publication number
- EP1522847A1 EP1522847A1 EP04022630A EP04022630A EP1522847A1 EP 1522847 A1 EP1522847 A1 EP 1522847A1 EP 04022630 A EP04022630 A EP 04022630A EP 04022630 A EP04022630 A EP 04022630A EP 1522847 A1 EP1522847 A1 EP 1522847A1
- Authority
- EP
- European Patent Office
- Prior art keywords
- sample
- diffraction diagram
- calculated
- spectrum
- measurement sample
- Prior art date
- Legal status (The legal status is an assumption and is not a legal conclusion. Google has not performed a legal analysis and makes no representation as to the accuracy of the status listed.)
- Granted
Links
Images

Classifications
-
- G—PHYSICS
- G01—MEASURING; TESTING
- G01N—INVESTIGATING OR ANALYSING MATERIALS BY DETERMINING THEIR CHEMICAL OR PHYSICAL PROPERTIES
- G01N23/00—Investigating or analysing materials by the use of wave or particle radiation, e.g. X-rays or neutrons, not covered by groups G01N3/00 – G01N17/00, G01N21/00 or G01N22/00
- G01N23/20—Investigating or analysing materials by the use of wave or particle radiation, e.g. X-rays or neutrons, not covered by groups G01N3/00 – G01N17/00, G01N21/00 or G01N22/00 by using diffraction of the radiation by the materials, e.g. for investigating crystal structure; by using scattering of the radiation by the materials, e.g. for investigating non-crystalline materials; by using reflection of the radiation by the materials
- G01N23/207—Diffractometry using detectors, e.g. using a probe in a central position and one or more displaceable detectors in circumferential positions
- G01N23/2076—Diffractometry using detectors, e.g. using a probe in a central position and one or more displaceable detectors in circumferential positions for spectrometry, i.e. using an analysing crystal, e.g. for measuring X-ray fluorescence spectrum of a sample with wavelength-dispersion, i.e. WDXFS
-
- G—PHYSICS
- G01—MEASURING; TESTING
- G01N—INVESTIGATING OR ANALYSING MATERIALS BY DETERMINING THEIR CHEMICAL OR PHYSICAL PROPERTIES
- G01N23/00—Investigating or analysing materials by the use of wave or particle radiation, e.g. X-rays or neutrons, not covered by groups G01N3/00 – G01N17/00, G01N21/00 or G01N22/00
- G01N23/22—Investigating or analysing materials by the use of wave or particle radiation, e.g. X-rays or neutrons, not covered by groups G01N3/00 – G01N17/00, G01N21/00 or G01N22/00 by measuring secondary emission from the material
- G01N23/223—Investigating or analysing materials by the use of wave or particle radiation, e.g. X-rays or neutrons, not covered by groups G01N3/00 – G01N17/00, G01N21/00 or G01N22/00 by measuring secondary emission from the material by irradiating the sample with X-rays or gamma-rays and by measuring X-ray fluorescence
Abstract
Description
Die Erfindung betrifft ein analytisches Verfahren zur Bestimmung von kristallographischen Phasen einer Messprobe, wobei ein Beugungsdiagramm der Messprobe und ein Element-Spektrum der Messprobe aufgenommen werden. The invention relates to an analytical method for the determination of crystallographic phases of a measurement sample, wherein a Diffraction diagram of the sample and an element spectrum of the Measurement sample to be recorded.
Ein solches Verfahren ist bekannt durch R. Meier und M. Dirken, International Cement & Lime Journal, Issue 2 (2002), Seite 18-21.Such a method is known by R. Meier and M. Dirken, International Cement & Lime Journal, Issue 2 (2002), pages 18-21.
Mit Hilfe von Beugungsexperimenten, etwa Röntgenbeugung (=XRD), Elektronenbeugung oder Neutronenbeugung, können Informationen über kristallographische Phasen in einer Messprobe gewonnen werden. Dazu wird in der Regel ein fokussierter oder parallelisierter, meist monochromatischer Strahl von Röntgenlicht bzw. Elektronen oder Neutronen auf die Messprobe geleitet, und der abgebeugte Strahl (oder die abgebeugten Strahlen) werden von einem Detektor registriert. Aus der Lage der abgebeugten Strahlen kann auf die qualitative Zusammensetzung der Messprobe geschlossen werden, und die Intensität liefert Hinweise auf den Anteil (die Konzentration) der jeweiligen Phasen.With the help of diffraction experiments, such as X-ray diffraction (= XRD), Electron diffraction or neutron diffraction, information about crystallographic phases are obtained in a measurement sample. This will be done in usually a focused or parallelized, mostly monochromatic beam directed by X-ray light or electrons or neutrons onto the test sample, and the diffracted beam (or the diffracted beams) are from a Detector registered. From the location of the rejected rays can on the qualitative composition of the sample be closed, and the Intensity provides indications of the proportion (the concentration) of the respective Phases.
Sowohl die qualitative wie auch die quantitative Analyse durch Beugungsexperimente kann durch die Art der Messprobe erschwert sein. Insbesondere sind Fremdatomanteile in Kristallen (Dotierungen) im Beugungsspektrum nur schlecht erkennbar, weiterhin können amorphe Probenanteile oder Mehrfachstreuung die Analyse verfälschen.Both qualitative and quantitative analysis by Diffraction experiments may be complicated by the nature of the sample. In particular, foreign atom components are in crystals (dopants) in Diffraction spectrum only poorly recognizable, furthermore amorphous Sample fractions or multiple scattering falsify the analysis.
Um die qualitative Analyse von Messproben zu erleichtern, ist es bekannt, von der Messprobe ein Elementspektrum aufzunehmen, etwa durch Röntgenfloureszenz (=XRF), vgl. R. Meier, aaO. Mit Hilfe der Elementkonzentrationen in der Probe können Phasen, die in der Probe nicht nachgewiesene chemische Elemente erfordern würden, in der qualitativen Phasenanalyse verworfen werden. Durch Hinzuziehen des Elementspektrums wird die Zuverlässigkeit der qualitativen Phasenanalyse aus dem Beugungsspektrum erhöht. Nur die in der qualitativen Phasenanalyse ausgewählten Phasen werden dann in die quantitative Phasenanalyse auf Grundlage des Beugungsspektrums einbezogen.To facilitate the qualitative analysis of samples, it is known from the sample to record an element spectrum, such as by X-ray fluorescence (= XRF), cf. R. Meier, ibid. With the help of Element concentrations in the sample can not occur in the sample would require proven chemical elements in the qualitative Phase analysis discarded. By adding the element spectrum the reliability of the qualitative phase analysis from the Diffraction spectrum increased. Only those in the qualitative phase analysis selected phases are then included in the quantitative phase analysis Basis of the diffraction spectrum included.
Bei diesem bekannten analytischen Verfahren kommt es häufig vor, dass das Ergebnis der quantitativen Phasenanalyse auf Grundlage des Beugungsdiagramms mit den aus dem Element-Spektrum bestimmten gemessenen Element-Konzentrationen quantitativ unvereinbar ist. Die Phasenanteile der kristallographischen Phasen werden aus dem Beugungsdiagramm offenbar fehlerhaft bestimmt.In this known analytical method, it often happens that the Result of the quantitative phase analysis on the basis of the Diffraction diagram with those determined from the element spectrum measured element concentrations is quantitatively incompatible. The Phase contributions of the crystallographic phases are taken from the Diffraction diagram apparently erroneously determined.
Aufgabe der vorliegenden Erfindung ist es demgegenüber, eine zuverlässigere quantitative Phasenanalyse einer Messprobe bereitzustellen.Object of the present invention is in contrast, a more reliable provide quantitative phase analysis of a sample.
Erfindungsgemäß wird diese Aufgabe gelöst durch ein analytisches
Verfahren zur Bestimmung von kristallographischen Phasen einer
Messprobe, das folgende Schritte umfasst:
Kern des erfindungsgemäßen Verfahrens ist es, in die quantitative Analyse auf Basis des Beugungs-Diagramms einen Satz von Nebenbedingungen (Randbedingungen) einzubringen, nämlich die Konzentrationen der in der Messprobe enthaltenen chemischen Elemente, welche über das Element-Spektrum bestimmt worden sind. Wird eine angenommene (d.h. vorläufig vermutete) Phasenzusammensetzung im Rahmen der quantitativen Phasenanalyse geprüft, so sind erfindungsgemäß zwei Größen zu optimieren. Aus der angenommenen Phasenzusammensetzung werden zunächst ein Beugungsdiagramm oder Teile eines Beugungsdiagramms (z.B. einzelne Reflexmaxima) berechnet, und eine erste Differenzgröße aus einem Vergleich zum gemessenen Beugungsdiagramm bestimmt. Außerdem werden aus der angenommenen Phasenzusammensetzung berechnete Elementkonzentrationen ermittelt und eine zweite Differenzgröße aus einem Vergleich zu den gemessenen Elementkonzentrationen gemäß Element-Spektrum bestimmt. Die Übereinstimmung der angenommenen Phasenzusammensetzung mit der tatsächlichen Phasenzusammensetzung der Messprobe wird nun anhand der ersten und zweiten Differenzgröße bewertet. Als Ergebnis der quantitativen Phasenanalyse wird aus einer Mehrzahl von angenommenen Phasenzusammensetzungen diejenige ermittelt, die die niedrigsten ersten und zweiten Differenzgrößen aufweist.The core of the method according to the invention is in the quantitative analysis based on the diffraction diagram a set of constraints (Boundary conditions), namely the concentrations in the Measurement sample contained chemical elements, which are beyond the element spectrum have been determined. If an accepted (i.e. suspected) phase composition in the quantitative Phase analysis tested, so are two sizes according to the invention optimize. From the assumed phase composition first a diffraction diagram or parts of a diffraction diagram (e.g., individual reflection maxima) and a first difference magnitude determined a comparison to the measured diffraction diagram. Furthermore are calculated from the assumed phase composition Element concentrations determined and a second difference size from a Comparison to the measured element concentrations according to element spectrum certainly. The agreement of the accepted Phase composition with the actual phase composition the measurement sample is now based on the first and second difference size rated. As a result of the quantitative phase analysis is from a A plurality of assumed phase compositions the one determined having the lowest first and second difference sizes.
Die Berechnung des Beugungsdiagramms (bzw. der Teile des Beugungsdiagramms) aus der angenommenen Phasenzusammensetzung der Messprobe kann sowohl durch eine ab-initio Simulation erfolgen (etwa im Rahmen einer Rietveldanalyse), als auch eine Extrapolation eines in einer Datenbank verfügbaren Beugungsdiagramms oder Stick Patterns auf die angenommene relative Phasenkonzentration sein. Letzterer Berechnungsansatz ist schnell und auch für Phasen unbekannter atomarer Struktur einsetzbar.The calculation of the diffraction diagram (or the parts of the Diffraction diagram) from the assumed phase composition of Measurement sample can be done both by an ab-initio simulation (approximately in the Rietveld analysis), as well as an extrapolation of one in one Database available diffraction diagram or stick patterns on the be assumed relative phase concentration. The latter Computational approach is fast and also for phases of unknown atomic Structure can be used.
Die erste und die zweite Differenzgröße können unterschiedlich gegeneinander gewichtet sein. Bevorzugt sind die beiden Differenzgrößen gleichgewichtet, so dass die Änderungen beider Differenzgrößen bei infinitesimaler Änderung eines einzelnen Phasenanteils betragsmäßig gleich groß sind. Alternativ kann erfindungsgemäß die zweite Differenzgröße so stark gewichtet werden, dass angenommene Phasenzusammensetzungen ausgeschlossen werden, die eine Abweichung der berechneten Elementkonzentration von der gemessenen Elementkonzentration größer als die Messungenauigkeit des Element-Spektrums voraussetzen. In diesem Falle wird die gemessene Elementkonzentration als wahr angesehen, und die Konzentrationen von verschiedenen kristallographischen Phasen in der Messprobe werden sehr streng korreliert. The first and second difference sizes can differ from each other be weighted. Preferably, the two difference sizes are equally weighted, so that the changes of both difference sizes with infinitesimal change of a amount of individual phase are equal in magnitude. Alternatively, you can According to the invention, the second difference quantity is weighted so heavily that assumed phase compositions are excluded, the one Deviation of the calculated element concentration from the measured Element concentration greater than the measurement inaccuracy of the element spectrum provide. In this case, the measured Element concentration considered true, and the concentrations of Different crystallographic phases in the measurement sample become very strictly correlated.
Das erfindungsgemäße Verfahren ist besonders gut geeignet, Gemische von einer Vielzahl von Phasen quantitativ zu analysieren, bei denen die einzelnen Phasen zu einem großen Teil identische Elemente enthalten. In diesem Fall reduziert die zweite Differenzgröße als Nebenbedingung die möglichen Phasenzusammensetzungen erheblich.The inventive method is particularly well suited to mixtures of to quantitatively analyze a variety of phases in which the individual Phases to a large extent contain identical elements. In this case reduces the second difference size as a constraint the possible Phase compositions significantly.
Das erfindungsgemäße Verfahren kann besonders vorteilhaft mit einer Datenverarbeitungsanlage (Computer) und einem geeigneten Computerprogramm (Software) ausgeführt werden, insbesondere wobei die Datenverarbeitungsanlage an ein geeignetes Messgerät oder geeignete Messgeräte zur Aufnahme des Beugungsdiagramms und/oder des Elementspektrums der Messprobe angeschlossen ist. Daher ist erfindungsgemäß auch ein Computerprogramm zur Ausführung des erfindungsgemäßen analytischen Verfahrens Teil der vorliegenden Erfindung.The inventive method can be particularly advantageous with a Data processing equipment (computer) and a suitable Computer program (software) are executed, in particular the Data processing system to a suitable meter or suitable Measuring instruments for recording the diffraction diagram and / or the Element spectrum of the sample is connected. thats why According to the invention also a computer program for the execution of analytical method according to the invention part of the present invention.
Besonders bevorzugt ist eine Verfahrensvariante, bei der in Schritt (c) eine interaktive Anpassung von Referenzdaten an beobachtete Reflexmaxima des aufgenommenen Beugungsdiagramms durchgeführt wird, insbesondere wobei die Anpassung manuell und/oder graphisch basiert ist. Beispielsweise liefert eine Software ein Stick Pattern von Reflexmaxima der angenommenen Phasen der angenommenen Phasenzusammensetzung der Messprobe vor dem Hintergrund des gemessenen Beugungsdiagramms, und ein Anwender passt die angenommene Phasenzusammensetzung dadurch an, dass er eines der Stick Patterns neu skaliert, also eine relative Konzentration einer Phase verändert. Bevorzugt werden die Stick Patterns der übrigen Phasen unter Beachtung der Nebenbedingung der Elementkonzentrationen automatisch angepasst. Durch dieses Verfahren kann der Anwender die Auswertung von Beugungs-Diagramm und Element-Spektrum überwachen und so die Messinformationen weitgehend direkt interpretieren. Alternativ sind auch voll automatisch ablaufende Verfahrensvarianten möglich. Particularly preferred is a process variant in which in step (c) a interactive adaptation of reference data to observed reflex maxima the recorded diffraction diagram is carried out, in particular wherein the adaptation is manual and / or graphical based. For example Software provides a stick pattern of reflex maxima assumed phases of the assumed phase composition of the Measurement sample against the background of the measured diffraction diagram, and a user matches the presumed phase composition by rescaling one of the stick patterns, that is, a relative one Concentration of a phase changed. Preference is given to the stick patterns the remaining phases, taking into account the constraints of Element concentrations adjusted automatically. By this procedure the user can evaluate the diffraction diagram and element spectrum monitor and thus the measurement information largely directly interpret. Alternatively, they are fully automatic Process variants possible.
Eine Weiterentwicklung dieser Verfahrensvariante sieht vor, dass die
Anpassung mit Hilfe eines Minimierungsalgorithmus durchgeführt wird,
insbesondere wobei die Größe
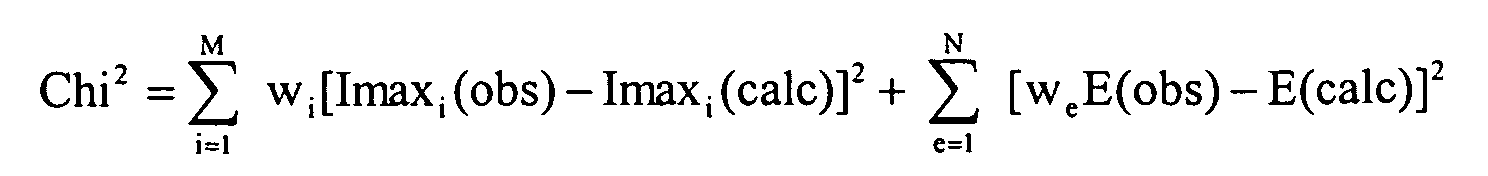
- Imaxi(obs): Beobachtetes Reflexmaximum
- Imaxi(calc): Berechnetes Reflexmaximum
- E(obs): Beobachtete Elementkonzentration
- E(calc): Berechnete Elementkonzentration
- M: maximale Anzahl verwendeter Reflexmaxima
- i: Zählvariable der Reflexmaxima
- N: maximale Anzahl verwendeter Elemente
- e: Zählvariable der Elemente
- wi: Wichtungsfaktor
- we: Skalierungskonstante.
- Imax i (obs): Observed reflex maximum
- Imax i (calc): Calculated reflex maximum
- E (obs): observed element concentration
- E (calc): calculated element concentration
- M: maximum number of used reflex maxima
- i: count variable of the reflex maxima
- N: maximum number of used elements
- e: Counter variable of the elements
- w i : weighting factor
- w e : Scaling constant.
Eine andere Weiterentwicklung der Verfahrensvariante sieht vor, dass die Anpassung auf Basis sämtlicher beobachteter Messpunkte des Beugungsdiagramms der Messprobe durchgeführt wird, insbesondere mittels quantitativer Rietveldanalyse (z.B. gemäß H.M. Rietveld, Acta Cryst. 22 (1967), 151-152; H.M. Rietveld, J. Appl. Cryst. 2 (1969), 65-71) oder kristallstrukturunabhängigen "Full Pattern Matching" Methoden (z.B. gemäß Le Bail et al., Mat. Res. Bull. 23 (1988), 447-452; G.S. Pawley, J. Appl. Cryst. 14 (1981), 357-361) oder einer Kombinationen aus Rietveldanalyse und kristallstrukturunabhängigen "Full Pattern Matching" Methoden. Die Verwendung sämtlicher Messpunkte des Beugungsdiagramms stellt die quantitative Analyse auf eine breitere Basis und macht diese somit zuverlässiger, da Probleme durch Reflexüberlagerungen minimiert werden..Another development of the process variant provides that the Adjustment based on all observed measurement points of the Diffraction diagram of the sample is carried out, in particular by means of quantitative Rietveld analysis (e.g., according to H. M. Rietveld, Acta Cryst (1967), 151-152; HM. Rietveld, J. Appl. Cryst. 2 (1969), 65-71) or crystal structure independent "Full Pattern Matching" methods (e.g. Le Bail et al., Mat. Res. Bull. 23 (1988), 447-452; G. S. Pawley, J. Appl. Cryst. 14 (1981), 357-361) or a combination of Rietveld analysis and crystal-structure independent "Full Pattern Matching" methods. The Use of all measurement points of the diffraction diagram represents the quantitative analysis on a broader basis and does so more reliable as it minimizes reflex overlay issues.
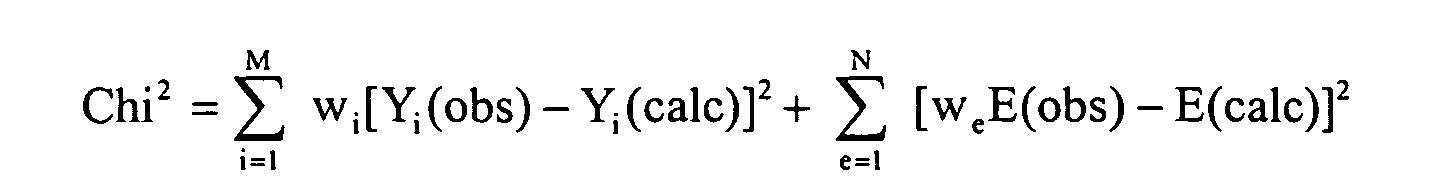
Diese Weiterentwicklung kann in einer Verfahrensvariante erfindungsgemäß
fortgebildet werden, bei der die Anpassung mit Hilfe eines
Minimierungsalgorithmus durchgeführt wird, insbesondere wobei die Größe

- Yi(obs): Beobachteter Messpunkt
- Yi(calc): Berechneter Messpunkt
- E(obs): Beobachtete Elementkonzentration
- E(calc): Berechnete Elementkonzentration
- M: maximale Anzahl verwendeter Messpunkte
- i: Zählvariable der Messpunkte
- N: maximale Anzahl verwendeter Elemente
- e: Zählvariable der Elemente
- wi: Wichtungsfaktor
- We: Skalierungskonstante.
- Y i (obs): Observed measuring point
- Y i (calc): Calculated measuring point
- E (obs): observed element concentration
- E (calc): calculated element concentration
- M: maximum number of used measuring points
- i: Count variable of the measuring points
- N: maximum number of used elements
- e: Counter variable of the elements
- w i : weighting factor
- W e : Scaling constant.
Ein solcher Minimierungsalgorithmus objektiviert die Bestimmung der besten Übereinstimmung zwischen berechneten und gemessenen Daten und erleichtert eine automatische Bestimmung dieser besten Übereinstimmung.Such a minimization algorithm objectifies the determination of the best Correspondence between calculated and measured data and facilitates automatic determination of this best match.
Ganz besonders bevorzugt ist eine Variante des erfindungsgemäßen Verfahrens, bei der das Beugungs-Diagramm ein Röntgenbeugungs(=XRD)-Diagramm ist und das Element-Spektrum ein Röntgenfloureszenz(=XRF)-Spektrum ist. XRD und XRF sind kostengünstig durchzuführende, zerstörungsfreie Untersuchungsverfahren und benötigen keine oder nur eine unaufwändige Probenpräparation. Very particular preference is given to a variant of the invention Method in which the diffraction diagram is an X-ray diffraction (= XRD) diagram and the element spectrum is an X-ray fluorescence (= XRF) spectrum is. XRD and XRF are inexpensive, Non-destructive testing methods and require no or only one unobtrusive sample preparation.
In Ausgestaltung dieser Verfahrensvariante ist es vorteilhaft, wenn die XRDund die XRF-Messungen in einer kombinierten Apparatur durchgeführt werden. Dies spart gegebenenfalls Messausrüstung ein, erspart Probenwechsel bzw. verkürzt die Wege bei den Messungen. Außerdem werden die notwendigen Daten für das erfindungsgemäße Verfahren durch eine Apparatur bereitgestellt, was die Kompatibilität der Messdaten bzw. die Datenformatierung und Datenimport in einen Rechner vereinfacht.In an embodiment of this variant of the method, it is advantageous if the XRDund XRF measurements were performed in a combined apparatus become. This saves any equipment needed, saves Sample change or shorten the paths during the measurements. Furthermore are the necessary data for the inventive method by provided an apparatus, which the compatibility of the measurement data or the Data formatting and data import into a computer simplified.
In einer bevorzugten Verfahrensvariante werden in Schritt (a) Lösungen verworfen, die die Anwesenheit von Elementen in der Messprobe voraussetzen würden, welche im Element-Spektrum aus Schritt (b) nicht nachgewiesen sind. Dies vereinfacht die qualitative Analyse. Diese Maßnahme für eine qualitative Analyse ist aus dem Stand der Technik an sich bekannt.In a preferred process variant, in step (a) solutions discarded the presence of elements in the test sample which are not in the element spectrum of step (b) are proven. This simplifies the qualitative analysis. These Measure for a qualitative analysis is from the state of the art known.
Vorteilhaft ist weiterhin eine Variante des erfindungsgemäßen Verfahrens, bei der das Verfahren zur Qualitätskontrolle eingesetzt wird, insbesondere online. Aufgrund der hohen Zuverlässigkeit der erfindungsgemäßen quantitativen Analyse und der guten Automatisierbarkeit können auch strenge Qualitätsstandards zeitnah überwacht werden.Also advantageous is a variant of the method according to the invention, in which the quality control procedure is used, in particular on-line. Due to the high reliability of the invention Quantitative analysis and good automation can also strict quality standards are monitored promptly.
Bevorzugt sieht eine Verfahrensvariante vor, dass die Messprobe eine anorganische Probe, z.B. eine Zementprobe und/oder eine Keramikprobe und/oder eine Gesteinsprobe umfasst. Das erfindungsgemäße Verfahren ist besonders effektiv bei Proben mit hohem kristallinen Anteil einsetzbar, da dann das gemessene Beugungsdiagramm besonders viel Informationen enthält.Preferably, a variant of the method provides that the measurement sample a inorganic sample, e.g. a cement sample and / or a ceramic sample and / or a rock sample. The inventive method is particularly effective for samples with a high crystalline content, since then the measured diffraction pattern especially much information contains.
Weitere Vorteile der Erfindung ergeben sich aus der Beschreibung und der Zeichnung. Ebenso können die vorstehend genannten und die noch weiter ausgeführten Merkmale erfindungsgemäß jeweils einzeln für sich oder zu mehreren in beliebigen Kombinationen Verwendung finden. Die gezeigten und beschriebenen Ausführungsformen sind nicht als abschließende Aufzählung zu verstehen, sondern haben vielmehr beispielhaften Charakter für die Schilderung der Erfindung.Further advantages of the invention will become apparent from the description and the Drawing. Likewise, those mentioned above and even further executed features according to the invention in each case individually or to several in any combination use find. The shown and described embodiments are not to be exhaustive enumeration but rather have exemplary character for the Description of the invention.
Die Erfindung ist in der Zeichnung dargestellt und wird anhand eines Ausführungsbeispiels näher erläutert. Es zeigt die
- Figur
- einen Screenshot einer Software, mit der das erfindungsgemäße analytische Verfahren durchführbar ist.
- figure
- a screenshot of a software with which the analytical method according to the invention is feasible.
Das erfindungsgemäße Verfahren beginnt zunächst mit der Aufnahme eines Elementspektrums (beispielsweise XRF) und der Aufnahme eines Beugungs-Diagramms (beispielsweise XRD) einer Messprobe. Das Ergebnis dieser beiden Messungen wird im erfindungsgemäßen Verfahren dazu verwendet, eine quantitative Konzentrationsbestimmung der in der Messprobe vorhandenen Phasen mit hoher Zuverlässigkeit und Genauigkeit durchzuführen. Vorteilhafter Weise erfolgt zumindest dieser zweite Teil des erfindungsgemäßen Verfahrens mit der Unterstützung einer Software auf einem Rechner. Diese Software kann entweder auch schon die Aufnahme des Elementspektrums und des Beugungsdiagramms gesteuert haben bzw. mit der zugehörigen Steuersoftware vernetzt sein, oder aber die Ergebnisse der Aufnahmen werden in die Software importiert, beispielsweise als Text-Dateien über eine Diskette.The inventive method begins with the inclusion of a first Element spectrum (such as XRF) and the inclusion of a diffraction diagram (eg XRD) of a sample. The result of this Both measurements are used in the method according to the invention, a quantitative determination of the concentration in the test sample existing phases with high reliability and accuracy perform. Advantageously, at least this second part of the inventive method with the support of software a calculator. This software can either already recording the Element spectrum and the diffraction diagram have controlled or with the linked to the associated control software, or the results of the Recordings are imported into the software, for example as text files over a floppy disk.
Die erfindungsgemäße Auswertung der Aufnahmen erfolgt in folgenden
Schritten:
In der Figur ist Mitte oben das Fenster Search/Match zu sehen. In diesem Fenster findet sich eine Liste von Elementen, denen ein Konzentrationswert auf Grundlage des Elementspektrums in der Liste "XRF" zugeordnet ist. In der Liste sind alle in der Probe mittels des Element-Spektrums aufgefundenen Elemente aufgeführt, sowie weiterhin Elemente, die mit dem Elementspektrum nicht zugänglich sind aber in der Probe vermutet werden (beispielsweise Wasserstoff im Falle von XRF). Daneben befindet sich eine Liste "SQD", die die Konzentrationen der Elemente - berechnet gemäß einer gegenwärtig angenommenen Zusammensetzung der Messprobe aus bestimmten Anteilen von Phasen (=angenommene Phasenzusammensetzung) - wiedergibt. In Spalte "Delta" ist die Differenz zwischen den Spalten "XRF" und "SQD" dargestellt. Konzentrationsangaben werden bevorzugt in Stoffmengen-%, alternativ auch in Gewichts-% gemacht.The figure shows the Search / Match window at the top center. In this Window is a list of items that have a concentration value Based on the element spectrum in the "XRF" list. In the List are all found in the sample by means of the element spectrum Elements listed, as well as elements that continue with the element spectrum are not accessible but are suspected in the sample (for example Hydrogen in the case of XRF). Next to it is a list "SQD", the the concentrations of the elements - calculated according to a current assumed composition of the test sample of certain proportions of phases (= assumed phase composition) - represents. In Column "Delta" is the difference between the columns "XRF" and "SQD" shown. Concentration data are preferred in molar%, alternatively also made in weight%.
Zu Beginn der Anpassung kann eine beliebige angenommene Phasenzusammensetzung eingestellt sein, bevorzugt orientiert sich die initiale angenommene Phasenzusammensetzung an den absoluten Intensitäten der Reflexmaxima im Beugungs-Diagramm. Der Benutzer kann nun den Anteil einzelner Phasen im Fenster Toolbox verändern, indem er die jeweilige Phase in der Liste markiert und mit einem Schieberegler (im Toolbox-Fenster links unten) einstellt. Die übrigen Phasen werden bevorzugt automatisch angepasst, so dass in Summe 100% Phasenanteile vergeben sind. Die jeweiligen relativen Phasenanteile können aus der Spalte "S-Q" im Toolbox-Fenster ersehen werden. Bei dieser Anpassung mit dem Schieberegler (Slider) kann der Benutzer die Differenz in den Elementkonzentrationen im Fenster Search/Match, Spalte Delta, verfolgen, und die Differenz im Beugungsdiagramm anhand der Sticklängen im Vergleich zu den gemessenen Reflexmaxima verfolgen.At the beginning of the adaptation can be any assumed Phase composition to be set, preferably oriented the initial assumed phase composition at the absolute intensities of Reflex maxima in the diffraction diagram. The user can now view the share individual phases in the toolbox window change by taking the respective phase marked in the list and with a slider (in the Toolbox window on the left below). The remaining phases are preferably adjusted automatically, so that in total 100% phase shares are awarded. The relative ones Phase shares can be seen from the "S-Q" column in the Toolbox window become. With this adjustment with the slider (Slider) can the User the difference in element concentrations in the window Search / Match, column delta, track, and the difference in Diffraction diagram based on the stick lengths compared to the measured ones Follow reflex maxima.
Ziel des Benutzers ist eine Einstellung der angenommenen Phasenzusammensetzung der Messprobe, in der einerseits die Stick Patterns nur minimal vom gemessenen Beugungsdiagramm abweichen, d.h. die relativen Intensitäten aller Sticks aller gefundenen Phasen mit den relativen Intensitäten der entsprechenden Reflexmaxima des gemessenen Beugungsdiagramm gut übereinstimmen. Andererseits ist das Ziel der Einstellung eine möglichst geringe Abweichung der berechneten Elementkonzentrationen in der angenommenen Phasenzusammensetzung der Einstellung von den gemessenen Elementkonzentrationen gemäß Elementspektrum.The aim of the user is a setting of the assumed Phase composition of the test sample, in the one hand, the stick patterns only minimally deviate from the measured diffraction diagram, i. the relative intensities of all sticks of all phases found with the relative ones Intensities of the corresponding reflection maxima of the measured Diffraction pattern match well. On the other hand, the goal is the Setting the smallest possible deviation of the calculated Element concentrations in the assumed phase composition of the Adjustment of the measured element concentrations according to Element spectrum.
Die beiden Abweichungen können durch den Benutzer mittels Augenschein gleichzeitig minimiert werden. Zur Vereinfachung der Feststellung des Grades der Abweichungen können den beiden Abweichungen mathematisch bestimmbare Differenzgrößen zugeordnet werden. Diese Differenzgrößen können beispielsweise am Bildschirm dargestellt werden, um den Benutzer bei der Anpassung der Phasenzusammensetzung zu unterstützen. Es ist auch erfindungsgemäß möglich, einen Raum von vielen möglichen Phasenzusammensetzungen durchzurechnen und ein Minimum der Differenzgrößen automatisch zu bestimmen. Dazu kann eine gemeinsame Fehlergröße, etwa als Summe der beiden Differenzgrößen eingesetzt werden. Ein Beispiel einer gemeinsamen Fehlergröße ist Chi2, wie weiter oben in der Beschreibung definiert. Dabei können die einzelnen Differenzgrößen grundsätzlich beliebig gewichtet werden. Bevorzugt wird die Übereinstimmung der berechneten und gemessenen Elementkonzentrationen streng verlangt. The two deviations can be simultaneously minimized by the user by visual inspection. To simplify the determination of the degree of deviations, mathematically determinable difference values can be assigned to the two deviations. These differences can be displayed on the screen, for example, to assist the user in adjusting the phase composition. It is also possible according to the invention to calculate a space of many possible phase compositions and to automatically determine a minimum of the difference sizes. For this purpose, a common error size can be used, for example as the sum of the two differential quantities. An example of a common error size is Chi 2 , as defined earlier in the description. In principle, the individual difference sizes can be weighted arbitrarily. Preferably, the correspondence of the calculated and measured element concentrations is strictly required.
Dies ist insbesondere dann sinnvoll, wenn ein amorpher Probenanteil in der Messprobe ausgeschlossen (bzw. vernachlässigt) werden kann oder ein amorpher Probenanteil im Beugungsdiagramm mit exakter Kenntnis dessen Zusammensetzung berücksichtigt wird.This is particularly useful if an amorphous sample content in the Sample can be excluded (or neglected) or one Amorphous sample content in the diffraction diagram with exact knowledge of it Composition is taken into account.
In einer anderen Variante des erfindungsgemäßen analytischen Verfahrens wird aus einer angenommenen Phasenzusammensetzung der Messprobe ein vollständiges Beugungsdiagramm durch eine ab initio Rechnung auf Grundlage der atomaren Strukturen der einzelnen Phasen simuliert (=Rietveld-Methode im engeren Sinn, vgl. R.A. Young, The Rietveld Method, Oxford Science Publications, 1993). Die Übereinstimmung von simuliertem und gemessenem Beugungsdiagramm kann dann durch die Bestimmung einer Kovarianz erfolgen. Dabei werden erfindungsgemäß als angenommene Phasenzusammensetzungen von vorne herein nur solche Phasenzusammensetzungen zugelassen, die in ihrer zugehörigen elementaren Zusammensetzung den gemessenen Elementkonzentrationen gemäß dem Elementspektrum entsprechen. Dadurch wird der Raum möglicher Phasenzusammensetzungen in der Simulation erheblich eingeschränkt, so dass die Bestimmung der am besten übereinstimmenden Phasenzusammensetzung erheblich schneller erfolgen kann als ohne diese Nebenbedingung. Auch ist das Ergebnis der Rietveld-Bestimmung stets mit dem gemessenen Elementspektrum vereinbar, so dass im Ergebnis unsinnige (und damit letztlich unnötige) Rietveld-Bestimmungen ausgeschlossen sind.In another variant of the analytical method according to the invention is taken from an assumed phase composition of the test sample complete diffraction diagram based on an ab initio calculation simulated the atomic structures of the individual phases (= Rietveld method in narrower sense, cf. R.A. Young, The Rietveld Method, Oxford Science Publications, 1993). The match of simulated and measured Diffraction diagram can then by determining a covariance respectively. In this case, according to the invention as accepted Phase compositions from the outset only such Phase compositions permitted in their associated elemental Composition of the measured element concentrations according to the Correspond to element spectrum. This makes the room more possible Phase compositions significantly limited in the simulation, so that the determination of the best matching Phase composition can be done much faster than without them Constraint. Also, the result of the Rietveld determination is always included compatible with the measured element spectrum, so that in the result senseless (and ultimately unnecessary) Rietveld provisions are excluded.
Claims (10)
Applications Claiming Priority (2)
| Application Number | Priority Date | Filing Date | Title |
|---|---|---|---|
| DE10346433 | 2003-10-07 | ||
| DE10346433A DE10346433B4 (en) | 2003-10-07 | 2003-10-07 | Analytical method for determining crystallographic phases of a measurement sample |
Publications (2)
| Publication Number | Publication Date |
|---|---|
| EP1522847A1 true EP1522847A1 (en) | 2005-04-13 |
| EP1522847B1 EP1522847B1 (en) | 2009-03-04 |
Family
ID=34306294
Family Applications (1)
| Application Number | Title | Priority Date | Filing Date |
|---|---|---|---|
| EP04022630A Expired - Fee Related EP1522847B1 (en) | 2003-10-07 | 2004-09-23 | Analytical method for determining crystallographic phases of a sample |
Country Status (3)
| Country | Link |
|---|---|
| US (1) | US7184517B2 (en) |
| EP (1) | EP1522847B1 (en) |
| DE (2) | DE10346433B4 (en) |
Cited By (2)
| Publication number | Priority date | Publication date | Assignee | Title |
|---|---|---|---|---|
| US7792250B1 (en) | 2009-04-30 | 2010-09-07 | Halliburton Energy Services Inc. | Method of selecting a wellbore cement having desirable characteristics |
| US8887806B2 (en) | 2011-05-26 | 2014-11-18 | Halliburton Energy Services, Inc. | Method for quantifying cement blend components |
Families Citing this family (12)
| Publication number | Priority date | Publication date | Assignee | Title |
|---|---|---|---|---|
| EP1571441A1 (en) * | 2004-03-01 | 2005-09-07 | Panalytical B.V. | Monitoring epitaxial growth in situ by means of an angle dispersive X-ray diffractometer |
| US20070259052A1 (en) * | 2006-05-05 | 2007-11-08 | Shire International Licensing B.V. | Assay for lanthanum hydroxycarbonate |
| US7529340B2 (en) * | 2006-05-15 | 2009-05-05 | General Electric Company | Systems and methods for identifying a substance |
| US7999933B2 (en) * | 2009-08-14 | 2011-08-16 | Princeton Instruments | Method for calibrating imaging spectrographs |
| WO2012178082A1 (en) * | 2011-06-24 | 2012-12-27 | The Trustees Of Columbia University In The City Of New York | Improved methods, devices and systems to process x-ray diffraction data |
| JP6013950B2 (en) * | 2013-03-14 | 2016-10-25 | 株式会社リガク | Crystal phase identification method, crystal phase identification apparatus, and crystal phase identification program |
| CN103439352B (en) * | 2013-08-20 | 2016-09-07 | 中国兵器科学研究院宁波分院 | A kind of Quantitative Analysis of Microstructure method of TRIP steel |
| US9939393B2 (en) | 2015-09-28 | 2018-04-10 | United Technologies Corporation | Detection of crystallographic properties in aerospace components |
| WO2017141973A1 (en) * | 2016-02-17 | 2017-08-24 | 株式会社リガク | Analysis device, analysis method, and analysis program |
| JPWO2018025618A1 (en) * | 2016-07-30 | 2019-09-19 | 株式会社リガク | Material structure search method and X-ray structure analysis system used therefor |
| EP3667304B1 (en) * | 2017-08-09 | 2023-07-26 | Rigaku Corporation | Crystal-phase quantitative analysis device, crystal-phase quantitative analysis method, and crystal-phase quantitative analysis program |
| CN114705708B (en) * | 2022-06-07 | 2022-08-23 | 四川大学 | Intelligent analysis method and system for sample surface components |
Family Cites Families (9)
| Publication number | Priority date | Publication date | Assignee | Title |
|---|---|---|---|---|
| GB9223592D0 (en) * | 1992-11-11 | 1992-12-23 | Fisons Plc | X-ray analysis apparatus |
| GB9226552D0 (en) * | 1992-12-21 | 1993-02-17 | Philips Electronics Uk Ltd | A method of determining a given characteristic of a material sample |
| US5414747A (en) * | 1993-02-22 | 1995-05-09 | The Penn State Research Foundation | Method and apparatus for in-process analysis of polycrystalline films and coatings by x-ray diffraction |
| JP3059403B2 (en) * | 1996-07-18 | 2000-07-04 | 理学電機工業株式会社 | X-ray analysis method and apparatus |
| JPH08334481A (en) * | 1996-07-25 | 1996-12-17 | Shimadzu Corp | X-ray fluorescent analysis |
| JP2002131251A (en) * | 2000-10-20 | 2002-05-09 | Seiko Instruments Inc | X-ray analyzer |
| US6577705B1 (en) * | 2001-04-02 | 2003-06-10 | William Chang | Combinatorial material analysis using X-ray capillary optics |
| JP4777539B2 (en) * | 2001-05-29 | 2011-09-21 | エスアイアイ・ナノテクノロジー株式会社 | Compound X-ray analyzer |
| JP2003050115A (en) * | 2001-08-07 | 2003-02-21 | Seiko Instruments Inc | X-ray film thickness meter |
-
2003
- 2003-10-07 DE DE10346433A patent/DE10346433B4/en not_active Expired - Fee Related
-
2004
- 2004-09-23 DE DE502004009073T patent/DE502004009073D1/en active Active
- 2004-09-23 EP EP04022630A patent/EP1522847B1/en not_active Expired - Fee Related
- 2004-09-30 US US10/952,823 patent/US7184517B2/en not_active Expired - Fee Related
Non-Patent Citations (4)
| Title |
|---|
| A. CARRERAS, R. BONETTO, G. STUTZ ET AL: "Parameter refinement in the analysis of X-ray irradiated samples", X-RAY SPECTROMETRY, vol. 31, no. 2, March 2002 (2002-03-01), pages 173 - 177, XP002315899 * |
| D. BISH ET AL: "Application of the CHEMIN XRD/XRF", 1997, XP002315900, Retrieved from the Internet <URL:Y> [retrieved on 20050201] * |
| R. BONETTO, G. CASTELLANO, J. TRINCAVELLI: "Optimization of parameters in electron probe microanalysis", X-RAY SPECTROMETRY, vol. 30, no. 5, September 2001 (2001-09-01), pages 313 - 319, XP002315901 * |
| R.C. JONES, C.J. BABCOCK, W.B. KNOWLTON: "Estimation of the Total Amorphous Content of Hawai's Soils by the Rietveld Method", SOIL SCIENCE SOCIETY OF AMERICA JOURNAL, vol. 64, May 2000 (2000-05-01), pages 1100 - 1108, XP002315898 * |
Cited By (2)
| Publication number | Priority date | Publication date | Assignee | Title |
|---|---|---|---|---|
| US7792250B1 (en) | 2009-04-30 | 2010-09-07 | Halliburton Energy Services Inc. | Method of selecting a wellbore cement having desirable characteristics |
| US8887806B2 (en) | 2011-05-26 | 2014-11-18 | Halliburton Energy Services, Inc. | Method for quantifying cement blend components |
Also Published As
| Publication number | Publication date |
|---|---|
| DE10346433A1 (en) | 2005-05-19 |
| US20050074089A1 (en) | 2005-04-07 |
| US7184517B2 (en) | 2007-02-27 |
| DE502004009073D1 (en) | 2009-04-16 |
| DE10346433B4 (en) | 2006-05-11 |
| EP1522847B1 (en) | 2009-03-04 |
Similar Documents
| Publication | Publication Date | Title |
|---|---|---|
| EP1522847B1 (en) | Analytical method for determining crystallographic phases of a sample | |
| DE60026287T2 (en) | NMR METHOD FOR DETERMINING THE RISK FOR DEVELOPING DIABETES TYPE 2 | |
| DE102010038014B4 (en) | Use of specific substances as markers to determine the risk of kidney rejection | |
| DE10159828B4 (en) | X-ray fluorescence spectrometer | |
| EP3159681B1 (en) | Method and device for automatable determination of the detection threshold and the relative error in the quantification of the concentration of a substance to be tested in a measuring probe | |
| DE102012217419B4 (en) | Analysis method for X-ray diffraction measurement data | |
| DE10305105A1 (en) | Calibration of a transformation of X-ray absorption values obtained using at least two different X-ray spectra into thickness and atomic number values using calibration samples of known thickness and atomic number | |
| EP2405261B1 (en) | Method for determining the quantitative composition of a powder sample | |
| WO2003098174A1 (en) | Method and device for conducting the spectral differentiating, imaging measurement of fluorescent light | |
| EP1893965B1 (en) | Method for calibrating a mass spectrometric sniffing leak detector | |
| DE19713194C2 (en) | Method and arrangement for recognizing properties of a sample on the basis of mass spectroscopy | |
| DE102023104071A1 (en) | DEVICE AND METHOD FOR ANALYZING A DIFFRACTION PATTERN OF A MIXTURE, AND INFORMATION STORAGE MEDIUM | |
| DE4331018C2 (en) | Procedure for the evaluation of blood samples | |
| DE102005037354A1 (en) | X-ray fluorescence analyzer, X-ray fluorescence analysis method, and X-ray fluorescence analysis program | |
| DE102014218354B4 (en) | A method of obtaining information coded in a result of an NMR measurement | |
| EP0374686B1 (en) | Method to improve correctness ans reproducibility of measured data in immunometric tests | |
| WO2018029088A1 (en) | Method for monitoring the correspondence of a beer sample with a reference beer | |
| DE10209340A1 (en) | Process for evaluating spectrograms or chromatograms as well as an analysis system and evaluation electronics for executing the process | |
| DE19830891C2 (en) | Analysis system | |
| DE102004057350B3 (en) | Method for classifying and determining the individual concentrations of a substance mixture | |
| WO2001035075A2 (en) | Method for analyzing electromagnetic spectra by means of pattern recognition | |
| DE112021002401T5 (en) | METHOD OF GENERATION OF TRAINING DATA IN AN ANALYTICAL DATA MANAGEMENT SYSTEM | |
| DE3826917A1 (en) | Method for the determination of the phosphorus content in metal coatings deposited by electroless plating | |
| WO2018196958A1 (en) | Method and arrangement for calibrating a chromatographic analysis of complex mixtures of substances, particularly respiratory gases | |
| DE102019213300A1 (en) | Method and device for quality control of a breathing measuring device and breathing measuring device |
Legal Events
| Date | Code | Title | Description |
|---|---|---|---|
| PUAI | Public reference made under article 153(3) epc to a published international application that has entered the european phase |
Free format text: ORIGINAL CODE: 0009012 |
|
| AK | Designated contracting states |
Kind code of ref document: A1 Designated state(s): AT BE BG CH CY CZ DE DK EE ES FI FR GB GR HU IE IT LI LU MC NL PL PT RO SE SI SK TR |
|
| AX | Request for extension of the european patent |
Extension state: AL HR LT LV MK |
|
| 17P | Request for examination filed |
Effective date: 20050302 |
|
| AKX | Designation fees paid |
Designated state(s): DE GB NL |
|
| 17Q | First examination report despatched |
Effective date: 20070102 |
|
| GRAP | Despatch of communication of intention to grant a patent |
Free format text: ORIGINAL CODE: EPIDOSNIGR1 |
|
| GRAS | Grant fee paid |
Free format text: ORIGINAL CODE: EPIDOSNIGR3 |
|
| GRAA | (expected) grant |
Free format text: ORIGINAL CODE: 0009210 |
|
| AK | Designated contracting states |
Kind code of ref document: B1 Designated state(s): DE GB NL |
|
| REG | Reference to a national code |
Ref country code: GB Ref legal event code: FG4D Free format text: NOT ENGLISH |
|
| REF | Corresponds to: |
Ref document number: 502004009073 Country of ref document: DE Date of ref document: 20090416 Kind code of ref document: P |
|
| PLBE | No opposition filed within time limit |
Free format text: ORIGINAL CODE: 0009261 |
|
| STAA | Information on the status of an ep patent application or granted ep patent |
Free format text: STATUS: NO OPPOSITION FILED WITHIN TIME LIMIT |
|
| 26N | No opposition filed |
Effective date: 20091207 |
|
| PGFP | Annual fee paid to national office [announced via postgrant information from national office to epo] |
Ref country code: GB Payment date: 20200923 Year of fee payment: 17 Ref country code: DE Payment date: 20200924 Year of fee payment: 17 Ref country code: NL Payment date: 20200921 Year of fee payment: 17 |
|
| REG | Reference to a national code |
Ref country code: DE Ref legal event code: R119 Ref document number: 502004009073 Country of ref document: DE |
|
| REG | Reference to a national code |
Ref country code: NL Ref legal event code: MM Effective date: 20211001 |
|
| GBPC | Gb: european patent ceased through non-payment of renewal fee |
Effective date: 20210923 |
|
| PG25 | Lapsed in a contracting state [announced via postgrant information from national office to epo] |
Ref country code: NL Free format text: LAPSE BECAUSE OF NON-PAYMENT OF DUE FEES Effective date: 20211001 |
|
| PG25 | Lapsed in a contracting state [announced via postgrant information from national office to epo] |
Ref country code: GB Free format text: LAPSE BECAUSE OF NON-PAYMENT OF DUE FEES Effective date: 20210923 Ref country code: DE Free format text: LAPSE BECAUSE OF NON-PAYMENT OF DUE FEES Effective date: 20220401 |