EP1668886B1 - Statistical self-calibrating detection and removal of blemishes in digital images - Google Patents
Statistical self-calibrating detection and removal of blemishes in digital images Download PDFInfo
- Publication number
- EP1668886B1 EP1668886B1 EP04765121A EP04765121A EP1668886B1 EP 1668886 B1 EP1668886 B1 EP 1668886B1 EP 04765121 A EP04765121 A EP 04765121A EP 04765121 A EP04765121 A EP 04765121A EP 1668886 B1 EP1668886 B1 EP 1668886B1
- Authority
- EP
- European Patent Office
- Prior art keywords
- dust
- map
- images
- image
- regions
- Prior art date
- Legal status (The legal status is an assumption and is not a legal conclusion. Google has not performed a legal analysis and makes no representation as to the accuracy of the status listed.)
- Not-in-force
Links
Images


Classifications
-
- H—ELECTRICITY
- H04—ELECTRIC COMMUNICATION TECHNIQUE
- H04N—PICTORIAL COMMUNICATION, e.g. TELEVISION
- H04N1/00—Scanning, transmission or reproduction of documents or the like, e.g. facsimile transmission; Details thereof
- H04N1/40—Picture signal circuits
- H04N1/409—Edge or detail enhancement; Noise or error suppression
- H04N1/4097—Removing errors due external factors, e.g. dust, scratches
-
- G—PHYSICS
- G06—COMPUTING; CALCULATING OR COUNTING
- G06V—IMAGE OR VIDEO RECOGNITION OR UNDERSTANDING
- G06V30/00—Character recognition; Recognising digital ink; Document-oriented image-based pattern recognition
- G06V30/10—Character recognition
- G06V30/14—Image acquisition
- G06V30/148—Segmentation of character regions
- G06V30/155—Removing patterns interfering with the pattern to be recognised, such as ruled lines or underlines
-
- H—ELECTRICITY
- H04—ELECTRIC COMMUNICATION TECHNIQUE
- H04N—PICTORIAL COMMUNICATION, e.g. TELEVISION
- H04N25/00—Circuitry of solid-state image sensors [SSIS]; Control thereof
- H04N25/60—Noise processing, e.g. detecting, correcting, reducing or removing noise
- H04N25/68—Noise processing, e.g. detecting, correcting, reducing or removing noise applied to defects
- H04N25/683—Noise processing, e.g. detecting, correcting, reducing or removing noise applied to defects by defect estimation performed on the scene signal, e.g. real time or on the fly detection
-
- G—PHYSICS
- G06—COMPUTING; CALCULATING OR COUNTING
- G06V—IMAGE OR VIDEO RECOGNITION OR UNDERSTANDING
- G06V30/00—Character recognition; Recognising digital ink; Document-oriented image-based pattern recognition
- G06V30/10—Character recognition
Definitions
- Dust has been a problem in scanning devices for a long time.
- Various aspects of the scanning process enhanced by image processing techniques where appropriate, have been employed to provide means for the detection of dust or defects relating to document or image/film scanners.
- These devices form an image by moving a ID sensor pixel array across a document platen, or in some cases, the document platen, with document/image is moved under the sensor array.
- the physics and implementation of these devices differ significantly from those of a field-based sensor or camera-style device. It is desired particularly to have dust and/or blemish detection and correction techniques for field-based or camera-style acquisition devices.
- Image correction has been studied in relation to display devices, output apparatuses such as printers, and digital sensors.
- Image correction of dust artifacts can be used to recreate missing data, also referred to as in-painting or restoration, or undoing degradation of data, which still remains in the image, also referred to as image enhancement. It is desired to have a system including a digital camera and an external device or apparatus that can facilitate defect detection and/or correction involving sophisticated and automated computerized programming techniques.
- Kitawaki a separate dust map is employed for each combination of extracted parameters relating to the optical system when said images were acquired. As such, information about dust within the optical system for one set of parameters cannot be used to correct an image acquired with another set of parameters.
- the present invention provides a method of automatically correcting dust artifact regions within images acquired by a system including a digital acquisition device characterised according to claim 1.
- Preferred embodiments include acquiring multiple original digital images with the digital acquisition device. Probabilities that certain pixels correspond to dust artifact regions within the images are determined based at least in part on a comparison of suspected dust artifact regions within two or more of the images. Probable dust artifact regions are associated with one or more values of one or more extracted parameters relating to the lens assembly of the digital acquisition device when the images were acquired.
- a statistical dust map is formed including mapped dust regions based on the dust artifact determining and associating. Pixels corresponding to correlated dust artifact regions are corrected within further digitally-acquired images based on the associated statistical dust map.
- the dust artifact probabilities may be determined by statistically combining multiple individual probabilities based on each of the regions within two or more images. Probabilities may alternatively be determined that certain pixels within the image correspond to regions free of dust based at least in part on a comparison of suspected dust artifact regions within one or more of images. Certain suspected dust artifact regions may be eliminated based on probabilities that certain pixels correspond to regions free of dust, and/or as having a determined probability below a first threshold value that the suspected region is in fact dust artifact.
- Certain further dust artifact regions may be judged as having a probability above the threshold value, such as to be subject to further probability determining including comparison with further acquired images prior to judging whether each further dust artifact region will be subject to the eliminating operation.
- There may be only a single threshold such that above the threshold, the suspected region will be judged to be subject to a dust correction operation, or a second threshold above the first threshold may be applied for that purpose, and there may be further thresholds defined within the software.
- the probability determining operation may include weighting suspected dust artifact regions according to one or more predetermined probability weighting assessment conditions. These conditions may include size, shape, brightness or opacity, feathering, or peripheral smoothness of said suspected dust artifact regions, or a degree of similarity in size, shape, brightness, opacity or location with one or more suspected dust artifact regions in one or more other images, or combinations thereof.
- the one or more extracted parameters may include aperture size, F-number, magnification, lens type, focal length of the digital acquisition device, or combinations thereof.
- the one or more extracted parameters may be calculated empirically from comparison of one or more dust artifact regions within multiple original digital images with the digital acquisition device.
- the determining and associating operations may be repeated for the further digitally-acquired images, and the statistical dust map including mapped dust regions may be updated based on the additional dust artifact determining and associating.
- the determining and associating may also be repeated for additional images acquired with the digital camera, and the statistical dust map including the mapped dust regions may be updated based on the additional dust artifact determining and associating. Pixels may be corrected corresponding to correlated dust artifact regions within the additional images based on the updated, associated statistical dust map.
- One or more of the further and original images may be updated based on the updating of the associated statistical dust map.
- the updating for the further and original images may be limited to updates that do not include appearance of new dust or movement of existing dust, and/or to updates that include previously determined dust artifact regions.
- the dust artifact probability determining may include dynamically updating the probabilities based on comparisons with suspected equivalent dust artifact regions within the further digitally-acquired images.
- the determining of probabilities is further based on a pixel analysis of the suspected dust artifact regions in view of predetermined characteristics indicative of the presence of a dust artifact region.
- the dust artifact probability determining may include determining probabilities that certain pixels correspond to dust artifact regions within acquired images based at least in part on a comparison of suspected dust artifact regions within two or more digitally-acquired images, or on a pixel analysis of the suspected dust artifact regions in view of predetermined characteristics indicative of the presence of a dust artifact region, or both.
- the probability determining may further include statistically combining probabilities based on comparisons of inner or shadow regions and of aura regions.
- the probability determining with respect to a shadow region of a dust artifact may be based on an extracted parameter-dependent shadow region analysis, wherein the shadow region analysis presumes that certain regions on a sensor of the digital image acquisition device are fully obscured by the dust.
- the probability determining with respect to an aura region of the dust artifact may be based on an extracted parameter-dependent aura region analysis, wherein the aura region analysis presumes that certain regions on a sensor of the digital image acquisition device are partially obscured by the dust.
- the aura region analysis may include calculating effects of differences in values of the one or more extracted parameters in different images of dust artifact illumination, shape, position, reflection or transmission properties, distance of dust to the sensor, aperture, exit pupil, or focal length, or combinations thereof.
- the different images may be acquired with different values of the one or more extracted parameters, and the different images may be acquired of different objects.
- the method may be performed on raw image data as captured by a camera sensor.
- the method may be performed on a processed image after being converted from raw format to a known red, green, blue representation.
- the correcting operation may include replacing pixels within one or more digitally-acquired images with new pixels.
- the correcting may include enhancing values of pixels within one or more digitally-acquired images.
- Correcting instructions may be kept in an external location, such as an image header, to the image data.
- the dust artifact probability determining operation may include loading the statistical dust map, loading extracted parameter information of a present image, performing calculations within the statistical dust map having extracted parameter variable-dependencies, and comparing dust artifact detection data with the extracted parameter dependent statistical dust map data.
- the extracted parameter information may include values of aperture size, focal length and/or lens type information.
- the dust artifact probability determining operation may also include loading the statistical dust map, loading extracted parameter information of a present image, performing a calculation for relating the statistical dust map with the present image according to a selected value of an extracted parameter which is otherwise uncorrelated between the present image and the dust map, and comparing dust artifact detection data with the now correlated statistical dust map data.
- Suspected dust artifact regions of at least two images may include inner or shadow regions and aura regions.
- the comparison may include a comparison of the inner regions and a different comparison of the aura regions, in either order.
- the dust artifact regions may include an aura region partially obscured by dust and a shadow region substantially obscured by dust inside the aura region.
- the determining with respect to an aura region may be based on an extracted parameter dependent aura region analysis, wherein the aura region analysis presumes that certain regions on a sensor of the digital image acquisition device are partially obscured by said dust.
- the aura region analysis may include calculating effects of differences in values of the one or more extracted parameters in different images on dust artifact illumination, shape, position, reflection or transmission properties, distance of dust to the sensor, aperture, exit pupil, or focal length, or combinations thereof.
- the correcting operation may include in-painting or restoration, or both.
- the in-painting correcting may be applied to the shadow region. This in-painting may include determining and applying shadow region correction spectral information based on spectral information obtained from pixels outside the shadow region.
- the restoration correcting may be applied to the aura region.
- the restoration may include determining and applying aura region correction spectral information based on spectral information obtained from pixels within the aura region.
- Dust specs The preferred embodiment takes advantage of the fact that many images may have repetitive manifestation of the same defects such as dust, dead-pixels, burnt pixels, scratches etc. Collectively, all possible defects of this nature are referred to in this application as dust-specs or dust defects. The effects of those dust specs on digital images are referred to herein as dust artifacts.
- the acquisition device may be a multi-functional electronic appliance wherein one of the major functional capabilities of said appliance is that of a digital camera.
- a digital camera a hand held computer with an imaging sensor, a scanner, a hand-set phone, or another digital device with built in optics capable of acquiring images.
- Acquisition devices can also include film scanners with area-capture CCDs, as contrasted, e.g., with a line scan mechanism.
- D-SLR Digital Single Lens Reflex Camera. A digital camera where the viewfinder is receiving the image from the same optical system as the sensor does. Many D-SLRs, as for SLR cameras, have the capability to interchange their lenses, this exposing the inner regions of the camera to dust.
- the preferred embodiments may advantageously utilize a single dust map for dust detection and/or correction techniques rather than creating a dust map for each instance of dust artifact having its own shape and opacity depending on extracted parameters relating to the imaging acquisition process.
- a single map may suffice for each lens or for multiple lenses, and for multiple focal lengths, multiple apertures, and/or other extracted parameters as described in more detail below.
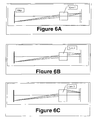
- Figure 6A, 6B and 6C represent three lenses with the same, fixed, focal distance, with the same focal number, but with different constructions.
- the first construction, in figure 6A is the most common.
- the second in figure 6B is specific for the lenses used in metrology. This type of lens is called telecentric in the image space.
- the third construction in figure 6C is rarely found in optical systems, but not impossible
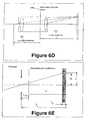
- This information about the exit pupil is usually not public because, in general, it is not useful for the common user of photographic or TV lenses. However, this information can be readily determined with some measurements on an optical bench. Alternatively, this information can be achieved based on an analysis of dust in the image.
- Figure 6E illustrates the intersections of a principal ray with the window and image plane, which is also the sensor plane. This figure illustrates the various parameters as defined in Table 1.
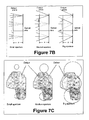
- Figure 7B illustrates the side view of the rays as obscured by a dust as a function of the aperture.
- Figure 7C illustrates the frontal projection of Figure 7B , of the rays as obscured by a dust as a function of the aperture.
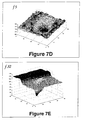
- Figure 7D and Figure 7E illustrates a power distribution map of the same dust spec as manifested in different f-stops, namely a relative open aperture f-9 for Figure 7D and a closed aperture, namely f-22 and higher, in Figure 7E .
- a relative open aperture f-9 for Figure 7D
- a closed aperture namely f-22 and higher
- the dust particle is situated in the window plane, and totally absorbing or reflecting the portion of the beam (S2) that normally reaches the image point (P).
- I(x,y) be the value of the irradiance in the image point (x , y) in the absence of the dust particle. Assuming that the energy in the exit pupil of the optical system is uniformly distributed, then, in the presence of the dust particle, the I(x,y) will be reduced proportionally with the ratio between the area of the intersection of the light beam (S1) with the clean zone of the window, and the whole area of the same intersection (Sc).
- the intersection of the conic beam with this plane is generally an ellipse.
- the major axis of this ellipse is along the intersection of the plane mentioned above and the plane determined by the image point and the optical axis of the lens.
- D the exit pupil diameter
- D f ⁇ f / #
- the fall off, or the diminished effect of the dust on an image varies as follow:
- the dust is becoming less significant as the aperture becomes larger, or the f-stop is smaller and the pixels are inversely affected based on the distance of the pixel to the periphery of the dust.
- This effect would be partly dependent on the size, overall shape distribution (round or more elongated) and the overall distribution (uniform or clumped) of the dust regions in the dust map. This can tend to be particularly helpful when a decision is to be made as to whether to eliminate certain regions. As an example, if most of the dust is determined to be aligned in a radial direction relative to the center of the sensor area for a particular camera, it may be further determined, based on this statistical information, that particles in a concentric alignment are less likely to be dust.
- h h 0 ⁇ 1 1 + t w P e ⁇ h 0 ⁇ 1 - t w P e because the ratio t w / P e is small. Note that Pe has in certain common cases a negative value.
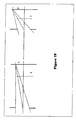
- Figure 7G depicts how points will shift as a function of the proximity to the optical center. Basically the farther the dust is from the center, the larger the displacement is. However, the direction and size of the displacements can be estimated.
- the distance, tw, of the dust to the image plane is typically fixed for a particular model of camera and can be determined from a single measurement.
- the exit pupil distance may vary depending on the focal length of the lens. More particularly, for a zoom lens, the exit pupil distance may not be fixed, and can vary up to a telecentric mode where the distance is infinity.
- Such information can be empirically predetermined by making an analysis of images taken by a known camera and lens, as illustrated in Figure 6F and as explained below.
- a determination of the effect of a single dust spec on each of a series of image can be used to calculate the effect of any other dust spec on any other image, given some additional knowledge relating to the acquisition parameters for the latter image, in particular parameters relating to the optical sub-systems of the camera and the attached lens.
- the most useful determination is of the spatial shifting of dust specs between images but other determinations relating to the geometric and optical properties of a dust spec can be made from the foregoing optical model.
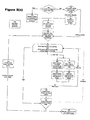
- FIG. 1 The main workflow of detecting and removing the dust from an image is illustrated in Figure 1 .
- this particular preferred embodiment is directed at removing dust from a collection of images acquired using the same image acquisition device.
- a user may acquire a picture on the digital camera (as illustrated in Block 101).
- a user may open a single image on a external device such as a personal computer, open (103) a folder of images on an external device or open a collection of images on a digital printing device (104).
- the preferred embodiment then extracts the shooting parameters (120).
- parameters include, but not limited to data about: Camera name, Lens brand, lens type, focal length at acquisition, aperture range, aperture at acquisition.
- some parameter, in particular from those relating to the lens and the camera may be also stored within the acquisition device or the processing device, or subsystems thereof.
- Such information may include parameters such as exit pupil, exit pupil distance from the lens, or distance of dust from the sensor plane (imaging plane) for the camera.
- Table 2 Extracted Parameters Field Example of data Category Lens Manufacturer Nikon lens Lens Type AF 24mm-45mm f2.8-f3.5 lens Focal Length 38mm Acquisition data Aperture f-16 Acquisition data Dust distance 0.156mm Camera data Exit pupil 19mm Lens data Exit pupil distance 230mm Lens data
- the dust map may also include meta-data that contain additional parameters or acquisition data which can additionally supplement or partially substitiute for said list of extracted parameters.
- additional parameters or acquisition data which can additionally supplement or partially substitiute for said list of extracted parameters.
- the correlation process is interchangeable and may be achieved either by adjusting the image to the map or, conversely, adjusting the map to the image.
- this process (300) as called by (130) may be used to adjust the map onto a new map, or to merge two preexisting maps into a single one. From that stage onwards the system may continue with a single map.
- a new dust map is created (200).
- the preferred embodiment checks if the dust specs as defined in the dust map are of high enough confidence levels to be determined as dust regions (150). The determining and calculating of said confidence level for the dust map in general and for an individual dust spec, is further discussed in Figures 2 and Figure 3 . If the confidence level is low, the image is added to the updating of the dust map (200). If after the image is added, the confidence level is increased sufficiently (152) the software continues to the dust removal process (160). Otherwise, the software progresses to the next image (170).
- a dust map is considered valid only after a minimum number of images, say N, are analyzed, and a dust spec is considered valid after a co-located dust region is detected in a second minimum number of images, say M.
- M a second minimum number of images
- the software may have determined and confirmed the existence of a substantial number of dust specs and updated the dust map accordingly (200), but it must continue to analyze additional images, 2 more in this example, in order to validate the dust map, and allow the software to proceed to the correction (160) stage. Prior to achieving said validation of the dust map no correction will be done. However, images can be corrected retrospectively after the dust map has been validated. Thus even images that were originally acquired prior to validation of the dust map may be corrected.
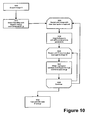
- the dust detection and correction process (160). This process may be executed as a loop on every dust spec in the dust map, with a stage of detection and correction (400, followed by 500 and 160). Alternatively, the process can be implemented where all dust specs are detected first (162) and then all dust specs are corrected (164). The decision as to the sequence of operations varies based on the requirements of a particular embodiment of the invention. As part of the detection process, the software also performs a self testing (500) where each new image introduced is compared to the dust map. This process is further defined in Figure 5 .
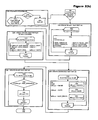
- This process can receive a collection of images as defined by Figure 1 blocks 103 and 104, or one image at a time, as defined by Figure 1 , blocks 101 and 102.
- an initial step is to define if there are more than enough images for defining the map (220). This step is designed to optimize the creation process for a dust map in case there are a large number of images.
- the sequence of the images that are to be referenced is based on the original collection of N images as defined in Figure 1 blocks 103 or 104.
- the sequence of images is based on a few criteria such as: giving more weight to the most recently acquired images, and if images are shot in a relatively small time frame, the sequence in which images are processed in order to create the dust map is determined so as to try and minimize repetitiveness between similar images that may have been taken of the same object with little movement.
- the sequence will not be limited to the number of images (HIDP) because it may well be that some regions will not have enough data in them to evaluate and validate dust specs within said region. This may happen in cases where part of the image is very dark in some of the images.
- Another criteria for creating a new set or checking for new dust is the type of lens. If a lens is changed, it means that the CCD-cavity was potentially exposed to new dust. This may trigger a new revalidation process. It may also indicate that the camera was serviced, or that the photographer cleaned the camera. Of course, if there is a parameter that defines when a camera was serviced, this will trigger the creation of a new dust map.
- the next loop (270-271) defines the marking of each region and the addition of the region to the dust map if it is not already there.
- regions in an image There are three type of regions in an image. The first are regions with sufficient information to determine whether they are of dust nature. As an illustrative example, small dark regions surrounded by a light and relatively large and homogenous background area. Other criteria may include regions with a relatively low color saturation.
- the second group are regions that are definitely non-dust. Such regions are for example all clear, or of high color saturation. Other regions are inconclusive such as very dark segments of an image. In this latter case, it will be hard to detect the dust even if it was part of the image. Alternatively when looking for over exposed or "dead pixels" the criteria may be reversed, if the pixels appear as a white spec in the image.
- Regions that are potentially dust are marked (292) and then added to the dust mask (294).
- the addition process may include the creation of a new dust spec region on the map, or the modification of the probability function, or the confidence level, or the size or geometric shape, or location of the centre of an existing region. Regions that are most likely non-dust are marked (282) and then added to the dust mask (284).
- the addition and/or modification of said regions needs to be normalized to the shooting conditions as defined by the dust map (300), if this step was not performed prior to entering this function, as optionally defined in Figure 1 .
- This loop continues over all regions of the image (271).
- each region is compared (500) with the dust map to see if any cases exist where the monotonicity is broken, i.e. a region that was of high probability to be dust is now non dust.
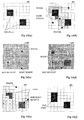
- FIGs 13(a)-(c) An illustrative example of how the dust map creation/updating process of Fig 2(a) can create new dust or non-dust pixels in the dust map is given in Figs 13(a)-(c) .
- the diagrams show how the increasing of the values of f(hdp) or f(ndp) produces a new YD (Dust) pixel or a new ND (Non Dust) pixel respectively, when the thresholds p(Hdp) and p(Ndp) are eventually exceeded as illustrated in Fig 13(c) .
- FIG. 1210 describes the preparation of the dust map which includes either opening an existing map (1216) or creating a new one (1214), where all pixels as a starting point are non dust or WHITE. After the map is correlated to the shooting conditions, 300, a dust map 1-dM is created in block 1220. All pixels in the image (1222) receive the following values (1224) based on the luminance value of the pixel:
- FIGs 14(a)-(f) An additional illustrative example of how the alternative dust map creation/updating process of Fig 2(b) can create or remove dust specs is given in Figs 14(a)-(f) . It is assumed that before the current image is loaded, the pM and dM maps have the aspect depicted in diagrams 14(a) and 14(b) respectively. Note that pM is a binary map, whereas dM is a multilevel (continuous) dust map. After the current image goes through the 1220 block of Fig 2(b) , the resulting I-dM has the aspect illustrated in Fig 14(c) - a three-level, or trinary, map.
- the I-pM map depicted in Fig 14(d) is obtained - also a trinary map.
- the values are decremented by a statistical quanta "quanta” as specified in block 1240 of Fig 2(b) .
- the aspect of the resulting dM' map is similar to that of Fig 14(b) , except that the actual values of the "MAYBE DUST" pixels which are, consequently, smaller.
- a thresholding dM' (block 1250 of Fig 2(b) ) the new pM' map is obtained as illustrated in Fig 14(f) .
- Figure 3 illustrates the process of correlating the image to a default settings of the dust map.
- This process defines correlating the image to the dust map, the dust map to a new dust map or the dust map to the image.
- Said correlation processes are interchangeable and can be done by adjusting the image to the map or adjusting the map to the image. In some cases both acquired image and dust map may be adjusted to some common ground as was previously described..
- the dust map is being loaded (112) and the default data on which the map was generated is extracted (310).
- data may include the lens type, the aperture and the focal length associated wit the default state.
- the information from the acquired image (304) is extracted (320) and compared to the one of the dust map.
- the two principle adjustments between the dust map and the image are based on focal length, and on aperture, each creating a different artifact that should be addressed.
- Knowledge of the phenomena may assist in creating a better detection and correction of the dust artifact.
- analysis of the image and the modification of the dust as aperture and focal length are changed may be used to construct an empirical model that describes transformations that define changes to the dust as a function of changes in the lens type, the focal length and the aperture. This latter approach is particularly useful in the determination of non-distortions which may occur for certain lens geometry's.
- FIG. 7A-7E The mathematical distortion of the dust as a function of the aperture is illustrated in figures 7A-7E .
- the geometrical optics illustrations of the above phenomena are depicted in Figures 6A-6F .
- the following step is modification of the map and or the image based on focal length (900), and based on aperture (800).
- the following steps are further defined in Figure 9 and Figure 8 respectively.
- the image and the Dust Map are considered to be correlated.
- the correlated map cM is no longer binary because it defines both the shift and the fall off which is continuous.
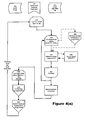
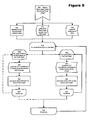
- Figure 4A (400) defines the process of detecting and removing the dust from the image.
- the input which is the image I is loaded, if it is not already in memory (404) and the correlated dust map is cM is loaded (402) if already not in memory.
- an image enhancement algorithm is performed on the pixels (430).
- the pixels before being operated on may be send for validation (500) as described in Figure 5 .
- the second portion of the image correction is the restoration or the in-painting (450).
- the area behind the dust has no relevant data to enhance, or if there is, this data is relatively close to the overall noise level and thus can not be enhanced. Therefore, it is necessary to in-paint every pixel based on an analysis of the surrounding region to the dust (470).
- the enhancement regions as defined in block 430 are of good quality, those pixels as well may contribute to the in-painting.
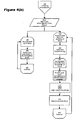
- FIG. 4B illustrates a certain embodiment of the in-painting process.
- each pixel in the obscured region, 480 is to be filled, 482, based on its surrounding pixels.
- the pixels are filled in based on information of the surrounding non-affected pixels.
- This specific algorithm takes into account that pixels closer to the periphery have a better chance to be anticipated by the external pixels. Therefore the in-painting proceeds from the outside inwards, typically on a spiral path.
- FIG. 4D An algorithm that works on the periphery moving inwards, as defined in Figure 4B blocks 470 is depicted in Figure 4D as follows: In the first step all peripheral pixels, numbered from 1 to 20 are being operated on as defined in Figure 4B , block 474. After that, all of the above mentioned twenty pixels, as defined in Figure 4F Block 1460 are removed, according to block 476 of Figure 4B , from the region leaving a smaller dust spec of shape 1470. This modified dust spec, has a different set of peripheral pixels numbered 21-33. After removing those pixels by the in painting process, block 476, a smaller dust kernel as depicted in 1480 is left with only three pixels 34, 35 and 36. The process of filling in the pixels need not be spiral.
- FIG. 4C An illustration of this is given in figures 4C , 4D and 4E .
- the same dust 1400 as in figure 4F with the bounding box 1420 on a grid 1410 is obscuring a picture including high frequency data such as the letter A, 1440.
- each pixel receives the average value between the black and white regions. This is depicted in figure 4e .
- the pixels 1490 and its surrounding 8 pixels 1491, 1492, 1493, 1494, 1495, 1496, 1497, 1498 have a digital value of 210, 220, 48, 35, 145, 180, 253, 245 and 250 respectively. It is clear that the best value of pixel 1490 will come form its surrounding pixels with the smallest gradient. Because in practice the value of pixel 1490 can not be determined, but is the center of the in painting, the value of the gradient will be based on the value of the gradients of the pixels around it and extrapolated to this pixel. In this specific example, the differential horizontal gradient between pixels 1497 and 1493, is the largest while the vertical gradient of 1495 and 1491 will most likely be the same. Therefore, a preferred value of 210 will be based on the extrapolated average of the two gradients of its top and bottom pixels.
- the correction of the image should take that information into account, to prevent over-correction of the dust artifact.
- the acquisition information and the corresponding dust map default setup are extracted in blocks 326 and 312 respectively. Then, for each dust spec in the map 810, the size of the region that is still obscured by the dust is calculated, as defined by the mathematical model. In some cases, when the aperture is very open, this region may decline to 0. In others, where the aperture is almost fully closed, the size may be close to the size of the dust.
- this step, 820 may be implemented as part of a preparation step, and recorded in a database, or LUT.
- the process then splits in two.
- the fully obscured region will be marked in 834 pixel by pixel 832 in a loop 834, 835 and will be treated by the in-painting process as defined in Figure 4B .
- a semi opaque dust map is created in the loop 840, 841 for each pixel.
- Each of the pixels 842 is assigned an OPACITY value 844, based on the mathematical model as described previously in Figures 7A-7E .
- a dust spec that is only partially attenuated will go through a inverse filtering of the image data within a region of the image corresponding to said dust spec, as described in Figure 4 block 430, with a specific embodiment in block 432.
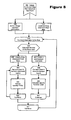
- Figure 9 describes the adjustment of the Dust Map based on the Focal length, and the specific lens.
- the scientific background is explained in figures 6F , 7F .
- the spatial shift of a dust spec as a function of focal length for a specific lens is a function of (equation 11) the thickness of the window- tw, which is constant for a given camera, and exit pupil position, Pe, which varies based on the lens system and a variable focal length in the case of case of a zoom lens.
- the pertinent information is loaded, as described in Figure 3 , namely the focal lens and lens type of the camera, 326, the focal length and lens type in the dust map 312 and the camera distance of dust to the sensor 318.
- a proposed embodiment relies on the fact that when a dust is found, a pattern matching can be applied to find the shift in the dust. Based on this information, t w P e can be calculated as defined in Equation 11-a. If t w is known then Pe can be calculated as recited in equation 11-b. Specifically, in a preferred embodiment, an image is acquired, 1010 and a dust map is calculated 1012. A second image is captured, 1030 with a different focal length than the first image, and a dust map is calculated 1012. The process repeatedly tries to find two dust spots in the two dust maps 1040. If no dust specs are correlated the process is repeated for consecutive images, 1020. The process of finding dust specs is calculated by applying a local correlation to each of the dust specs.
- Equation 11-a the further the dust is from the center, the better the precision is.
- the disparity between the specs is calculated 1042.
- the ratio between the shifted pixels is calculated. This ratio is the numerical empirical estimation of t w /P e in equation 11-a.
- the Exit pupil of the lens can be calculated based on the same equation.
- Figure 11 defines the process of estimating based on empirical data the values of the parameters in the formulae that defines the change in dust as a function of change in aperture
- the process is similar to the one described for estimation of the focal length, albeit the fact that the parameters calculated are different.
- a first image is acquired, 1110 and dust is detected, 1120 in this image. If the image is not appropriate for detecting the dust, or if the probability is low for the dust regions, this image is rejected for this purpose and another image is chosen.
- a second image is captured 1140, or alternatively a set of images 1130, all with varying aperture, to enable acceptable sampling set. The process then looks for a detected dust region with high level of probability.
- the process can search for dust regions in the same coordinates that the original image dust regions were found.
- the dust regions of the two or more images are correlated, 1160.
- the process continues for a sufficient amount of dust regions, 1168, which in some cases can even be a single one, and sufficient amount of images, 1169, which can also be, depending on the confidence level, a single image.
- the fall off due to the change of aperture is calculated, 1172, on a pixel by pixel basis, 1170, for every pixel in a dust region, 1179. Based on this information, the fall off function is calculated. 1180.
- the fall off function is determined as a function of the distance of a pixel from the periphery of the dust, as well as the aperture.
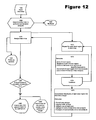
- the dust specs may also be determined by trying to correlate the dust spec in the map to the acquired image. Such correlation can be performed within a reasonable window size or even on the diagonal line between the dust and the center of the optical path, in the direction that the dust may move. By gaining knowledge on the movement of a single dust spec, as explained in formulae 11-a, all other dust specs shift can be determined. It is also possible to determine whether the camera should be physically cleaned based on analysis of the dust in the camera and the specific dust patterns. This is illustrated in the flowchart of figure 12 . An example will be that certain width of dust will not allow correct in-painting based on the surround. Another example will be the overall number of dust specs or the overall relative area that the dust covers.
- the input for such analysis is a dust map, 1200.
- This map can be similar to the dust map generated in block 200, or any other representation of a dust map or a calibration map, generated automatically or manually by the photographer.
- Such analysis need not be performed for every image.
- a process, 1260 determines whether to perform such analysis. Examples to trigger this process are the time since the last analysis, change of lenses, which may create the introduction of dust, or a message from the quality control analysis of the dust map, as defined in Figure 5 block 500, that the dust has shifted or that the dust no longer corresponds to the map. In general, any changes in the dust structure may be a justification to trigger the analysis process.
- the process terminates. Otherwise, the analysis is performed, 1270.
- the analysis is performed for each dust spec individually, 1272, and then the results are accumulated for the whole image.
- some parameters are extracted, including, but not limited to the area of a dust region; maximum width of a dust region; the distance between dust regions and neighboring regions; the relative movement of dust regions from the last analysis; the occurrence of new dust specs since the last analysis, etc.
- the results are statistically analyzed and summarized to include such data as - the nmber of dust specs, the area of dust, in size and in percentage for the entire image; the largest width of dust; the largest area of a dust spec; changes in area of dust since last analysis and changes of dust particles since last analysis.
- this analysis may be displayed or saved in a log file for future reference, 1221.
- Each of the aforementioned criteria may have at least one acceptable threshold value. This threshold value is determined empirically by the manufacturer in terms of the maximum acceptable dust that can be corrected in software. Alternatively, this data may be adjusted to by the photographer based on their tolerance level for dust artifacts. If any of the parameters exceeds an acceptable threshold, the user is informed, 1290, that the camera should be manually maintained and cleaned.
- this same process may be used as a tool to inform the user of changes in the dust.
- Such information is particularly important in the case that the dust correction algorithm is based on the creation of a calibration image. In this case, the analysis will be used to inform the user that a new calibration image should be acquired to support the correction of dust in future images.
- the process of analysis described above may also be incorporated in a maintenance procedure, where the camera, after being cleaned up will perform an auto-test, as described in Figure 12 , to verify that the camera now is indeed clean.
- the threshold parameters are of course substantially more restrictive and demanding, to assure high quality maintenance.
- the unique location of the actual dust relative to the object and to the image plane provide information about extracted parameter-dependent characteristics of dust artifact in the images. It is possible to make determinations as to where the dust actually is in the system by analyzing multiple images taken with different extracted parameters, e.g., on the sensor window, or in an image of an original object which itself is being imaged such as in film imaging. Techniques may be also employed involving correcting for dust defects based on the geometry of said dust or of the camera.
- a method may include analyzing the images in comparison to a predetermined dust map to establish the validity of the dust over progressions of time.
- the method may further involve mapping the acquired image to a predetermined default acquisition condition as a function of the lens type and the focal length that was used at acquisition.
- a method may further include mapping a dust spec as depicted in the dust map and the suspected dust specs in the acquired image based on a calculated transformation of the dust as a function of the lens and the aperture, or other extracted parameters used to acquire the image.
- a dust detection and/or correction technique may be applied post priori to a collection of images, or individually to images as they are added to a collection.
- the map may be generated a priori to the introduction of an image, or dynamically and in concurrence to the introduction of new images.
- the method may further include steps of providing a statistical confidence level as to the fact that a certain region is indeed part of a dust spec.
- the method may further provide tools to determine whether the acquisition device may benefit from some maintenance.
- a method of automatically determining whether to recommend servicing a digital image acquisition system including a digital camera based on dust analysis may be advantageously employed.
- the operations have been described in selected typographical sequences. However, the sequences have been selected and so ordered for typographical convenience and are not intended to imply any particular order for performing the operations, unless a particular ordering is expressly provided or understood by those skilled in the art as being necessary.
Abstract
Description
- This invention related to digital photography and in particular, automated means of removing blemish artifacts from images captured and digitized on a digital process.
- Many problems are caused by dust in particular and blemishes in general on imaging devices in general and digital imaging devices in particular. In the past, two distinct forms of image processing included providing means to detect and locate dust, scratches or similar defects and providing means to remedy the distortions caused by the defects to an image. It is desired to have an advantageous system can automatically detect and correct for the effects of dust, scratches and other optical blemishes.
- Dust has been a problem in scanning devices for a long time. Various aspects of the scanning process, enhanced by image processing techniques where appropriate, have been employed to provide means for the detection of dust or defects relating to document or image/film scanners. These devices form an image by moving a ID sensor pixel array across a document platen, or in some cases, the document platen, with document/image is moved under the sensor array. The physics and implementation of these devices differ significantly from those of a field-based sensor or camera-style device. It is desired particularly to have dust and/or blemish detection and correction techniques for field-based or camera-style acquisition devices.
- Image correction has been studied in relation to display devices, output apparatuses such as printers, and digital sensors. Image correction of dust artifacts can be used to recreate missing data, also referred to as in-painting or restoration, or undoing degradation of data, which still remains in the image, also referred to as image enhancement. It is desired to have a system including a digital camera and an external device or apparatus that can facilitate defect detection and/or correction involving sophisticated and automated computerized programming techniques.
-
US 2002/0093577, Kitawaki et al discloses a method of automatically correcting dust artifact regions within images according to the pre-characterizing portion ofclaim 1. - However, in Kitawaki, a separate dust map is employed for each combination of extracted parameters relating to the optical system when said images were acquired. As such, information about dust within the optical system for one set of parameters cannot be used to correct an image acquired with another set of parameters.
- The present invention provides a method of automatically correcting dust artifact regions within images acquired by a system including a digital acquisition device characterised according to
claim 1. Preferred embodiments include acquiring multiple original digital images with the digital acquisition device. Probabilities that certain pixels correspond to dust artifact regions within the images are determined based at least in part on a comparison of suspected dust artifact regions within two or more of the images. Probable dust artifact regions are associated with one or more values of one or more extracted parameters relating to the lens assembly of the digital acquisition device when the images were acquired. A statistical dust map is formed including mapped dust regions based on the dust artifact determining and associating. Pixels corresponding to correlated dust artifact regions are corrected within further digitally-acquired images based on the associated statistical dust map. - The dust artifact probabilities may be determined by statistically combining multiple individual probabilities based on each of the regions within two or more images. Probabilities may alternatively be determined that certain pixels within the image correspond to regions free of dust based at least in part on a comparison of suspected dust artifact regions within one or more of images. Certain suspected dust artifact regions may be eliminated based on probabilities that certain pixels correspond to regions free of dust, and/or as having a determined probability below a first threshold value that the suspected region is in fact dust artifact.
- Certain further dust artifact regions may be judged as having a probability above the threshold value, such as to be subject to further probability determining including comparison with further acquired images prior to judging whether each further dust artifact region will be subject to the eliminating operation. There may be only a single threshold such that above the threshold, the suspected region will be judged to be subject to a dust correction operation, or a second threshold above the first threshold may be applied for that purpose, and there may be further thresholds defined within the software.
- The probability determining operation may include weighting suspected dust artifact regions according to one or more predetermined probability weighting assessment conditions. These conditions may include size, shape, brightness or opacity, feathering, or peripheral smoothness of said suspected dust artifact regions, or a degree of similarity in size, shape, brightness, opacity or location with one or more suspected dust artifact regions in one or more other images, or combinations thereof.
- The one or more extracted parameters may include aperture size, F-number, magnification, lens type, focal length of the digital acquisition device, or combinations thereof. The one or more extracted parameters may be calculated empirically from comparison of one or more dust artifact regions within multiple original digital images with the digital acquisition device.
- The further digitally-acquired images may include different images than the originally acquired images, and may further include one or more of the same original images. The different images may be acquired with different values of one or more extracted parameters, they may be acquired of a different object or objects or of a different scene or scenes.
- The determining and associating operations may be repeated for the further digitally-acquired images, and the statistical dust map including mapped dust regions may be updated based on the additional dust artifact determining and associating. The determining and associating may also be repeated for additional images acquired with the digital camera, and the statistical dust map including the mapped dust regions may be updated based on the additional dust artifact determining and associating. Pixels may be corrected corresponding to correlated dust artifact regions within the additional images based on the updated, associated statistical dust map. One or more of the further and original images may be updated based on the updating of the associated statistical dust map. The updating for the further and original images may be limited to updates that do not include appearance of new dust or movement of existing dust, and/or to updates that include previously determined dust artifact regions.
- A version description may be created of changes in the statistical dust map. One or more of the further and original images may be updated based on the updating of the associated statistical dust map based on the version description. The version may be based on a chronological time stamp, and/or replacement of a lens. Version information may include a change of probability in the statistical dust map that certain pixels correspond to dust artifact regions. The version information may include one or more parameters including a change in dust location, change in dust position, appearance of a new dust region, and/or a disappearance of an existing dust region. A determination may be made as to whether a dust map is to be replaced based on determining that sufficient disparity exists based on an amount and/or quality of changes in the statistical dust map.
- The image correction method may be automatically performed within a digital camera that includes an optical system, a sensor array, processing electronics and a memory. The image correction method may also be performed at least in part within an external processing device that couples with a digital camera that includes the optical system and the sensor array to form a digital image acquisition and processing system that also includes the processing electronics and the memory. The programming instructions may be stored on a memory within the external device which performs the image correction method. The digital acquisition device may capture images from film images, and the digital acquisition device may include a digital camera.
- The dust artifact probability determining may include dynamically updating the probabilities based on comparisons with suspected equivalent dust artifact regions within the further digitally-acquired images. The determining of probabilities is further based on a pixel analysis of the suspected dust artifact regions in view of predetermined characteristics indicative of the presence of a dust artifact region. The dust artifact probability determining may include determining probabilities that certain pixels correspond to dust artifact regions within acquired images based at least in part on a comparison of suspected dust artifact regions within two or more digitally-acquired images, or on a pixel analysis of the suspected dust artifact regions in view of predetermined characteristics indicative of the presence of a dust artifact region, or both.
- The probability determining may further include statistically combining probabilities based on comparisons of inner or shadow regions and of aura regions. The probability determining with respect to a shadow region of a dust artifact may be based on an extracted parameter-dependent shadow region analysis, wherein the shadow region analysis presumes that certain regions on a sensor of the digital image acquisition device are fully obscured by the dust. The probability determining with respect to an aura region of the dust artifact may be based on an extracted parameter-dependent aura region analysis, wherein the aura region analysis presumes that certain regions on a sensor of the digital image acquisition device are partially obscured by the dust. The aura region analysis may include calculating effects of differences in values of the one or more extracted parameters in different images of dust artifact illumination, shape, position, reflection or transmission properties, distance of dust to the sensor, aperture, exit pupil, or focal length, or combinations thereof. The different images may be acquired with different values of the one or more extracted parameters, and the different images may be acquired of different objects.
- The method may further include validating whether a further digitally-acquired image has non-contradicting data that the probability that certain pixels correspond to dust artifact regions within the image prior to correcting pixels corresponding to correlated dust artifact regions within the images based on the associated statistical dust map. The user may be instructed to create a new dust map if the validating determines a noticeable change in the dust map. The shadow region analysis may include calculating effects of differences in values of the one or more extracted parameters in different images on dust artifact illumination, shape, position, reflection or transmission properties, distance of dust to the sensor, aperture, exit pupil, or focal length, or combinations thereof.
- Suspected dust artifact regions of the further digitally images may include inner or shadow regions and aura regions. Focal length extracted parameters may be calculated empirically from comparison of the transposition of inner or shadow regions of dust artifact regions within multiple original digital images acquired with the digital acquisition device. Aperture extracted parameters may be calculated empirically from comparison of fall off of aura regions of the dust artifact regions within the multiple original digital images acquired with the digital acquisition device. The correcting may include a first correcting of the aura regions and a second correcting of the inner regions, in either order.
- The method may be performed on raw image data as captured by a camera sensor. The method may be performed on a processed image after being converted from raw format to a known red, green, blue representation. The correcting operation may include replacing pixels within one or more digitally-acquired images with new pixels. The correcting may include enhancing values of pixels within one or more digitally-acquired images. Correcting instructions may be kept in an external location, such as an image header, to the image data.
- The dust artifact probability determining operation may include loading the statistical dust map, loading extracted parameter information of a present image, performing calculations within the statistical dust map having extracted parameter variable-dependencies, and comparing dust artifact detection data with the extracted parameter dependent statistical dust map data. The extracted parameter information may include values of aperture size, focal length and/or lens type information. The dust artifact probability determining operation may also include loading the statistical dust map, loading extracted parameter information of a present image, performing a calculation for relating the statistical dust map with the present image according to a selected value of an extracted parameter which is otherwise uncorrelated between the present image and the dust map, and comparing dust artifact detection data with the now correlated statistical dust map data.
- Suspected dust artifact regions of at least two images may include inner or shadow regions and aura regions. The comparison may include a comparison of the inner regions and a different comparison of the aura regions, in either order. The dust artifact regions may include an aura region partially obscured by dust and a shadow region substantially obscured by dust inside the aura region.
- The determining with respect to a shadow region may be based on an extracted parameter dependent shadow region analysis, wherein the shadow region analysis presumes that certain regions on a sensor of the digital image acquisition device are substantially obscured by said dust. The shadow region analysis may include calculating effects of differences in values of the one or more extracted parameters in different images on dust artifact illumination, shape, position, reflection or transmission properties, distance of dust to the sensor, aperture, exit pupil, or focal length, or combinations thereof.
- The determining with respect to an aura region may be based on an extracted parameter dependent aura region analysis, wherein the aura region analysis presumes that certain regions on a sensor of the digital image acquisition device are partially obscured by said dust. The aura region analysis may include calculating effects of differences in values of the one or more extracted parameters in different images on dust artifact illumination, shape, position, reflection or transmission properties, distance of dust to the sensor, aperture, exit pupil, or focal length, or combinations thereof.
- The correcting operation may include in-painting or restoration, or both. The in-painting correcting may be applied to the shadow region. This in-painting may include determining and applying shadow region correction spectral information based on spectral information obtained from pixels outside the shadow region. The restoration correcting may be applied to the aura region. The restoration may include determining and applying aura region correction spectral information based on spectral information obtained from pixels within the aura region.
-
-
Figure 1 illustrates a main workflow of a dust removal process in accordance with a preferred embodiment. -
Figure 2A illustrates the creation of a dust map. -
Figure 2B illustrates an alternative embodiment of the creation of a binary dust map. -
Figure 3 outlines a correlation of a dust map to image shooting parameters. -
Figure 4A illustrates a procedure for removing dust from images in accordance with a preferred embodiment. -
Figure 4B illustrates reconstruction in-painting of dust regions. -
Figure 4C illustrates the occurrence of dust in a picture with high edge information. -
Figures 4D-4E illustrate the numerical gradient in an image. -
Figure 4F illustrates a spiral procedure of in-painting from the periphery inwards. -
Figure 5 illustrates a quality control method of checking the dust map. -
Figures 6A-6F represents an optical geometry of a lens that may be used in accordance with a preferred embodiment: -
Figures 6A, 6B and 6C represent three lenses with the same, fixed, focal distance, with the same focal number, but with different constructions. -
Figure 6D illustrates the concept of an exit pupil and the distance to it. -
Figure 6E illustrates the intersections of the principal ray with window and image plane, which is preferably approximately the sensor plane. -
Figure 6F illustrates the shift of one dust spec in comparison to a shift of another dust spec in an image. -
Figures 7A-7G generally illustrate effects of dust on the creation of an image using a known optical system: -
Figure 7A illustrates an influence of a dust particle located on the input surface of the window on the beam converging towards the imaging point. -
Figure 7B illustrates a side view of the rays as obscured by dust as a function of the aperture. -
Figure 7C illustrates a frontal projection of the rays as obscured by a dust as a function of the aperture. -
Figure 7D and Figure 7E illustrate a power distribution map of the same dust spec as manifested in different f-stops. -
Figure 7F illustrates an effect of the change in focal length on the area obscured by the dust. -
Figure 7G illustrates the direction of movement of dust as a function of the change in focal length in relation to the center of the optical axis. -
Figure 8 illustrates an adjustment of the dust map based on aperture. -
Figure 9 illustrates an adjustment of a dust map based on focal length. -
Figure 10 illustrates a process of estimating based on empirical data the values of the parameters in the formulae that defines the change in dust as a function of change in focal length. -
Figure 1 1 illustrates a process of estimating based on empirical data the values of the parameters in the formulae that defines the change in dust as a function of change in aperture. -
Figure 12 illustrates a further process of dust analysis in accordance with another embodiment. -
Figure 13 illustrates how a portion of the dust map is created/updated based on the process described inFigure 2(a) . -
Figure 14 illustrates how a portion of the dust map is created/updated based on the alternative process described inFigure 2(b) . - Dust specs: The preferred embodiment takes advantage of the fact that many images may have repetitive manifestation of the same defects such as dust, dead-pixels, burnt pixels, scratches etc. Collectively, all possible defects of this nature are referred to in this application as dust-specs or dust defects. The effects of those dust specs on digital images are referred to herein as dust artifacts.
- Acquisition device: the acquisition device may be a multi-functional electronic appliance wherein one of the major functional capabilities of said appliance is that of a digital camera. Examples can include a digital camera, a hand held computer with an imaging sensor, a scanner, a hand-set phone, or another digital device with built in optics capable of acquiring images. Acquisition devices can also include film scanners with area-capture CCDs, as contrasted, e.g., with a line scan mechanism.
- D-SLR: Digital Single Lens Reflex Camera. A digital camera where the viewfinder is receiving the image from the same optical system as the sensor does. Many D-SLRs, as for SLR cameras, have the capability to interchange their lenses, this exposing the inner regions of the camera to dust.
- A few parameters are defined as part of the process:
- N
- Number of images in a collection.
- HIDP
- Number of images for occurrence to be high dust probability
- HSDP
- Number of recurring specs for label a region to be high dust probability
- p(Hdp)
- Probability threshold for high confidence of a dust spec.
- N dp
- Number of images to determine that a region is not dust
- p(Ndp)
- Probability threshold to determine that a region is not a dust region.
-
- I
- is a generic image
- I(x,y)
- pixel in location x horizontal, y vertical of Image I
- dM
- is a continuous tone, or a statistical representation of a dust map
- pM
- is a binary dust map created from some thresholding of dM.
- Prior to understanding the preferred embodiments described herein, it is helpful to understand the mathematical modeling of the camera optical system. With this modeling, the preferred embodiments may advantageously utilize a single dust map for dust detection and/or correction techniques rather than creating a dust map for each instance of dust artifact having its own shape and opacity depending on extracted parameters relating to the imaging acquisition process. With an ability to model the optical system and its variability, a single map may suffice for each lens or for multiple lenses, and for multiple focal lengths, multiple apertures, and/or other extracted parameters as described in more detail below.
- In order to study the shadow of an object on a plane, it is helpful to consider the following:
- the illumination of the object (the spectral and coherent characteristics of the light)
- the shape of the object (including its micro-geometry)
- the reflection and transmission properties of the object
- the relative position of the object and the plane
- The case of interest for defining the model of dust as it appears on the sensor, is that of an object close to the image plane of a lens, which is a complex optical system, with natural light illumination. The object shape and its reflection and transmission properties are practically impossible to model because specific information on the dust particle(s) is not available. However, because the dust particles are small, it is highly probable they will have the same reflection and transmission properties on their surfaces. The distance between the dust and the sensor (which lies in the image plane) is small and is in the order of magnitude of a fraction of a millimeter.
- Some definitions are now provided (see
figures 6E and6F ):Table 1. Parameters in mathematical formulation of the Optical system. Pe - exit pupil position, the distance between the sensor, and the Exit Pupil tw - thickness of the window, distance of dust to the image plane f- focal length of the objective f/#- focal number (u,v) - denote the coordinate system of the input surface, having its origin in the intersection point with the lens optical axis. (x,y)- the dust position on the image plane in the coordinate system in the image plane with the origin in the intersection point with the lens optical axis. I(x,y)- be the value of the irradiance in the image point (x, y) D - is the exit pupil diameter h0 is the distance of the objects on the dust plane to the center of the optical path h is the distance from the object to the center of the optical axis hk is the distance of dust spec k on the dust plane to the center of the optical path -
Figure 6A, 6B and 6C represent three lenses with the same, fixed, focal distance, with the same focal number, but with different constructions. The first construction, infigure 6A is the most common. The second infigure 6B is specific for the lenses used in metrology. This type of lens is called telecentric in the image space. The third construction infigure 6C is rarely found in optical systems, but not impossible -
Figure 6D illustrates the concept of an exit pupil and the distance to it. The exit pupil distance, 642, is the parameter that defines this property, and represents the distance from the secondary principal plane, 646, of the lens and the intersection of the axis of the light cone and optical axis of the lens. Thefocal distance 644 represents the distance from the secondary principal plane to the image plane. - In the case of the second type lens, as defined in
Figure 6B , the exit pupil position is at infinity. In the first and third cases,figures 6A and 6C respectively, the intersections of the light cone with the dust plane are ellipses. In the case of the second lens type,Figure 6B , the intersection of the light cone with the dust plane is a circle. - In the case of zoom lenses, the exit pupil position can be constant (in a very few cases), or can vary significantly, depending on the construction of the lens.
- This information about the exit pupil is usually not public because, in general, it is not useful for the common user of photographic or TV lenses. However, this information can be readily determined with some measurements on an optical bench. Alternatively, this information can be achieved based on an analysis of dust in the image.
-
Figure 6E illustrates the intersections of a principal ray with the window and image plane, which is also the sensor plane. This figure illustrates the various parameters as defined in Table 1. -
Figure 7A describes the influence of a dust particle (obscuration) located on the input surface of the window (obscuration plane), on the beam converging towards the imaging point. -
Figure 7B illustrates the side view of the rays as obscured by a dust as a function of the aperture.Figure 7C illustrates the frontal projection ofFigure 7B , of the rays as obscured by a dust as a function of the aperture.Figure 7D and Figure 7E illustrates a power distribution map of the same dust spec as manifested in different f-stops, namely a relative open aperture f-9 forFigure 7D and a closed aperture, namely f-22 and higher, inFigure 7E . One can see that the dust spot as recorded with the closed aperture, is much sharper and crisper. - The dust particle is situated in the window plane, and totally absorbing or reflecting the portion of the beam (S2) that normally reaches the image point (P). Let I(x,y) be the value of the irradiance in the image point (x,y) in the absence of the dust particle. Assuming that the energy in the exit pupil of the optical system is uniformly distributed, then, in the presence of the dust particle, the I(x,y) will be reduced proportionally with the ratio between the area of the intersection of the light beam (S1) with the clean zone of the window, and the whole area of the same intersection (Sc).
- Remember that Sc is a function of the lens f-number (f/#) and window thickness tw So, the value of the real irradiance in the presence of dust will be

or, by taking into account that S1 = Sc - S2 and S2 = Area of intersection between the dust particle and the illuminated area:
Because the dust particle is small, the next assumption can be made: - For all the image points affected by a specific dust particle, the area Sc remains constant. In the case of the telecentric illumination, this assumption holds true for all the image points. With the assumption above, we can correlate the dust geometry, position and shadow.
- First of all, we now study the distribution of the irradiance on the input plane of the window. The intersection of the conic beam with this plane is generally an ellipse. The major axis of this ellipse is along the intersection of the plane mentioned above and the plane determined by the image point and the optical axis of the lens.
- The minor axis is

whereas the major axis is
where D is the exit pupil diameter , so
In order to reach a complete formula of the irradiance distribution we now stress the assumption that for all image points affected by a chosen dust particle, "a" will not vary significantly. - Let (u0, v0) be the point of intersection of the principal ray with the plane mentioned above. Thus, the characteristic function of the illuminated zone will be

Let D(u ,v) be the characteristic function of the dust. Thus,


which, using theequation 11, yields
The terms (I+twlPe)x and (I+tw /Pe)y determine the "movement" of the dust shadow with the change of the focal distance and, implicitly, of the Pe, as explained later on inequation 11. - In the case of the telecentric illumination
- Pe is infinite ,
- u0 = x and v0=y.
- the ellipse becomes a circle
- Qualitatively, as described quantitatively in
equation 8, the fall off, or the diminished effect of the dust on an image varies as follow: The dust is becoming less significant as the aperture becomes larger, or the f-stop is smaller and the pixels are inversely affected based on the distance of the pixel to the periphery of the dust. -
Figure 7F illustrates the adaptation between the dust map and the image based on the focal length of the lens. In this figure one can qualitatively see that the area covered by the dust spec will be shifted as a function of the focal length. Also, information about the spatial distribution and/or orientation of dust particles within the dust map may be used to assist with determining probabilities that regions are either dust or non-dust. As an example, one could expect that a global average of the orientation of elongated dust particles would average to zero. However, at a more localized level, charged and/or magnetized dust particles can tend to align with similar orientations due to local dielectric forces. This effect would be partly dependent on the size, overall shape distribution (round or more elongated) and the overall distribution (uniform or clumped) of the dust regions in the dust map. This can tend to be particularly helpful when a decision is to be made as to whether to eliminate certain regions. As an example, if most of the dust is determined to be aligned in a radial direction relative to the center of the sensor area for a particular camera, it may be further determined, based on this statistical information, that particles in a concentric alignment are less likely to be dust. - Given the definitions above, a more quantitative model can be deducted.

because the ratio tw /Pe is small. Note that Pe has in certain common cases a negative value. - Next let (u,v) denote the coordinate system of the input surface, having its origin in the intersection point with the lens optical axis. Similarly, let (x,y) be the coordinate system in the image plane with the origin in the intersection point with the lens optical axis.
- Thus, if the principal ray of the beam intersects the input window plane in the point (u,v), the point in the image plane on the same principal ray will be the inverse transformation of (10)

with the same assumption of a small tw/Pe ratio will be
-
Figure 7G depicts how points will shift as a function of the proximity to the optical center. Basically the farther the dust is from the center, the larger the displacement is. However, the direction and size of the displacements can be estimated. - There are several other parameters that are not generally available. The distance, tw, of the dust to the image plane is typically fixed for a particular model of camera and can be determined from a single measurement. The exit pupil distance may vary depending on the focal length of the lens. More particularly, for a zoom lens, the exit pupil distance may not be fixed, and can vary up to a telecentric mode where the distance is infinity.
- Such information can be empirically predetermined by making an analysis of images taken by a known camera and lens, as illustrated in
Figure 6F and as explained below. In this case, a determination of the effect of a single dust spec on each of a series of image can be used to calculate the effect of any other dust spec on any other image, given some additional knowledge relating to the acquisition parameters for the latter image, in particular parameters relating to the optical sub-systems of the camera and the attached lens. The most useful determination is of the spatial shifting of dust specs between images but other determinations relating to the geometric and optical properties of a dust spec can be made from the foregoing optical model. As illustrative examples of geometric properties we cite the relative size of a dust spec, and distortions in the geometric shape of a dust spec arising from lens aberrations (i.e. non-circular lens symmetries). Illustrative, examples of optical properties include the opacity, induced color shift and sharpness of the dust spec. InFigure 6F an exemplary zoom lens of 70mm-210mm is illustrated: - Pe-70 is the exit pupil position for the lens at 70mm,
- Pe-210 is the exit pupil location when the lens is at its highest enlargement 210mm.
- k, is known dust
- m is hypothetical dust
- hk is h for a specific dust particle k.
- Now this can be rewritten for a specific dust particle (k) in order to emphasize the dependence on the focal distance,

or
So, if we know the evolution of the image of the "k" dust particle we can find the evolution of the "m" dust image
A remaining difficulty with this formula is that we don't know the positions of the dust particles.
Writing the upper formula for a given focal distance , say f0 , we have
So, finally
- This relationship does not require a knowledge of the exit pupil dependence, the thickness of the window and the spatial location of the dust.
Figure 7G , illustrates this phenomena visually. Based on the above formulae, and in particular 9-e and 11, one can see that the dust movement is not constant, as a function of the focal length change, but is dependent on the distance of the dust from the center of the optical path. - Qualitatively, the farther the dust is from the center, the larger the displacement will be. In other words, dust close to the periphery of the image will exhibit significantly larger movement (and geometric and size distortions) than dust which maps onto the center of the image.
- Referring to
figure 7G which describes the movement of two hypothetical dust spots, 790 and 794 having a different distance, 792 and 796 respectively, to the center of theoptical path 780. The movement of each pixel is always on the line between the pixel and the center of the optical path. This is based on the assumption of a linear relationship as described byequation 11. Thus the movement of the dust edge ofdust spec 794 is along the lines depicted inblock 799. Based on assumed coefficients forequation 11, the dust spec moves by a fixedratio 
dust spec 794 will move to become 795 whiledust spec 790 will move to become 791. Because the distance ofdust 794 to the center depicted by 796 is larger than the corresponding distance depicted byblock 792, the movement of thedust 794 will be larger. - Alternatively, given formula (11) and given an image where the dust can be detected, one can calculate Pe as follows (if tw is known):


- In summary of the mathematical model of the optical system for dust, in the general case, the way the image is affected by the dust depends on:
- exit pupil position Pe
- thickness of the window tw
- focal length of the objective f'
- focal number f/#
- the dust position on the image plane (x,y)
- a) the window thickness (tw),
- b) the function Pc(f), and
- c) the coordinates (u,v) of the dust if we want to determine the dust image position on the image plane
- Several examples of preferred embodiments of the main invention will now be described. The main workflow of detecting and removing the dust from an image is illustrated in
Figure 1 . In general, this particular preferred embodiment is directed at removing dust from a collection of images acquired using the same image acquisition device. Specifically, a user may acquire a picture on the digital camera (as illustrated in Block 101). Alternatively (102), a user may open a single image on a external device such as a personal computer, open (103) a folder of images on an external device or open a collection of images on a digital printing device (104). - The preferred embodiment then extracts the shooting parameters (120). Such parameters include, but not limited to data about: Camera name, Lens brand, lens type, focal length at acquisition, aperture range, aperture at acquisition. In addition, some parameter, in particular from those relating to the lens and the camera may be also stored within the acquisition device or the processing device, or subsystems thereof. Such information may include parameters such as exit pupil, exit pupil distance from the lens, or distance of dust from the sensor plane (imaging plane) for the camera. An exemplary table with such data is shown below:
Table 2 Extracted Parameters Field Example of data Category Lens Manufacturer Nikon lens Lens Type AF 24mm-45mm f2.8-f3.5 lens Focal Length 38mm Acquisition data Aperture f-16 Acquisition data Dust distance 0.156mm Camera data Exit pupil 19mm Lens data Exit pupil distance 230mm Lens data - The dust map may also include meta-data that contain additional parameters or acquisition data which can additionally supplement or partially substitiute for said list of extracted parameters. A discussion of meta-data as it relates to image acquisition is found in more detail at PCT patent application no.
PCT/EP2004/008706 - In the case that the system deals with multiple images (as defined in blocks 103, and 104), the algorithm describes a loop operation on all images (110). The first step is to open a dust map (130). If none exists (132) the system will create a new dust map (200) as further described in
Figures 2 . In the case that the system has more than one dust map (130), which may occur, for example, when a camera has multiple exchangeable lenses, the software will attempt to correlate one of the maps (300) to the image. This process is further illustrated inFigure 3 . In particular this correlation refers to the adjustment of the shooting conditions to some accepted standard. The most significant acquisition parameters are the aperture and the focal length. The correlation process is interchangeable and may be achieved either by adjusting the image to the map or, conversely, adjusting the map to the image. In some extreme cases it may be advantageous for both acquired image and dust map to be adjusted to some common ground. This may occur, for example, when the map is calculated based on an aperture that the lens does not reach or based on a different lens than the one used with a different optical configuration. Alternatively, such as in the case of a new lens, this process (300) as called by (130), may be used to adjust the map onto a new map, or to merge two preexisting maps into a single one. From that stage onwards the system may continue with a single map. - If no dust map corresponds with the image (140), a new dust map is created (200). When a dust map does correspond (140) to the image, the preferred embodiment checks if the dust specs as defined in the dust map are of high enough confidence levels to be determined as dust regions (150). The determining and calculating of said confidence level for the dust map in general and for an individual dust spec, is further discussed in
Figures 2 andFigure 3 . If the confidence level is low, the image is added to the updating of the dust map (200). If after the image is added, the confidence level is increased sufficiently (152) the software continues to the dust removal process (160). Otherwise, the software progresses to the next image (170). - For example, a dust map is considered valid only after a minimum number of images, say N, are analyzed, and a dust spec is considered valid after a co-located dust region is detected in a second minimum number of images, say M. Note that M < N. In an example where N=6 and M=3, then after analyzing 4 images, the software may have determined and confirmed the existence of a substantial number of dust specs and updated the dust map accordingly (200), but it must continue to analyze additional images, 2 more in this example, in order to validate the dust map, and allow the software to proceed to the correction (160) stage. Prior to achieving said validation of the dust map no correction will be done. However, images can be corrected retrospectively after the dust map has been validated. Thus even images that were originally acquired prior to validation of the dust map may be corrected.
- Referring to the dust detection and correction process (160). This process may be executed as a loop on every dust spec in the dust map, with a stage of detection and correction (400, followed by 500 and 160). Alternatively, the process can be implemented where all dust specs are detected first (162) and then all dust specs are corrected (164). The decision as to the sequence of operations varies based on the requirements of a particular embodiment of the invention. As part of the detection process, the software also performs a self testing (500) where each new image introduced is compared to the dust map. This process is further defined in
Figure 5 . The importance of this stage for each dust spec and for the dust map, is that in this manner, if the dust situation changes, such as a single spec moving around or the camera being serviced, the software will detect the change and determine that re-validation of the dust map is required. Note that the re-validation process can be performed locally on individual dust specs, or alternatively on the entire dust map, or in certain circumstances through a combination of both local and global validation. - Referring to
Figure 2A where the Dust map creation and updating is defined: This process can receive a collection of images as defined byFigure 1 blocks 103 and 104, or one image at a time, as defined byFigure 1 , blocks 101 and 102. - If the function is called with a single image (240-SINGLE IMAGE) the image is directly provided to the calculations (270). If multiple images are provided (240 MULTIPLE IMAGES), then an initial step is to define if there are more than enough images for defining the map (220). This step is designed to optimize the creation process for a dust map in case there are a large number of images.
- The sequence of the images that are to be referenced is based on the original collection of N images as defined in
Figure 1 blocks 103 or 104. The sequence of images is based on a few criteria such as: giving more weight to the most recently acquired images, and if images are shot in a relatively small time frame, the sequence in which images are processed in order to create the dust map is determined so as to try and minimize repetitiveness between similar images that may have been taken of the same object with little movement. The sequence will not be limited to the number of images (HIDP) because it may well be that some regions will not have enough data in them to evaluate and validate dust specs within said region. This may happen in cases where part of the image is very dark in some of the images. - Alternatively, the parameters, including metadata, as extracted from the images will determine the sequence and the number of dust maps that are to be calculated. For example if a folder contains N=30 images, where 15 were taken with one camera and 15 with another, the sampling step (230) may create two map sets.
- Another criteria for creating a new set or checking for new dust is the type of lens. If a lens is changed, it means that the CCD-cavity was potentially exposed to new dust. This may trigger a new revalidation process. It may also indicate that the camera was serviced, or that the photographer cleaned the camera. Of course, if there is a parameter that defines when a camera was serviced, this will trigger the creation of a new dust map.
- The next loop (270-271) defines the marking of each region and the addition of the region to the dust map if it is not already there. There are three type of regions in an image. The first are regions with sufficient information to determine whether they are of dust nature. As an illustrative example, small dark regions surrounded by a light and relatively large and homogenous background area. Other criteria may include regions with a relatively low color saturation. The second group are regions that are definitely non-dust. Such regions are for example all clear, or of high color saturation. Other regions are inconclusive such as very dark segments of an image. In this latter case, it will be hard to detect the dust even if it was part of the image. Alternatively when looking for over exposed or "dead pixels" the criteria may be reversed, if the pixels appear as a white spec in the image.
- These criteria may be also be a function of the acquisition parameter. For example an image with a open aperture may all be marked as inconclusive for the determination of dust, because the dust may not be focussed sufficiently to appear in determinable form on the image.
- Regions that are potentially dust are marked (292) and then added to the dust mask (294). The addition process may include the creation of a new dust spec region on the map, or the modification of the probability function, or the confidence level, or the size or geometric shape, or location of the centre of an existing region. Regions that are most likely non-dust are marked (282) and then added to the dust mask (284). The addition and/or modification of said regions needs to be normalized to the shooting conditions as defined by the dust map (300), if this step was not performed prior to entering this function, as optionally defined in
Figure 1 . This loop continues over all regions of the image (271). Alternatively (272), each region is compared (500) with the dust map to see if any cases exist where the monotonicity is broken, i.e. a region that was of high probability to be dust is now non dust. - An illustrative example of how the dust map creation/updating process of
Fig 2(a) can create new dust or non-dust pixels in the dust map is given inFigs 13(a)-(c) . Starting with the dust map after the image "i" has been processed,Fig 13(a) , the diagrams show how the increasing of the values of f(hdp) or f(ndp) produces a new YD (Dust) pixel or a new ND (Non Dust) pixel respectively, when the thresholds p(Hdp) and p(Ndp) are eventually exceeded as illustrated inFig 13(c) . -
Figure 2(b) describes an alternate embodiment of the dust map creation process. Block 1210 describes the preparation of the dust map which includes either opening an existing map (1216) or creating a new one (1214), where all pixels as a starting point are non dust or WHITE. After the map is correlated to the shooting conditions, 300, a dust map 1-dM is created in block 1220. All pixels in the image (1222) receive the following values (1224) based on the luminance value of the pixel:

           Case:
              If luminance is less than DARK_THRESHOLD, then l-dM (X,Y) = MAYBE_DUST;
              If luminance is greater than WHITE_THRESHLOD, then l-dM(x,y) = WHITE PIXEL;
              OTHERWISE l-dM(x,y) = DON'T_KNOW.

- (i) in a small aperture the region behind the dust should be close to if not totally obscured; if this is not the case (530 NO), then the dust map may need to be reviewed (550); or the image may not be correctly correlated to the dust map. (This can happen when the image is from a different time, or from a different acquisition device. In this case, the software will create a new dust map (200) to correspond to the new dust or lack thereof, or inform the user that it can not correct this image.)
- (ii) In the case where there is not enough information (530 MAYBE), there is no conclusive evidence to reject the correlation and thus the process continues (580) with no corrective action.
- (iii) In the case that the image displays information that may concur with the dust map, the software may continue (580) or prior to that, enhance the likelihood in the dust map (200) that the region is indeed dust.
Claims (33)
- A method of automatically correcting dust artifact regions within images acquired by a digital acquisition device including an optical system, comprising:(a) digitally-acquiring a plurality of original images with said digital acquisition device;(b) determining that certain pixels correspond to dust artifact regions within said digitally-acquired images;(c) associating the dust artifact regions with one or more extracted parameters relating to the optical system when said images were acquired, a value of at least one extracted parameter for one of said images being different from a corresponding value of at least one other image of said images;(d) forming a dust map based on said dust artifact regions;(e) correcting pixels corresponding to dust artifact regions within a present image based on the dust mapcharacterized in that:said forming a dust map comprises forming a common statistical dust map by mapping dust regions within respective original images according to a selected value of at least one extracted parameter to probability values in said statistical dust map common to said plurality of images.
- The method of claim 1, the dust artifact determining operation including:(i) loading the common statistical dust map;(ii) loading extracted parameter information of a present image; and(iii) correlating the common statistical dust map with the present image according to a selected value of at least one extracted parameter for the present image.
- The method of claim 2, the extracted parameter information including values of aperture size, focal length, magnification, lens type, lens assembly type, aperture position, distance of the actual dust object from one or more positions in plane of the electronic sensor array or combinations thereof.
- The method of claim 2, the method further comprising determining that sufficient disparity exists between dust artifact determinations within sequential images to determine that the digital acquisition device may have been cleaned and that the dust artifact determinations prior to the cleaning will not be used in the dust map.
- The method of claim 2, the correcting comprising in-painting or restoration, or both.
- The method of claim 5, the in-painting operation being performed on pixels determined to have substantially no image-relevant spectral information, or insufficient image-relevant spectral information, associated with their corresponding data.
- The method of claim 6, the in-painting including creation of new pixel values based on characteristics of surrounding pixels to the dust region.
- The method of claim 7, one or more characteristics of the surrounding pixels upon which said in-painting is based include the color, brightness, gradient, edge detection, noise, pattern, texture, geometry, or combinations thereof.
- The method of claim 5, the restoration being performed on pixels determined to have sufficient image-relevant spectral information associated with their corresponding data.
- The method of claim 9, the restoration including modifying brightness based on an inverse relationship to the opacity of the dust artifact or a brightness characteristic of the pixels within the image, or both.
- The method of claim 10, the restoration further including enhancing color based on a present color characteristic of pixels within the image.
- The method according to any of methods 1-11 the dust artifact determining and associating operations being repeated for further acquired images after forming said common statistical dust map; said common statistical dust map being modified based on said further images including mathematically correlating determined and associated dust artifact regions of said further acquired images with dust artifact regions in said common statistical dust map including combining data associated with dust artifact regions within images acquired with different values of one or more extracted parameters; and correcting digital data corresponding to the correlated dust artifact regions within acquired images based on said modified common statistical dust map.
- The method of claim 12, the modifying including varying probabilities based on combining new probability data with probability data within said original dust map.
- The method of claim 12, the modifying including eliminating a dust artifact region of said original dust map due to its probability falling below a threshold value between 0 and 1 after combining new probability data with probability data within said original dust map.
- The method of claim 12, the modifying including inserting a new dust artifact region not present within said original dust map due to its having a probability, based on analysis of multiple images, that is now above a threshold value between 0 and 1 after combining new probability data with probability data within said original dust map.
- The method of claim 12, further comprising reapplying said correcting digital data for images previously acquired after said modifying statistical dust map showed a better statistical probability to said one or more said detected dust regions.
- The method of claim 12, said dust artifact regions including an aura region partially obscured by dust and a shadow region substantially obscured by dust, the shadow region being inside said aura region.
- The method of claim 17, said determining with respect to a shadow region being based on an extracted parameter-dependent shadow region analysis, wherein the shadow region analysis presumes that certain regions on a sensor of the digital image acquisition device are fully obscured by said dust.
- The method of claim 18, wherein the shadow region analysis includes calculating effects of differences in values of the one or more extracted parameters in different images on dust artifact illumination, shape, position, reflection or transmission properties, distance of dust to the sensor, aperture, exit pupil, or focal length, or combinations thereof.
- The method of claim 17, said determining with respect to an aura region being based on an extracted parameter-dependent aura region analysis, wherein the aura region analysis presumes that certain regions on a sensor of the digital image acquisition device are partially obscured by said dust.
- The method of claim 20, wherein said aura region analysis includes calculating effects of differences in values of the one or more extracted parameters in different images on dust artifact illumination, shape, position, reflection or transmission properties, distance of dust to the sensor, aperture, exit pupil, or focal length, or combinations thereof.
- The method of claim 17, the correcting operation comprising in-painting or restoration, or both.
- The method of claim 22, said correcting' including in-painting the shadow region and including determining and applying shadow region correction spectral information based on spectral information obtained from pixels outside said shadow region.
- The method of claim 22, said correcting including restoration of the aura region, said restoration including determining and applying aura region correction spectral information based on spectral information obtained from pixels within said aura region.
- The method of claim 17, the correcting operation including calculating said aura region and said shadow region, the correcting operation further including correcting a shadow region approximately based on the correcting of the aura region.
- The method of claim 12, the statistical dust map including extracted parameter dependent-variables such that dust artifact region effects in one image are predicted to differ based upon values of the variables within the statistical dust map.
- The method of claim 2, wherein said correlating comprises performing at least one linear transformation on the assumption of circular symmetry of the present image and a predetermined mathematical relationship between said extracted parameter and the coefficients of said linear transformation.
- The method of claim 27 where said linear transformation comprises performing a spatial correlation of the dust artifact regions of the dust map with the present image.
- The method of claim 28 comprising performing additional linear, transformations relating to additional properties of the dust map or the dust artifact regions contained within said dust map.
- The method of claim 29 where said additional properties include one or more of dust map luminance, transparency, opacity, scale, dust artifact region size, luminance, transparency, opacity, scale, and spatial location relative to image center.
- The method of any of claims 2 or 27-30, wherein said correlating further comprises performing at least one non-linear transformation based, at least in part, on predetermined data stored in a LUT relating the selected value of the extracted parameter to the coefficients of said non-linear transformation.
- The method of claim 31 where said non-linear transformation corrects for non-circular symmetry of the present image.
- The method of claim 31 where said non-linear transformation corrects for non-linear spatial mappings arising from the optical properties of the imaging subsystem used to acquire the present image.
Applications Claiming Priority (4)
| Application Number | Priority Date | Filing Date | Title |
|---|---|---|---|
| US10/677,134 US7308156B2 (en) | 2003-09-30 | 2003-09-30 | Automated statistical self-calibrating detection and removal of blemishes in digital images based on a dust map developed from actual image data |
| US10/677,139 US7340109B2 (en) | 2003-09-30 | 2003-09-30 | Automated statistical self-calibrating detection and removal of blemishes in digital images dependent upon changes in extracted parameter values |
| US10/676,823 US7369712B2 (en) | 2003-09-30 | 2003-09-30 | Automated statistical self-calibrating detection and removal of blemishes in digital images based on multiple occurrences of dust in images |
| PCT/EP2004/010199 WO2005041558A1 (en) | 2003-09-30 | 2004-09-13 | Statistical self-calibrating detection and removal of blemishes in digital images |
Publications (2)
| Publication Number | Publication Date |
|---|---|
| EP1668886A1 EP1668886A1 (en) | 2006-06-14 |
| EP1668886B1 true EP1668886B1 (en) | 2008-12-10 |
Family
ID=34527982
Family Applications (1)
| Application Number | Title | Priority Date | Filing Date |
|---|---|---|---|
| EP04765121A Not-in-force EP1668886B1 (en) | 2003-09-30 | 2004-09-13 | Statistical self-calibrating detection and removal of blemishes in digital images |
Country Status (6)
| Country | Link |
|---|---|
| EP (1) | EP1668886B1 (en) |
| JP (1) | JP4416795B2 (en) |
| AT (1) | ATE417461T1 (en) |
| DE (1) | DE602004018345D1 (en) |
| IE (1) | IES20040604A2 (en) |
| WO (1) | WO2005041558A1 (en) |
Cited By (3)
| Publication number | Priority date | Publication date | Assignee | Title |
|---|---|---|---|---|
| US8213737B2 (en) | 2007-06-21 | 2012-07-03 | DigitalOptics Corporation Europe Limited | Digital image enhancement with reference images |
| US8682097B2 (en) | 2006-02-14 | 2014-03-25 | DigitalOptics Corporation Europe Limited | Digital image enhancement with reference images |
| CN109405735A (en) * | 2017-08-18 | 2019-03-01 | 阿里巴巴集团控股有限公司 | 3 D scanning system and 3-D scanning method |
Families Citing this family (35)
| Publication number | Priority date | Publication date | Assignee | Title |
|---|---|---|---|---|
| US7042505B1 (en) | 1997-10-09 | 2006-05-09 | Fotonation Ireland Ltd. | Red-eye filter method and apparatus |
| US7630006B2 (en) | 1997-10-09 | 2009-12-08 | Fotonation Ireland Limited | Detecting red eye filter and apparatus using meta-data |
| US7352394B1 (en) | 1997-10-09 | 2008-04-01 | Fotonation Vision Limited | Image modification based on red-eye filter analysis |
| US7738015B2 (en) | 1997-10-09 | 2010-06-15 | Fotonation Vision Limited | Red-eye filter method and apparatus |
| US7970182B2 (en) | 2005-11-18 | 2011-06-28 | Tessera Technologies Ireland Limited | Two stage detection for photographic eye artifacts |
| US7689009B2 (en) | 2005-11-18 | 2010-03-30 | Fotonation Vision Ltd. | Two stage detection for photographic eye artifacts |
| US7792970B2 (en) | 2005-06-17 | 2010-09-07 | Fotonation Vision Limited | Method for establishing a paired connection between media devices |
| US7574016B2 (en) | 2003-06-26 | 2009-08-11 | Fotonation Vision Limited | Digital image processing using face detection information |
| US8254674B2 (en) | 2004-10-28 | 2012-08-28 | DigitalOptics Corporation Europe Limited | Analyzing partial face regions for red-eye detection in acquired digital images |
| US7680342B2 (en) | 2004-08-16 | 2010-03-16 | Fotonation Vision Limited | Indoor/outdoor classification in digital images |
| US7702236B2 (en) | 2006-02-14 | 2010-04-20 | Fotonation Vision Limited | Digital image acquisition device with built in dust and sensor mapping capability |
| US8170294B2 (en) | 2006-11-10 | 2012-05-01 | DigitalOptics Corporation Europe Limited | Method of detecting redeye in a digital image |
| US8036458B2 (en) | 2007-11-08 | 2011-10-11 | DigitalOptics Corporation Europe Limited | Detecting redeye defects in digital images |
| US7920723B2 (en) | 2005-11-18 | 2011-04-05 | Tessera Technologies Ireland Limited | Two stage detection for photographic eye artifacts |
| US8520093B2 (en) | 2003-08-05 | 2013-08-27 | DigitalOptics Corporation Europe Limited | Face tracker and partial face tracker for red-eye filter method and apparatus |
| US9412007B2 (en) | 2003-08-05 | 2016-08-09 | Fotonation Limited | Partial face detector red-eye filter method and apparatus |
| US7424170B2 (en) | 2003-09-30 | 2008-09-09 | Fotonation Vision Limited | Automated statistical self-calibrating detection and removal of blemishes in digital images based on determining probabilities based on image analysis of single images |
| US8369650B2 (en) | 2003-09-30 | 2013-02-05 | DigitalOptics Corporation Europe Limited | Image defect map creation using batches of digital images |
| US7310450B2 (en) | 2003-09-30 | 2007-12-18 | Fotonation Vision Limited | Method of detecting and correcting dust in digital images based on aura and shadow region analysis |
| US7340109B2 (en) | 2003-09-30 | 2008-03-04 | Fotonation Vision Limited | Automated statistical self-calibrating detection and removal of blemishes in digital images dependent upon changes in extracted parameter values |
| US7590305B2 (en) * | 2003-09-30 | 2009-09-15 | Fotonation Vision Limited | Digital camera with built-in lens calibration table |
| US7308156B2 (en) | 2003-09-30 | 2007-12-11 | Fotonation Vision Limited | Automated statistical self-calibrating detection and removal of blemishes in digital images based on a dust map developed from actual image data |
| US7295233B2 (en) | 2003-09-30 | 2007-11-13 | Fotonation Vision Limited | Detection and removal of blemishes in digital images utilizing original images of defocused scenes |
| US7599577B2 (en) | 2005-11-18 | 2009-10-06 | Fotonation Vision Limited | Method and apparatus of correcting hybrid flash artifacts in digital images |
| US20080007635A1 (en) * | 2005-12-30 | 2008-01-10 | Eastman Kodak Company | System and method for reducing the appearance of inherent random optical patterns in a light-diffusing screen |
| EP2033142B1 (en) | 2006-06-12 | 2011-01-26 | Tessera Technologies Ireland Limited | Advances in extending the aam techniques from grayscale to color images |
| US7817874B2 (en) * | 2006-12-06 | 2010-10-19 | Micron Technology, Inc. | Image sensor occlusion localization and correction apparatus, systems, and methods |
| US8055067B2 (en) | 2007-01-18 | 2011-11-08 | DigitalOptics Corporation Europe Limited | Color segmentation |
| JP2010520567A (en) | 2007-03-05 | 2010-06-10 | フォトネーション ビジョン リミテッド | Red-eye false detection filtering using face position and orientation |
| US8503818B2 (en) | 2007-09-25 | 2013-08-06 | DigitalOptics Corporation Europe Limited | Eye defect detection in international standards organization images |
| US8212864B2 (en) | 2008-01-30 | 2012-07-03 | DigitalOptics Corporation Europe Limited | Methods and apparatuses for using image acquisition data to detect and correct image defects |
| US8081254B2 (en) | 2008-08-14 | 2011-12-20 | DigitalOptics Corporation Europe Limited | In-camera based method of detecting defect eye with high accuracy |
| GB201020530D0 (en) * | 2010-12-03 | 2011-01-19 | Optos Plc | Method of identifying anomalies in images |
| CN111833270B (en) * | 2020-07-13 | 2023-02-10 | 新疆大学 | Rapid sand-dust degradation image enhancement method |
| CN112954239B (en) * | 2021-01-29 | 2022-07-19 | 中国科学院长春光学精密机械与物理研究所 | On-board CMOS image dust pollution removal and recovery system and recovery method |
Family Cites Families (4)
| Publication number | Priority date | Publication date | Assignee | Title |
|---|---|---|---|---|
| US6035072A (en) * | 1997-12-08 | 2000-03-07 | Read; Robert Lee | Mapping defects or dirt dynamically affecting an image acquisition device |
| JP2000050062A (en) * | 1998-07-31 | 2000-02-18 | Minolta Co Ltd | Image input device |
| JP4167401B2 (en) * | 2001-01-12 | 2008-10-15 | 富士フイルム株式会社 | Digital camera and operation control method thereof |
| US20030039402A1 (en) * | 2001-08-24 | 2003-02-27 | Robins David R. | Method and apparatus for detection and removal of scanned image scratches and dust |
-
2004
- 2004-09-10 IE IE20040604A patent/IES20040604A2/en not_active IP Right Cessation
- 2004-09-13 AT AT04765121T patent/ATE417461T1/en not_active IP Right Cessation
- 2004-09-13 WO PCT/EP2004/010199 patent/WO2005041558A1/en active Application Filing
- 2004-09-13 EP EP04765121A patent/EP1668886B1/en not_active Not-in-force
- 2004-09-13 DE DE602004018345T patent/DE602004018345D1/en active Active
- 2004-09-13 JP JP2006529982A patent/JP4416795B2/en not_active Expired - Fee Related
Cited By (3)
| Publication number | Priority date | Publication date | Assignee | Title |
|---|---|---|---|---|
| US8682097B2 (en) | 2006-02-14 | 2014-03-25 | DigitalOptics Corporation Europe Limited | Digital image enhancement with reference images |
| US8213737B2 (en) | 2007-06-21 | 2012-07-03 | DigitalOptics Corporation Europe Limited | Digital image enhancement with reference images |
| CN109405735A (en) * | 2017-08-18 | 2019-03-01 | 阿里巴巴集团控股有限公司 | 3 D scanning system and 3-D scanning method |
Also Published As
| Publication number | Publication date |
|---|---|
| IES20040604A2 (en) | 2005-06-15 |
| EP1668886A1 (en) | 2006-06-14 |
| JP2007507932A (en) | 2007-03-29 |
| JP4416795B2 (en) | 2010-02-17 |
| ATE417461T1 (en) | 2008-12-15 |
| DE602004018345D1 (en) | 2009-01-22 |
| WO2005041558A1 (en) | 2005-05-06 |
Similar Documents
| Publication | Publication Date | Title |
|---|---|---|
| EP1668886B1 (en) | Statistical self-calibrating detection and removal of blemishes in digital images | |
| US7545995B2 (en) | Automated statistical self-calibrating detection and removal of blemishes in digital images dependent upon changes in extracted parameter values | |
| US7536061B2 (en) | Automated statistical self-calibrating detection and removal of blemishes in digital images based on determining probabilities based on image analysis of single images | |
| US7369712B2 (en) | Automated statistical self-calibrating detection and removal of blemishes in digital images based on multiple occurrences of dust in images | |
| US7206461B2 (en) | Digital image acquisition and processing system | |
| US8879869B2 (en) | Image defect map creation using batches of digital images | |
| US7676110B2 (en) | Determination of need to service a camera based on detection of blemishes in digital images | |
| US7683946B2 (en) | Detection and removal of blemishes in digital images utilizing original images of defocused scenes | |
| US7315658B2 (en) | Digital camera | |
| US7310450B2 (en) | Method of detecting and correcting dust in digital images based on aura and shadow region analysis | |
| US7308156B2 (en) | Automated statistical self-calibrating detection and removal of blemishes in digital images based on a dust map developed from actual image data | |
| US7590305B2 (en) | Digital camera with built-in lens calibration table | |
| EP0560165A1 (en) | Image scanner system and method for improved microfilm image quality | |
| IES83966Y1 (en) | Automated statistical self-calibrating detection and removal of blemishes in digital images based on multiple occurrences of dust in images | |
| IE20040604U1 (en) | Automated statistical self-calibrating detection and removal of blemishes in digital images based on multiple occurrences of dust in images | |
| IES84112Y1 (en) | Digital camera with built-in lens calibration table |
Legal Events
| Date | Code | Title | Description |
|---|---|---|---|
| PUAI | Public reference made under article 153(3) epc to a published international application that has entered the european phase |
Free format text: ORIGINAL CODE: 0009012 |
|
| 17P | Request for examination filed |
Effective date: 20060314 |
|
| AK | Designated contracting states |
Kind code of ref document: A1 Designated state(s): AT BE BG CH CY CZ DE DK EE ES FI FR GB GR HU IE IT LI LU MC NL PL PT RO SE SI SK TR |
|
| DAX | Request for extension of the european patent (deleted) | ||
| 17Q | First examination report despatched |
Effective date: 20070705 |
|
| R17C | First examination report despatched (corrected) |
Effective date: 20070705 |
|
| GRAP | Despatch of communication of intention to grant a patent |
Free format text: ORIGINAL CODE: EPIDOSNIGR1 |
|
| GRAS | Grant fee paid |
Free format text: ORIGINAL CODE: EPIDOSNIGR3 |
|
| GRAA | (expected) grant |
Free format text: ORIGINAL CODE: 0009210 |
|
| AK | Designated contracting states |
Kind code of ref document: B1 Designated state(s): AT BE BG CH CY CZ DE DK EE ES FI FR GB GR HU IE IT LI LU MC NL PL PT RO SE SI SK TR |
|
| REG | Reference to a national code |
Ref country code: GB Ref legal event code: FG4D |
|
| REG | Reference to a national code |
Ref country code: CH Ref legal event code: EP |
|
| REG | Reference to a national code |
Ref country code: IE Ref legal event code: FG4D |
|
| REF | Corresponds to: |
Ref document number: 602004018345 Country of ref document: DE Date of ref document: 20090122 Kind code of ref document: P |
|
| PG25 | Lapsed in a contracting state [announced via postgrant information from national office to epo] |
Ref country code: SI Free format text: LAPSE BECAUSE OF FAILURE TO SUBMIT A TRANSLATION OF THE DESCRIPTION OR TO PAY THE FEE WITHIN THE PRESCRIBED TIME-LIMIT Effective date: 20081210 Ref country code: PL Free format text: LAPSE BECAUSE OF FAILURE TO SUBMIT A TRANSLATION OF THE DESCRIPTION OR TO PAY THE FEE WITHIN THE PRESCRIBED TIME-LIMIT Effective date: 20081210 Ref country code: FI Free format text: LAPSE BECAUSE OF FAILURE TO SUBMIT A TRANSLATION OF THE DESCRIPTION OR TO PAY THE FEE WITHIN THE PRESCRIBED TIME-LIMIT Effective date: 20081210 Ref country code: NL Free format text: LAPSE BECAUSE OF FAILURE TO SUBMIT A TRANSLATION OF THE DESCRIPTION OR TO PAY THE FEE WITHIN THE PRESCRIBED TIME-LIMIT Effective date: 20081210 |
|
| NLV1 | Nl: lapsed or annulled due to failure to fulfill the requirements of art. 29p and 29m of the patents act | ||
| PG25 | Lapsed in a contracting state [announced via postgrant information from national office to epo] |
Ref country code: RO Free format text: LAPSE BECAUSE OF FAILURE TO SUBMIT A TRANSLATION OF THE DESCRIPTION OR TO PAY THE FEE WITHIN THE PRESCRIBED TIME-LIMIT Effective date: 20081210 Ref country code: EE Free format text: LAPSE BECAUSE OF FAILURE TO SUBMIT A TRANSLATION OF THE DESCRIPTION OR TO PAY THE FEE WITHIN THE PRESCRIBED TIME-LIMIT Effective date: 20081210 Ref country code: BG Free format text: LAPSE BECAUSE OF FAILURE TO SUBMIT A TRANSLATION OF THE DESCRIPTION OR TO PAY THE FEE WITHIN THE PRESCRIBED TIME-LIMIT Effective date: 20090310 Ref country code: BE Free format text: LAPSE BECAUSE OF FAILURE TO SUBMIT A TRANSLATION OF THE DESCRIPTION OR TO PAY THE FEE WITHIN THE PRESCRIBED TIME-LIMIT Effective date: 20081210 Ref country code: ES Free format text: LAPSE BECAUSE OF FAILURE TO SUBMIT A TRANSLATION OF THE DESCRIPTION OR TO PAY THE FEE WITHIN THE PRESCRIBED TIME-LIMIT Effective date: 20090321 |
|
| PG25 | Lapsed in a contracting state [announced via postgrant information from national office to epo] |
Ref country code: CZ Free format text: LAPSE BECAUSE OF FAILURE TO SUBMIT A TRANSLATION OF THE DESCRIPTION OR TO PAY THE FEE WITHIN THE PRESCRIBED TIME-LIMIT Effective date: 20081210 Ref country code: SE Free format text: LAPSE BECAUSE OF FAILURE TO SUBMIT A TRANSLATION OF THE DESCRIPTION OR TO PAY THE FEE WITHIN THE PRESCRIBED TIME-LIMIT Effective date: 20090310 Ref country code: AT Free format text: LAPSE BECAUSE OF FAILURE TO SUBMIT A TRANSLATION OF THE DESCRIPTION OR TO PAY THE FEE WITHIN THE PRESCRIBED TIME-LIMIT Effective date: 20081210 |
|
| PG25 | Lapsed in a contracting state [announced via postgrant information from national office to epo] |
Ref country code: SK Free format text: LAPSE BECAUSE OF FAILURE TO SUBMIT A TRANSLATION OF THE DESCRIPTION OR TO PAY THE FEE WITHIN THE PRESCRIBED TIME-LIMIT Effective date: 20081210 |
|
| PLBE | No opposition filed within time limit |
Free format text: ORIGINAL CODE: 0009261 |
|
| STAA | Information on the status of an ep patent application or granted ep patent |
Free format text: STATUS: NO OPPOSITION FILED WITHIN TIME LIMIT |
|
| PG25 | Lapsed in a contracting state [announced via postgrant information from national office to epo] |
Ref country code: DK Free format text: LAPSE BECAUSE OF FAILURE TO SUBMIT A TRANSLATION OF THE DESCRIPTION OR TO PAY THE FEE WITHIN THE PRESCRIBED TIME-LIMIT Effective date: 20081210 |
|
| 26N | No opposition filed |
Effective date: 20090911 |
|
| PG25 | Lapsed in a contracting state [announced via postgrant information from national office to epo] |
Ref country code: MC Free format text: LAPSE BECAUSE OF NON-PAYMENT OF DUE FEES Effective date: 20090930 |
|
| REG | Reference to a national code |
Ref country code: CH Ref legal event code: PL |
|
| PG25 | Lapsed in a contracting state [announced via postgrant information from national office to epo] |
Ref country code: IE Free format text: LAPSE BECAUSE OF NON-PAYMENT OF DUE FEES Effective date: 20090913 |
|
| PG25 | Lapsed in a contracting state [announced via postgrant information from national office to epo] |
Ref country code: CH Free format text: LAPSE BECAUSE OF NON-PAYMENT OF DUE FEES Effective date: 20090930 Ref country code: LI Free format text: LAPSE BECAUSE OF NON-PAYMENT OF DUE FEES Effective date: 20090930 Ref country code: GR Free format text: LAPSE BECAUSE OF FAILURE TO SUBMIT A TRANSLATION OF THE DESCRIPTION OR TO PAY THE FEE WITHIN THE PRESCRIBED TIME-LIMIT Effective date: 20090311 |
|
| REG | Reference to a national code |
Ref country code: GB Ref legal event code: 732E Free format text: REGISTERED BETWEEN 20101028 AND 20101103 |
|
| REG | Reference to a national code |
Ref country code: FR Ref legal event code: TP |
|
| PG25 | Lapsed in a contracting state [announced via postgrant information from national office to epo] |
Ref country code: IT Free format text: LAPSE BECAUSE OF FAILURE TO SUBMIT A TRANSLATION OF THE DESCRIPTION OR TO PAY THE FEE WITHIN THE PRESCRIBED TIME-LIMIT Effective date: 20081210 |
|
| PG25 | Lapsed in a contracting state [announced via postgrant information from national office to epo] |
Ref country code: LU Free format text: LAPSE BECAUSE OF NON-PAYMENT OF DUE FEES Effective date: 20090913 |
|
| PG25 | Lapsed in a contracting state [announced via postgrant information from national office to epo] |
Ref country code: HU Free format text: LAPSE BECAUSE OF FAILURE TO SUBMIT A TRANSLATION OF THE DESCRIPTION OR TO PAY THE FEE WITHIN THE PRESCRIBED TIME-LIMIT Effective date: 20090611 |
|
| PG25 | Lapsed in a contracting state [announced via postgrant information from national office to epo] |
Ref country code: TR Free format text: LAPSE BECAUSE OF FAILURE TO SUBMIT A TRANSLATION OF THE DESCRIPTION OR TO PAY THE FEE WITHIN THE PRESCRIBED TIME-LIMIT Effective date: 20081210 |
|
| PG25 | Lapsed in a contracting state [announced via postgrant information from national office to epo] |
Ref country code: CY Free format text: LAPSE BECAUSE OF FAILURE TO SUBMIT A TRANSLATION OF THE DESCRIPTION OR TO PAY THE FEE WITHIN THE PRESCRIBED TIME-LIMIT Effective date: 20081210 |
|
| REG | Reference to a national code |
Ref country code: FR Ref legal event code: CD Owner name: DIGITALOPTICS CORPORATION EUROPE LIMITED, IE Effective date: 20111212 |
|
| REG | Reference to a national code |
Ref country code: DE Ref legal event code: R082 Ref document number: 602004018345 Country of ref document: DE Representative=s name: PATENTANWAELTE WALLACH, KOCH & PARTNER, DE |
|
| REG | Reference to a national code |
Ref country code: DE Ref legal event code: R082 Ref document number: 602004018345 Country of ref document: DE Representative=s name: PATENTANWAELTE WALLACH, KOCH & PARTNER, DE Effective date: 20120425 Ref country code: DE Ref legal event code: R081 Ref document number: 602004018345 Country of ref document: DE Owner name: DIGITALOPTICS CORPORATION EUROPE LIMITED, BALL, IE Free format text: FORMER OWNER: TESSERA TECHNOLOGIES IRELAND LIMITED, BALLYBRIT, GALWAY, IE Effective date: 20120425 Ref country code: DE Ref legal event code: R082 Ref document number: 602004018345 Country of ref document: DE Representative=s name: PATENTANWAELTE WALLACH, KOCH, DR. HAIBACH, FEL, DE Effective date: 20120425 |
|
| PG25 | Lapsed in a contracting state [announced via postgrant information from national office to epo] |
Ref country code: PT Free format text: LAPSE BECAUSE OF FAILURE TO SUBMIT A TRANSLATION OF THE DESCRIPTION OR TO PAY THE FEE WITHIN THE PRESCRIBED TIME-LIMIT Effective date: 20090510 |
|
| REG | Reference to a national code |
Ref country code: FR Ref legal event code: PLFP Year of fee payment: 13 |
|
| PGFP | Annual fee paid to national office [announced via postgrant information from national office to epo] |
Ref country code: GB Payment date: 20160927 Year of fee payment: 13 |
|
| PGFP | Annual fee paid to national office [announced via postgrant information from national office to epo] |
Ref country code: FR Payment date: 20160926 Year of fee payment: 13 |
|
| PGFP | Annual fee paid to national office [announced via postgrant information from national office to epo] |
Ref country code: DE Payment date: 20160928 Year of fee payment: 13 |
|
| REG | Reference to a national code |
Ref country code: DE Ref legal event code: R119 Ref document number: 602004018345 Country of ref document: DE |
|
| GBPC | Gb: european patent ceased through non-payment of renewal fee |
Effective date: 20170913 |
|
| REG | Reference to a national code |
Ref country code: FR Ref legal event code: ST Effective date: 20180531 |
|
| PG25 | Lapsed in a contracting state [announced via postgrant information from national office to epo] |
Ref country code: DE Free format text: LAPSE BECAUSE OF NON-PAYMENT OF DUE FEES Effective date: 20180404 Ref country code: GB Free format text: LAPSE BECAUSE OF NON-PAYMENT OF DUE FEES Effective date: 20170913 |
|
| PG25 | Lapsed in a contracting state [announced via postgrant information from national office to epo] |
Ref country code: FR Free format text: LAPSE BECAUSE OF NON-PAYMENT OF DUE FEES Effective date: 20171002 |