EP2392257A2 - Method of assessing blood volume using photoelectric plethysmography - Google Patents
Method of assessing blood volume using photoelectric plethysmography Download PDFInfo
- Publication number
- EP2392257A2 EP2392257A2 EP11179769A EP11179769A EP2392257A2 EP 2392257 A2 EP2392257 A2 EP 2392257A2 EP 11179769 A EP11179769 A EP 11179769A EP 11179769 A EP11179769 A EP 11179769A EP 2392257 A2 EP2392257 A2 EP 2392257A2
- Authority
- EP
- European Patent Office
- Prior art keywords
- component
- cardiovascular
- waveform
- subject
- cardiovascular waveform
- Prior art date
- Legal status (The legal status is an assumption and is not a legal conclusion. Google has not performed a legal analysis and makes no representation as to the accuracy of the status listed.)
- Withdrawn
Links
- 210000004369 blood Anatomy 0.000 title claims abstract description 112
- 239000008280 blood Substances 0.000 title claims abstract description 112
- 238000000034 method Methods 0.000 title claims abstract description 77
- 230000002526 effect on cardiovascular system Effects 0.000 claims abstract description 85
- 238000004458 analytical method Methods 0.000 claims abstract description 66
- 230000029058 respiratory gaseous exchange Effects 0.000 claims description 32
- 230000000747 cardiac effect Effects 0.000 claims description 24
- 239000000523 sample Substances 0.000 claims description 19
- 238000012544 monitoring process Methods 0.000 claims description 17
- 230000000241 respiratory effect Effects 0.000 claims description 17
- 238000001514 detection method Methods 0.000 claims description 10
- 230000010355 oscillation Effects 0.000 claims description 8
- 206010021137 Hypovolaemia Diseases 0.000 claims description 5
- 230000036391 respiratory frequency Effects 0.000 claims description 5
- 239000012530 fluid Substances 0.000 claims description 4
- 230000004043 responsiveness Effects 0.000 claims description 4
- 230000001360 synchronised effect Effects 0.000 claims description 4
- 230000003205 diastolic effect Effects 0.000 claims description 3
- 230000018044 dehydration Effects 0.000 claims description 2
- 238000006297 dehydration reaction Methods 0.000 claims description 2
- 238000009423 ventilation Methods 0.000 abstract description 42
- 230000035487 diastolic blood pressure Effects 0.000 abstract description 3
- 230000035488 systolic blood pressure Effects 0.000 abstract description 3
- 230000000694 effects Effects 0.000 description 14
- 230000010363 phase shift Effects 0.000 description 11
- QVGXLLKOCUKJST-UHFFFAOYSA-N atomic oxygen Chemical compound [O] QVGXLLKOCUKJST-UHFFFAOYSA-N 0.000 description 10
- 239000001301 oxygen Substances 0.000 description 10
- 229910052760 oxygen Inorganic materials 0.000 description 10
- 230000036387 respiratory rate Effects 0.000 description 10
- 238000005259 measurement Methods 0.000 description 9
- 230000000541 pulsatile effect Effects 0.000 description 9
- 230000002269 spontaneous effect Effects 0.000 description 8
- 230000017531 blood circulation Effects 0.000 description 7
- 230000008859 change Effects 0.000 description 7
- 230000006870 function Effects 0.000 description 7
- 238000011161 development Methods 0.000 description 6
- 238000012806 monitoring device Methods 0.000 description 5
- 230000036316 preload Effects 0.000 description 5
- 206010002091 Anaesthesia Diseases 0.000 description 4
- 230000037005 anaesthesia Effects 0.000 description 4
- 206010003119 arrhythmia Diseases 0.000 description 4
- 230000036772 blood pressure Effects 0.000 description 4
- 238000000605 extraction Methods 0.000 description 4
- 210000001061 forehead Anatomy 0.000 description 4
- 230000003434 inspiratory effect Effects 0.000 description 4
- 210000005259 peripheral blood Anatomy 0.000 description 4
- 239000011886 peripheral blood Substances 0.000 description 4
- 230000008569 process Effects 0.000 description 4
- 230000004044 response Effects 0.000 description 4
- 238000001228 spectrum Methods 0.000 description 4
- 238000001356 surgical procedure Methods 0.000 description 4
- 210000001519 tissue Anatomy 0.000 description 4
- 230000009466 transformation Effects 0.000 description 4
- 230000003519 ventilatory effect Effects 0.000 description 4
- 206010003658 Atrial Fibrillation Diseases 0.000 description 3
- 102000001554 Hemoglobins Human genes 0.000 description 3
- 108010054147 Hemoglobins Proteins 0.000 description 3
- 230000001154 acute effect Effects 0.000 description 3
- 230000036586 afterload Effects 0.000 description 3
- 230000003416 augmentation Effects 0.000 description 3
- 230000004217 heart function Effects 0.000 description 3
- 230000001788 irregular Effects 0.000 description 3
- 238000005399 mechanical ventilation Methods 0.000 description 3
- 230000002093 peripheral effect Effects 0.000 description 3
- 238000002106 pulse oximetry Methods 0.000 description 3
- 230000033764 rhythmic process Effects 0.000 description 3
- 229920006395 saturated elastomer Polymers 0.000 description 3
- 238000000926 separation method Methods 0.000 description 3
- 230000006442 vascular tone Effects 0.000 description 3
- GQPLMRYTRLFLPF-UHFFFAOYSA-N Nitrous Oxide Chemical compound [O-][N+]#N GQPLMRYTRLFLPF-UHFFFAOYSA-N 0.000 description 2
- 238000001949 anaesthesia Methods 0.000 description 2
- 230000002567 autonomic effect Effects 0.000 description 2
- 230000008901 benefit Effects 0.000 description 2
- 230000001010 compromised effect Effects 0.000 description 2
- 238000010276 construction Methods 0.000 description 2
- 230000008602 contraction Effects 0.000 description 2
- 238000013480 data collection Methods 0.000 description 2
- 230000001419 dependent effect Effects 0.000 description 2
- 230000009977 dual effect Effects 0.000 description 2
- 230000005670 electromagnetic radiation Effects 0.000 description 2
- 238000011156 evaluation Methods 0.000 description 2
- 238000001361 intraarterial administration Methods 0.000 description 2
- 238000002955 isolation Methods 0.000 description 2
- 230000003287 optical effect Effects 0.000 description 2
- 230000003534 oscillatory effect Effects 0.000 description 2
- 238000006213 oxygenation reaction Methods 0.000 description 2
- 230000000737 periodic effect Effects 0.000 description 2
- 210000001147 pulmonary artery Anatomy 0.000 description 2
- 230000001020 rhythmical effect Effects 0.000 description 2
- 238000005070 sampling Methods 0.000 description 2
- 210000005166 vasculature Anatomy 0.000 description 2
- 230000002861 ventricular Effects 0.000 description 2
- 206010007559 Cardiac failure congestive Diseases 0.000 description 1
- 206010019280 Heart failures Diseases 0.000 description 1
- PIWKPBJCKXDKJR-UHFFFAOYSA-N Isoflurane Chemical compound FC(F)OC(Cl)C(F)(F)F PIWKPBJCKXDKJR-UHFFFAOYSA-N 0.000 description 1
- 208000009378 Low Cardiac Output Diseases 0.000 description 1
- 206010071229 Procedural haemorrhage Diseases 0.000 description 1
- 238000000692 Student's t-test Methods 0.000 description 1
- 206010047139 Vasoconstriction Diseases 0.000 description 1
- 208000009729 Ventricular Premature Complexes Diseases 0.000 description 1
- 230000003187 abdominal effect Effects 0.000 description 1
- 238000011538 abdominal hysterectomy Methods 0.000 description 1
- 238000012084 abdominal surgery Methods 0.000 description 1
- 238000010521 absorption reaction Methods 0.000 description 1
- 230000003444 anaesthetic effect Effects 0.000 description 1
- 208000008784 apnea Diseases 0.000 description 1
- 230000006793 arrhythmia Effects 0.000 description 1
- 230000004872 arterial blood pressure Effects 0.000 description 1
- 230000001746 atrial effect Effects 0.000 description 1
- 108091008698 baroreceptors Proteins 0.000 description 1
- 210000004204 blood vessel Anatomy 0.000 description 1
- 210000000988 bone and bone Anatomy 0.000 description 1
- 230000002612 cardiopulmonary effect Effects 0.000 description 1
- 238000006243 chemical reaction Methods 0.000 description 1
- 210000000038 chest Anatomy 0.000 description 1
- 229940079593 drug Drugs 0.000 description 1
- 239000003814 drug Substances 0.000 description 1
- 239000000975 dye Substances 0.000 description 1
- 210000000624 ear auricle Anatomy 0.000 description 1
- 230000001747 exhibiting effect Effects 0.000 description 1
- 238000002637 fluid replacement therapy Methods 0.000 description 1
- 239000007789 gas Substances 0.000 description 1
- 238000002695 general anesthesia Methods 0.000 description 1
- PCHJSUWPFVWCPO-UHFFFAOYSA-N gold Chemical compound [Au] PCHJSUWPFVWCPO-UHFFFAOYSA-N 0.000 description 1
- 230000006872 improvement Effects 0.000 description 1
- 230000006698 induction Effects 0.000 description 1
- 229960002725 isoflurane Drugs 0.000 description 1
- 230000031700 light absorption Effects 0.000 description 1
- 238000004519 manufacturing process Methods 0.000 description 1
- 238000000691 measurement method Methods 0.000 description 1
- 230000004089 microcirculation Effects 0.000 description 1
- 239000000203 mixture Substances 0.000 description 1
- 230000004048 modification Effects 0.000 description 1
- 238000012986 modification Methods 0.000 description 1
- 210000003205 muscle Anatomy 0.000 description 1
- 239000001272 nitrous oxide Substances 0.000 description 1
- 230000010412 perfusion Effects 0.000 description 1
- 230000003836 peripheral circulation Effects 0.000 description 1
- 230000035479 physiological effects, processes and functions Effects 0.000 description 1
- 230000002028 premature Effects 0.000 description 1
- 210000001774 pressoreceptor Anatomy 0.000 description 1
- 230000002035 prolonged effect Effects 0.000 description 1
- OLBCVFGFOZPWHH-UHFFFAOYSA-N propofol Chemical compound CC(C)C1=CC=CC(C(C)C)=C1O OLBCVFGFOZPWHH-UHFFFAOYSA-N 0.000 description 1
- 229960004134 propofol Drugs 0.000 description 1
- 230000002285 radioactive effect Effects 0.000 description 1
- 230000000306 recurrent effect Effects 0.000 description 1
- 230000009467 reduction Effects 0.000 description 1
- 238000009256 replacement therapy Methods 0.000 description 1
- 210000002345 respiratory system Anatomy 0.000 description 1
- 238000012552 review Methods 0.000 description 1
- 230000035945 sensitivity Effects 0.000 description 1
- 230000003068 static effect Effects 0.000 description 1
- 238000012360 testing method Methods 0.000 description 1
- 210000000779 thoracic wall Anatomy 0.000 description 1
- 230000001052 transient effect Effects 0.000 description 1
- 230000002792 vascular Effects 0.000 description 1
- 230000025033 vasoconstriction Effects 0.000 description 1
- 230000000283 vasomotion Effects 0.000 description 1
- BGSZAXLLHYERSY-XQIGCQGXSA-N vecuronium Chemical compound N1([C@@H]2[C@@H](OC(C)=O)C[C@@H]3CC[C@H]4[C@@H]5C[C@@H]([C@@H]([C@]5(CC[C@@H]4[C@@]3(C)C2)C)OC(=O)C)[N+]2(C)CCCCC2)CCCCC1 BGSZAXLLHYERSY-XQIGCQGXSA-N 0.000 description 1
- 229960003819 vecuronium Drugs 0.000 description 1
Images


Classifications
-
- A—HUMAN NECESSITIES
- A61—MEDICAL OR VETERINARY SCIENCE; HYGIENE
- A61B—DIAGNOSIS; SURGERY; IDENTIFICATION
- A61B5/00—Measuring for diagnostic purposes; Identification of persons
- A61B5/0059—Measuring for diagnostic purposes; Identification of persons using light, e.g. diagnosis by transillumination, diascopy, fluorescence
-
- A—HUMAN NECESSITIES
- A61—MEDICAL OR VETERINARY SCIENCE; HYGIENE
- A61B—DIAGNOSIS; SURGERY; IDENTIFICATION
- A61B5/00—Measuring for diagnostic purposes; Identification of persons
- A61B5/145—Measuring characteristics of blood in vivo, e.g. gas concentration, pH value; Measuring characteristics of body fluids or tissues, e.g. interstitial fluid, cerebral tissue
- A61B5/1455—Measuring characteristics of blood in vivo, e.g. gas concentration, pH value; Measuring characteristics of body fluids or tissues, e.g. interstitial fluid, cerebral tissue using optical sensors, e.g. spectral photometrical oximeters
- A61B5/14551—Measuring characteristics of blood in vivo, e.g. gas concentration, pH value; Measuring characteristics of body fluids or tissues, e.g. interstitial fluid, cerebral tissue using optical sensors, e.g. spectral photometrical oximeters for measuring blood gases
-
- A—HUMAN NECESSITIES
- A61—MEDICAL OR VETERINARY SCIENCE; HYGIENE
- A61B—DIAGNOSIS; SURGERY; IDENTIFICATION
- A61B5/00—Measuring for diagnostic purposes; Identification of persons
- A61B5/02—Detecting, measuring or recording pulse, heart rate, blood pressure or blood flow; Combined pulse/heart-rate/blood pressure determination; Evaluating a cardiovascular condition not otherwise provided for, e.g. using combinations of techniques provided for in this group with electrocardiography or electroauscultation; Heart catheters for measuring blood pressure
- A61B5/0205—Simultaneously evaluating both cardiovascular conditions and different types of body conditions, e.g. heart and respiratory condition
-
- A—HUMAN NECESSITIES
- A61—MEDICAL OR VETERINARY SCIENCE; HYGIENE
- A61B—DIAGNOSIS; SURGERY; IDENTIFICATION
- A61B5/00—Measuring for diagnostic purposes; Identification of persons
- A61B5/02—Detecting, measuring or recording pulse, heart rate, blood pressure or blood flow; Combined pulse/heart-rate/blood pressure determination; Evaluating a cardiovascular condition not otherwise provided for, e.g. using combinations of techniques provided for in this group with electrocardiography or electroauscultation; Heart catheters for measuring blood pressure
- A61B5/024—Detecting, measuring or recording pulse rate or heart rate
- A61B5/02416—Detecting, measuring or recording pulse rate or heart rate using photoplethysmograph signals, e.g. generated by infrared radiation
-
- A—HUMAN NECESSITIES
- A61—MEDICAL OR VETERINARY SCIENCE; HYGIENE
- A61B—DIAGNOSIS; SURGERY; IDENTIFICATION
- A61B5/00—Measuring for diagnostic purposes; Identification of persons
- A61B5/02—Detecting, measuring or recording pulse, heart rate, blood pressure or blood flow; Combined pulse/heart-rate/blood pressure determination; Evaluating a cardiovascular condition not otherwise provided for, e.g. using combinations of techniques provided for in this group with electrocardiography or electroauscultation; Heart catheters for measuring blood pressure
- A61B5/026—Measuring blood flow
-
- A—HUMAN NECESSITIES
- A61—MEDICAL OR VETERINARY SCIENCE; HYGIENE
- A61B—DIAGNOSIS; SURGERY; IDENTIFICATION
- A61B5/00—Measuring for diagnostic purposes; Identification of persons
- A61B5/72—Signal processing specially adapted for physiological signals or for diagnostic purposes
- A61B5/7271—Specific aspects of physiological measurement analysis
- A61B5/7282—Event detection, e.g. detecting unique waveforms indicative of a medical condition
-
- A—HUMAN NECESSITIES
- A61—MEDICAL OR VETERINARY SCIENCE; HYGIENE
- A61B—DIAGNOSIS; SURGERY; IDENTIFICATION
- A61B5/00—Measuring for diagnostic purposes; Identification of persons
- A61B5/74—Details of notification to user or communication with user or patient ; user input means
- A61B5/7405—Details of notification to user or communication with user or patient ; user input means using sound
-
- A—HUMAN NECESSITIES
- A61—MEDICAL OR VETERINARY SCIENCE; HYGIENE
- A61B—DIAGNOSIS; SURGERY; IDENTIFICATION
- A61B5/00—Measuring for diagnostic purposes; Identification of persons
- A61B5/74—Details of notification to user or communication with user or patient ; user input means
- A61B5/742—Details of notification to user or communication with user or patient ; user input means using visual displays
-
- A—HUMAN NECESSITIES
- A61—MEDICAL OR VETERINARY SCIENCE; HYGIENE
- A61B—DIAGNOSIS; SURGERY; IDENTIFICATION
- A61B5/00—Measuring for diagnostic purposes; Identification of persons
- A61B5/74—Details of notification to user or communication with user or patient ; user input means
- A61B5/746—Alarms related to a physiological condition, e.g. details of setting alarm thresholds or avoiding false alarms
-
- G—PHYSICS
- G16—INFORMATION AND COMMUNICATION TECHNOLOGY [ICT] SPECIALLY ADAPTED FOR SPECIFIC APPLICATION FIELDS
- G16H—HEALTHCARE INFORMATICS, i.e. INFORMATION AND COMMUNICATION TECHNOLOGY [ICT] SPECIALLY ADAPTED FOR THE HANDLING OR PROCESSING OF MEDICAL OR HEALTHCARE DATA
- G16H10/00—ICT specially adapted for the handling or processing of patient-related medical or healthcare data
- G16H10/40—ICT specially adapted for the handling or processing of patient-related medical or healthcare data for data related to laboratory analysis, e.g. patient specimen analysis
-
- G—PHYSICS
- G16—INFORMATION AND COMMUNICATION TECHNOLOGY [ICT] SPECIALLY ADAPTED FOR SPECIFIC APPLICATION FIELDS
- G16H—HEALTHCARE INFORMATICS, i.e. INFORMATION AND COMMUNICATION TECHNOLOGY [ICT] SPECIALLY ADAPTED FOR THE HANDLING OR PROCESSING OF MEDICAL OR HEALTHCARE DATA
- G16H40/00—ICT specially adapted for the management or administration of healthcare resources or facilities; ICT specially adapted for the management or operation of medical equipment or devices
- G16H40/60—ICT specially adapted for the management or administration of healthcare resources or facilities; ICT specially adapted for the management or operation of medical equipment or devices for the operation of medical equipment or devices
- G16H40/63—ICT specially adapted for the management or administration of healthcare resources or facilities; ICT specially adapted for the management or operation of medical equipment or devices for the operation of medical equipment or devices for local operation
-
- A—HUMAN NECESSITIES
- A61—MEDICAL OR VETERINARY SCIENCE; HYGIENE
- A61B—DIAGNOSIS; SURGERY; IDENTIFICATION
- A61B5/00—Measuring for diagnostic purposes; Identification of persons
- A61B5/145—Measuring characteristics of blood in vivo, e.g. gas concentration, pH value; Measuring characteristics of body fluids or tissues, e.g. interstitial fluid, cerebral tissue
- A61B5/1455—Measuring characteristics of blood in vivo, e.g. gas concentration, pH value; Measuring characteristics of body fluids or tissues, e.g. interstitial fluid, cerebral tissue using optical sensors, e.g. spectral photometrical oximeters
-
- Y—GENERAL TAGGING OF NEW TECHNOLOGICAL DEVELOPMENTS; GENERAL TAGGING OF CROSS-SECTIONAL TECHNOLOGIES SPANNING OVER SEVERAL SECTIONS OF THE IPC; TECHNICAL SUBJECTS COVERED BY FORMER USPC CROSS-REFERENCE ART COLLECTIONS [XRACs] AND DIGESTS
- Y02—TECHNOLOGIES OR APPLICATIONS FOR MITIGATION OR ADAPTATION AGAINST CLIMATE CHANGE
- Y02A—TECHNOLOGIES FOR ADAPTATION TO CLIMATE CHANGE
- Y02A90/00—Technologies having an indirect contribution to adaptation to climate change
- Y02A90/10—Information and communication technologies [ICT] supporting adaptation to climate change, e.g. for weather forecasting or climate simulation
Definitions
- the invention relates to methods for studying and utilizing flow waveforms in the peripheral vasculature.
- the invention relates to a method for assessing blood volume by analyzing photoelectric plethysmographic waveforms of the pulse oximeter.
- the degree of systolic pressure variation is a sensitive indicator of hypovolemia.
- Perel A, Pizov R & Cotev S, Systolic blood pressure variation is a sensitive indicator of hyporolemia in ventilated dogs subjected to graded hemorrhage, Anesthesiology 1987; 67:498-502 . This variation is significantly better than heart rate, central venous pressure and mean systemic blood pressure in predicting the degree of hemorrhage which has occurred.
- Perel A Pizov R & Cotev S, Systolic blood pressure variation is a sensitive indicator of hypowlemia in ventilated dogs subjected to graded hemorrhage, Anesthesiology 1987; 67:498-502 ; Pizov R, Ya'ari & Perel A, Systolic pressure variation is greater during hemorrhage than during sodium nitroprusside induced hypotension in ventilated dogs, Anesthesia & Analgesia 1988; 67:170-4 . Chest wall compliance and tidal volume can influence systolic pressure variation.
- Systolic pressure variation can be divided into two distinct components; ⁇ up, which reflects an inspiratory augmentation of the cardiac output, and ⁇ down, which reflects a reduction in cardiac output due to a decrease In venous return.
- ⁇ up which reflects an inspiratory augmentation of the cardiac output
- ⁇ down which reflects a reduction in cardiac output due to a decrease In venous return.
- Perel A Cardiovascular assessment by pressure waveform analysis, ASA Annual Refresher Course Lecture 1991:264 .
- the unique value in systolic pressure variation lies in its ability to reflect the volume responsiveness of the left ventricle.
- Perel A Cardiovascular assessment by pressure waveform analysis, ASA Annual Refresher Course Lecture 1991:264.
- Similar observations have been made with this monitoring system.
- the pulse oximeter has rapidly become one of the most commonly used patient monitoring systems both in and out of the operating room. This popularity is undoubtedly due to the pulse oximeter's ability to monitor both arterial oxygen saturation as well as basic cardiac function (i.e. heart rhythm) non-invasively In addition, it is remarkably easy to use and comfortable for the patient.
- the present invention attempts to expand upon the known usefulness of the pulse oximeter,
- Pulse oximetry is a simple non-invasive method of monitoring the percentage of hemoglobin (Hb) which is saturated with oxygen.
- the pulse oximeter consists of a probe attached to the patient's finger or ear lobe, which is linked to a computerized unit. The unit displays the percentage of Hb saturated with oxygen together with an audible signal for each pulse beat, a calculated heart rate and in some models, a graphical display of the blood flow past the probe. Audible alarms that can be programmed by the user are provided.
- a source of light originates from the probe at two wavelengths (e.g., 650nm and 805nm). The light is partly absorbed by hemoglobin, by amounts which differ depending on whether it is saturated with oxygen.
- the processor can compute the proportion of hemoglobin which is oxygenated.
- the oximeter is dependent on a pulsatile flow and produces a graph of the quality of flow. Where flow is compromised (e.g. by hypovolemia or vasoconstriction), the pulse oximeter may be unable to function.
- the computer within the oximeter is capable of distinguishing pulsatile flow from other more static signals (such as tissue or venous signals) to display only the arterial flow. Fearnley SJ, Pulse Oximtry, Practical Procedures, Issue 5 (1995) Article 2 .
- the pulse oximeter functions as a photoelectric plethysmograph. In this role, it non-invasively measures minute changes in the blood volume of a vascular bed (e.g., finger, ear or forehead).
- the photoelectric plethysmograph is not a new invention. Hertzman AB, The Blood Supply of Various Skin A reas as Estimated By the Photoelectric Plethysmograph, Am. J. Physiol. 1938; 124:328-40 . While the plethysmograph has been examined previously as a potential anesthesia monitoring device, remarkably little research has been done on this ubiquitous signal.
- Dorlas JC & Nijboer JA Photo-electric plethysmography as a monitoring device in anaesthesia. Application and interpretation, British Journal Of Anaesthesia 1985; 57:524-30 .
- the typical pulse oximeter waveform presented to the clinician is a highly filtered and processed signal. It is normal practice for equipment manufactures to use both auto-centering and auto-gain routines on the displayed waveforms so as to minimize variations in the displayed signal. Despite this fact, the pulse oximeter waveform is still rich in information regarding the physiology of the patient. It contains a complex mixture of the influences of arterial, venous, autonomic and respiratory systems on the peripheral circulation. Key to the successful interpretation of this waveform is the ability to separate it into fundamental components.
- Harmonic analysis is one method of studying waveforms. It allows for the extraction of underlying signals that contribute to a complex waveform.
- a similar method has been used previously, with the pulse oximeter and photoelectric plethysmograph to improve the accuracy of the oxygen saturation measurement and to monitor tissue perfusion.
- Rusch TL Sankar R & Scharf JE, Signal processing methods for pulse oximetry, Computers In Biology And Medicine 1996; 26:143-59 ; Stack BJr, Futran ND, Shohet MJ & Scharf JE, Spectral analysis of photoplethysmograms from radial forearm free flaps, Laryngoscope 1998; 108:1329-33 .
- photoelectric plethysmograph can be used to non-invasively measure minute changes in light absorption of living tissue. Hertzman, AB, The Blood Supply of Various Skin A reas as Estimated By the Photoelectric Plethysmograph, Am. J. Physiol. 124: 328-340 (1938 ), Rhythmic fluctuations in this signal are normally attributed to the cardiac pulse bringing more blood into the region being analyzed (i.e., finger, ear or forehead). This fluctuation of the plethysmographic signal is commonly referred to as the AC (arterial) component. The strength of the AC component can be modulated by a variety of factors. These factors would include stroke volume and vascular tone.
- the DC component is the product the light absorption by nonpulsatile tissue. This would include fat, bone, muscle and venous blood.
- the present Invention attempts to achieve this goal by expanding upon the functionality of the pulse oximeter to provide a reliable, convenient and non-invasive mechanism for monitoring blood loss.
- the present invention provides new methods for extracting and utilizing information contained in a pulse oximeter waveform and other means of monitoring flow or pressure waveforms in the peripheral vasculature.
- an object of the present invention to provide a method for assessing blood volume within a subject.
- the method is achieved by generating a cardiovascular waveform representing physiological characteristics of a subject and determining blood volume of the subject by analyzing the cardiovascular waveform.
- the steps of analyzing includes generating a first trace of the per heart-beat maximums of the cardiovascular waveform, which is representative of the systolic pressure upon the cardiovascular signal, generating a second trace of the per heart-beat minimums of the cardiovascular waveforms, which is representative of the diastolic pressure upon the cardiovascular signal, and comparing the respective first trace and the second trace to generate an estimate of relative blood volume within the subject.
- the step of analyzing includes applying harmonic analysis to the cardiovascular waveform, extracting a frequency signal created by ventilation and applying the extracted frequency signal in determining blood volume of the subject.
- the method is achieved by generating a first trace of the per heart-beat maximum of the cardiovascular waveform, generating a second trace of the per heart-beat minimums of the cardiovascular waveform and comparing the respective first trace and the second trace to generate physiological characteristics of a subject.
- the method is achieved by applying harmonic analysis to the cardiovascular waveform, extracting a frequency signal created by ventilation and applying the extracted frequency signal in determining physiological characteristics of a subject.
- the system includes a probe adapted for retrieving cardiovascular waveforms of a subject and a processor associated with the probe for analyzing the retrieved cardiovascular waveforms.
- the processor includes means for determining blood volume of the subject by analyzing the cardiovascular waveform, wherein the step of analyzing includes generating a first trace of the per heart-beat maximums of the cardiovascular waveform, which is representative of the systolic pressure upon the cardiovascular signal, generating a second trace of the per heart-beat minimums of the cardiovascular waveform, which is representative of the diastolic pressure upon the cardiovascular signal, and comparing the respective first trace and the second trace to generate an estimate of relative blood volume within the subject.
- the system includes a probe adopted for retrieving cardiovascular waveforms of a subject and a processor associated with the probe for analyzing the retrieved cardiovascular waveforms.
- the processor includes means for determining blood volume of the subject by analyzing the cardiovascular waveform, wherein the step of analyzing includes applying harmonic analysis to the cardiovascular waveform and extracting a frequency signal created by ventilation; and applying the extracted frequency signal in determining blood volume of the subject.
- a method for assessing blood volume through the analysis of a cardiovascular waveform In particular, a pulse oximeter waveform, is disclosed.
- the present invention monitors relative blood volume or effective blood volume.
- the present method is preferably applied in analyzing blood volume responsiveness (that is, whether a patient needs to be given blood or other fluid).
- blood volume within a subject is monitored by using a pulse oximeter, or photoelectric plethysmograph, to first generate a pulse oximeter waveform representing physiological characteristics of a subject.
- the pulse oximeter waveform may also be considered a photoelectric plethysmographic waveform representing ventilation fluctuation of the subject.
- a photoelectric plethysmograph is a device used to estimate blood flow in a region of the body using photoelectric measurement techniques.
- the present invention is described with reference to pulse oximeters, although other devices capable of measuring ventilation changes might be utilized in accordance with the present invention.
- the concepts underlying the present invention could be utilized in conjunction with a strain gauge plethysmograph within the spirit of the present invention.
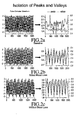
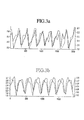
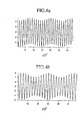
- Analysis is achieved by generating a first trace of the local, that is, per heart-beat, maximums of the pulse oximeter waveform, which is representative of the systolic activities upon the blood volume, and generating a second trace of the local, that is, per heart-beat, minimums of the pulse oximeter waveform, which is representative of the diastolic activities upon the waveform (see Figures 2a, 2b, 2c , 3a, 3b , 5a and 5c ). Thereafter, the amplitude and phase shift of the respective first trace and the second trace are compared to generate an estimate of blood volume within the subject.
- the first trace and the second trace are generated by recording the local maximums and local minimums of the pulse oximeter waveform during ventilation by the subject.
- a determination that the first trace and the second trace are in-phase with low amplitude is indicative of no blood loss, while the degree of phase shift and amplitude increase are indicative of increased blood loss.
- This method of analyzing pulse oximeter, or photoelectric plethysmographic, waveforms allows for the separation of the venous and arterial contributions to the waveform.
- the amplitudes of both the first trace of the local maximum and the second trace of the local minimums will increase proportionally to the degree of blood loss (see Figures 2b , 3a and 5a ).
- this may be referred to as a "venous" response because it has a significant impact on the nonpulsatile component.
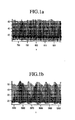
- Figures 4a and 4b respectively represent the venous component and the arterial component of the waveform shown in Figure 1b ; that is, the venous and arterial components of an individual who has lost a substantial amount of blood.
- the venous component as shown in Figure 4a is derived by adding the peaks and troughs of the waveform, and dividing the sum by two.
- Reference to Figure 4a demonstrates the shift in venous blood taking place during ventilation.
- the arterial component is derived by subtracting the troughs from the peaks and dividing the remainder by two.
- Figure 4b demonstrates that the loss of blood in the individual is so great that the individual is missing heartbeats.
- This method of analysis distinguishes between the impact of ventilation on the arterial, pulsatile component (AC) (see Figures 2c , 3b , 4b and 5b ) and the venous, nonpulsatile component (DC) (see Figure 2b , 3a , 4a and 5a ) of the photoelectric plethysmograph.
- This is accomplished by creating first and second traces respectively based upon the local maximums and local minimums of the pulse oximeter waveform during ventilation by the subject.
- the first trace is generated based upon the local maximum (systolic) of the waveform and the second trace is generated based upon the local minimums (diastolic) of the waveform.
- the first and second traces are then superimposed and compared In regards to their amplitude and phase shift. As the amplitude and the phase shift of the two traces increase, the blood loss of the subject is known to be Increasing.
- the amplitudes of the local maximum and local minimum traces, first and second traces respectively, will be of relatively low amplitude and in-phase (see Figures 1a and 2a ).
- the amplitude of both the local maximum and local minimum traces will increase positively related to the degree of blood loss (see Figures 2b , 3a and 5a ). In fact, the amplitudes will continue to increase as the blood loss begins affecting the arterial system.
- the two traces will go out of phase with the local minimum trace occurring earlier then the local maximum trace (see Figures 2c , 3b and 5b ).
- the phase shift is not apparent until the blood loss begins affecting the arterial system.
- the degree of phase shift is proportional to the degree of impact the blood loss is having on cardiac output with each breath. If the local maximums trace occurs earlier than the local minimum trace this would indicate the patient is having ventilation augmentation of their cardiac output, a phenomenon that can occur with congestive heart failure.
- An additional measurement of the non-pulsatile component can be made by taking an average between the local maximum and local minimum.
- the degree of fluctuation of the average during a respiratory cycle corresponds inversely to pre-load (venous) volume; that is, the greater degree of fluctuation the lower the effective venous blood volume.
- An additional measurement of the pulsatile component (arterial) can be made by taking the difference between the local maximum and local minimum.
- the degree of fluctuation of the difference during a respiratory cycle corresponds directly degree of compromise of cardiac stroke volume due to low blood volume. The phase relationship between these two resulting waveforms can be used to determine the degree of ventilatory augmentation vs. dampening of the cardiac stroke volume.
- the ability to mathematically separate the impact of ventilation on the arterial, (pulsatile component) and venous, (nonpulsatile component) allows one to assess the relative blood volume in two different regions of the vascular system (arterial and venous).
- the venous system blood volume is commonly referred to as the "pre-load”.
- the pre-load directly impacts the amount of blood available to the heart before each contraction.
- the arterial system blood volume is commonly referred to as the "after-load”.
- the after-load is a direct product of the cardiac output of the heart (stroke volume X heart rate).
- the sensitivity of this method can be increased by simultaneously measuring the airway pressure.
- the present invention provides a method and apparatus for separating the impact of ventilation on the arterial and venous systems.
- This method is safe (compared to pulmonary artery catheters), noninvasive (compared to the use of dyes or radioactive isotopes), inexpensive (compared to TEE (transesophageal echocardiogram), requires no expertise for its use (unlike TEE) and no calibration is required.
- the clinician is presented with easy-to-understand numeric and a graphic display.
- a display will provide the clinician with a basic numeric representation of blood loss and a waveform for a more studied evaluation of the patient's blood volume situation.
- the inclusion of a waveform with the basic numeric representation will provide the clinician with a way of evaluating the quality of the basic number provided in accordance with the present invention.
- the invention may act as a dual level blood volume monitoring system.
- the venous component can act as part of an "early warning" system regarding the patient's blood volume status.
- the present method would be employed in detecting the reduction in blood volume during the period of time that the body can still compensate. This is during a period of time the blood loss has not impacted yet on the cardiac stroke volume.
- the separation of the venous and arterial components is accomplished by recording the location of local maximums and local minimums of the predetermined pulse oximeter waveform during ventilation. A trace of the local maximums and a trace of the local minimums can then be superimposed and compared for relative amplitude and phase shift. Blood loss is determined as a function of amplitude and phase shift in the manner described above.
- a pulse oximeter waveform another method for assessing blood volume through the analysis of a cardiovascular waveform, in particular, a pulse oximeter waveform.
- blood volume within a subject is monitored by first generating a pulse oximeter waveform representing physiological characteristics of a subject.
- the pulse oximeter waveform is generally a photoelectric plethysmographic waveform representing ventilation fluctuation of the subject.
- blood volume of the subject is determined by analyzing the pulse oximeter waveform or alternative means of monitoring cardiovascular waveforms.
- the harmonic analysis is Fourier analysis, more particularly, joint time-frequency analysis.
- joint time-frequency analysis is a common signal analysis tool utilized in studying frequency changes over time.
- a short-time Fourier transform is employed, although other types of joint time-frequency analysis may be employed.
- the extraction of the frequency signal is achieved using a peak detection algorithm in the frequency range of ventilation.
- the pulse oximeter functions as a photoelectric plethysmograph.
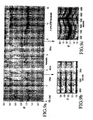
- a pulse oximeter waveform is shown with an associated frequency spectrum generated based upon joint time-frequency analysis which breaks down the complex signals of the pulse oximeter waveform into its underlying sine and cosine waves.
- the signals shown in Figures 6a and 6b are representative of a patient before any blood loss.
- Figure 6b shows the minimal respiratory signal that results from fluctuation in the venous system, while the signal at approximately 1 Hz results from the patient's base heart rate.
- Figure 6b shows that, for the given grayscale, there is no detectable signal at the respiratory frequency (between 0.15 and 0.20 Hz).
- Figure 7b shows an increase in the signal from the respiratory frequency (such that it is now detectable, indicative of the change in blood volume affecting the shifting of venous blood during ventilation.
- Figures 8a and 8b the signals generated for a subject encountering acute blood loss are shown.
- Figure 8b please note the different frequency spectrums of the joint time-frequency analysis as compared with that of the analysis shown in Figure 6b.
- Figure 8b shows an increase in the signal from the respiratory frequency indicative of the change in blood volume affecting the shifting of venous blood during ventilation and the development of secondary harmonics about the base heart rate signal (or cardiac pulse harmonic) resulting from the increased blood loss affecting the arterial system (stroke volume) of the subject.
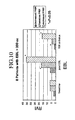
- Figure 9a is the joint time-frequency analysis of a pulse oximeter waveform of a subject as continued blood loss is encountered.
- Figure 9b the joint time-frequency analysis reveals changes in the strength of the signal at the respiratory frequency with the development of harmonics when there is a blood loss of approximately 300cc (indicative of changes in the venous component). This emergence of the respiratory band is similar to that shown in Figure 7b .
- the joint time-frequency analysis of the pulse oximeter waveform produces secondary harmonics surrounding the cardiac pulse harmonic, or primary harmonic, at a continuous blood loss of greater than 900 cc (indicative of changes in the arterial component).
- the development of similar secondary harmonics about the cardiac pulse harmonic of approximately 1 Hz is similarly shown in Figure 8b .
- the pulse oximeter waveform which are discerned via the application of joint time-frequency analysis, arterial and venous components of blood volume may be ascertained from the joint time-frequency analysis of the pulse oximeter waveform.
- the impact on cardiac output maybe monitored by noting the development of secondary harmonics surrounding the cardiac pulse harmonic (see Figure 9c ).
- Such secondary harmonics are not present in a normal person, but might be present in a dehydrated individual although a medical practitioner would certainly be capable of determining whether the noted secondary harmonics are a result of blood loss or dehydration.
- the concepts underlying the present invention were tested upon thirty patient undergoing abdominal surgery by collecting their pulse oximeter waveforms, airway pressure and exhaled CO 2 waveforms (50 Hz).
- the pulse oximeter waveforms were analyzed with a short-time Fourier transform using a moving 4096 point Hanning window of 82 seconds duration.
- the respiratory rate derived in this manner was compared to the respiratory rate as determined by CD 2 detection. In total, 52 hours of telemetry data were analyzed.
- the respiratory rate measured from the pulse oximeter waveform in accordance with the present joint time-frequency analysis was found to have a 0.87 linear correlation when compared to CO 2 detection and airway pressure change.
- the signal strength increased in the presence of blood loss.
- cardiac arrhythmia i.e. atrial fibrillation & frequent premature atrial and ventricular contractions
- Figures 11a and 11b an irregular heart rhythm created a highly distinctive signal when joint time-frequency analysis was applied to the pulse oximeter waveform.
- the data were collected using a computer acquisition system consisting of a 16-bit A-toD PC card (DAQCard AI-16XE-50, National Instruments, Austin, TX) sampling at 50Hz. BioBench (Version 1.0, National Instruments, Austin, TX) was the software used for the acquisition process. Waveform analysis was accomplished with Igor Pro (Version 3.14, WaveMetrics, Inc. Lake Oswego, OR).
- the pulse oximeter waveform was collected with a clinical pulse oximeter (OxiPleth Model 520A, Novametrics, Wallingford, CT) using a standard finger probe.
- the pulse oximeter had its auto-gain function disabled.
- the pulse oximeter waveform collected consists of the AC portion of inverted infrared signal (approximate 940nm).
- the airway pressure and CO 2 were obtained from an Ohmeda RGM gas monitor (model 5250, Datex-Ohmeda, Madison WI).
- the pulse oximeter waveform was analyzed with a short-time Fourier transform using a moving 4096 point Hanning window of 82 seconds duration.
- the frequency signal created by positive pressure ventilation was extracted using a peak detection algorithm in the frequency range of ventilation (0.08 - 0.4 Hz).
- the respiratory rate was derived in this manner and was confirmed by to the respiratory rate as detected by CO 2 production. This was used as the gold standard for comparison purposes.
- the joint time-frequency analysis of the pulse oximeter waveform is created in the following manner.
- the pulse oximeter waveform is converted to a numeric series by analog to digital conversion with sampling of the continuous pulse oximeter output at a rate of 50 Hz.
- the sampled waveform is collected into a digital buffer, presently 4096 points - 82 seconds.
- a windowing function is used on the data in the digital buffer (presently Hanning window is used in accordance with a preferred embodiment of the present invention).
- the windowing function is designed to minimize the effect of the finite range of the sample set.
- a Fourier transform is then preformed on the data set in the digital buffer.
- the data are expanded in a logarithmic fashion.
- the logarithmic expansion is done to compensate for the otherwise overwhelming signal strength for the heart rhythm.
- the result is transferred to a display buffer.
- the digital buffer then accepted new data from the pulse oximeter on a first-in, first-out basis.
- the amount of new data added is determined by respiratory rate measured up to that point. Specifically, the amount of data associated with the time of one breath is added to buffer. This new data was then analyzed by the method outlined in accordance with the "windowing function" step and the Fourier analysis step described above.
- the resulting data are then plotted with Y axis - frequency & X axis- time.
- a number of different techniques can be used to display the results (false color, gray scale, "waterfall” or as a surface plot), without departing from the spirit of the present invention.
- bias The mean (bias), standard deviation (SD) [as a measure of precision], and the upper and lower limits of agreement were calculated.
- the bias was 0.03 breath/min
- SD was 0.557 breath/min
- the upper and lower limits of agreement were 1.145 and -1.083 breath /min respectively.
- the thickness of the primary harmonic band of the joint time-frequency analysis corresponds to the heart rate variability (narrow ⁇ low heart rate variability; wide ⁇ high heart rate variability).
- Ventilation was observed to have two distinct impacts on the pulse oximeter waveform as seen through joint time-frequency analysis. The most commonly seen was a shift of the baseline with each breath. The baseline of the pulse oximeter waveform is often considered to reflect the DC component of the pulse oximeter waveform. Shifts in the baseline are felt to be associated with changes in the venous bed (non pulsatile blood). Dorlas JC & Nijboer JA, Photoelectric plethysmography as a monitoring device in anesthesia, Application and interpretation, British Journal Of Anaesthesia 1985; 57:524-30 . This type of DC modulation was observed in all studied patients during both periods of controlled and spontaneous ventilation. As such, by monitoring shifts in the baseline as manifested in the joint time-frequency analysis, one is able to monitor venous blood volume accordance with the present invention (see Figure 9b ).
- Joint time-frequency analysis allows for the extraction of the underlying frequencies that make up a signal and to observe how these underlying waveforms change over time.
- the plethysmographic waveform that is displayed is a highly processed and filtered signal but is still rich in physiologic information.
- the cardiac pulse waveform is the predominant signal present in pulse oximeter signal.
- the respiratory component when present, can be subtle and difficult to monitor using conventional display methods.
- the same waveform is displayed in the frequency domain (i.e., using joint time-frequency analysis), the respiratory effect is easy to follow. The two most common reasons for inaccurate readings appeared to be motion artifact and irregular heartbeats.
- joint time-frequency analysis of the pulse oximeter waveform offers a variety of advantages.
- it provides for isolation of the respiratory induced changes of the pulse oximeter, which may be related to intra-vascular blood volume. It also allows for separation of the venous and arterial components (AC & DC) of respiratory variability, allowing for a unique detailed analysis of the impact of blood volume on cardiac function (pre-load vs. after-load effects).
- Joint time-frequency analysis also provides a method to determine respiratory rate (both controlled and spontaneous) (see Figure 13 wherein minor peaks of the frequency spectrum are due to respiration), detecting spontaneous breathing patterns, detecting irregularity of heart rate, allowing for the determination of heart rate and estimating heart rate variability by the examination of the width of the primary cardiac pulse harmonic.
- the analysis also provides a method of displaying a large volume of pulse oximeter waveform information in a small area. (Three or more hours of data collection easily fits on one page).
- the present method is resistant to isolated artifacts.
- cardiac arrhythmia such as atrial fibrillation or frequent premature ventricular beats; (which causes a beat to beat variation in the pulse waveform amplitude); excessive ventilator tidal volumes or reduced chest wall compliance would have to be taken into account; or in conditions of low cardiac output (EF ⁇ 30%) the potential exists for augmentation of the ventricular output ( ⁇ up).
- the present invention provides for the development of an algorithm that generates an easily understood and clinically relevant numeric index of respiratory variability. Such an index could then be used to non-invasively monitor the fluid status of patients undergoing surgical procedures.
- This development is part of a larger on-going project to better understand and utilized the pulse oximeter waveform. It is hoped that from this work the next generation of pulse oximeters will be designed to improve clinical monitoring. These improvements could allow for the non-invasive monitoring of volume status, vascular tone and tissue oxygen extraction.
- the present invention is adapted for use with a variety of traditional pulse oximeters, whether employing disposable probes or reusable probes, as well as other related ventilation measuring devices.
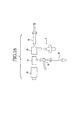
- a pulse oximeter that may be utilized in accordance with the present invention is disclosed.
- a pulse oximeter 10 is generally composed of a probe 12 adapted for positioning over a patient's finger (or at an alternative site such as the forehead or ear) and a central processor 14 with a display 30 coupled to the probe 12 for receiving and displaying information retrieved by the probe 12.
- a generic pulse oximeter 10 is disclosed.
- the pulse oximeter 10 has a photodiode 16 for detecting an optical signal 18 reflected from or transmitted through a volume of intravascular blood (not shown) illuminated by one or more light emitting diodes (LEDs, not shown).
- the LEDs emit electromagnetic radiation at a constant intensity; however, an optical signal 18 with a time-varying intensity is transmitted through or reflected back from the intravascular blood for each of the wavelengths.
- the photodiode 16 generates a low level current proportional to the intensity of the electromagnetic radiation received by the photodiode 16.
- the current is converted to a voltage by a current to voltage converter 20, which may be an operational amplifier in a current to voltage (transimpedance) configuration.
- the signal is then filtered with a filter stage 22 to remove unwanted frequency components, such as any 60 Hz noise generated by fluorescent lighting.
- the filtered signal is then amplified with an amplifier 24 and the amplified signal is sampled and held by a sample and hold 26 while the signal is digitized with a high-resolution (12-bit or higher) analog to digital converter (ADC) 28.
- ADC analog to digital converter
- the digitized signal is then latched by the central processor 14 from the ADC 28.
- the central processor 14 then calculates a coefficient for the oxygen saturation value from the digitized signal and determines the final saturation value by reading the saturation value for the calculated coefficient from a look-up table stored in memory.
- the final saturation value is displayed on a display 30.
- the methods and systems employed in accordance with the present invention are equally applicable to both mechanically ventilated individuals and spontaneously ventilating individuals.
- the concepts underlying the present invention equally apply to mechanically ventilated subject under positive pressure, spontaneously ventilating subjects, spontaneously ventilating subjects with positive expiratory pressure and spontaneous ventilating subjects with inspiratory pressure.
- the waveforms produced by those subjects that are mechanically ventilated exhibit more pronounced variations then those produced by subjects that are spontaneously breathing. This distinction is believed to result from the effect the positive pressure of mechanical ventilation has upon blood pressure and blood flow within a subject. As such, it may be advantageous when monitoring spontaneously ventilating subjects to increase the positive pressure associated with breathing such that the waveforms associated therewith exhibit relevant variations with the same clarity found in mechanically ventilated subjects.
- the intrathoracic pressure generated by ventilatory effort is of greater importance when one is assessing the effects of ventilation on peripheral blood flow in accordance with the present invention.
- This effect which occurs in synchrony with positive pressure ventilation due to a mechanical ventilator, is termed the "ventilator effect".
- the periodic oscillations in ventilatory pressure cause synchronous oscillations in continuous waveforms of peripheral blood pressure and peripheral blood flow.
- the periodic delivery of positive pressure by the ventilator impedes the return of blood to the heart and hence causes a transient decrease in the arterial pressure and peripheral flow that may be measured by a device such as a plethysmograph or laser Doppler flow meter.
- the degree of oscillatory dampening is determined by: a) the amount of positive pressure that is generated by the ventilator; and b) the patient's relative volume status.
- the former is commonly measured by the means of positive pressure mechanical ventilation in an intubated patient but, prior to the present disclosure, was not readily attainable during spontaneous (non-mechanical) ventilation, as would be the case in a nonintubated patient.
- the latter is dependent on the overall fullness of the patient's heart and blood vessels ("volume status"), volume generated with each heartbeat (stroke volume), and the vascular tone.
- the present positive pressure device has been developed for spontaneously breathing subjects.
- the device is designed to measure the pressure associated with each breath of ventilation, measure the pressure generated by a prolonged inhalation or exhalation (e.g., Valsalva maneuver), and provide an adjustable resistance so as to enable us to increase or decrease airway pressure in the spontaneously breathing, nonintubated patient, whether that patient be breathing totally on his/he own, or breathing spontaneously in response to a prompt such as a metronome tone.
- a prolonged inhalation or exhalation e.g., Valsalva maneuver
- the device includes a one-way valve 32 and, a connector with side 34 attached via a stopcock 35 to an electronic pressure transducer 36 and/or an anaeroid meter (not shown) for recording and viewing pressure.
- the device further includes an adaptor 38 for attaching a syringe 40 with occludable holes to provide variable expiratory resistance and a breathing filter 42 through which a subject breathes while holding it in his/her mouth.
- the aforementioned system for delivering positive pressure may be packaged separately or integrated with monitors of oscillatory cardiovascular signals (e.g., pulse oximeter). This would enable monitoring of the rate, depth, and pressure of ventilation.
- the integrated device also could contain a means to prompt a spontaneously breathing patient to breathe at a fixed rate, e.g., a metronome; this would be critical so that one could then determine if the oscillations in the waveform are associated with the ventilatory signal. Additionally, it may be incorporated with a means to monitor rate and depth of respiration by measuring chest and/or abdominal excursion.
- the constant breathing rate of mechanically ventilating subjects produces better waveforms for the purposes of the present invention since the natural variations associated with spontaneous breathing add an additional variable to the process of analyzing the waveforms to determine blood loss.
- the breathing rate may also be controlled through the squeezing of a ventilation bag. This will produce a more consistent breathing rate, resulting in more easily analyzed waveforms.
- the waveform generated in accordance with the present invention may be analyzed with reference to the pulse wave amplitude, (i.e. normalized) respiratory oscillations, etc. so as to normalize the resulting waveforms in an effort to produce more consistent results from subject to subject and monitoring device to monitoring device.
- Ventilation induced changes in a cardiovascular waveform may be monitored in the context of an irregular rate of respiration. The process includes identifying each respiration and then determining the maximum and minimum of the cardiovascular signal for each respiratory interval.
- a respiratory channel as the timing channel for assessment of cardiovascular waveforms. For example, for each breath-to-breath interval, one could record the following from the pulse oximeter signal:
- phase angle between the different measurements e.g., graphic delineation of local mins vs local maxs
- changes in the different measurements may be determined as per published work described in Podgoreanu MV, Stout RG, El-Moalem E, Silverman DG, Synchronous rhythmical vasomotion in the human cuatneous microvasculature during nonpu/satile cardiopulmonary bypass, Anesthesiology 2002; 97:1110-1116 , which adapted the technique for determining phase angle described by Bernardi L, et al., Synchronous and baroreceptor-sensitive oscillations in skin microcirculation: evidence for central autonomic control, Am J Physiol 1997; 273: H1867-1878 .
- the aforementioned means to identify and segregate the arterial and venous components of a cardiovascular waveform such as the plethysmographic waveform of a pulse oximeter, enable one to selectively monitor the arterial or venous component of that waveform with respect to flow (or pressure). They also enable one to select the time of the determination of a measurement such as oxygen saturation so as to isolate arterial oxygenation from venous oxygenation.
- the delineation of the arterial and venous components enables one to modify the actual plethysmographic tracing by a means such as application of pressure to the monitoring probe to a degree that obliterates the low pressure (venous or DC) component. This would cause the tracing to more closely resemble the arterial tracing generated by an intra-arterial catheter. This sequence of steps is illustrated in Figures 17 and 18 .
- the methods of the present invention may include the additional step of monitoring the rate of respiration. This may further include integrating the respiratory signal into a data collection system which also collects input from a cardiovascular signal, identifying one or more breath-to-breath intervals, using the breath-to-breath intervals as the "timing channel" for assessment of the cardiovascular waveform and determining the magnitude and change of the cardiovascular waveform for the given breath or breaths.
- the indices which may be measured in accordance with the present invention are systole, diastole, and/or amplitude of one or more individual pulses. More specifically, the indices monitored include one or more of the following indices determined for one or more intervals:
- the method and system of the present invention may also be utilized where there is positive inspiratory and/or expiratory pressure during ventilation, and wherein the amount of positive pressure is quantified and adjustable.
- the method and system may also provide that the change in the cardiovascular monitor attributed to respiration is normalized to (e.g., expressed as a percentage of) the inspiratory or expiratory pressure and the variation in the cardiovascular monitor attributed to ventilation is normalized to the amplitude of the individual pulse beats.
- the present method and system may also provide that outputs of different monitoring devices obtained from one or more monitoring sites are compared.
- the devices may both be pulse oximeters, or one or more of the devices may be an alternative continuous measure of blood flow (e.g., laser Doppler flow meter) or a continuous measure of blood pressure.
- pressure may be applied to a monitoring device such as an oximeter probe to eliminate the venous component of the tracing and the pressure to eliminate the venous component is quantified so that the venous pressure maybe measured.
- a monitoring device such as an oximeter probe
- oxygen saturation maybe determined independently for the arterial and venous phases.
Abstract

Description
- The invention relates to methods for studying and utilizing flow waveforms in the peripheral vasculature. In particular, the invention relates to a method for assessing blood volume by analyzing photoelectric plethysmographic waveforms of the pulse oximeter.
- There is growing evidence that invasive monitors of volume status, such as the pulmonary artery catheter, may be a source of unacceptably frequent complications. Dalen J & Bone R, Is it time to pull the pulmonary artery catheter?, JAMA 1996; 276:916-14; Connors A, Speroff T & Dawson N, the effectiveness of right heart catheterization in the initial care of critically ill patients, JAMA 1996; 276:889-97. The potential loss of this important monitor from routine peri-operative care necessitates the search for another means of monitoring a patient's blood volume status.
- It has been known for quite some time that ventilation, and especially positive pressure ventilation, can have a significant impact on the cardiovascular system. Cournand A, Motley H, Werko L & Richards D, Physiological studies of the effect of intermittent positive pressure breathing on cardiac output in man, Am J Physiol 1948; 152:162-73; Morgan B, Crawford W & Guntheroth W, The hemodynamic effects of changes in blood volume during intermittent positive-pressure ventilation, Anesthesiology 1969; 30:297-305. The first formal studies of the effect of ventilator induced changes on the arterial pressure were done in the early 1980's. Coyle J, Teplick R, Long M & Davison J, Respiratory variations in systemic arterial pressure as an indicator of volume status, Anesthesiology 1983; 59:A53; Jardin F, Farcot J, Gueret P et al., Cyclic changes in arterial pulse during respiratory support, Circulation 1983; 68:266-74. This was soon followed bythe intensive investigations of Azriel Perel. He coined the term "systolic pressure variation" to describe this phenomenon. Along with various co-investigators, his research has encompassed over twenty articles and abstracts on the topic. From this significant body of work, based on both animal and human data, a number of conclusions have been drawn.
- The degree of systolic pressure variation is a sensitive indicator of hypovolemia. Perel A, Pizov R & Cotev S, Systolic blood pressure variation is a sensitive indicator of hyporolemia in ventilated dogs subjected to graded hemorrhage, Anesthesiology 1987; 67:498-502. This variation is significantly better than heart rate, central venous pressure and mean systemic blood pressure in predicting the degree of hemorrhage which has occurred. Perel A, Pizov R & Cotev S, Systolic blood pressure variation is a sensitive indicator of hypowlemia in ventilated dogs subjected to graded hemorrhage, Anesthesiology 1987; 67:498-502; Pizov R, Ya'ari & Perel A, Systolic pressure variation is greater during hemorrhage than during sodium nitroprusside induced hypotension in ventilated dogs, Anesthesia & Analgesia 1988; 67:170-4. Chest wall compliance and tidal volume can influence systolic pressure variation. Szold A, Pizov R, Segal E & Perel A, The effect of tidal volume and intravascular volume state on systolic presure variation in ventilated dogs, Intensive Care Medicine 1989; 15:368-71. Changes in systolic pressure variation correspond closely to changes in cardiac output. Ornstein E, Eidelman L, Drenger B et al, Sytolic presure variation predicts the response to acute blood loss, blood loss, Journal of Clinical Anesthesia 1998; 10:137-40; Pizov R, Segal E, Kaplan L et al., The use of systolic pressure variation in hemodynamic monitoring during deliberate hypotension in spine surgery, Journal of Clinical Anesthesia 1990; 2:96-100.
- Systolic pressure variation can be divided into two distinct components; Δup, which reflects an inspiratory augmentation of the cardiac output, and Δdown, which reflects a reduction in cardiac output due to a decrease In venous return. Perel A, Cardiovascular assessment by pressure waveform analysis, ASA Annual Refresher Course Lecture 1991:264. The unique value in systolic pressure variation lies in its ability to reflect the volume responsiveness of the left ventricle. Perel A, Cardiovascular assessment by pressure waveform analysis, ASA Annual Refresher Course Lecture 1991:264. In recent years, with the increased availability of the pulse oximeter waveform, similar observations have been made with this monitoring system. Partridge BL, Use of pulse oximetry as a noniravasive indicator of intravascular volume status, Journal of Clinical Monitoring 1987; 3:263-8; Lherm T, Chevalier T, Troche G et al., Correlation between plethysmography curve variation (dpleth) and pulmonary capillary wedge pressure (pcwp) in mechanically ventilated patients, British Journal of Anaesthesia 1995; Suppl. 1:41; Shamir M, Eidelman LA et al., Pulse oximetry plethysmographic waveform during changes in blood volume, British Journal Of Anaesthesia 82(2): 178-81 (1999). To date though, there has been remarkably little work done to document or quantifythis phenomenon. Limitations of the aforementioned include:
- 1) Lack of a method of continuous measurement of the phenomenon.
- 2) Reliance on positive pressure and mechanical ventilation; and the requirement of ventilator maneuvers such as periods of apnea.
- 3) Lack of recognition of the venous contribution to the plethysmographic signal.
- 4) The lack of algorithms resistant to artifacts.
- The pulse oximeter has rapidly become one of the most commonly used patient monitoring systems both in and out of the operating room. This popularity is undoubtedly due to the pulse oximeter's ability to monitor both arterial oxygen saturation as well as basic cardiac function (i.e. heart rhythm) non-invasively In addition, it is remarkably easy to use and comfortable for the patient. The present invention attempts to expand upon the known usefulness of the pulse oximeter,
- Pulse oximetry is a simple non-invasive method of monitoring the percentage of hemoglobin (Hb) which is saturated with oxygen. The pulse oximeter consists of a probe attached to the patient's finger or ear lobe, which is linked to a computerized unit. The unit displays the percentage of Hb saturated with oxygen together with an audible signal for each pulse beat, a calculated heart rate and in some models, a graphical display of the blood flow past the probe. Audible alarms that can be programmed by the user are provided. A source of light originates from the probe at two wavelengths (e.g., 650nm and 805nm). The light is partly absorbed by hemoglobin, by amounts which differ depending on whether it is saturated with oxygen. By calculating the absorption at the two wavelengths the processor can compute the proportion of hemoglobin which is oxygenated. The oximeter is dependent on a pulsatile flow and produces a graph of the quality of flow. Where flow is compromised (e.g. by hypovolemia or vasoconstriction), the pulse oximeter may be unable to function. The computer within the oximeter is capable of distinguishing pulsatile flow from other more static signals (such as tissue or venous signals) to display only the arterial flow. Fearnley SJ, Pulse Oximtry, Practical Procedures, Issue 5 (1995) .
- In the process of determining oxygen saturation, the pulse oximeter functions as a photoelectric plethysmograph. In this role, it non-invasively measures minute changes in the blood volume of a vascular bed (e.g., finger, ear or forehead). The photoelectric plethysmograph is not a new invention. Hertzman AB, The Blood Supply of Various Skin A reas as Estimated By the Photoelectric Plethysmograph, Am. J. Physiol. 1938; 124:328-40. While the plethysmograph has been examined previously as a potential anesthesia monitoring device, remarkably little research has been done on this ubiquitous signal. Dorlas JC & Nijboer JA, Photo-electric plethysmography as a monitoring device in anaesthesia. Application and interpretation, British Journal Of Anaesthesia 1985; 57:524-30.
- It is important to understand that the typical pulse oximeter waveform presented to the clinician is a highly filtered and processed signal. It is normal practice for equipment manufactures to use both auto-centering and auto-gain routines on the displayed waveforms so as to minimize variations in the displayed signal. Despite this fact, the pulse oximeter waveform is still rich in information regarding the physiology of the patient. It contains a complex mixture of the influences of arterial, venous, autonomic and respiratory systems on the peripheral circulation. Key to the successful interpretation of this waveform is the ability to separate it into fundamental components.
- Harmonic analysis (Fourier analysis) is one method of studying waveforms. It allows for the extraction of underlying signals that contribute to a complex waveform. A similar method has been used previously, with the pulse oximeter and photoelectric plethysmograph to improve the accuracy of the oxygen saturation measurement and to monitor tissue perfusion. Rusch TL, Sankar R & Scharf JE, Signal processing methods for pulse oximetry, Computers In Biology And Medicine 1996; 26:143-59; Stack BJr, Futran ND, Shohet MJ & Scharf JE, Spectral analysis of photoplethysmograms from radial forearm free flaps, Laryngoscope 1998; 108:1329-33.
- In addition, it is previously know that photoelectric plethysmograph can be used to non-invasively measure minute changes in light absorption of living tissue. Hertzman, AB, The Blood Supply of Various Skin A reas as Estimated By the Photoelectric Plethysmograph, Am. J. Physiol. 124: 328-340 (1938), Rhythmic fluctuations in this signal are normally attributed to the cardiac pulse bringing more blood into the region being analyzed (i.e., finger, ear or forehead). This fluctuation of the
plethysmographic signal is commonly referred to as the AC (arterial) component. The strength of the AC component can be modulated by a variety of factors. These factors would include stroke volume and vascular tone. - In addition to the cardiac pulse, there is a nonpulsatile (or weakly pulsatile) component of the plethysmograph signal commonly referred to as the DC component. The DC component is the product the light absorption by nonpulsatile tissue. This would include fat, bone, muscle and venous blood.
- Fluctuations in the photoelectric plethysmograph due to respiration/ventilation can also be detected. Johansson A & Oberg PA, Estimation of respiratory volumes from the photoplethysmographic signal. Part I: Experimental results, Medical And Biological Engineering And Computing 37(1): 42-7 (1999). These fluctuations have been used in the past in an attempt to estimate the degree of relative blood volume of patients undergoing surgery. Partridge BL, Use of pulse oximetry as a noninvasive indicator of intravascular volume status, Journal of Clinical Monitoring 3(4): 263-8 (1987); Shamir M, Eidelman LA et al., Pulse oximetry plethysmographic waveform during changes in blood volume, British Journal Of Anaesthesia 82(2): 178-81 (1999). Up until the development of the present invention, there has been a lack of recognition that respiratory signal modulates both the AC and DC components of the photo-plethysmograph.
- With the foregoing in mind, it is apparent that a need exists for an improved method for efficiently non-invasively monitoring the blood volume of a subject. The present Invention attempts to achieve this goal by expanding upon the functionality of the pulse oximeter to provide a reliable, convenient and non-invasive mechanism for monitoring blood loss. In addition, the present invention provides new methods for extracting and utilizing information contained in a pulse oximeter waveform and other means of monitoring flow or pressure waveforms in the peripheral vasculature.
- It is, therefore, an object of the present invention to provide a method for assessing blood volume within a subject. The method is achieved by generating a cardiovascular waveform representing physiological characteristics of a subject and determining blood volume of the subject by analyzing the cardiovascular waveform. In a preferred embodiment the steps of analyzing includes generating a first trace of the per heart-beat maximums of the cardiovascular waveform, which is representative of the systolic pressure upon the cardiovascular signal, generating a second trace of the per heart-beat minimums of the cardiovascular waveforms, which is representative of the diastolic pressure upon the cardiovascular signal, and comparing the respective first trace and the second trace to generate an estimate of relative blood volume within the subject.
- It is also an object of the present invention to provide a method for assessing blood volume within a subject wherein the method is achieved by generating a cardiovascular waveform representing physiological characteristics of a subject and determining blood volume of the subject by analyzing the cardiovascular waveform. The step of analyzing includes applying harmonic analysis to the cardiovascular waveform, extracting a frequency signal created by ventilation and applying the extracted frequency signal in determining blood volume of the subject.
- It is another object of the present invention to provide a method for assessing a cardiovascular waveform. The method is achieved by generating a first trace of the per heart-beat maximum of the cardiovascular waveform, generating a second trace of the per heart-beat minimums of the cardiovascular waveform and comparing the respective first trace and the second trace to generate physiological characteristics of a subject.
- It is a further object of the present invention to provide a method for assessing a cardiovascular waveform. The method is achieved by applying harmonic analysis to the cardiovascular waveform, extracting a frequency signal created by ventilation and applying the extracted frequency signal in determining physiological characteristics of a subject.
- It is still another object of the present invention to provide a system for assessing blood volume within a subject. The system includes a probe adapted for retrieving cardiovascular waveforms of a subject and a processor associated with the probe for analyzing the retrieved cardiovascular waveforms. The processor includes means for determining blood volume of the subject by analyzing the cardiovascular waveform, wherein the step of analyzing includes generating a first trace of the per heart-beat maximums of the cardiovascular waveform, which is representative of the systolic pressure upon the cardiovascular signal, generating a second trace of the per heart-beat minimums of the cardiovascular waveform, which is representative of the diastolic pressure upon the cardiovascular signal, and comparing the respective first trace and the second trace to generate an estimate of relative blood volume within the subject.
- It is yet a further object of the present invention to provide a system for assessing blood volume within a subject. The system includes a probe adopted for retrieving cardiovascular waveforms of a subject and a processor associated with the probe for analyzing the retrieved cardiovascular waveforms. The processor includes means for determining blood volume of the subject by analyzing the cardiovascular waveform, wherein the step of analyzing includes applying harmonic analysis to the cardiovascular waveform and extracting a frequency signal created by ventilation; and applying the extracted frequency signal in determining blood volume of the subject.
- Other objects and advantages of the present invention will become apparent from the following detailed description when viewed in conjunction with the accompanying drawings, which set forth certain embodiments of the invention.
-
-
Figures 1a and 1b respectively show a baseline pulse oximeter waveform (Figure 1a ) vs. a pulse oximeter waveform exhibiting an acute blood loss effect (Figure 1b ). -
Figures 2a, 2b and 2c demonstrate the isolation of the local maximum and local minimum traces and their comparison during the different phases of blood loss. -
Figures 3a and 3b are detailed displays of the local maximum and local minimum traces demonstrating the phase shift with continued blood loss (solid lines=local maximum, broken lines =local minimums) with the upper graph (Figure 3a ) representing venous impact and the lower graph (Figure 3b ) representing arterial impact. -
Figures 4a and 4b present idealized representations of pure venous signal (Figure 4a ) and pure arterial signal (Figure 4b ) extracted from the pulse oximeter waveform. -
Figures 5a and 5b show respective displays of extracted local minimum and local maximum traces overlaid on the original pulse oximeter waveform. The upper graph (Figure 5a ) demonstrates moderate blood loss effect (venous effect) and lower graph (Figure 5b ) demonstrates significant blood loss effect (arterial effect). -
Figures 6a and 6b show the transformation of a pulse oximeter waveform of a subject with normal blood volume via joint time-frequency analysis. -
Figures 7a and 7b show the transformation of a pulse oximeter waveform of a subject with a moderate loss of blood volume via joint time-frequency analysis. -
Figures 8a and 8b show the transformation of a pulse oximeter waveform of a subject with an acute loss of blood volume via joint time-frequency analysis. -
Figures 9a, 9b and 9c respectively show the joint time-frequency analysis of a pulse oximeter waveform of a subject over time, a detailed view of the joint time-frequency analysis with blood loss of approximately 100 cc and a detailed view of the joint time-frequency analysis with blood loss in excess of 900 cc. -
Figure 10 is a chart of testing performed in accordance with the present invention. The chart shows the fluctuation in the pulse oximeter waveform (RVI) related to intraoperative bleeding (EBL) and peak airway pressure (PAW). -
Figures 11a and 11b respectively show the joint time-frequency analysis and EKG of a subject with arrhythmia. -
Figures 12a and 12b respectively show joint time-frequency analysis and airway pressure. -
Figure 13 demonstrates the construction of a joint time-frequency analysis from a pulse oximeter (photoelectric plethysmograph) waveform. The graphs also demonstrate the manner in which cardiac pulse rates and respiratory rates may be extracted from the analysis. -
Figure 14 is a perspective view of a pulse oximeter that may be employed in accordance with the present invention. -
Figure 15 is a schematic of convention circuitry utilized in conjunction with pulse oximeters. -
Figure 16 is an exploded schematic of a positive pressure device in accordance with the present invention. -
Figure 17 is a reflective plethysmographic signal from three different sites (finger, ear, and forehead) from a supine patient. -
Figure 18 are graphs showing the application of pressure to the forehead probe that obliterates the low pressure (venous or DC) component. This causes the tracing to more closely resemble the arterial tracing generated by an intra-arterial catheter. - The detailed embodiments of the present invention are disclosed herein. It should be understood, however, that the disclosed embodiments are merely exemplary of the invention, which may be embodied in various forms. Therefore, the details disclosed herein are not to be interpreted as limiting, but merely as the basis for the claims and as a basis for teaching one skilled in the art how to make and/or use the invention.
- With reference to
Figures 1 to 5 , and in accordance with a first embodiment of the present invention, a method for assessing blood volume through the analysis of a cardiovascular waveform, In particular, a pulse oximeter waveform, is disclosed. As the following disclosure will clearly demonstrate, the present invention monitors relative blood volume or effective blood volume. As such, the present method is preferably applied in analyzing blood volume responsiveness (that is, whether a patient needs to be given blood or other fluid). - In accordance with a preferred embodiment of the present invention, blood volume within a subject is monitored by using a pulse oximeter, or photoelectric plethysmograph, to first generate a pulse oximeter waveform representing physiological characteristics of a subject. The pulse oximeter waveform may also be considered a photoelectric plethysmographic waveform representing ventilation fluctuation of the subject. Those skilled in the art will understand that a photoelectric plethysmograph is a device used to estimate blood flow in a region of the body using photoelectric measurement techniques. In addition, those skilled in the art will understand that the present invention is described with reference to pulse oximeters, although other devices capable of measuring ventilation changes might be utilized in accordance with the present invention. For example, the concepts underlying the present invention could be utilized in conjunction with a strain gauge plethysmograph within the spirit of the present invention.
- Analysis is achieved by generating a first trace of the local, that is, per heart-beat, maximums of the pulse oximeter waveform, which is representative of the systolic activities upon the blood volume, and generating a second trace of the local, that is, per heart-beat, minimums of the pulse oximeter waveform, which is representative of the diastolic activities upon the waveform (see
Figures 2a, 2b, 2c ,3a, 3b ,5a and 5c ). Thereafter, the amplitude and phase shift of the respective first trace and the second trace are compared to generate an estimate of blood volume within the subject. - Briefly, the first trace and the second trace are generated by recording the local maximums and local minimums of the pulse oximeter waveform during ventilation by the subject. In practice, a determination that the first trace and the second trace are in-phase with low amplitude is indicative of no blood loss, while the degree of phase shift and amplitude increase are indicative of increased blood loss.
- This method of analyzing pulse oximeter, or photoelectric plethysmographic, waveforms allows for the separation of the venous and arterial contributions to the waveform. For example, during the time of moderate blood loss (or, more specifically moderate hypovolemia), the amplitudes of both the first trace of the local maximum and the second trace of the local minimums will increase proportionally to the degree of blood loss (see
Figures 2b ,3a and5a ). For purposes of this discussion, this may be referred to as a "venous" response because it has a significant impact on the nonpulsatile component. With continued blood loss, the impact focuses upon the arterial system and the first and second traces go out of phase with oscillations of the local minimum traces occurring earlier than the oscillations of the local maximum traces (seeFigures 2c ,3b and5b ). Analysis of these traces is done in such a way that the waveform may be used to determine a patient's effective blood volume, or more accurately, volume responsiveness. - The difference between the venous response and the arterial response is shown in
Figures 4a and 4b . In particular,Figures 4a and 4b respectively represent the venous component and the arterial component of the waveform shown inFigure 1b ; that is, the venous and arterial components of an individual who has lost a substantial amount of blood. The venous component as shown inFigure 4a is derived by adding the peaks and troughs of the waveform, and dividing the sum by two. Reference toFigure 4a demonstrates the shift in venous blood taking place during ventilation. With regard toFigure 4b , the arterial component is derived by subtracting the troughs from the peaks and dividing the remainder by two.Figure 4b demonstrates that the loss of blood in the individual is so great that the individual is missing heartbeats. - This method of analysis distinguishes between the impact of ventilation on the arterial, pulsatile component (AC) (see
Figures 2c ,3b ,4b and5b ) and the venous, nonpulsatile component (DC) (seeFigure 2b ,3a ,4a and5a ) of the photoelectric plethysmograph. This is accomplished by creating first and second traces respectively based upon the local maximums and local minimums of the pulse oximeter waveform during ventilation by the subject. The first trace is generated based upon the local maximum (systolic) of the waveform and the second trace is generated based upon the local minimums (diastolic) of the waveform. The first and second traces are then superimposed and compared In regards to their amplitude and phase shift. As the amplitude and the phase shift of the two traces increase, the blood loss of the subject is known to be Increasing. - In a normal patient, who has not suffered blood volume loss, the amplitudes of the local maximum and local minimum traces, first and second traces respectively, will be of relatively low amplitude and in-phase (see
Figures 1a and2a ). During the time of "venous" loss, the amplitude of both the local maximum and local minimum traces will increase positively related to the degree of blood loss (seeFigures 2b ,3a and5a ). In fact, the amplitudes will continue to increase as the blood loss begins affecting the arterial system. - With continued blood volume loss, the two traces will go out of phase with the local minimum trace occurring earlier then the local maximum trace (see
Figures 2c ,3b and5b ). The phase shift is not apparent until the blood loss begins affecting the arterial system. The degree of phase shift is proportional to the degree of impact the blood loss is having on cardiac output with each breath. If the local maximums trace occurs earlier than the local minimum trace this would indicate the patient is having ventilation augmentation of their cardiac output, a phenomenon that can occur with congestive heart failure. - These two measurements, the amplitude and phase shift of the local maximum and local minimum traces, taken together give an index of volume responsiveness of the patient. If the amplitudes are increased and phase shift has occurred, increasing the patient's blood volume through transfusion should increase the total cardiac output of the patient.
- An additional measurement of the non-pulsatile component can be made by taking an average between the local maximum and local minimum. The degree of fluctuation of the average during a respiratory cycle corresponds inversely to pre-load (venous) volume; that is, the greater degree of fluctuation the lower the effective venous blood volume. An additional measurement of the pulsatile component (arterial) can be made by taking the difference between the local maximum and local minimum. The degree of fluctuation of the difference during a respiratory cycle corresponds directly degree of compromise of cardiac stroke volume due to low blood volume. The phase relationship between these two resulting waveforms can be used to determine the degree of ventilatory augmentation vs. dampening of the cardiac stroke volume.
- The ability to mathematically separate the impact of ventilation on the arterial, (pulsatile component) and venous, (nonpulsatile component) allows one to assess the relative blood volume in two different regions of the vascular system (arterial and venous). The venous system blood volume is commonly referred to as the "pre-load". The pre-load directly impacts the amount of blood available to the heart before each contraction. The arterial system blood volume is commonly referred to as the "after-load". The after-load is a direct product of the cardiac output of the heart (stroke volume X heart rate). The sensitivity of this method can be increased by simultaneously measuring the airway pressure.
- The present invention provides a method and apparatus for separating the impact of ventilation on the arterial and venous systems. This method is safe (compared to pulmonary artery catheters), noninvasive (compared to the use of dyes or radioactive isotopes), inexpensive (compared to TEE (transesophageal echocardiogram), requires no expertise for its use (unlike TEE) and no calibration is required. The clinician is presented with easy-to-understand numeric and a graphic display.
- As those skilled in the art will certainly appreciate, it is desirable to provide clinicians with a warning regarding venous impact and an "alarm" when the blood loss has reach a quantity where it is affecting the arterial system. With this in mind, it is contemplated a display will provide the clinician with a basic numeric representation of blood loss and a waveform for a more studied evaluation of the patient's blood volume situation. The inclusion of a waveform with the basic numeric representation will provide the clinician with a way of evaluating the quality of the basic number provided in accordance with the present invention.
- It is contemplated in accordance with a preferred embodiment that the invention may act as a dual level blood volume monitoring system. The venous component can act as part of an "early warning" system regarding the patient's blood volume status. As such, the present method would be employed in detecting the reduction in blood volume during the period of time that the body can still compensate. This is during a period of time the blood loss has not impacted yet on the cardiac stroke volume.
- With further blood loss, the arterial component is impacted. This "alarm" phase would indicate that cardiac function is now being compromised by the loss of blood volume. Blood volume replacement therapy could then be guided by this dual level system.
- As discussed above, the separation of the venous and arterial components is accomplished by recording the location of local maximums and local minimums of the predetermined pulse oximeter waveform during ventilation. A trace of the local maximums and a trace of the local minimums can then be superimposed and compared for relative amplitude and phase shift. Blood loss is determined as a function of amplitude and phase shift in the manner described above.
- With regard to
Figures 6 to 12 , and in accordance with an alternate embodiment of the present invention, another method for assessing blood volume through the analysis of a cardiovascular waveform, in particular, a pulse oximeter waveform, is disclosed. In accordance with a preferred embodiment of the present invention, blood volume within a subject is monitored by first generating a pulse oximeter waveform representing physiological characteristics of a subject. The pulse oximeter waveform is generally a photoelectric plethysmographic waveform representing ventilation fluctuation of the subject. Thereafter, blood volume of the subject is determined by analyzing the pulse oximeter waveform or alternative means of monitoring cardiovascular waveforms. - Analysis is achieved by applying harmonic analysis to the pulse oximeter waveform, extracting a frequency signal created by ventilation, most commonly positive pressure ventilation, and applying the extracted frequency signal in determining blood volume of the subject. In accordance with a preferred embodiment of the present invention, the harmonic analysis is Fourier analysis, more particularly, joint time-frequency analysis. As those skilled in the art will certainly appreciate, joint time-frequency analysis is a common signal analysis tool utilized in studying frequency changes over time. In accordance with a preferred embodiment of the present invention, a short-time Fourier transform is employed, although other types of joint time-frequency analysis may be employed. In addition, the extraction of the frequency signal is achieved using a peak detection algorithm in the frequency range of ventilation.
- As mentioned in the Background of the Invention, in the process of determining oxygen saturation, the pulse oximeter functions as a photoelectric plethysmograph. By analyzing how the frequency spectrum of the pulse oximeter waveform changes over time in accordance with the present invention, new clinically relevant features can be extracted.
- Referring to
Figures 6a and 6b , a pulse oximeter waveform is shown with an associated frequency spectrum generated based upon joint time-frequency analysis which breaks down the complex signals of the pulse oximeter waveform into its underlying sine and cosine waves. The signals shown inFigures 6a and 6b are representative of a patient before any blood loss. In particular,Figure 6b shows the minimal respiratory signal that results from fluctuation in the venous system, while the signal at approximately 1 Hz results from the patient's base heart rate.Figure 6b shows that, for the given grayscale, there is no detectable signal at the respiratory frequency (between 0.15 and 0.20 Hz). - Referring to
Figures 7a and 7b , the signals generated far a subject encountering moderate blood loss only affecting the venous system (pre-load) are shown.Figure 7b shows an increase in the signal from the respiratory frequency (such that it is now detectable, indicative of the change in blood volume affecting the shifting of venous blood during ventilation. - Now referring to
Figures 8a and 8b , the signals generated for a subject encountering acute blood loss are shown. With reference toFigure 8b , please note the different frequency spectrums of the joint time-frequency analysis as compared with that of the analysis shown inFigure 6b. Figure 8b shows an increase in the signal from the respiratory frequency indicative of the change in blood volume affecting the shifting of venous blood during ventilation and the development of secondary harmonics about the base heart rate signal (or cardiac pulse harmonic) resulting from the increased blood loss affecting the arterial system (stroke volume) of the subject. - The effects of increased blood loss are further demonstrated with reference to
Figures 9a, 9b and 9c . Specifically,Figure 9a is the joint time-frequency analysis of a pulse oximeter waveform of a subject as continued blood loss is encountered. As is shown inFigure 9b , the joint time-frequency analysis reveals changes in the strength of the signal at the respiratory frequency with the development of harmonics when there is a blood loss of approximately 300cc (indicative of changes in the venous component). This emergence of the respiratory band is similar to that shown inFigure 7b . - The joint time-frequency analysis of the pulse oximeter waveform produces secondary harmonics surrounding the cardiac pulse harmonic, or primary harmonic, at a continuous blood loss of greater than 900 cc (indicative of changes in the arterial component). The development of similar secondary harmonics about the cardiac pulse harmonic of approximately 1 Hz is similarly shown in
Figure 8b . - As a result of these differing changes the pulse oximeter waveform, which are discerned via the application of joint time-frequency analysis, arterial and venous components of blood volume may be ascertained from the joint time-frequency analysis of the pulse oximeter waveform. Specifically, by monitoring shifts in the frequency baseline as manifested in the joint time-frequency analysis of the pulse oximeter waveform, one is able to monitor venous blood volume in accordance with the present invention (see
Figure 9b ). The impact on cardiac output maybe monitored by noting the development of secondary harmonics surrounding the cardiac pulse harmonic (seeFigure 9c ). Such secondary harmonics are not present in a normal person, but might be present in a dehydrated individual although a medical practitioner would certainly be capable of determining whether the noted secondary harmonics are a result of blood loss or dehydration. - The result of the application of the present analysis technique to 8 patients is shown in
Figure 10 . - The concepts underlying the present invention were tested upon thirty patient undergoing abdominal surgery by collecting their pulse oximeter waveforms, airway pressure and exhaled CO2 waveforms (50 Hz). The pulse oximeter waveforms were analyzed with a short-time Fourier transform using a moving 4096 point Hanning window of 82 seconds duration. The frequency signal created by positive pressure ventilation was extracted using a peak detection algorithm in the frequency range of ventilation (0.08 - 0.4 Hz = 5 - 24 breaths/minute). The respiratory rate derived in this manner was compared to the respiratory rate as determined by CD2 detection. In total, 52 hours of telemetry data were analyzed. The respiratory rate measured from the pulse oximeter waveform in accordance with the present joint time-frequency analysis was found to have a 0.87 linear correlation when compared to CO2 detection and airway pressure change. The signal strength increased in the presence of blood loss.
- Despite the success of the present method as tested through comparison with CO2 detection, it was found that cardiac arrhythmia (i.e. atrial fibrillation & frequent premature atrial and ventricular contractions) proved to be the primary cause of failure of this technique. As shown in
Figures 11a and 11b , an irregular heart rhythm created a highly distinctive signal when joint time-frequency analysis was applied to the pulse oximeter waveform. - More particularly, 30 patients undergoing abdominal hysterectomy under general anesthesia had their pulse oximeter waveform, airway pressure and CO2 waveform collected. As a part of their anesthetic, all patients were intubated after an induction with propofol and vecuronium. Anesthesia, was maintained with nitrous oxide (60%-70%) and isoflurane (1%-2%). The ventilator was set to a tidal volume of 10cc/kg at an inspiratory to expiratory (I:E) ratio of 1:2. During the surgery, estimated blood loss was closely followed and recorded, as well as replacement fluid given to the patient. Three times during the surgical procedure the ventilator was adjusted. This adjustment consisted of increasing the tidal volume until the peak pressure airway pressure was increased above baseline by 10 cm H2O (to maximum of 35 cm H2O). This higher setting was maintained for 5 mins and then returned to baseline.
- The data were collected using a computer acquisition system consisting of a 16-bit A-toD PC card (DAQCard AI-16XE-50, National Instruments, Austin, TX) sampling at 50Hz. BioBench (Version 1.0, National Instruments, Austin, TX) was the software used for the acquisition process. Waveform analysis was accomplished with Igor Pro (Version 3.14, WaveMetrics, Inc. Lake Oswego, OR).
- The pulse oximeter waveform was collected with a clinical pulse oximeter (OxiPleth Model 520A, Novametrics, Wallingford, CT) using a standard finger probe. The pulse oximeter had its auto-gain function disabled. The pulse oximeter waveform collected consists of the AC portion of inverted infrared signal (approximate 940nm). The airway pressure and CO2 were obtained from an Ohmeda RGM gas monitor (model 5250, Datex-Ohmeda, Madison WI).
- The pulse oximeter waveform was analyzed with a short-time Fourier transform using a moving 4096 point Hanning window of 82 seconds duration. The frequency signal created by positive pressure ventilation was extracted using a peak detection algorithm in the frequency range of ventilation (0.08 - 0.4 Hz). The respiratory rate was derived in this manner and was confirmed by to the respiratory rate as detected by CO2 production. This was used as the gold standard for comparison purposes.
- More particularly, and in accordance with a preferred embodiment of the present invention, the joint time-frequency analysis of the pulse oximeter waveform is created in the following manner. The pulse oximeter waveform is converted to a numeric series by analog to digital conversion with sampling of the continuous pulse oximeter output at a rate of 50 Hz. The sampled waveform is collected into a digital buffer, presently 4096 points - 82 seconds. A windowing function is used on the data in the digital buffer (presently Hanning window is used in accordance with a preferred embodiment of the present invention). The windowing function is designed to minimize the effect of the finite range of the sample set.
- A Fourier transform is then preformed on the data set in the digital buffer. The data are expanded in a logarithmic fashion. The logarithmic expansion, an optimal step, is done to compensate for the otherwise overwhelming signal strength for the heart rhythm. The result is transferred to a display buffer. The digital buffer then accepted new data from the pulse oximeter on a first-in, first-out basis. The amount of new data added is determined by respiratory rate measured up to that point. Specifically, the amount of data associated with the time of one breath is added to buffer. This new data was then analyzed by the method outlined in accordance with the "windowing function" step and the Fourier analysis step described above.
- The resulting data are then plotted with Y axis - frequency & X axis- time. A number of different techniques can be used to display the results (false color, gray scale, "waterfall" or as a surface plot), without departing from the spirit of the present invention.
- In total, 52 hours of telemetry data were analyzed. The respiratory rate measured from the pulse oximeter waveform had a 0.89 linear correlation (Person coefficient of correlation) when compared to CO2 detection as a method of detecting ventilation. Further analysis was done using the method described by Bland and Altman. Bland JM & Altman DG, A note on the use of the intradass correlation coefficient in the evaluation of agreement between two methods of measurement, Computers In Biology And Medicine 1990; 20:337-40. The differences between each pair of values obtained using the two different methods were plotted as the Y-axis, whereas the averages of the each pair of values obtained using the two different methods were plotted as the X-axis. The mean (bias), standard deviation (SD) [as a measure of precision], and the upper and lower limits of agreement were calculated. The bias was 0.03 breath/min, SD was 0.557 breath/min and the upper and lower limits of agreement were 1.145 and -1.083 breath /min respectively.
- As mentioned above, review of the data generated after joint time-frequency analysis revealed that the presence of cardiac arrhythmia (i.e. atrial-fibrillation & frequent PVC/PAC) proved to be the primary cause of failure of the present methodology.
- Analysis of the data generated as a result of the joint time-frequency analysis revealed two factors that appeared to influence the strength of the respiratory signal contained in the pulse oximeter waveform; 1) the airway pressure (see
Figures 12a and 12b ) and 2) the blood volume status of the patient (seeFigures 9a, 9b and 9c ). For any given patient, higher airway pressures resulted in a stronger respiratory signal (p <0.01 using paired student T-test). In addition, it was observed that as significant blood loss (>300cc EBL) occurred during a surgical procedure (seen in 8 cases), the respiratory signal would increase strength to only return to baseline as fluid replacement was given. The present method of harmonic analysis also appears to be useful in detecting spontaneous ventilation occurring at the end of the procedures (seeFigures 12a and 12b ). - Further and with reference to
Figure 13 , there were a number of features noted In the joint time-frequency analysis of pulse oximeter that, while not formally studied, were nevertheless interesting. The pulse rate is given by the frequency of the primary harmonic, or cardiac pulse harmonic (i.e., 1.23 Hz = 68 beats/min). The thickness of the primary harmonic band of the joint time-frequency analysis corresponds to the heart rate variability (narrow ~low heart rate variability; wide ~high heart rate variability). - Ventilation was observed to have two distinct impacts on the pulse oximeter waveform as seen through joint time-frequency analysis. The most commonly seen was a shift of the baseline with each breath. The baseline of the pulse oximeter waveform is often considered to reflect the DC component of the pulse oximeter waveform. Shifts in the baseline are felt to be associated with changes in the venous bed (non pulsatile blood). Dorlas JC & Nijboer JA, Photoelectric plethysmography as a monitoring device in anesthesia, Application and interpretation, British Journal Of Anaesthesia 1985; 57:524-30. This type of DC modulation was observed in all studied patients during both periods of controlled and spontaneous ventilation. As such, by monitoring shifts in the baseline as manifested in the joint time-frequency analysis, one is able to monitor venous blood volume accordance with the present invention (see
Figure 9b ). - The less commonly seen phenomenon was a change of the amplitudes of the pulse beats (AC component or arterial pulsatile component) with each breath in the joint time-frequency analysis. This type of AC modulation has been associated with hypovolemic states. Shamir M, Eidelman LA, Floman Y et al., Pulse oximetry plethysmographic waveform during changes in blood volume, British Journal Of Anaesthesia 1999; 82:178-81; Partridge BL, Use of pulse oximetry as a noninvasive indicator if intravascular volume status, Journal of Clinical Monitoring 1987; 3:263-8. In accordance with the present invention, it have been noted that recurrent changes in the amplitude of the pulse beat are manifested on the joint time-frequency analysis as secondary harmonics surrounding the cardiac pulse harmonic. The distance between the secondary harmonics and the cardiac pulse harmonic is proportionally linked to the respiratory rate. These secondary harmonics were present in all patients (eight) who had more then a 300cc blood loss. As such, and in accordance with the present invention, the arterial blood volume may be monitored by noting secondary harmonics surrounding the cardiac pulse harmonic of the joint time-frequency analysis (see
Figure 9c ). - Joint time-frequency analysis allows for the extraction of the underlying frequencies that make up a signal and to observe how these underlying waveforms change over time. In the case of the pulse oximeter, the plethysmographic waveform that is displayed is a highly processed and filtered signal but is still rich in physiologic information. As would be expected, the cardiac pulse waveform is the predominant signal present in pulse oximeter signal. The respiratory component, when present, can be subtle and difficult to monitor using conventional display methods. When the same waveform is displayed in the frequency domain (i.e., using joint time-frequency analysis), the respiratory effect is easy to follow. The two most common reasons for inaccurate readings appeared to be motion artifact and irregular heartbeats.
- In practice, joint time-frequency analysis of the pulse oximeter waveform offers a variety of advantages. In particular, it provides for isolation of the respiratory induced changes of the pulse oximeter, which may be related to intra-vascular blood volume. It also allows for separation of the venous and arterial components (AC & DC) of respiratory variability, allowing for a unique detailed analysis of the impact of blood volume on cardiac function (pre-load vs. after-load effects). Joint time-frequency analysis also provides a method to determine respiratory rate (both controlled and spontaneous) (see
Figure 13 wherein minor peaks of the frequency spectrum are due to respiration), detecting spontaneous breathing patterns, detecting irregularity of heart rate, allowing for the determination of heart rate and estimating heart rate variability by the examination of the width of the primary cardiac pulse harmonic. The analysis also provides a method of displaying a large volume of pulse oximeter waveform information in a small area. (Three or more hours of data collection easily fits on one page). In addition, the present method is resistant to isolated artifacts. - In implementing the present invention, it is contemplated various limitation may be encountered and various concepts are ripe for further consideration. Specifically, the following clinical conditions may either preclude the use of this technique or greater limit its applicability: cardiac arrhythmia such as atrial fibrillation or frequent premature ventricular beats; (which causes a beat to beat variation in the pulse waveform amplitude); excessive ventilator tidal volumes or reduced chest wall compliance would have to be taken into account; or in conditions of low cardiac output (EF <30%) the potential exists for augmentation of the ventricular output (Δup).
- The present invention provides for the development of an algorithm that generates an easily understood and clinically relevant numeric index of respiratory variability. Such an index could then be used to non-invasively monitor the fluid status of patients undergoing surgical procedures. This development is part of a larger on-going project to better understand and utilized the pulse oximeter waveform. It is hoped that from this work the next generation of pulse oximeters will be designed to improve clinical monitoring. These improvements could allow for the non-invasive monitoring of volume status, vascular tone and tissue oxygen extraction.
- The present invention is adapted for use with a variety of traditional pulse oximeters, whether employing disposable probes or reusable probes, as well as other related ventilation measuring devices. With reference to
Figures 14 and15 , an example of a pulse oximeter that may be utilized in accordance with the present invention is disclosed. - Referring to
Figures 14 and15 , apulse oximeter 10 is generally composed of aprobe 12 adapted for positioning over a patient's finger (or at an alternative site such as the forehead or ear) and acentral processor 14 with adisplay 30 coupled to theprobe 12 for receiving and displaying information retrieved by theprobe 12. With regard to underlying electrical circuitry, and as described inU.S. Patent No. 6,496,111 , the circuitry for ageneric pulse oximeter 10 is disclosed. Thepulse oximeter 10 has aphotodiode 16 for detecting anoptical signal 18 reflected from or transmitted through a volume of intravascular blood (not shown) illuminated by one or more light emitting diodes (LEDs, not shown). The LEDs emit electromagnetic radiation at a constant intensity; however, anoptical signal 18 with a time-varying intensity is transmitted through or reflected back from the intravascular blood for each of the wavelengths. Thephotodiode 16 generates a low level current proportional to the intensity of the electromagnetic radiation received by thephotodiode 16. The current is converted to a voltage by a current tovoltage converter 20, which may be an operational amplifier in a current to voltage (transimpedance) configuration. - The signal is then filtered with a
filter stage 22 to remove unwanted frequency components, such as any 60 Hz noise generated by fluorescent lighting. The filtered signal is then amplified with anamplifier 24 and the amplified signal is sampled and held by a sample and hold 26 while the signal is digitized with a high-resolution (12-bit or higher) analog to digital converter (ADC) 28. - The digitized signal is then latched by the
central processor 14 from theADC 28. Thecentral processor 14 then calculates a coefficient for the oxygen saturation value from the digitized signal and determines the final saturation value by reading the saturation value for the calculated coefficient from a look-up table stored in memory. The final saturation value is displayed on adisplay 30. - The methods and systems employed in accordance with the present invention are equally applicable to both mechanically ventilated individuals and spontaneously ventilating individuals. As such, the concepts underlying the present invention equally apply to mechanically ventilated subject under positive pressure, spontaneously ventilating subjects, spontaneously ventilating subjects with positive expiratory pressure and spontaneous ventilating subjects with inspiratory pressure.
- However, it is contemplated the waveforms produced by those subjects that are mechanically ventilated exhibit more pronounced variations then those produced by subjects that are spontaneously breathing. This distinction is believed to result from the effect the positive pressure of mechanical ventilation has upon blood pressure and blood flow within a subject. As such, it may be advantageous when monitoring spontaneously ventilating subjects to increase the positive pressure associated with breathing such that the waveforms associated therewith exhibit relevant variations with the same clarity found in mechanically ventilated subjects.
- More specifically, while in most cases clinicians and investigators monitoring ventilation simply are interested in the rate and/or depth of respiration, the intrathoracic pressure generated by ventilatory effort is of greater importance when one is assessing the effects of ventilation on peripheral blood flow in accordance with the present invention. This effect, which occurs in synchrony with positive pressure ventilation due to a mechanical ventilator, is termed the "ventilator effect". The periodic oscillations in ventilatory pressure cause synchronous oscillations in continuous waveforms of peripheral blood pressure and peripheral blood flow. Specifically, the periodic delivery of positive pressure by the ventilator impedes the return of blood to the heart and hence causes a transient decrease in the arterial pressure and peripheral flow that may be measured by a device such as a plethysmograph or laser Doppler flow meter.
- The degree of oscillatory dampening is determined by: a) the amount of positive pressure that is generated by the ventilator; and b) the patient's relative volume status. The former is commonly measured by the means of positive pressure mechanical ventilation in an intubated patient but, prior to the present disclosure, was not readily attainable during spontaneous (non-mechanical) ventilation, as would be the case in a nonintubated patient. The latter is dependent on the overall fullness of the patient's heart and blood vessels ("volume status"), volume generated with each heartbeat (stroke volume), and the vascular tone. These factors internet such that when a patient is vasodilated or relatively hypovolemic, there is a greater effect of ventilation on peripheral blood pressure and flow.
- With reference to
Figure 16 , the present positive pressure device has been developed for spontaneously breathing subjects. The device is designed to measure the pressure associated with each breath of ventilation, measure the pressure generated by a prolonged inhalation or exhalation (e.g., Valsalva maneuver), and provide an adjustable resistance so as to enable us to increase or decrease airway pressure in the spontaneously breathing, nonintubated patient, whether that patient be breathing totally on his/he own, or breathing spontaneously in response to a prompt such as a metronome tone. - The device includes a one-
way valve 32 and, a connector withside 34 attached via astopcock 35 to anelectronic pressure transducer 36 and/or an anaeroid meter (not shown) for recording and viewing pressure. The device further includes anadaptor 38 for attaching asyringe 40 with occludable holes to provide variable expiratory resistance and a breathing filter 42 through which a subject breathes while holding it in his/her mouth. - The aforementioned system for delivering positive pressure may be packaged separately or integrated with monitors of oscillatory cardiovascular signals (e.g., pulse oximeter). This would enable monitoring of the rate, depth, and pressure of ventilation. The integrated device also could contain a means to prompt a spontaneously breathing patient to breathe at a fixed rate, e.g., a metronome; this would be critical so that one could then determine if the oscillations in the waveform are associated with the ventilatory signal. Additionally, it may be incorporated with a means to monitor rate and depth of respiration by measuring chest and/or abdominal excursion.
- In addition to adding positive pressure to those subjects spontaneously ventilating, it has been found that the constant breathing rate of mechanically ventilating subjects produces better waveforms for the purposes of the present invention since the natural variations associated with spontaneous breathing add an additional variable to the process of analyzing the waveforms to determine blood loss. As such, it is contemplated that it may be desirable to associate a spontaneously ventilating subjects breathing rate with a metronome. The breathing rate may also be controlled through the squeezing of a ventilation bag. This will produce a more consistent breathing rate, resulting in more easily analyzed waveforms.
- It is further contemplated that the waveform generated in accordance with the present invention may be analyzed with reference to the pulse wave amplitude, (i.e. normalized) respiratory oscillations, etc. so as to normalize the resulting waveforms in an effort to produce more consistent results from subject to subject and monitoring device to monitoring device.
- It is still further contemplated ventilation induced changes in a cardiovascular waveform may be monitored in the context of an irregular rate of respiration. The process includes identifying each respiration and then determining the maximum and minimum of the cardiovascular signal for each respiratory interval.
- Especially in the context of spontaneous ventilation with varied intervals between breaths, one may use a respiratory channel as the timing channel for assessment of cardiovascular waveforms. For example, for each breath-to-breath interval, one could record the following from the pulse oximeter signal:
- overall mean
- peak value for signal within the given breath-to-breath interval
- trough value for signal within the given breath-to-breath interval
- peak minus trough value for signal within the given breath-to-breath interval
- min for each heart beat (diastole of given pulse) within the given breath-to-breath interval
- max for each heart beat (systole of given pulse) within the given breath-to-breath interval
- max minus min for each heart (amplitude of given pulse) within the given breath-to- breath interval
- This could be performed for a single breath or for multiple breaths so as to enable assessment of an extended interval such as was used for the aforementioned Fourier transformation.
- Using the data illustrated in
Figures 2a-2c , we obtain the following approximate values for the approximately 8 breaths obtained in a 50 second interval (2000 points/82 points/sec).Parameter Being Averted Over 50-sec Interval Baseline 500cc EBL 1500cc EBL 50-sec Average for Individual Pulses: Systole of pulses 2.0 2.0 2.35 Diastole of pulses -2.0 -2.2 -2.3 Amplitude of pulses 4.0 4.2 4.65 50-sec Average for Per-Breath Values: Peak per-breath values of entire waveform 2.1 2.7 3.0 Trough per-breath values of entire waveform -1.85 -2.55 -3.2 Difference between peak and trough per-breath values of entire waveform 3.95 5.25 6.2 Peak per breath values of arterial portion of waveform 2.1 2.7 3.0 Trough per-breath values of arterial portion of waveform 2.0 2.1 1.8 Difference between peak and tough per-breath values of arterial portion of waveform 4.1 4.8 5.8 Peak per-breath values of venous portion of waveform -1.95 -2.15 -2.15 Trough per-breath values of venous portion of waveform -2.1 -2.55 -3.0 Difference between peak and tough per-breath values of venous portion of waveform 4.05 4.70 5.15 Largest per-breath pulse amplitude 4.0 4.5 5.0 Smallest per-breath pulse amplitude 3.8 3.8 4.0 Difference between Largest per-breath and smallest per-breath pulse amplitudes 0.2 0.7 1.0 Highest per-breath height of dicrotic notch -0.8 -1.3 -1.0 Lowest per-breath height of dicrotic notch -1.3 -2.2 -2.2 Difference between highest per-breath and lowest per-breath heights of dicrotic notch 0.5 0.9 1.2 - It should be noted that, in addition to assessment of power at different frequencies the phase angle between the different measurements (e.g., graphic delineation of local mins vs local maxs) and changes in the different measurements may be determined as per published work described in Podgoreanu MV, Stout RG, El-Moalem E, Silverman DG, Synchronous rhythmical vasomotion in the human cuatneous microvasculature during nonpu/satile cardiopulmonary bypass, Anesthesiology 2002; 97:1110-1116, which adapted the technique for determining phase angle described by Bernardi L, et al., Synchronous and baroreceptor-sensitive oscillations in skin microcirculation: evidence for central autonomic control, Am J Physiol 1997; 273: H1867-1878.
- The aforementioned means to identify and segregate the arterial and venous components of a cardiovascular waveform such as the plethysmographic waveform of a pulse oximeter, enable one to selectively monitor the arterial or venous component of that waveform with respect to flow (or pressure). They also enable one to select the time of the determination of a measurement such as oxygen saturation so as to isolate arterial oxygenation from venous oxygenation.
- In addition, the delineation of the arterial and venous components enables one to modify the actual plethysmographic tracing by a means such as application of pressure to the monitoring probe to a degree that obliterates the low pressure (venous or DC) component. This would cause the tracing to more closely resemble the arterial tracing generated by an intra-arterial catheter. This sequence of steps is illustrated in
Figures 17 and18 . - It should further be appreciated that the methods of the present invention may include the additional step of monitoring the rate of respiration. This may further include integrating the respiratory signal into a data collection system which also collects input from a cardiovascular signal, identifying one or more breath-to-breath intervals, using the breath-to-breath intervals as the "timing channel" for assessment of the cardiovascular waveform and determining the magnitude and change of the cardiovascular waveform for the given breath or breaths.
- The indices which may be measured in accordance with the present invention are systole, diastole, and/or amplitude of one or more individual pulses. More specifically, the indices monitored include one or more of the following indices determined for one or more intervals:
- peak per-breath values of entire waveform, trough per-breath values of entire waveform, difference between peak and trough per-breath values of entire waveform, peak per-breath values of arterial portion of waveform; trough per-breath values of arterial portion of waveform; difference between peak and tough per-breath values of arterial portion of waveform; peak per-breath values of venous portion of waveform, trough per-breath values of venous portion of waveform, difference between peak and tough per-breath values of venous portion of waveform, largest per breath pulse amplitude, smallest per-breath pulse amplitude, difference between largest per-breath and smallest per-breath pulse amplitudes, highest per-breath height of dicrotic notch, lowest per-breath height of dicrotic notch, and difference between highest per-breath and lowest per-breath heights of dicrotic notch.
- The method and system of the present invention may also be utilized where there is positive inspiratory and/or expiratory pressure during ventilation, and wherein the amount of positive pressure is quantified and adjustable. The method and system may also provide that the change in the cardiovascular monitor attributed to respiration is normalized to (e.g., expressed as a percentage of) the inspiratory or expiratory pressure and the variation in the cardiovascular monitor attributed to ventilation is normalized to the amplitude of the individual pulse beats.
- In addition, the present method and system may also provide that outputs of different monitoring devices obtained from one or more monitoring sites are compared. In this instance the devices may both be pulse oximeters, or one or more of the devices may be an alternative continuous measure of blood flow (e.g., laser Doppler flow meter) or a continuous measure of blood pressure.
- In practicing the present method and system it is contemplated that pressure may be applied to a monitoring device such as an oximeter probe to eliminate the venous component of the tracing and the pressure to eliminate the venous component is quantified so that the venous pressure maybe measured. In addition, the present method and system provides that oxygen saturation maybe determined independently for the arterial and venous phases.
- While the preferred embodiments have been shown and described, it will be understood that there is no intent to limit the invention by such disclosure, but rather, is intended to cover all modifications and alternate constructions falling within the spirit and scope of the invention as defined in the appended claims.
Claims (21)
- A method for facilitating detection of physiological changes of a subject, the method comprising:analyzing a cardiovascular waveform representing physiological characteristics of a subject, wherein the analyzing the cardiovascular waveform includes:identifying a first component of the cardiovascular waveform reflective of a cardiovascular impact of respiration; andanalyzing a characteristic of the first component reflective of amplitude variations of the first component, wherein the amplitude variations are indicative of changes in blood volume of the subject.
- The method of claim 1, wherein the first component of the cardiovascular waveform is a systolic component reflective of a cardiovascular impact of respiration on per cardiac-cycle maximums of the cardiovascular waveform.
- The method of claim 1, wherein the first component of the cardiovascular waveform is a diastolic component reflective of a cardiovascular impact of respiration on per cardiac-cycle minimums of the cardiovascular waveform.
- The method of claim 1, wherein the first component of the cardiovascular waveform is reflective of a cardiovascular impact of respiration on per heart-beat dicrotic notches of the cardiovascular waveform.
- The method of claim 1, wherein the first component of the cardiovascular waveform is an arterial component reflective of a cardiovascular impact of respiration on an amplitude of a cardiac-signal component of the cardiovascular waveform, wherein the amplitude variations of the arterial component are indicative of changes in arterial blood volume of the subject.
- The method of claim 1, wherein the first component of the cardiovascular waveform is a venous component reflective of a cardiovascular impact of respiration on a baseline of a cardiac-signal component of the cardiovascular waveform, wherein the amplitude variations of the venous component are indicative of changes in venous blood volume of the subject.
- The method of any of claims 1-6, wherein the cardiovascular waveform is analyzed in at least one of (i) the time domain, (ii) the frequency domain and (iii) the joint time-frequency domain.
- The method of any of claims 1-7, wherein the analyzed characteristic is reflective of at least one of (i) changes in per respiratory-cycle maximums of the first component in the time domain, (ii) changes in per respiratory-cycle minimums of the first component in the time domain, and (iii) changes in a difference between corresponding per respiratory-cycle maximums and per respiratory-cycle minimums of the first component in the time domain; and (iv) changes in a signal strength of the first component in the frequency domain.
- The method of claim 1, wherein the cardiovascular waveform is analyzed using harmonic analysis to identify the first component of the cardiovascular waveform.
- The method of claim 9, wherein the identifying the first component of the cardiovascular waveform is achieved using a peak detection algorithm on the cardiovascular waveform applied in the frequency domain.
- The method of any of claims 9 and 10, wherein the first component of the cardiovascular waveform is an arterial component reflective of a cardiovascular impact of respiration on an amplitude of a cardiac-signal component of the cardiovascular waveform, wherein the amplitude variations of the arterial component are identified based on side bands surrounding a primary cardiac signal component in the cardiac frequency range, and wherein the amplitude variations of the arterial component are indicative of changes in arterial blood volume of the subject.
- The method of any of claims 9 and 10, wherein the first component of the cardiovascular waveform is a venous component reflective of a cardiovascular impact of respiration on a baseline of a cardiac-signal component of the cardiovascular waveform, wherein the venous component is identified in the respiratory frequency range, and wherein the amplitude variations of the venous component are indicative of changes in venous blood volume of the subject.
- The method of any of claims 1-12, wherein the first component is normalized based on one of (i) amplitude of a cardiac signal component of the cardiovascular waveform, (ii) respiratory oscillations, and (iii) airway pressure.
- The method of any of claims 1-13, wherein the analyzing the characteristic of the first component of the cardiovascular waveform includes calculating an index responsive to the amplitude variations of the first component, wherein index variations are indicative of physiological changes in the subject.
- The method of claim 14, wherein the analyzing the cardiovascular waveform further includes identifying a second component of the cardiovascular waveform and wherein the analyzing the characteristic of the first component of the cardiovascular waveform includes calculating an index responsive to changes in a comparison of the first and the second components relative to one another, wherein the index is responsive to the amplitude variations of the first component and wherein index variations are indicative of physiological changes in the subject.
- The method of any of claims 1-15, further comprising monitoring fluid responsiveness of the subject based on the analysis of the characteristic of the first component.
- The method of any of claims 1-16, further comprising detecting hypovolemia based on the analysis of the characteristic of the first component.
- The method of any of claims 1-17, further comprising detecting dehydration based on the analysis of the characteristic of the first component.
- The method of any of claims 1-18, wherein subject respiration is synchronized with a metronome.
- The method of any of claims 1-19, wherein airway pressure is actively controlled and/or standardized.
- A system for facilitating detection of physiological changes of a subject, the system comprising:a probe adapted for generating a cardiovascular waveform representing physiological characteristics of a subject; anda processor configured for analyzing the cardiovascular waveform, wherein the analyzing the cardiovascular waveform includes identifying a first component of the cardiovascular waveform reflective of a cardiovascular impact of respiration,and analyzing a characteristic of the first component reflective of amplitude variations of the first component, wherein the amplitude variations are indicative of changes in blood volume of the subject.
Applications Claiming Priority (3)
| Application Number | Priority Date | Filing Date | Title |
|---|---|---|---|
| US45404803P | 2003-03-12 | 2003-03-12 | |
| US46560903P | 2003-04-25 | 2003-04-25 | |
| EP04700084A EP1601287B1 (en) | 2003-03-12 | 2004-01-02 | Assessment of a decrease in blood volume using cardiovascular waveforms |
Related Parent Applications (1)
| Application Number | Title | Priority Date | Filing Date |
|---|---|---|---|
| EP04700084.9 Division | 2004-01-02 |
Publications (2)
| Publication Number | Publication Date |
|---|---|
| EP2392257A2 true EP2392257A2 (en) | 2011-12-07 |
| EP2392257A3 EP2392257A3 (en) | 2012-02-29 |
Family
ID=35840679
Family Applications (2)
| Application Number | Title | Priority Date | Filing Date |
|---|---|---|---|
| EP11179769A Withdrawn EP2392257A3 (en) | 2003-03-12 | 2004-01-02 | Method of assessing blood volume using photoelectric plethysmography |
| EP04700084A Expired - Lifetime EP1601287B1 (en) | 2003-03-12 | 2004-01-02 | Assessment of a decrease in blood volume using cardiovascular waveforms |
Family Applications After (1)
| Application Number | Title | Priority Date | Filing Date |
|---|---|---|---|
| EP04700084A Expired - Lifetime EP1601287B1 (en) | 2003-03-12 | 2004-01-02 | Assessment of a decrease in blood volume using cardiovascular waveforms |
Country Status (4)
| Country | Link |
|---|---|
| US (3) | US8251912B2 (en) |
| EP (2) | EP2392257A3 (en) |
| JP (1) | JP5296312B2 (en) |
| WO (1) | WO2004080300A1 (en) |
Cited By (6)
| Publication number | Priority date | Publication date | Assignee | Title |
|---|---|---|---|---|
| US8251912B2 (en) | 2003-03-12 | 2012-08-28 | Yale University | Method of assessing blood volume using photoelectric plethysmography |
| US9002440B2 (en) | 2010-07-08 | 2015-04-07 | Intelomed, Inc. | System and method for characterizing circulatory blood flow |
| US9173579B2 (en) | 2010-07-08 | 2015-11-03 | Intelomed, Inc. | System and method for characterizing circulatory blood flow |
| EP3007616A4 (en) * | 2013-06-11 | 2017-01-25 | Intelomed, Inc | Predicting hypovolemic hypotensive conditions using a pulse volume waveform |
| US9808160B2 (en) | 2013-08-12 | 2017-11-07 | Intelomed, Inc. | Systems and methods for monitoring and analyzing cardiovascular states |
| US10390767B2 (en) | 2013-06-04 | 2019-08-27 | Intelomed Inc. | Hemodynamic risk severity based upon detection and quantification of cardiac dysrhythmia behavior using a pulse volume waveform |
Families Citing this family (100)
| Publication number | Priority date | Publication date | Assignee | Title |
|---|---|---|---|---|
| US8932227B2 (en) | 2000-07-28 | 2015-01-13 | Lawrence A. Lynn | System and method for CO2 and oximetry integration |
| US9042952B2 (en) | 1997-01-27 | 2015-05-26 | Lawrence A. Lynn | System and method for automatic detection of a plurality of SPO2 time series pattern types |
| US9468378B2 (en) | 1997-01-27 | 2016-10-18 | Lawrence A. Lynn | Airway instability detection system and method |
| US20070191697A1 (en) | 2006-02-10 | 2007-08-16 | Lynn Lawrence A | System and method for SPO2 instability detection and quantification |
| US9521971B2 (en) | 1997-07-14 | 2016-12-20 | Lawrence A. Lynn | System and method for automatic detection of a plurality of SPO2 time series pattern types |
| US20070000494A1 (en) * | 1999-06-30 | 2007-01-04 | Banner Michael J | Ventilator monitor system and method of using same |
| US20090281838A1 (en) | 2008-05-07 | 2009-11-12 | Lawrence A. Lynn | Medical failure pattern search engine |
| US9053222B2 (en) | 2002-05-17 | 2015-06-09 | Lawrence A. Lynn | Patient safety processor |
| US20060195041A1 (en) | 2002-05-17 | 2006-08-31 | Lynn Lawrence A | Centralized hospital monitoring system for automatically detecting upper airway instability and for preventing and aborting adverse drug reactions |
| US20080200775A1 (en) * | 2007-02-20 | 2008-08-21 | Lynn Lawrence A | Maneuver-based plethysmographic pulse variation detection system and method |
| US7024235B2 (en) | 2002-06-20 | 2006-04-04 | University Of Florida Research Foundation, Inc. | Specially configured nasal pulse oximeter/photoplethysmography probes, and combined nasal probe/cannula, selectively with sampler for capnography, and covering sleeves for same |
| ATE479343T1 (en) * | 2002-10-01 | 2010-09-15 | Nellcor Puritan Bennett Inc | USE OF A HEADBAND FOR VOLTAGE DISPLAY AND SYSTEM OF OXYMETER AND HEADBAND |
| US7698909B2 (en) * | 2002-10-01 | 2010-04-20 | Nellcor Puritan Bennett Llc | Headband with tension indicator |
| US7047056B2 (en) | 2003-06-25 | 2006-05-16 | Nellcor Puritan Bennett Incorporated | Hat-based oximeter sensor |
| US8412297B2 (en) | 2003-10-01 | 2013-04-02 | Covidien Lp | Forehead sensor placement |
| US7740591B1 (en) * | 2003-12-01 | 2010-06-22 | Ric Investments, Llc | Apparatus and method for monitoring pressure related changes in the extra-thoracic arterial circulatory system |
| JP2006000176A (en) * | 2004-06-15 | 2006-01-05 | Omron Healthcare Co Ltd | Central blood pressure-estimating system and method |
| WO2008020845A2 (en) | 2006-08-15 | 2008-02-21 | University Of Florida Research Foundation, Inc. | Methods and devices for central photoplethysmographic monitoring methods |
| US7976472B2 (en) * | 2004-09-07 | 2011-07-12 | Masimo Corporation | Noninvasive hypovolemia monitor |
| US7751878B1 (en) * | 2004-11-10 | 2010-07-06 | Sandia Corporation | Real-time human collaboration monitoring and intervention |
| US20060250259A1 (en) * | 2005-03-25 | 2006-11-09 | Semiconductor Energy Laboratory Co., Ltd. | Monitoring device, care receiver monitoring device, care managing device, care giver terminal device, and care support system and care support method using these |
| US7785262B2 (en) | 2005-04-25 | 2010-08-31 | University Of Florida Research Foundation, Inc. | Method and apparatus for diagnosing respiratory disorders and determining the degree of exacerbations |
| WO2006123691A1 (en) | 2005-05-18 | 2006-11-23 | Matsushita Electric Works, Ltd. | Sleep diagnostic system |
| DE102006004415A1 (en) * | 2006-01-31 | 2007-08-09 | Up Management Gmbh & Co Med-Systems Kg | Apparatus for evaluating a hemodynamic condition of a patient using cardiopulmonary interaction |
| US7668579B2 (en) | 2006-02-10 | 2010-02-23 | Lynn Lawrence A | System and method for the detection of physiologic response to stimulation |
| US20070208259A1 (en) * | 2006-03-06 | 2007-09-06 | Mannheimer Paul D | Patient monitoring alarm escalation system and method |
| US8161971B2 (en) | 2006-08-04 | 2012-04-24 | Ric Investments, Llc | Nasal and oral patient interface |
| WO2008073855A2 (en) | 2006-12-09 | 2008-06-19 | Masimo Corporation | Plethysmograph variability processor |
| JP4930839B2 (en) * | 2007-03-23 | 2012-05-16 | 株式会社エクォス・リサーチ | State evaluation apparatus and state evaluation program |
| WO2008131335A1 (en) * | 2007-04-19 | 2008-10-30 | Starr Life Sciences Corporation | Signal processing method and apparatus for processing a physiologic signal such as a photoplethysmography signal |
| US8417305B2 (en) * | 2007-05-02 | 2013-04-09 | St. Vincents Hospital (Melbourne) Limited | Non-invasive measurement of blood oxygen saturation |
| US8529459B2 (en) * | 2007-08-08 | 2013-09-10 | Convergent Engineering, Inc. | Processing of photoplethysmography signals |
| US8048040B2 (en) * | 2007-09-13 | 2011-11-01 | Masimo Corporation | Fluid titration system |
| US8551005B2 (en) * | 2007-12-13 | 2013-10-08 | Robert A. BARUCH | Monitoring respiratory variation of pulse pressure |
| US8251876B2 (en) | 2008-04-22 | 2012-08-28 | Hill-Rom Services, Inc. | Breathing exercise apparatus |
| US8257274B2 (en) * | 2008-09-25 | 2012-09-04 | Nellcor Puritan Bennett Llc | Medical sensor and technique for using the same |
| US8364220B2 (en) | 2008-09-25 | 2013-01-29 | Covidien Lp | Medical sensor and technique for using the same |
| US8968193B2 (en) * | 2008-09-30 | 2015-03-03 | Covidien Lp | System and method for enabling a research mode on physiological monitors |
| US20100081904A1 (en) * | 2008-09-30 | 2010-04-01 | Nellcor Puritan Bennett Llc | Device And Method For Securing A Medical Sensor to An Infant's Head |
| ES2336997B1 (en) | 2008-10-16 | 2011-06-13 | Sabirmedical,S.L. | SYSTEM AND APPARATUS FOR NON-INVASIVE MEASUREMENT OF BLOOD PRESSURE. |
| US8727997B2 (en) * | 2008-10-17 | 2014-05-20 | Yale University | Volume status monitor: peripheral venous pressure, hypervolemia and coherence analysis |
| US11382571B2 (en) | 2008-10-29 | 2022-07-12 | Flashback Technologies, Inc. | Noninvasive predictive and/or estimative blood pressure monitoring |
| US11395634B2 (en) | 2008-10-29 | 2022-07-26 | Flashback Technologies, Inc. | Estimating physiological states based on changes in CRI |
| US20110172545A1 (en) * | 2008-10-29 | 2011-07-14 | Gregory Zlatko Grudic | Active Physical Perturbations to Enhance Intelligent Medical Monitoring |
| US8512260B2 (en) | 2008-10-29 | 2013-08-20 | The Regents Of The University Of Colorado, A Body Corporate | Statistical, noninvasive measurement of intracranial pressure |
| US11406269B2 (en) | 2008-10-29 | 2022-08-09 | Flashback Technologies, Inc. | Rapid detection of bleeding following injury |
| US11857293B2 (en) | 2008-10-29 | 2024-01-02 | Flashback Technologies, Inc. | Rapid detection of bleeding before, during, and after fluid resuscitation |
| US11478190B2 (en) | 2008-10-29 | 2022-10-25 | Flashback Technologies, Inc. | Noninvasive hydration monitoring |
| US11395594B2 (en) | 2008-10-29 | 2022-07-26 | Flashback Technologies, Inc. | Noninvasive monitoring for fluid resuscitation |
| EP2189111A1 (en) * | 2008-11-21 | 2010-05-26 | Pulsion Medical Systems AG | Apparatus and method for determining a physiologic parameter |
| US8515515B2 (en) | 2009-03-25 | 2013-08-20 | Covidien Lp | Medical sensor with compressible light barrier and technique for using the same |
| US8781548B2 (en) | 2009-03-31 | 2014-07-15 | Covidien Lp | Medical sensor with flexible components and technique for using the same |
| EP2434947A4 (en) * | 2009-05-29 | 2015-07-29 | Univ Yale | Apparatus, systems and methods utilizing plethysmographic data |
| WO2010147968A1 (en) * | 2009-06-15 | 2010-12-23 | Yale University | Systems and methods utilizing plethysmographic data for distinguishing arterial and venous saturations |
| AU2010264669C1 (en) * | 2009-06-26 | 2015-04-30 | Gambro Lundia Ab | Devices, a computer program product and a method for data extraction |
| US8840562B2 (en) * | 2009-09-24 | 2014-09-23 | Covidien Lp | Signal processing warping technique |
| US20110077474A1 (en) * | 2009-09-29 | 2011-03-31 | General Electric Company | Method, arrangement and apparatus for assessing fluid balance status of a subject |
| WO2011050066A2 (en) | 2009-10-20 | 2011-04-28 | The Research Foundation Of State University Of New York | Apparatus and method for respiratory rate detection and early detection of blood loss volume |
| CN102791192B (en) * | 2009-10-29 | 2015-02-25 | Cn体系药物技术有限公司 | Apparatusfor enhancing and analyzing signals from a continuous non-invasive blood pressure device |
| US9307928B1 (en) | 2010-03-30 | 2016-04-12 | Masimo Corporation | Plethysmographic respiration processor |
| EP2592999B1 (en) * | 2010-07-16 | 2020-02-26 | Thomas Sandgaard | Methods and apparatus for estimating a blood volume of a mammalian subject |
| US9950112B2 (en) | 2010-08-17 | 2018-04-24 | University Of Florida Research Foundation, Incorporated | Intelligent drug and/or fluid delivery system to optimizing medical treatment or therapy using pharmacodynamic and/or pharamacokinetic data |
| US20120123231A1 (en) * | 2010-11-11 | 2012-05-17 | O'reilly Michael | Monitoring cardiac output and vessel fluid volume |
| US8825428B2 (en) | 2010-11-30 | 2014-09-02 | Neilcor Puritan Bennett Ireland | Methods and systems for recalibrating a blood pressure monitor with memory |
| US8608657B2 (en) | 2011-05-31 | 2013-12-17 | Covidien Lp | Clinical acceptance tool |
| WO2013016212A1 (en) * | 2011-07-22 | 2013-01-31 | Flashback Technologies, Inc. | Hemodynamic reserve monitor and hemodialysis control |
| US8755876B2 (en) | 2011-12-02 | 2014-06-17 | Worcester Polytechnic Institute | Methods and systems for atrial fibrillation detection |
| US9311825B2 (en) | 2011-12-22 | 2016-04-12 | Senstream, Inc. | Biometric sensing and processing apparatus for mobile gaming, education, and wellness applications |
| US20130190632A1 (en) * | 2012-01-25 | 2013-07-25 | Robert A. BARUCH | Autoregulation monitoring |
| US9180271B2 (en) | 2012-03-05 | 2015-11-10 | Hill-Rom Services Pte. Ltd. | Respiratory therapy device having standard and oscillatory PEP with nebulizer |
| US9060745B2 (en) | 2012-08-22 | 2015-06-23 | Covidien Lp | System and method for detecting fluid responsiveness of a patient |
| US8731649B2 (en) | 2012-08-30 | 2014-05-20 | Covidien Lp | Systems and methods for analyzing changes in cardiac output |
| US9357937B2 (en) | 2012-09-06 | 2016-06-07 | Covidien Lp | System and method for determining stroke volume of an individual |
| US9241646B2 (en) | 2012-09-11 | 2016-01-26 | Covidien Lp | System and method for determining stroke volume of a patient |
| US20140081152A1 (en) | 2012-09-14 | 2014-03-20 | Nellcor Puritan Bennett Llc | System and method for determining stability of cardiac output |
| US8740806B2 (en) | 2012-11-07 | 2014-06-03 | Somnarus Inc. | Methods for detection of respiratory effort and sleep apnea monitoring devices |
| US8977348B2 (en) | 2012-12-21 | 2015-03-10 | Covidien Lp | Systems and methods for determining cardiac output |
| US10136822B1 (en) | 2013-01-21 | 2018-11-27 | Zynex Monitoring Solutions Inc. | Method and apparatus for non-invasively detecting blood volume imbalances in a mammalian subject |
| CA2904682A1 (en) | 2013-03-15 | 2014-09-18 | Intelomed, Inc. | System and method for characterizing circulatory blood flow |
| US9763585B2 (en) | 2013-04-25 | 2017-09-19 | Covidien Lp | System and method for generating an adjusted fluid responsiveness metric |
| WO2015006191A1 (en) * | 2013-07-08 | 2015-01-15 | Edwards Lifesciences Corporation | Arterial pressure-based determination of cardiovascular parameters |
| US10314532B2 (en) * | 2013-07-29 | 2019-06-11 | The Regents Of The University Of Michigan | Evaluating cardiovascular health using intravascular volume |
| US20160228031A1 (en) * | 2013-09-18 | 2016-08-11 | Tsukada Medical Research Co., Ltd. | Current perception threshold examination apparatus used in catheter for diagnosis of interstitial cystitis |
| BR112017005003A2 (en) * | 2014-09-12 | 2018-06-05 | Univ Vanderbilt | detection of hypovolemia / hypervolemia using peripheral intravenous waveform (piva) analysis and its applications |
| SG11201703795SA (en) * | 2014-11-13 | 2017-06-29 | Univ Vanderbilt | Device and method for hemorrhage detection and guided resuscitation and applications of same |
| US10004408B2 (en) * | 2014-12-03 | 2018-06-26 | Rethink Medical, Inc. | Methods and systems for detecting physiology for monitoring cardiac health |
| US10328202B2 (en) | 2015-02-04 | 2019-06-25 | Covidien Lp | Methods and systems for determining fluid administration |
| US10342441B2 (en) * | 2015-02-27 | 2019-07-09 | Qualcomm Incorporated | Estimating heart rate by tracking optical signal frequency components |
| US10499835B2 (en) | 2015-03-24 | 2019-12-10 | Covidien Lp | Methods and systems for determining fluid responsiveness in the presence of noise |
| WO2017197120A1 (en) * | 2016-05-11 | 2017-11-16 | University Of Maryland, Baltimore | Method and apparatus for predicting a use for a blood transfusion |
| WO2018035465A1 (en) * | 2016-08-18 | 2018-02-22 | William Beaumont Hospital | System and method for determining respiratory induced blood mass change from 4d computed tomography |
| AU2017377044B2 (en) | 2016-12-15 | 2023-01-05 | Baxter Healthcare Sa | System and method for monitoring and determining patient parameters from sensed venous waveform |
| SG11201909302WA (en) * | 2017-04-14 | 2019-11-28 | Univ Vanderbilt | Non-invasive venous waveform analysis for evaluating a subject |
| KR102132925B1 (en) * | 2018-02-19 | 2020-07-10 | 와이케이씨테크(주) | Method and apparatus for estimating blood volume based on a skin image |
| US11039754B2 (en) | 2018-05-14 | 2021-06-22 | Baxter International Inc. | System and method for monitoring and determining patient parameters from sensed venous waveform |
| US11918386B2 (en) | 2018-12-26 | 2024-03-05 | Flashback Technologies, Inc. | Device-based maneuver and activity state-based physiologic status monitoring |
| US11504015B2 (en) | 2019-02-14 | 2022-11-22 | Medical Informatics Corp. | Method of predicting fluid responsiveness in patients |
| JP6722932B1 (en) * | 2020-03-17 | 2020-07-15 | 株式会社ケーアンドエス | measuring device |
| EP3991638A1 (en) * | 2020-10-29 | 2022-05-04 | CSEM Centre Suisse d'Electronique et de Microtechnique SA - Recherche et Développement | Method for determining a physiological parameter using a ppg signal with reduced influence of venous pulsatility |
| CN116649969B (en) * | 2023-07-25 | 2023-10-10 | 苏州晟智医疗科技有限公司 | Blood oxygen saturation measuring device, apparatus and storage medium |
Citations (1)
| Publication number | Priority date | Publication date | Assignee | Title |
|---|---|---|---|---|
| US6496711B1 (en) | 1994-04-01 | 2002-12-17 | University Of Florida | Pulse oximeter probe |
Family Cites Families (47)
| Publication number | Priority date | Publication date | Assignee | Title |
|---|---|---|---|---|
| US4800495A (en) | 1986-08-18 | 1989-01-24 | Physio-Control Corporation | Method and apparatus for processing signals used in oximetry |
| US4860759A (en) | 1987-09-08 | 1989-08-29 | Criticare Systems, Inc. | Vital signs monitor |
| SE465551B (en) | 1990-02-16 | 1991-09-30 | Aake Oeberg | DEVICE FOR DETERMINING A HEART AND RESPIRATORY FREQUENCY THROUGH PHOTOPLETISMOGRAPHICAL SEATING |
| US5119814A (en) * | 1990-07-25 | 1992-06-09 | Minnich Thomas E | Method and apparatus for monitoring blood loss via retinal venous oxygen saturation |
| US5490505A (en) | 1991-03-07 | 1996-02-13 | Masimo Corporation | Signal processing apparatus |
| RU2144211C1 (en) | 1991-03-07 | 2000-01-10 | Мэсимо Корпорейшн | Device and method for signal processing |
| DE69421375T2 (en) | 1994-02-07 | 2000-07-06 | Azriel Perel | Procedure for determining cardiovascular function |
| EP0957757A1 (en) | 1995-09-28 | 1999-11-24 | Data Sciences International, Inc. | Respiration monitoring system based on sensed blood pressure |
| IL120881A (en) | 1996-07-30 | 2002-09-12 | It M R Medic L Cm 1997 Ltd | Method and apparatus for the non-invasive continous monitoring of peripheral arterial tone |
| DE69728031T2 (en) * | 1996-09-10 | 2004-11-11 | Seiko Epson Corp. | ORGANISM STATUS MEASURING DEVICE AND RELAXATION STATUS INDICATOR |
| DE19650738A1 (en) | 1996-12-06 | 1998-06-10 | Univ Ludwigs Albert | Device for volume control in the event of blood loss |
| US6002952A (en) | 1997-04-14 | 1999-12-14 | Masimo Corporation | Signal processing apparatus and method |
| US5865756A (en) * | 1997-06-06 | 1999-02-02 | Southwest Research Institute | System and method for identifying and correcting abnormal oscillometric pulse waves |
| CN1242693A (en) * | 1997-08-26 | 2000-01-26 | 精工爱普生株式会社 | Measuring, sensing and diagnosing apparatus and method relating to wave pulse, cardiac function, and motion intensity |
| WO1999062399A1 (en) | 1998-06-03 | 1999-12-09 | Masimo Corporation | Stereo pulse oximeter |
| US6129675A (en) | 1998-09-11 | 2000-10-10 | Jay; Gregory D. | Device and method for measuring pulsus paradoxus |
| US6463311B1 (en) | 1998-12-30 | 2002-10-08 | Masimo Corporation | Plethysmograph pulse recognition processor |
| US6616613B1 (en) * | 2000-04-27 | 2003-09-09 | Vitalsines International, Inc. | Physiological signal monitoring system |
| AU2001250960A1 (en) | 2000-04-28 | 2001-11-12 | Kinderlife Instruments, Inc. | Method for determining blood constituents |
| JP2002017696A (en) * | 2000-07-05 | 2002-01-22 | Denso Corp | Method and apparatus for monitoring breathing state |
| US7104958B2 (en) * | 2001-10-01 | 2006-09-12 | New Health Sciences, Inc. | Systems and methods for investigating intracranial pressure |
| US6692443B2 (en) * | 2000-09-29 | 2004-02-17 | New Health Sciences, Inc. | Systems and methods for investigating blood flow |
| US7604599B2 (en) * | 2000-09-29 | 2009-10-20 | New Health Sciences, Inc. | Systems and methods for using dynamic vascular assessment to improve vascular stent placement, application, design and marketing |
| US6955648B2 (en) * | 2000-09-29 | 2005-10-18 | New Health Sciences, Inc. | Precision brain blood flow assessment remotely in real time using nanotechnology ultrasound |
| JP3908958B2 (en) * | 2001-03-30 | 2007-04-25 | 株式会社デンソー | Intrathoracic pressure estimation device and intrathoracic pressure estimation method |
| IL145445A (en) * | 2001-09-13 | 2006-12-31 | Conmed Corp | Signal processing method and device for signal-to-noise improvement |
| US6561984B1 (en) | 2001-10-16 | 2003-05-13 | Pacesetter, Inc. | Assessing heart failure status using morphology of a signal representative of arterial pulse pressure |
| WO2003071938A1 (en) | 2002-02-22 | 2003-09-04 | Datex-Ohmeda, Inc. | Monitoring physiological parameters based on variations in a photoplethysmographic signal |
| US6709402B2 (en) | 2002-02-22 | 2004-03-23 | Datex-Ohmeda, Inc. | Apparatus and method for monitoring respiration with a pulse oximeter |
| US6896661B2 (en) * | 2002-02-22 | 2005-05-24 | Datex-Ohmeda, Inc. | Monitoring physiological parameters based on variations in a photoplethysmographic baseline signal |
| US6702752B2 (en) * | 2002-02-22 | 2004-03-09 | Datex-Ohmeda, Inc. | Monitoring respiration based on plethysmographic heart rate signal |
| US6869402B2 (en) | 2002-08-27 | 2005-03-22 | Precision Pulsus, Inc. | Method and apparatus for measuring pulsus paradoxus |
| NO318167B1 (en) | 2002-11-27 | 2005-02-14 | Tandberg Telecom As | Vektorprediksjon |
| US8255029B2 (en) | 2003-02-27 | 2012-08-28 | Nellcor Puritan Bennett Llc | Method of analyzing and processing signals |
| US8251912B2 (en) * | 2003-03-12 | 2012-08-28 | Yale University | Method of assessing blood volume using photoelectric plethysmography |
| KR100571811B1 (en) | 2003-05-09 | 2006-04-17 | 삼성전자주식회사 | Ear type measurement apparatus for bio signal |
| US7771364B2 (en) | 2004-01-27 | 2010-08-10 | Spirocor Ltd. | Method and system for cardiovascular system diagnosis |
| US7976472B2 (en) | 2004-09-07 | 2011-07-12 | Masimo Corporation | Noninvasive hypovolemia monitor |
| JP5074191B2 (en) | 2004-10-06 | 2012-11-14 | レスメド・リミテッド | Non-invasive monitoring method and apparatus for respiratory parameters of sleep disordered breathing |
| US7785262B2 (en) | 2005-04-25 | 2010-08-31 | University Of Florida Research Foundation, Inc. | Method and apparatus for diagnosing respiratory disorders and determining the degree of exacerbations |
| US7515949B2 (en) | 2005-06-29 | 2009-04-07 | General Electric Company | Wavelet transform of a plethysmographic signal |
| US8359079B2 (en) | 2006-09-21 | 2013-01-22 | Starr Life Sciences Corporation | Pulse oximetry system and techniques for deriving cardiac and breathing parameters from extra-thoracic blood flow measurements |
| WO2008086472A2 (en) | 2007-01-10 | 2008-07-17 | Starr Life Sciences Corporation | Techniques for accurately deriving physiologic parameters of a subject from photoplethysmographic measurements |
| WO2008131335A1 (en) | 2007-04-19 | 2008-10-30 | Starr Life Sciences Corporation | Signal processing method and apparatus for processing a physiologic signal such as a photoplethysmography signal |
| US8529459B2 (en) | 2007-08-08 | 2013-09-10 | Convergent Engineering, Inc. | Processing of photoplethysmography signals |
| US8057398B2 (en) | 2007-08-31 | 2011-11-15 | Apdm, Inc. | Method, system, and apparatus for cardiovascular signal analysis, modeling, and monitoring |
| US8727997B2 (en) * | 2008-10-17 | 2014-05-20 | Yale University | Volume status monitor: peripheral venous pressure, hypervolemia and coherence analysis |
-
2004
- 2004-01-02 US US10/548,518 patent/US8251912B2/en active Active
- 2004-01-02 EP EP11179769A patent/EP2392257A3/en not_active Withdrawn
- 2004-01-02 EP EP04700084A patent/EP1601287B1/en not_active Expired - Lifetime
- 2004-01-02 JP JP2006508584A patent/JP5296312B2/en not_active Expired - Fee Related
- 2004-01-02 WO PCT/US2004/000027 patent/WO2004080300A1/en active Application Filing
-
2009
- 2009-09-28 US US12/568,311 patent/US20100016739A1/en not_active Abandoned
-
2012
- 2012-07-11 US US13/546,178 patent/US20130172702A1/en not_active Abandoned
Patent Citations (1)
| Publication number | Priority date | Publication date | Assignee | Title |
|---|---|---|---|---|
| US6496711B1 (en) | 1994-04-01 | 2002-12-17 | University Of Florida | Pulse oximeter probe |
Non-Patent Citations (28)
| Title |
|---|
| BERNARDI L ET AL.: "Syndronous and baroreceptor-sensitive oscillations in skin microcirculation: evidence for central autonomic control", AMJ J PHYSIOL, vol. 273, 1997, pages H1867 - 1878 |
| BLAND JM, ALTMAN DG: "A note on the use of the intradass correlation cfficient in the evaluation of agreement between two methods of measurement", COMPUTERS IN BIOLOGY AND MEDICINE, vol. 20, 1990, pages 337 - 40 |
| CONNORS A, SPEROFF T, DAWSON N: "The effectiveness of right heart catheterization in the initial care of critically ill patients", JAMA, vol. 276, 1996, pages 889 - 97 |
| COURNAND A, MOTLEY H, WERKO L, RICHARDS D: "Physiological studies of the effect of intermittent positive pressure breathing on cardiac output in man", AM J PHYSIOL, vol. 152, 1948, pages 162 - 73 |
| COYLE J, TEPLICK R, LONG M, DAVISON J: "Respiratory variations in systemic arterial pressure as an indicator of volume status", ANESTHESIOLOGY, vol. 59, 1983, pages A53 |
| DALEN J, BONE R: "Is it time to pull the pulmonary arterycatheter?", JAMA, vol. 276, 1996, pages 916 - 14 |
| DORLAS JC, NIJBOER JA: "Photo- electric plethysmography as a monitoring device in anaesthesia, Application and interpretation", BRITISH JOURNAL OF ANAESTHESIA, vol. 57, 1985, pages 524 - 30 |
| DORLAS JC, NIJBOER JA: "Photo-electric plethysmography as a monitoring device .in anaesthesia. Application and interpretation", BRITISH JOURNAL OF ANAESTHESIA, vol. 57, 1985, pages 524 - 30 |
| FEAMLEYSJ, PLUSE OXIMTRY, PRACTICAL PROCEDURES, no. 5, 1995 |
| HERTZMAN AB: "The Blood Supply of Various Skin A reas as Estimated By the Photoelectric Plethysmograph", AM. J. PHYSIOL., vol. 124, 1938, pages 328 - 40 |
| HERTZMAN, AB: "The Blood Supply of Various Skin Areas as Estimztad By the Photoelectric Plethysmograph", AM. J. PHYSIOL., vol. 124, 1938, pages 328 - 340 |
| JARDIN F, FARCOT J, GUERET P ET AL.: "Gyclic changes in arterial pulse during respiratory support", CIRCULATION, vol. 68, 1983, pages 266 - 74 |
| JOHANSSON A, OBERG PA: "Estimation of respiratory volumes from the photoplethysmographic signal Part I: Experimental results", MEDICAL AND BIOLOGICAL ENGINEERING AND COMPUTING, vol. 37, no. 1, 1999, pages 42 - 7 |
| LHERM T, CHEVALIER T, TROCHE G ET AL.: "Correlation between plethysmography curve variation (dpleth) and pulmonary capillary wedge pressure (pcup) in mechanically ventilated patients", BRITISH JOURNAL OF ANAESTHESIA, no. 1, 1995, pages 41 |
| MORGAN B, CRAWFORD W, GUNTHEROTH W: "The hemodynamic effects of changes in blood volume during intermittent positive-pressure ventilation", ANESTHESIOLOGY, vol. 30, 1969, pages 297 - 305 |
| ORNSTEIN E, EIDELMAN L, DRENGER B ET AL.: "Systolic pressure variation predicts the response to acute blood loss", JOURNAL OF CLINICAL ANESTHESIA, vol. 10, 1998, pages 137 - 40 |
| PARTRIDGE BL: "Use of pulse oximetry as a nonimasive indicator of intravascular volume status", JOURNAL OF CLINICAL MONITORING, vol. 3, 1987, pages 263 - 8 |
| PARTRIDGE BL: "Use ofpulse aximetry as a nonimasive indicator of intravascular volume status", JOURNAL OF CLINICAL MONITORING, vol. 3, no. 4, 1987, pages 263 - 8 |
| PEREL A, PIZOV R, COTEV S: "Systolic blood pressure variation is a sensitive indicator of hypovolemia in ventilated dogs subjected to graded hemornhage", ANESTHESIOLOGY, vol. 67, 1987, pages 498 - 502 |
| PEREL A: "Cardiovascular assessment by pressure waveform analysis", ASA ANNUAL REFRESHER COURSE LECTURE, 1991, pages 264 |
| PIZOV R, SEGAL E, KAPLAN L ET AL.: "The use of systolic pressure variation in hemodynamic monitoring during deliberate hypotension in spine surgery", JOURNAL OF CLINICAL ANESTHESIA, vol. 2, 1990, pages 96 - 100, XP026486912, DOI: doi:10.1016/0952-8180(90)90061-7 |
| PIZOV R, YA'ARI Y, PEREL A: "Systolic pressure variation is greater during hemomhage; than during sodium nitroprusside induced hypotension in ventilated dogs", ANESTHESIA & ANALGESIA, vol. 67, 1988, pages 170 - 4 |
| PODGOREANU MV, STOUT RG, EL-MOALEM E, SILVERMAN DG: "Syndoronous rhythmical vasomotion in the human cuatneous microvasculature during nonpulsatile cardiopulmonarybypass", ANESTHESIOLOGY, vol. 97, 2002, pages 1110 - 1116 |
| RUSCH TL, SANKAR R, SCHARF JE: "Signal processing methods for pulse aximetry", COMPUTERS IN BIOLOGY AND MEDICINE, vol. 26, 1996, pages 143 - 59, XP004532247, DOI: doi:10.1016/0010-4825(95)00049-6 |
| SHAMIR M, EIDEHNAN LA ET AL.: "Pulse aximetry plethysmographic waveform during changes in blood volume", BRITISH JOURNAL OF ANAESTHESIA, vol. 82, no. 2, 1999, pages 178 - 81, XP001088470 |
| SHAMIR M, EIDELMAN LA, FLOMAN Y ET AL.: "Pulse oximetry plethysmographic waveformduring changes in blood volume", BRITISH JOURNAL OF ANAESTHESIA, vol. 82, 1999, pages 178 - 81, XP001088470 |
| STACK BJR, FUTRAN ND, SHOHET MJ, SCHARF JE: "Spectral analysis of photoplethysmograms from radial forearm free flaps", SPECTRAL ANALYSIS OF PHOTOPLETHYSMOGRAMS FROM RADIAL FOREARM FREE FLAPS, vol. 108, 1998, pages 1329 - 33 |
| SZOLD A, PIZOV R, SEGAL E, PEREL A: "The effect of tidal volume and intravascular volume state on systolic pressure variation in ventilated dogs", INTENSIVE CARE MEDICINE, vol. 15, 1989, pages 368 - 71 |
Cited By (8)
| Publication number | Priority date | Publication date | Assignee | Title |
|---|---|---|---|---|
| US8251912B2 (en) | 2003-03-12 | 2012-08-28 | Yale University | Method of assessing blood volume using photoelectric plethysmography |
| US9002440B2 (en) | 2010-07-08 | 2015-04-07 | Intelomed, Inc. | System and method for characterizing circulatory blood flow |
| US9173579B2 (en) | 2010-07-08 | 2015-11-03 | Intelomed, Inc. | System and method for characterizing circulatory blood flow |
| US10390767B2 (en) | 2013-06-04 | 2019-08-27 | Intelomed Inc. | Hemodynamic risk severity based upon detection and quantification of cardiac dysrhythmia behavior using a pulse volume waveform |
| EP3007616A4 (en) * | 2013-06-11 | 2017-01-25 | Intelomed, Inc | Predicting hypovolemic hypotensive conditions using a pulse volume waveform |
| US10568583B2 (en) | 2013-06-11 | 2020-02-25 | Intelomed, Inc. | Methods and systems for predicting hypovolemic hypotensive conditions resulting from bradycardia behavior using a pulse volume waveform |
| US9808160B2 (en) | 2013-08-12 | 2017-11-07 | Intelomed, Inc. | Systems and methods for monitoring and analyzing cardiovascular states |
| US11197617B2 (en) | 2013-08-12 | 2021-12-14 | Intelomed, Inc. | Systems and methods for monitoring and analyzing cardiovascular states |
Also Published As
| Publication number | Publication date |
|---|---|
| EP1601287A1 (en) | 2005-12-07 |
| US20070032732A1 (en) | 2007-02-08 |
| JP2006526460A (en) | 2006-11-24 |
| JP5296312B2 (en) | 2013-09-25 |
| WO2004080300A1 (en) | 2004-09-23 |
| US8251912B2 (en) | 2012-08-28 |
| EP1601287B1 (en) | 2012-12-19 |
| EP2392257A3 (en) | 2012-02-29 |
| US20130172702A1 (en) | 2013-07-04 |
| EP1601287A4 (en) | 2009-07-29 |
| US20100016739A1 (en) | 2010-01-21 |
Similar Documents
| Publication | Publication Date | Title |
|---|---|---|
| EP1601287B1 (en) | Assessment of a decrease in blood volume using cardiovascular waveforms | |
| Reisner et al. | Utility of the photoplethysmogram in circulatory monitoring | |
| Shelley et al. | The use of joint time frequency analysis to quantify the effect of ventilation on the pulse oximeter waveform | |
| US8727997B2 (en) | Volume status monitor: peripheral venous pressure, hypervolemia and coherence analysis | |
| JP5645655B2 (en) | Noninvasive measurement of blood oxygen saturation | |
| US20050222502A1 (en) | Methods and apparatus for patient monitoring | |
| JP2005507298A (en) | A non-invasive method for continuous measurement of physiological characteristics | |
| JP2004223258A (en) | Method and apparatus for evaluating stability of human body using plethysmogram | |
| Prathyusha et al. | Extraction of respiratory rate from PPG signals using PCA and EMD | |
| US8465434B2 (en) | Method and system for detection of respiratory variation in plethysmographic oximetry | |
| Alian et al. | Photoplethysmography: Analysis of the pulse oximeter waveform | |
| Phillips et al. | Modulation of finger photoplethysmographic traces during forced respiration: venous blood in motion? | |
| Dehkordi et al. | Estimating instantaneous respiratory rate from the photoplethysmogram | |
| Nilsson et al. | Respiratory variations in the photoplethysmographic waveform: acute hypovolaemia during spontaneous breathing is not detected | |
| Yousefi et al. | Methods and systems for extracting venous pulsation and respiratory information from photoplethysmographs | |
| US20230148884A1 (en) | Method and device for determining volemic status and vascular tone | |
| Creighton | Monitoring Equipment | |
| Xia | Perianesthesia Monitoring | |
| Bressan et al. | An Introduction to Veterinary Medicine Engineering | |
| Mafi | Blood pressure estimation using oscillometric pulse morphology | |
| Leeper et al. | Pulse Oximetry, Co-oximetry, and Other Newer Technologies | |
| Cysewska-Sobusiak | Noninvasive optoelectronic monitoring of the living tissues vitality | |
| Sosman | Monitoring of Patients under Anaesthesia | |
| Clinton | Haemodynamic monitoring in theatre | |
| Fuehrlein | Photoplethysmography for determining major airway resistance changes and for detecting fluid loss in blood donors and renal hemodialysis patients |
Legal Events
| Date | Code | Title | Description |
|---|---|---|---|
| AC | Divisional application: reference to earlier application |
Ref document number: 1601287 Country of ref document: EP Kind code of ref document: P |
|
| AK | Designated contracting states |
Kind code of ref document: A2 Designated state(s): AT BE BG CH CY CZ DE DK EE ES FI FR GB GR HU IE IT LI LU MC NL PT RO SE SI SK TR |
|
| PUAI | Public reference made under article 153(3) epc to a published international application that has entered the european phase |
Free format text: ORIGINAL CODE: 0009012 |
|
| PUAL | Search report despatched |
Free format text: ORIGINAL CODE: 0009013 |
|
| AK | Designated contracting states |
Kind code of ref document: A3 Designated state(s): AT BE BG CH CY CZ DE DK EE ES FI FR GB GR HU IE IT LI LU MC NL PT RO SE SI SK TR |
|
| RIC1 | Information provided on ipc code assigned before grant |
Ipc: A61B 5/024 20060101AFI20120125BHEP Ipc: A61B 5/00 20060101ALI20120125BHEP Ipc: G06F 19/00 20110101ALI20120125BHEP |
|
| 17P | Request for examination filed |
Effective date: 20120829 |
|
| STAA | Information on the status of an ep patent application or granted ep patent |
Free format text: STATUS: THE APPLICATION IS DEEMED TO BE WITHDRAWN |
|
| 18D | Application deemed to be withdrawn |
Effective date: 20160802 |