EP2615183A1 - Predictors of patient response to treatment with EGF receptor inhibitors - Google Patents
Predictors of patient response to treatment with EGF receptor inhibitors Download PDFInfo
- Publication number
- EP2615183A1 EP2615183A1 EP13163561.7A EP13163561A EP2615183A1 EP 2615183 A1 EP2615183 A1 EP 2615183A1 EP 13163561 A EP13163561 A EP 13163561A EP 2615183 A1 EP2615183 A1 EP 2615183A1
- Authority
- EP
- European Patent Office
- Prior art keywords
- egfr
- gene
- ereg
- ptp4a3
- phlda1
- Prior art date
- Legal status (The legal status is an assumption and is not a legal conclusion. Google has not performed a legal analysis and makes no representation as to the accuracy of the status listed.)
- Granted
Links
Images


Classifications
-
- C—CHEMISTRY; METALLURGY
- C12—BIOCHEMISTRY; BEER; SPIRITS; WINE; VINEGAR; MICROBIOLOGY; ENZYMOLOGY; MUTATION OR GENETIC ENGINEERING
- C12Q—MEASURING OR TESTING PROCESSES INVOLVING ENZYMES, NUCLEIC ACIDS OR MICROORGANISMS; COMPOSITIONS OR TEST PAPERS THEREFOR; PROCESSES OF PREPARING SUCH COMPOSITIONS; CONDITION-RESPONSIVE CONTROL IN MICROBIOLOGICAL OR ENZYMOLOGICAL PROCESSES
- C12Q1/00—Measuring or testing processes involving enzymes, nucleic acids or microorganisms; Compositions therefor; Processes of preparing such compositions
- C12Q1/68—Measuring or testing processes involving enzymes, nucleic acids or microorganisms; Compositions therefor; Processes of preparing such compositions involving nucleic acids
- C12Q1/6876—Nucleic acid products used in the analysis of nucleic acids, e.g. primers or probes
- C12Q1/6883—Nucleic acid products used in the analysis of nucleic acids, e.g. primers or probes for diseases caused by alterations of genetic material
- C12Q1/6886—Nucleic acid products used in the analysis of nucleic acids, e.g. primers or probes for diseases caused by alterations of genetic material for cancer
-
- C—CHEMISTRY; METALLURGY
- C12—BIOCHEMISTRY; BEER; SPIRITS; WINE; VINEGAR; MICROBIOLOGY; ENZYMOLOGY; MUTATION OR GENETIC ENGINEERING
- C12Q—MEASURING OR TESTING PROCESSES INVOLVING ENZYMES, NUCLEIC ACIDS OR MICROORGANISMS; COMPOSITIONS OR TEST PAPERS THEREFOR; PROCESSES OF PREPARING SUCH COMPOSITIONS; CONDITION-RESPONSIVE CONTROL IN MICROBIOLOGICAL OR ENZYMOLOGICAL PROCESSES
- C12Q2600/00—Oligonucleotides characterized by their use
- C12Q2600/106—Pharmacogenomics, i.e. genetic variability in individual responses to drugs and drug metabolism
-
- C—CHEMISTRY; METALLURGY
- C12—BIOCHEMISTRY; BEER; SPIRITS; WINE; VINEGAR; MICROBIOLOGY; ENZYMOLOGY; MUTATION OR GENETIC ENGINEERING
- C12Q—MEASURING OR TESTING PROCESSES INVOLVING ENZYMES, NUCLEIC ACIDS OR MICROORGANISMS; COMPOSITIONS OR TEST PAPERS THEREFOR; PROCESSES OF PREPARING SUCH COMPOSITIONS; CONDITION-RESPONSIVE CONTROL IN MICROBIOLOGICAL OR ENZYMOLOGICAL PROCESSES
- C12Q2600/00—Oligonucleotides characterized by their use
- C12Q2600/158—Expression markers
Definitions
- the present disclosure provides genes and gene sets, the expression levels of which are useful for predicting response of cancer patients to an epidermal growth factor receptor (EGFR) inhibitor therapy.
- EGFR epidermal growth factor receptor
- Epidermal growth factor receptor also known as ERBB and HER1
- EGFR Epidermal growth factor receptor
- ERBB2 erythroblastic leukemia viral oncogene homolog 2
- HER2 erythroblastic leukemia viral oncogene homolog 2
- Expression levels of EGFR are amplified in a subset of breast cancers and the resulting overexpression of the receptor contributes to breast cancer etiology.
- EGFR inhibitors e.g., have demonstrated activity against a number of cancer types.
- Anti-EGFR monoclonal antibodies have shown antitumour activity in advanced colorectal cancer, in squamous cell carcinomas of the head and neck, non-small-cell lung cancer (NSCLC) and renal cell carcinomas ( Baselga J and Arteaga CL (2005) J Clin Oncol 2445-2459 .
- Clinical trials are ongoing in early stage cancer and in other tumour types and are expected to show activity in cancer types where EGFR is expressed and where EGFR ligands promote tumour growth and progression.
- the present disclosure provides methods and compositions to facilitate determining whether an EGFR-expressing cancer in an individual is an EGFR inhibitor-responsive cancer, as well as methods for determining the likelihood that a patient having an EGFR-expressing cancer will exhibit a beneficial response to an EGFR inhibitor therapy.
- the methods generally involve determining a normalized expression level of a gene product that correlates with EGFR inhibitor responsiveness.
- the disclosure provides methods for predicting the likelihood that a human patient with an EGFR -expressing cancer will exhibit a beneficial response to an EGFR inhibitor cancer therapy based on expression levels of one or more response indicator genes in a biological sample obtained from a tumour in the patient.
- the method entails measuring an expression level of at least one response indicator gene, or its expression product.
- the response indicator gene is one or more selected from a group consisting of ATP5E, TITF1, CLTC, BRCA1, AREG, PTP4A3, EREG, VAV3, SATB2, CEACAM6, EGFR, CHN2, FGFR3, C13orf18, QPRT, AMACR1, CKMT2, ID1, SORBS1, SLC26A3, ErbB3, DUSP6, VDAC2, ANXA2P2, SERPINB1, NT5E, GPC3, DUSP4, PHLDA1, K-ras, DR5, VIL2, LAMC2, SFN, ANXA1, EPHA2, P14ARF, CA9, KRT17, p14ARF, Maspin, PLAUR, LAMA3, and GCNT3.
- the expression level is normalized, and the normalized expression level is used to determine or predict likelihood of beneficial response, wherein increased normalized expression levels of one or more of the following are measured: ATP5E, TITF1, CLTC, BRCA1, AREG, PTP4A3, EREG, VAV3, SATB2, CEACAM6, EGFR, CHN2, FGFR3, C13orf18, QPRT, AMACR1, CKMT2, ID1, SORBS1, SLC26A3, and ErbB3 are positively correlated with the likelihood that the patient will exhibit a beneficial response to the EGFR inhibitor cancer therapy; and increased normalized expression levels of DUSP6, VDAC2, ANXA2P2, SERPINB1, NT5E, GPC3, DUSP4, PHLDA1, K-ras, DR5, VIL2, LAMC2, SFN, ANXA1, EPHA2, P14ARF, CA9, KRT17, p14ARF, Maspin, PLAUR, LAMA3, and GCNT3 are negatively correlated with
- the disclosure provides methods for predicting a likelihood that a human patient with a KRAS-negative, EGFR-expressing cancer will exhibit a beneficial response to an EGFR inhibitor cancer therapy based on expression levels of one or more response indicator genes in a biological sample obtained from a tumour in the patient.
- the method entails measuring an expression level of at least one response indicator gene, or its expression product, selected from a group consisting of EGF, ADAM17, PTP4A3, ADAM15, QPRT, SATB2, RASSF1, VAV3, CEACAM6, EREG, AREG, TITF1, SORBS1, C13orf18, CKMT2, BTC, ATP5E, B.Catenin, CCNE1, EGFR, Bclx, BRCA1, CDC25B, CHN2, ID1, SLC26A3, VDAC2, SERPINB1, PHLDA1, ANXA2P2, KRT17, EPHA2, DUSP4, CGA, CA9, Maspin, NEDD8, DUSP6, GPC3, NT5E, VIL2, and P14ARF.
- the expression level is normalized, and the normalized expression level is used to determine or predict likelihood of beneficial response, wherein increased normalized expression levels of one or more of the following are measured: EGF, ADAM17, PTP4A3, ADAM15, QPRT, SATB2, RASSF1, VAV3, CEACAM6, EREG, AREG, TITF1, SORBS1, C13orf18, CKMT2, BTC, ATP5E, B.Catenin, CCNE1, EGFR, Bclx, BRCA1, CDC25B, CHN2, ID1, and SLC26A3 are positively correlated with the likelihood that the patient will exhibit a beneficial response to the EGFR inhibitor cancer therapy; and increased normalized expression levels of VDAC2, SERPINB1, PHLDA1, ANXA2P2, KRT17, EPHA2, DUSP4, CGA, CA9, Maspin, NEDD8, DUSP6, GPC3, NT5E, VIL2, and P14ARF are negatively correlated with the likelihood that the patient will exhibit
- the methods of the present disclosure contemplate using a normalized expression level to determine or predict likelihood of beneficial response, based on normalized expression level(s) for single response indicator genes and/or multi-gene sets. Exemplary multi-gene sets are disclosed.
- the expression values are normalized relative to an expression level of one or more reference genes.
- the disclosure provides for measurement of normalized expression level(s) of at least one response indicator gene product.
- the methods may further include determining the expression levels of at least two of said genes, or their expression products. It is further contemplated that the methods of the present disclosure may further include determining the expression levels of at least three of said genes, or their expression products.
- the methods of the present disclosure may further include determining the expression levels of at least four of said genes, or their expression products. It is contemplated that the methods of the present disclosure may further include determining the expression levels of at least five of said genes, or their expression products. It is contemplated that the methods of the present disclosure may further include determining the expression levels of at least six of said genes, or their expression products. It is contemplated that the methods of the present disclosure may further include determining the expression levels of at least seven of said genes, or their expression products. It is contemplated that the methods of the present disclosure may further include determining the expression levels of at least eight of said genes, or their expression products.
- the methods of the present disclosure may further include determining the expression levels of at least nine of said genes, or their expression products.
- the methods may involve determination of the expression levels of at least ten (10) or at least fifteen (15) of the genes listed above or their products.
- a normalized expression level(s), generated as discussed above, is used to determine or predict likelihood of beneficial response,
- the normalized expression level(s) is indicative of the likelihood that the patient will exhibit a beneficial response to an EGFR inhibitor therapy, such as an EGFR-specific antibody or small molecule.
- a likelihood score (e.g., a score predicting likelihood of beneficial response to EGFR inhibitor treatment) can be calculated based on the normalized expression level(s).
- a score may be calculated using weighted values based on a normalized expression level of a response indicator gene and its contribution to response to EGFR inhibitor cancer therapy.
- the disclosure provides arrays for carrying out the methods disclose herein, or for analysing whether a mathematical combination of the normalized expression levels of any combination of the response indicator genes is more indicative of a likelihood that a patient will respond to treatment with an EGFR inhibitor.
- the arrays may include, for example, probes that hybridize to a nucleic acid sequence in a response indicator genes or an activating KRAS mutation.
- Determining the expression level of one or more genes may be accomplished by, for example, a method of gene expression profiling.
- the method of gene expression profiling may be, for example, a PCR-based method.
- the expression level of said genes can be determined, for example, by RT-PCR (reverse transcriptase PCR), quantitative RT-PCR (qRT-PCR), or other PCR-based methods, immunohistochemistry, proteomics techniques, an array-based method, or any other methods known in the art or their combination.
- RT-PCR reverse transcriptase PCR
- qRT-PCR quantitative RT-PCR
- the RNA transcripts are fragmented.
- RNA transcript of a response indicator gene may be accomplished by assaying for an exon-based sequence or an intron-based sequence, the expression of which correlates with the expression of a corresponding exon sequence.
- the assay for the measurement of response indicator genes, or their gene products, and/or activating KRAS mutations is provided in the form of a kit or kits.
- the expression levels of the genes may be normalized relative to the expression levels of one or more reference genes, or their expression products.
- the tumour sample may be, for example, a tissue sample containing cancer cells, or portion(s) of cancer cells, where the tissue can be fixed, paraffin-embedded or fresh or frozen tissue.
- the tissue may be from a biopsy (fine needle, core or other types of biopsy) or obtained by fine needle aspiration, or by obtaining body fluid containing a cancer cell, e.g. urine, blood, etc.
- the determination of expression levels may occur more than one time in the practice of the methods disclosed herein.
- the methods may further include the step of creating a report based on the determined or predicted likelihood of beneficial response.
- the present disclosure provides reports for a patient containing a summary of the expression levels of the one or more response indicator genes, or their expression products, in a tumour sample obtained from said patient.
- the report is in electronic form.
- the EGFR inhibitor is an antibody specific for EGFR.
- the EGFR inhibitor is a small molecule, for example an EGFR-selective tyrosine kinase inhibitor.
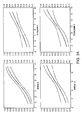
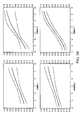
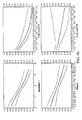
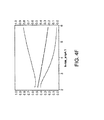
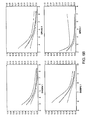
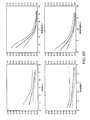
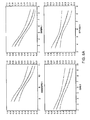
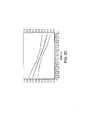
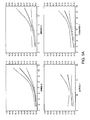
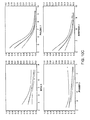
- Each of Tables 1A, 1 B, 2A, 2B, 6A, 6B, 7A and 7B provides an Odds Ratio for each response indicator and gene listed in the table.
- the Odds Ratio reported for a gene is related to the overall slope of the probability curve shown in the corresponding Figure and is a measure of the change in the model-predicted probability of response for every unit change in normalized gene expression. As shown, genes with stronger odds ratios (further from 1) in the tables are depicted with steeper slopes in the figures.
- KRAS KRAS gene identified as of the date of this filing in the NCBI Entrez Gene database as Accession No. NM_004985.3 (Entrez Gene database, NCBI), and/or its expression products.
- KRAS status refers to whether a patient's cancer is negative for an activating KRAS mutation (KRAS-negative) or positive for an activating KRAS mutation (KRAS-positive).
- activating KRAS mutation refers to a mutation in a k-ras gene that results in constitutive activation of a protein encoded by k-ras, i.e. the k-ras protein activates molecules downstream in its signaling pathway in the absence of receptor bound ligand.
- the k-ras protein might activate downstream signaling in the absence of EGF, amphiregulin, or epiregulin binding to EGFR.
- EGFR-expressing cancer refers to a cancer tumour with cells that express a cell surface epidermal growth factor receptor (EGFR) polypeptide.
- EGFR cell surface epidermal growth factor receptor
- EGFR epidermal growth factor receptor
- EGFR epidermal growth factor receptor
- An exemplary EGFR is the human epidermal growth factor receptor (see Ullrich et al. (1984) Nature 309:418-425 ; Genbank accession number NP_005219.2). Binding of an EGF ligand activates the EGFR (e.g. resulting in activation of intracellular mitogenic signaling, autophosphorylation of EGFR).
- ligands in addition to EGF, can bind to and activate the EGFR.
- ligands include, but are not limited to, amphiregulin, epiregulin, TGF- ⁇ , betacellulin, and heparin-binding EGF (HB-EGF) ( Strawn and Shawver (1998) Exp. Opin. Invest. Drugs 7(4)553-573 , and " The Protein Kinase Facts Book: Protein Tyrosine Kinases” (1995) Hardie, et al. (eds.), Academic Press, NY, NY ). See also, Oda et al. ((2005) Molec. Systems Biol. 1:2005.0010 ; and Moulder et al. ((2001) Cancer Res. 61:8887 .
- an "EGFR gene” refers to a nucleic acid that encodes an EGFR gene product, e.g., an EGFR mRNA, an EGFR polypeptide, and the like.
- EGFR inhibitor refers to any agent capable of directly or indirectly inhibiting activation of an EGFR.
- EGFR inhibitors include agents that bind to an EGFR and inhibit its activation.
- EGFR inhibitors include antibodies that bind to an EGFR and inhibit activation of the EGFR; as well as small molecule tyrosine kinase inhibitors that inhibit activation of an EGFR.
- Antibodies to EGFR include IgG; IgM; IgA; antibody fragments that retain EGFR binding capability, e.g., Fv, Fab, F(ab) 2 , single-chain antibodies, and the like; chimeric antibodies; etc.
- Small molecule tyrosine kinase inhibitors of EGFR include EGFR-selective tyrosine kinase inhibitors.
- Small molecule tyrosine kinase inhibitors of EGFR can have a molecular weight in a range of from about 50 Da to about 10,000 Da.
- tumor refers to any neoplastic cell growth and proliferation, whether malignant or benign, and all pre-cancerous and cancerous cells and tissues.
- cancer refers to or describe the physiological condition in mammals that is typically characterized in part by unregulated cell growth.
- examples of cancer include, but are not limited to, colorectal cancer, breast cancer, ovarian cancer, lung cancer, prostate cancer, hepatocellular cancer, gastric cancer, pancreatic cancer, cervical cancer, liver cancer, bladder cancer, cancer of the urinary tract, thyroid cancer, renal cancer, carcinoma, melanoma, brain cancer, non-small cell lung cancer, squamous cell cancer of the head and neck, endometrial cancer, multiple myeloma, rectal cancer, and esophageal cancer.
- the cancer is colorectal cancer.
- pathology of cancer includes all phenomena that compromise the well-being of the patient. This includes, without limitation, abnormal or uncontrollable cell growth, metastasis, interference with the normal functioning of neighboring cells, release of cytokines or other secretory products at abnormal levels, suppression or aggravation of inflammatory or immunological response, neoplasia, premalignancy, malignancy, invasion of surrounding or distant tissues or organs, such as lymph nodes, etc.
- subject means a mammal being assessed for treatment and/or being treated.
- the mammal is a human.
- the terms “subject,” “individual,” and “patient” thus encompass individuals having cancer (e.g., colorectal cancer or other cancer referenced herein), including those who have undergone or are candidates for resection (surgery) to remove cancerous tissue (e.g., cancerous colorectal tissue or other cancer referenced herein).
- treatment refers to administering an agent, or carrying out a procedure (e.g., radiation, a surgical procedure, etc.), for the purposes of obtaining an effect.
- the effect may be prophylactic in terms of completely or partially preventing a disease or symptom thereof and/or may be therapeutic in terms of effecting a partial or complete cure for a disease and/or symptoms of the disease.
- Treatment covers any treatment of a disease in a mammal, particularly in a human, and includes: (a) preventing the disease or a symptom of a disease from occurring in a subject which may be predisposed to the disease but has not yet been diagnosed as having it (e.g ., including diseases that may be associated with or caused by a primary disease; (b) inhibiting the disease, i.e., arresting its development; and (c) relieving the disease, i.e., causing regression of the disease.
- the terms "beneficial response,” “beneficial patient response,” and “clinically beneficial response,” “clinical benefit,” and the like, are used interchangeably and refer to favorable patient response to a drug as opposed to unfavorable responses, i.e. adverse events.
- beneficial response can be expressed in terms of a number of clinical parameters, including loss of detectable tumour (complete response, CR), decrease in tumour size and/or cancer cell number (partial response, PR), tumour growth arrest (stable disease, SD), enhancement of anti-tumour immune response, possibly resulting in regression or rejection of the tumour; relief, to some extent, of one or more symptoms associated with the tumour; increase in the length of survival following treatment; and/or decreased mortality at a given point of time following treatment.
- CR complete response
- PR partial response
- SD tumour growth arrest
- enhancement of anti-tumour immune response possibly resulting in regression or rejection of the tumour
- relief to some extent, of one or more symptoms associated with the tumour
- increase in the length of survival following treatment and/or decreased mortality at a given point of time following treatment.
- Continued increase in tumour size and/or cancer cell number and/or tumour metastasis is indicative of lack of beneficial response to treatment.
- the clinical benefit of a drug i.e. its efficacy can be evaluated on the basis of one or more endpoints.
- ORR overall response rate
- DC disease control
- progression free survival refers to the time interval from treatment of the patient until the progression of cancer or death of the patient, whichever occurs first.
- the term "responder” refers to a patient who has an EGFR-expressing cancer, and who exhibits a beneficial clinical response following treatment with an EGFR inhibitor.
- non-responder refers to a patient who has an EGFR-expressing cancer, and who has not shown a beneficial response following treatment with an EGFR inhibitor.
- correlation refers to a statistical association between instances of two events, where events include numbers, data sets, and the like.
- a positive correlation also referred to herein as a "direct correlation” means that as one increases, the other increases as well.
- a negative correlation also referred to herein as an "inverse correlation” means that as one increases, the other decreases.
- the correlation need not necessarily be a linear correlation and need not apply across the entire range of the variables.
- tumour sample means a sample comprising tumour material obtained from a cancerous patient.
- the term encompasses clinical samples, for example tissue obtained by surgical resection and tissue obtained by biopsy, such as for example a core biopsy or a fine needle biopsy.
- the term also encompasses samples comprising tumour cells obtained from sites other than the primary tumour, e.g., circulating tumour cells.
- the term encompasses cells that are the progeny of the patient's tumour cells, e.g. cell culture samples derived from primary tumour cells or circulating tumour cells.
- the term encompasses samples that may comprise protein or nucleic acid material shed from tumour cells in vivo, e.g. bone marrow, blood, plasma, serum, and the like.
- the term also encompasses samples that have been enriched for tumour cells or otherwise manipulated after their procurement and samples comprising polynucleotides and/or polypeptides that are obtained from a patient's tumour material.
- RNA transcription products transcription products of the gene, including mRNA and the polypeptide translation products of such RNA transcripts, whether such product is modified post-translationally or not (e.g., unspliced RNA, a splice variant mRNA, RNA fragment, etc.).
- a gene product or expression product includes the polypeptide translation products of such RNA, whether such product is modified post-translationally or not (e.g., a splice variant polypeptide, etc.)
- normalized expression level refers to an expression level of a response indicator gene relative to the level of an expression product of a reference gene(s).
- response indicator gene refers to a gene, the expression of which correlates positively or negatively with beneficial patient response to EGFR inhibitor treatment.
- the expression of a response indicator gene may be measured by determining the expression level of an expression product of the response indicator gene.
- RNA transcript or other expression product, e.g., protein
- RNA transcript or other expression product, e.g., protein
- mRNA the level of the transcript (or fragmented RNA) determined by normalization to the level of one or more reference mRNA(s), which might be all measured transcripts in the specimen, a single reference mRNA, or a particular reference set of mRNAs.
- a gene exhibits "increased expression" in a subpopulation of subjects when the normalized expression level of an RNA transcript (or its gene product) is higher in one clinically relevant subpopulation of patients (e.g., patients who are responsive to an EGFR inhibitor) than in a related subpopulation (e.g., patients who are not responsive to said EGF inhibitor).
- a gene is exhibits "increased expression” when the normalized expression level of the gene trends toward or more closely approximates the normalized expression level characteristic of such a clinically relevant subpopulation of patients.
- the gene analysed is a gene that shows increased expression in responsive subjects as compared to non-responsive subjects
- the gene expression level supports a determination that the individual patient is likely to be a responder.
- the gene analysed is a gene that is increased in expression in non-responsive patients as compared to responsive patients
- the gene expression level supports a determination that the individual patient will be non-responsive.
- label and “detectable label” refer to a molecule capable of being detected, where such molecules include, but are not limited to, radioactive isotopes, fluorescers (fluorophores), chemiluminescers, chromophores, enzymes, enzyme substrates, enzyme cofactors, enzyme inhibitors, chromophores, dyes, metal ions, metal sols, ligands (e.g., biotin, avidin, strepavidin or haptens), intercalating dyes and the like.
- fluorescers fluorophores
- chemiluminescers chemiluminescers
- chromophores enzymes
- enzyme substrates enzyme substrates
- enzyme cofactors enzyme inhibitors
- chromophores dyes
- metal ions metal sols
- ligands e.g., biotin, avidin, strepavidin or haptens
- target nucleic acid region refers to a nucleic acid with a "target sequence” to be detected (e.g., in a method involving nucleic acid hybridization and/or amplification).
- the target nucleic acid may be either single-stranded or double-stranded and may or may not include other sequences besides the target sequence (e.g., the target nucleic acid may or may not include nucleic acid sequences upstream or 5' flanking sequence, and may or may not include downstream or 3' flanking sequence. Where detection is by amplification, these other sequences in addition to the target sequence may or may not be amplified with the target sequence.
- primer refers to an oligonucleotide which acts to initiate synthesis of a complementary nucleic acid strand when placed under conditions in which synthesis of a primer extension product is induced, e.g., in the presence of nucleotides and a polymerization-inducing agent such as a DNA or RNA polymerase and at suitable temperature, pH, metal ion concentration, and salt concentration.
- a polymerization-inducing agent such as a DNA or RNA polymerase and at suitable temperature, pH, metal ion concentration, and salt concentration.
- Primers are generally of a length compatible with their use in synthesis of primer extension products, and can be in the range of between about 8 nucleotides and about 100 nucleotides (nt) in length, such as about 10 nt to about 75 nt, about 15 nt to about 60 nt, about 15 nt to about 40 nt, about 18 nt to about 30 nt, about 20 nt to about 40 nt, about 21 nt to about 50 nt, about 22 nt to about 45 nt, about 25 nt to about 40 nt, and so on, e.g., in the range of between about 18 nt and about 40 nt, between about 20 nt and about 35 nt, between about 21 and about 30 nt in length, inclusive, and any length between the stated ranges.
- nt nucleotides
- Primers can be in the range of between about 10-50 nucleotides long, such as about 15-45, about 18-40, about 20-30, about 21-25 nt and so on, and any length between the stated ranges. In some embodiments, the primers are not more than about 10, 12, 15, 20, 21, 22, 23, 24, 25, 26, 27, 28, 29, 30, 35, 40, 45, 50, 55, 60, 65, or 70 nucleotides in length. In this context, the term "about” may be construed to mean 1, 2, 3, 4, 5, 6, 7, 8, 9, 10, 11, 12, 13, 14, 15, 16, 17, 18, 19 or 20 more nucleotides either 5' or 3' from either termini or from both termini.
- Primers are in many embodiments single-stranded for maximum efficiency in amplification, but may alternatively be double-stranded. If double-stranded, the primer is in many embodiments first treated to separate its strands before being used to prepare extension products. This denaturation step is typically effected by heat, but may alternatively be carried out using alkali, followed by neutralization.
- a "primer" is complementary to a template, and complexes by hydrogen bonding or hybridization with the template to give a primer/template complex for initiation of synthesis by a polymerase, which is extended by the covalent addition of bases at its 3' end.
- a “primer pair” as used herein refers to first and second primers having nucleic acid sequence suitable for nucleic acid-based amplification of a target nucleic acid.
- Such primer pairs generally include a first primer having a sequence that is the same or similar to that of a first portion of a target nucleic acid, and a second primer having a sequence that is complementary to a second portion of a target nucleic acid to provide for amplification of the target nucleic acid or a fragment thereof.
- Reference to "first” and “second” primers herein is arbitrary, unless specifically indicated otherwise.
- the first primer can be designed as a "forward primer” (which initiates nucleic acid synthesis from a 5' end of the target nucleic acid) or as a "reverse primer” (which initiates nucleic acid synthesis from a 5' end of the extension product produced from synthesis initiated from the forward primer).
- the second primer can be designed as a forward primer or a reverse primer.
- probe or “oligonucleotide probe”, used interchangeable herein, refers to a structure comprised of a polynucleotide, as defined above, which contains a nucleic acid sequence complementary to a nucleic acid sequence present in the target nucleic acid analyte (e.g., a nucleic acid amplification product).
- the polynucleotide regions of probes may be composed of DNA, and/or RNA, and/or synthetic nucleotide analogs.
- Probes are generally of a length compatible with their use in specific detection of all or a portion of a target sequence of a target nucleic acid, and are in many embodiments in the range of between about 8 nt and about 100 nt in length, such as about 8 to about 75 nt, about 10 to about 74 nt, about 12 to about 72 nt, about 15 to about 60 nt, about 15 to about 40 nt, about 18 to about 30 nt, about 20 to about 40 nt, about 21 to about 50 nt, about 22 to about 45 nt, about 25 to about 40 nt in length, and so on, e.g., in the range of between about 18-40 nt, about 20-35 nt, or about 21-30 nt in length, and any length between the stated ranges.
- a probe is in the range of between about 10-50 nucleotides long, such as about 15-45, about 18-40, about 20-30, about 21-28, about 22-25 and so on, and any length between the stated ranges.
- the primers are not more than about 10, 12, 15, 20, 21, 22, 23, 24, 25, 26, 27, 28, 29, 30, 35, 40, 45, 50, 55, 60, 65, or 70 nucleotides in length.
- the term "about” may be construed to mean 1, 2, 3, 4, 5, 6, 7, 8, 9, 10, 11, 12, 13, 14, 15, 16, 17, 18, 19 or 20 more nucleotides either 5' or 3' from either termini or from both termini.
- hybridization is under stringent conditions.
- stringent hybridization conditions is hybridization at 50°C or higher and 0.1 ⁇ SSC (15 mM sodium chloride/1.5 mM sodium citrate).
- Another example of stringent hybridization conditions is overnight incubation at 42°C in a solution: 50 % formamide, 5 x SSC (150 mM NaCl, 15 mM trisodium citrate), 50 mM sodium phosphate (pH7.6), 5 ⁇ Denhardt's solution, 10% dextran sulfate, and 20 ⁇ g/ml denatured, sheared salmon sperm DNA, followed by washing the filters in 0.1 ⁇ SSC at about 65°C.
- Stringent hybridization conditions are hybridization conditions that are at least as stringent as the above representative conditions, where conditions are considered to be at least as stringent if they are at least about 80% as stringent, e.g., at least about 90% as stringent as the above specific stringent conditions.
- computer-based system refers to the hardware, software, and data storage system used to analyse information.
- the minimum hardware of a patient computer-based system comprises a central processing unit (CPU), input device, output device, and data storage device.
- CPU central processing unit
- input device input device
- output device output device
- data storage device data storage device
- Record data programming or other information on a computer readable medium refers to a process for storing information, using any such methods as known in the art. Any convenient data storage structure may be chosen, based on the method and/or device used to access the stored information. A variety of data processor programs and formats can be used for storage, e.g. word processing text file, database format, etc.
- a "processor” or “computing system” or “computing device” references any hardware and/or software combination that will perform the functions required of it.
- any processor herein may be a programmable digital microprocessor such as available in the form of an electronic controller, mainframe, server or personal computer (desktop or portable).
- suitable programming can be communicated from a remote location to the processor, or previously saved in a computer program product (such as a portable or fixed computer readable storage medium, whether magnetic, optical or solid state device based).
- a magnetic medium or optical disk may carry the programming, and can be read by a suitable reader communicating with each processor at its corresponding station.
- response indicator genes and gene modules Based on evidence of differential expression of a gene (e.g., as detected by assaying for an RNA transcript) in cancer cells that positively respond to an EGFR-inhibitor and non-responsive cancer cells, the present disclosure provides response indicator genes and gene modules. These response indicator genes and/or gene modules and associated information provided by the present disclosure allow physicians to make more intelligent treatment decisions, and to customize the treatment of EGFR-expressing cancer to the needs of individual patients, thereby maximizing the benefit of treatment and minimizing the exposure of patients to unnecessary treatments, which do not provide any significant benefits and often carry serious risks due to toxic side-effects.
- the response indicator genes and/or gene modules and associated information provided by the present disclosure have utility in the development of therapies to treat EGFR-expressing cancer and screening patients for inclusion in clinical trials that test the efficacy of EGFR inhibitors.
- Said genes and/or gene modules and association information may also be used to design or produce a reagent that modulates the level or activity of the gene's transcript (i.e., RNA transcript) or its expression product.
- Said reagents may include but are not limited to an antisense RNA, a small inhibitory RNA, a ribozyme, a monoclonal or polyclonal antibody.
- the expression level of each gene may be determined in relation to various features of the expression products of the gene including exons, introns, protein epitopes and protein activity
- the present disclosure provides methods to predict the likelihood that a patient having an EGFR-expressing cancer will exhibit a beneficial response to an EGFR inhibitor therapy.
- Patients subject to such an assessment include: 1) patients who have an EGFR-expressing cancer and who have not yet undergone any treatment for the cancer; 2) patients who have an EGFR-expressing cancer and who have undergone complete or partial resection of the cancer, e.g., who have undergone surgical removal of cancerous tissues to the extent clinically possible; and 3) patients who have an EGFR-expressing cancer and who have been treated with a treatment regimen other than an EGFR inhibitor treatment regimen.
- Patients who are subject to a likelihood assessment as disclosed herein also include those whose cancer is KRAS-negative (e.g., patients who have a (KRAS - ) tumour).
- the same patient sample, and even the same assay may be used for both determining whether a cancer is an EGFR-expressing cancer and assessing the likelihood that the patient having an EGFR - expressing cancer will exhibit a beneficial response to an EGFR inhibitor cancer therapy.
- the assay(s) used to determine whether the cancer is an EGFR-expressing cancer may be carried out at the same time as the assay(s) used to assess the likelihood that the patient having an EGFR -expressing cancer will exhibit a beneficial response to an EGFR inhibitor.
- the result of the assay(s) used to determine whether the cancer is an EGFR-expressing cancer may guide the decision as to whether and how to apply an additional assay(s) used to assess the likelihood that the patient having an EGFR -expressing cancer will exhibit a beneficial response to an EGFR inhibitor.
- EGFR-expressing cancers include cancers comprising cells that express an EGFR on their cell surface.
- Such cancers include, but are not limited to, breast cancer, lung cancer, colorectal cancer, renal cancer prostate cancer, brain cancer, liver cancer, pancreatic cancer, and head and neck cancer.
- EGFR inhibitors include, e.g., antibodies that bind to and inhibit EGFR, EGFR-selective tyrosine kinase inhibitors, and the like.
- EGFR inhibitors include, but are not limited to, cetuximab (Erbitux®) and panitumumab (Vectibix®), both monoclonal antibodies that block EGFR and EGFR-dependent cell growth; gefitinib (Iressa®; N-(3-chloro-4-fluoro-phenyl)-7-methoxy-6-(3-morpholin-4-ylpropoxy)quinazolin-4-amine); OSI774 (erlotinib, Tarceva®; N-(3-ethynylphenyl)-6,7-bis(2-methoxyethoxy) quinazolin-4-amine); and alpha-cyano-beta-methyl-N-[(trifluoromethoxy)phenyl]-propenamide (LFM-A12), all small molecule tyrosine kinase inhibitors; and the like.
- cetuximab Erbitux®
- panitumumab Vect
- Erbitux is a registered trademark of Bristol-Myers Squibb Co.
- Vectibix is a registered trademark of Amgen, Inc.
- Iressa is a registered trademark of AstraZeneca.
- Tarceva is a registered trademark of Genentech, Inc.
- EGFR inhibitors also include EGFR tyrosine kinase inhibitors such as quinazolines, such as PD 153035 ( Fry et al. (1994) Science 265:1093 ; and Traxler et al. (1997) J. Pharm. Belg. 52:1997 ), 4-(3-chloroanilino) quinazoline, or CP-358,774; pyrrolopyrimidines, such as CGP 59326, CGP 60261 and CGP 62706 ( Traxler et al. (1997) J. Pharm. Belg. 52:1997 ); pyrazolopyrimidines ( Strawn and Shawver (April 1998) Exp. Opin. Invest.
- quinazolines such as PD 153035 ( Fry et al. (1994) Science 265:1093 ; and Traxler et al. (1997) J. Pharm. Belg. 52:1997 )
- pyrrolopyrimidines
- Drugs 7:553-573 4-(phenylamino)-7H-pyrrolo[2,3-d] pyrimidines ( Traxler et al., (1996) J. Med. Chem 39:2285-2292 ); curcumin (diferuloyl methane) ( Laxminarayana, et al., (1995), Carcinogen 16:1741-1745 ); 4,5-bis (4-fluoroanilino)phthalimide ( Buchdunger et al. (1995) Clin. Cancer Res. 1:813-821 ; Dinney et al. (1997) Clin. Cancer Res. 3:161-168 ); tyrphostins containing nitrothiophene moieties ( Brunton et al.
- PD-0183805 (Warner-Lambert); inhibitors as described in International patent application WO99/09016 (American Cyanamid); WO98/43960 (American Cyanamid); WO97/38983 (Warner Lambert ); WO99/06378 (Warner Lambert) ; WO99/06396 (Warner Lambert ); WO96/30347 (Pfizer, Inc.); WO96/33978 (AstraZeneca); WO96/33977 (AstraZeneca); and WO96/33980 (AstraZeneca).
- the present disclosure provides methods to predict the likelihood that a patient having an EGFR-expressing cancer will exhibit a beneficial response to an EGFR inhibitor therapy.
- the methods generally involve determining a normalized expression level of a gene or gene product that correlates with EGFR inhibitor responsiveness. Genes that correlate with EGFR inhibitor responsiveness are referred to herein as "response indicator genes.”
- a normalized level of one or more response indicator genes can be determined.
- KRAS mutations Mutations in a k-ras gene that result in constitutive activation of the k-ras-encoded protein are referred to herein as "KRAS mutations" or "activating KRAS mutations.” Detection of activating KRAS mutations can be carried out in conjunction with determination of normalized levels of one or more response indicator genes.
- the present disclosure provides methods to predict the likelihood that a patient will exhibit a beneficial response to treatment with an EGFR inhibitor, where the method involves: a) detecting a KRAS mutation in a tumour sample obtained from the patient; and b) determining a normalized level of a response indicator gene(s).
- a level of a response indicator gene, or its gene product, in a tumour sample from a patient is assayed.
- the level of the response indicator gene, or its gene product is then "normalized,” generating a normalized expression level.
- a number of response indicator genes were identified.
- the normalized expression levels of these response indicator genes correlate, positively or negatively, with beneficial patient response to EGFR inhibitor treatment.
- normalized expression levels of one or more of these response indicator genes can be determined to assess the likelihood that a patient having an EGFR-expressing cancer will exhibit a beneficial response to an EGFR inhibitor therapy.
- Response indicator genes are identified as described in detail below and in the Examples.
- Response indicator genes of the present disclosure include: ATP5E, TITF1, CLTC, BRCA1, AREG, PTP4A3, EREG, VAV3, SATB2, CEACAM6, EGFR, CHN2, FGFR3, C13orf18, QPRT, AMACR1, CKMT2, ID1, SORBS1, SLC26A3, and ErbB3, and one or more of these may be measured in order to assess the likelihood of beneficial response.
- Normalized expression levels of each of these genes are positively correlated with beneficial response to EGFR inhibitor treatment. In other words, normalized expression levels of these genes positively correlate with likelihood that a patient will exhibit a beneficial response to EGFR inhibitor treatment.
- Response indicator genes of the present disclosure include: DUSP6, VDAC2, ANXA2P2, SERPINB1, NT5E, GPC3, DUSP4, PHLDA1, K-ras, DR5, VIL2, LAMC2, SFN, ANXA1, EPHA2, P14ARF, CA9, KRT17, p14ARF, Maspin, PLAUR, LAMA3, and GCNT3, and one or more of these may be measured in order to assess the likelihood of beneficial response. Normalized expression levels of each of these genes are negatively correlated with beneficial response to EGFR inhibitor treatment. In other words, normalized expression levels of these genes indicate a decreased likelihood that a patient will exhibit a beneficial response to EGFR inhibitor treatment.
- Response indicator genes of the present disclosure include: EGF, ADAM17, PTP4A3, ADAM15, QPRT, SATB2, RASSF1, VAV3, CEACAM6, EREG, AREG, TITF1, SORBS1, C13orf18, CKMT2, BTC, ATP5E, B.Catenin, CCNE1, EGFR, Bclx, BRCA1, CDC25B, CHN2, ID1, and SLC26A3, and one or more of these may be measured in order to assess the likelihood of beneficial response. Normalized expression levels of each of these genes are positively correlated with beneficial response to EGFR inhibitor treatment. In other words, normalized expression levels of these genes positively correlate with likelihood that a patient will exhibit a beneficial response to EGFR inhibitor treatment. These response indicator genes can be of particular interest in assessment of patients with KRAS-negative tumours.
- Response indicator genes of the present disclosure include: VDAC2, SERPINB1, PHLDA1, ANXA2P2, KRT17, EPHA2, DUSP4, CGA, CA9, Maspin, NEDD8, DUSP6, GPC3, NT5E, VIL2, and P14ARF, and one or more of these may be measured in order to assess the likelihood of beneficial response. Normalized expression levels of each of these genes are negatively correlated with beneficial response to EGFR inhibitor treatment. In other words, normalized expression levels of these genes indicate a decreased likelihood that a patient will exhibit a beneficial response to EGFR inhibitor treatment. These response indicator genes can be of particular interest in assessment of patients with KRAS-negative tumours.
- a number of response indicator genes were identified in multi-patient studies. Normalized levels of these indicator gene products can then be determined in an individual patient who has cancer and for whom treatment with an EGFR inhibitor is being contemplated. Depending on the outcome of the assessment, treatment with an EGFR inhibitor may be indicated, or an alternative treatment regimen may be indicated.
- a tumour sample comprising a response indicator gene is assayed for a level of a response indicator gene or gene product(s).
- the tumour sample can be obtained from a solid tumour, e.g., via biopsy, or from a surgical procedure carried out to remove a tumour; or from a tissue or bodily fluid that contains cancer cells.
- An expression level of a response indicator gene is normalized relative to the level of an expression product of a reference gene(s). Assessing the response likelihood is conducted by comparing the normalized expression level to a range of values of normalized expression levels of one or more reference genes in an EGFR-expressing cancer cell.
- Normalized expression level of one or more response indicator genes can be carried out to assess the likelihood that a patient will respond to EGFR inhibitor treatment.
- this disclosure provides that the normalized expression level of a single or multiple response indicator genes can be used to assess the likelihood that a patient will respond to EGFR inhibitor treatment.
- the analysis can be more stringent, e.g., the likelihood that a patient will exhibit a beneficial response to an EGFR inhibitor treatment by exhibiting a partial response or a complete response can be assessed.
- the analysis can be less stringent, e.g., the likelihood that a patient will exhibit a beneficial response to an EGFR inhibitor treatment by exhibiting disease control (DC) can be assessed.
- DC disease control
- assessment of likelihood of beneficial response to EGFR inhibitor therapy can be conducted by determining normalized expression levels of a set of response indicator genes, i.e. two or more response indicator genes (e.g., 2, 3, 4, 5, 6, 7, 8, 9, 10, or more response indicator genes), or any combination of one or more sets of response indicator genes.
- the assessment can involve analysing expression levels of a combination of response indicator genes, and determining normalized expression levels of the combination of response indicator genes, where the response indicator gene products can include gene products that are positively correlated with clinical benefit and gene products that are negatively correlated with clinical benefit.
- a normalized level of a first gene that positively correlates with beneficial response to EGFR inhibitor treatment can be determined.
- response indicator genes whose normalized levels can be used in combination, either alone or in combination with other multi-gene response indicator sets, to assess the likelihood of response to EGFR inhibitor treatment:
- Exemplary multi-gene sets including two genes: set 1: PHLDA1; PTP4A3; set 2: PHLDA1; AREG; set 3: PHLDA1; EREG set 4: CHN2; PTP4A3; set 5: PTP4A3; SATB2; set 6: EPHA2; AREG; set 7: EPHA2; EREG; set 8: EREG; PTP4A3 set 9: PTP4A3; SLC26A3; set 10: EREG; AREG; set 11: DUSP6; AREG; set 12: DUSP6; EREG; set 13: EGFR; EREG; set 14: SLC26A3; EREG; and set 15: SFN; EREG.
- Exemplary multi-gene sets including three genes: set 16: PHLDA1; PTP4A3; AREG; set 17: EGFR; PHLDA1; PTP4A3; set 18: PHLDA1; PTP4A3; SATB2; set 19: AREG; PHLDA1; PTP4A3; set 20: EGFR; PHLDA1; AREG; set 21: EREG; KRT17; PHLDA1; set 22: EREG; PHLDA1; PTP4A3; set 23: EREG; PHLDA1; SATB2; set 24: EREG; PHLDA1; SORBS1; set 25: KRT17; PHLDA1; AREG; set 26: PHLDA1; SATB2; AREG; set 27: AREG; CEACAM6; PHLDA1; set 28: AREG; EGFR; PHLDA1; set 29: DUSP6; PTP4A3; SORBS1; set 30:
- Exemplary multi-gene sets including four genes: set 36: EREG; KRT17; PHLDA1; SORBS1; set 37: AREG; KRT17; PHLDA1; PTP4A3; set 38: EREG; KRT17; PHLDA1; PTP4A3; set 39: AREG; PHLDA1; PTP4A3; SATB2; set 40: EREG; PHLDA1; PTP4A3; SATB2; set 41: AREG; PHLDA1; PTP4A3; SORBS1; set 42: EREG; PHLDA1; PTP4A3; SORBS1; set 43: AREG; EGFR; PHLDA1; PTP4A3; set 44: KRT17; PHLDA1; SORBS1; AREG; set 45: KRT17; PHLDA1; SORBS1; EREG; set 46: CEACAM6; PHLDA1; PTP4A3; AREG; set
- exemplary multi-gene sets are shown in the Tables 3 and 4. Those skilled in the art will appreciate that normalized levels of any combination of two or more response indicator genes (e.g., two or more response indicator genes as listed in Tables 1A, 1 B, 2A, 2B, 6A, 6B, 7A, and 7B) can be determined. It should be noted that, for any of the above-listed exemplary multi-gene sets that include AREG or EREG, AREG or EREG can be substituted with the average of the normalized AREG value and the normalized EREG value.
- multi-gene sets include the following sets (e.g., multi-gene sets 65-167) that include two or more genes. These exemplary multi-gene sets find particular use when KRAS mutation status of the subject is taken into account.
- Exemplary multi-gene sets including two genes: set 65: PHLDA1; PTP4A3; set 66: KRT17; PTP4A3; set 67: EREG; PHLDA1; set 68: AREG; PHLDA1; set 69: EREG; KRT17; set 70: AREG; KRT17; set 71: KRT17; SERPINB1; set 72: CEACAM6; PTP4A3; set 73: EREG; PTP4A3; set 74: KRT17; SORBS1; set 75: PHLDA1; SORBS1; set 76: SATB2; SERPINB1; set 77: aregereg; PHLDA1; set 78: SLC26A3; AREG; set 79: SLC26A3; EREG; set 80: DUSP6; AREG; set 81: DUSP6; EREG; set 81: VIL2; AREG; set 82: V
- multi-gene sets include the following sets that include three genes: set 90: DUSP6; EREG; SLC26A3; set 91: DUSP6; SLC26A3; EREG; set 92: DUSP6; SLC26A3; AREG; set 93: CA9; EREG; NT5E; set 94: CLTC; DUSP6; AREG; set 95: CLTC; DUSP6; EREG; set 96: DR5; SLC26A3; AREG; set 97: DR5; SCL26A3; EREG; set 98: DUSP6; VIL2; AREG; set 99: DUSP6; VIL2; EREG; set 100: EPHA2; EREG; SLC26A3; set 101: EREG; SLC26A3; VIL2; set 102: KIRT17; SLC26A3; EREG; set 103: KIRT17; SLC26A
- multi-gene sets include the following sets that include four genes: set 122: EREG; KRT17; PHDLA1; SORBS1; set 123: AREG; KRT17; PHLDA1; PTP4A3; set 124: DUSP6; EREG; KRT17; SORBS1; set 125: AREG; KRT17; PHLDA1; PTP4A3; set 126: AREG; KRT17; PHLDA1; PTP4A3; set 127: AREG; PHLDA1; PTP4A3; SORBS1; set 128: AREG; EGFR; EPHA2; PHLDA1; set 129: AREG; CEACAM6; KRT17; SORBS1; set 130: AREG; CEACAM6; KRT17; SORBS1; set 131: AREG; EGFR; KRT17; PHLDA1; set 132: AREG; KRT17; PHLDA1
- Further exemplary multi-gene sets include the following sets that include five genes: set 154: AREG; EGFR; KRT17; PHLDA1; PTP4A3; set 155: AREG; KRT17; PHLDA1; PTP4A3; SORBS1; set 156: AREG; CEACAM6; KRT17; PHLDA1; SORBS1; set 157: EREG; CEACAM6; KRT17; PHLDA1; SORBS1; set 158: AREG; EGFR; KRT17; PHLDA1; PTP4A3; set 159: EREG; EGFR; KRT17; PHLDA1; PTP4A3; set 160: CEACAM6; KRT17; PHLDA1; PTP4A3; SORBS1 set 161: EREG; KRT17; HLDA1; PLAUR; SORBS1. set 162: DUSP6; EREG; QPRT; SLC26A3;
- Exemplary multi-gene sets including six genes: set 163: AREG; EPHA2; KRT17; LAMC2; PHLDA1; PTP4A3.
- Exemplary multi-gene sets including seven genes: set 164: ANXA1; BRCA1; CHN2; PHLDA1; PTP4A3; SORBS1; AREG; set 165: ANXA1; BRCA1; CHN2; PHLDA1; PTP4A3; SORBS1; EREG; set 166: CEACAM6; KRT17; LAMA3; PHLDA1; PTP4A3; SORBS1; AREG; and set 167: CEACAM6; KRT17; LAMA3; PHLDA1; PTP4A3; SORBS1; EREG.
- the above-listed multi-gene sets are particularly useful in combination with KRAS status, e.g., where the individual is negative for an activating KRAS mutation.
- the above-listed multi-gene sets are meant to be exemplary only. Those skilled in the art will appreciate that normalized levels of any combination of two or more response indicator genes (e.g., two or more response indicator genes as listed in Tables 1A, 1 B, 2A, 2B, 6A, 6B, 7A, and 7B) can be determined. Exemplary multi-gene sets are shown in the Tables 8 and 9. It should be noted that, for any of the above-listed exemplary multi-gene sets that include AREG or EREG, AREG or EREG can be substituted with the average of the normalized AREG value and the normalized EREG value.
- the presence of an activating mutation in a k-ras gene indicates reduced likelihood of a clinically beneficial response to an EGFR inhibitor.
- the presence or absence of an activating KRAS mutation can be assayed in conjunction with assaying an expression level of a response indicator gene, or its gene product, and determining a normalized expression level of a response indicator gene.
- the present disclosure provides methods for assessing the likelihood that a patient will exhibit a beneficial response to EGFR inhibitor treatment, where the method generally involves: a) determining a normalized level of a response indicator gene, or its gene product, in a sample obtained from a tumour sample from the patient; and b) detecting the presence or absence of an activating KRAS mutation.
- the method will in some cases include a step of assigning a probability of response based on the determined normalized expression level(s) of the one or more response indicator genes.
- a subject method can involve: a) determining a normalized expression level of one or more response indicator genes in a sample obtained from cancer cells of a patient; b) determining a KRAS mutation status in a cancer cell from the patient; and, optionally, c) assigning a probability of response based on the determined normalized expression level(s) of the one or more response indicator genes.
- Detection of an activating KRAS mutation can be carried out in conjunction with determining a normalized level of a response indicator gene, or its gene product, where "in conjunction with” includes in the same or different sample, and at the same time or at a different time and/or location.
- a sample e.g., a sample comprising a polynucleotide obtained from a patient's cancer cell; or a sample comprising a patient's cancer cell
- a level of a response indicator gene, or its gene product can be detected in the same sample at substantially the same time and in the same location (e.g., in the same laboratory).
- the presence or absence of an activating KRAS mutation can be detected in a sample (e.g., a sample comprising a polynucleotide obtained from a patient's cancer cell; or a sample comprising a patient's cancer cell); and a level of a response indicator gene, or its gene product, can be detected in the same sample at substantially the same time and in different locations (e.g., in different laboratories).
- a sample e.g., a sample comprising a polynucleotide obtained from a patient's cancer cell; or a sample comprising a patient's cancer cell
- a level of a response indicator gene, or its gene product can be detected in the same sample at substantially the same time and in different locations (e.g., in different laboratories).
- the presence or absence of an activating KRAS mutation can be detected in a first sample (e.g., a sample comprising a polynucleotide obtained from a patient's cancer cell) at a first time; and a level of a response indicator gene, or its gene product, can be detected in a second sample (e.g., a sample comprising a polynucleotide obtained from a patient's cancer cell; or a sample comprising a patient's cancer cell) at a second time, where the first and second samples are assayed in the same location.
- a first sample e.g., a sample comprising a polynucleotide obtained from a patient's cancer cell
- a second sample e.g., a sample comprising a polynucleotide obtained from a patient's cancer cell; or a sample comprising a patient's cancer cell
- the presence or absence of an activating KRAS mutation can be detected in a first sample (e.g., a sample comprising a polynucleotide obtained from a patient's cancer cell) at a first time; and a level of a response indicator gene, or its gene product, can be detected in a second sample (e.g., a sample comprising a polynucleotide obtained from a patient's cancer cell; or a sample comprising a patient's cancer cell) at a second time, where the first and second samples are assayed in different locations.
- a first sample e.g., a sample comprising a polynucleotide obtained from a patient's cancer cell
- a second sample e.g., a sample comprising a polynucleotide obtained from a patient's cancer cell; or a sample comprising a patient's cancer cell
- a "KRAS-positive” cancer cell is one that comprises an activating mutation in a k-ras gene; and a "KRAS-positive” patient is one who has a KRAS-positive cancer cell.
- a "KRAS-negative” cancer cell is one that does not comprise an activation mutation in a k-ras gene.
- a "KRAS-negative" tumour is one in which no activating KRAS mutations are detectable.
- a "KRAS-negative" patient is one who has a KRAS-negative tumour.
- Detection of a KRAS mutation in a tumour sample from the patient or in a sample obtained from a cancer cell from the patient involves detecting a KRAS mutation in a nucleic acid of a cancer cell present in the patient. It is possible, but not necessary, that all cancer cells in the patient comprise a KRAS mutation, e.g., a tumour can be heterogeneous with respect to KRAS mutation status.
- the KRAS mutation may be present in less than 100%, less than 95%, less than 80%, less than 70%, less than 50%, or less than 25%, of the cancer cells present in the sample and/or in the patient. The presence of an activating KRAS mutation in any proportion of the cancer cells in the sample will indicate that the patient is not likely to respond to EGFR inhibitor treatment.
- activating KRAS mutations are found in, e.g., WO 2006/086777 and WO 2007/001868 .
- activating KRAS mutations include: 1) a G ⁇ T mutation at position 216 of a k-ras nucleotide sequence (e.g., the nucleotide sequence set forth in GenBank Accession No. NM_033360.2); 2) a G ⁇ A mutation at position 216 of a k-ras nucleotide sequence; 3) a G ⁇ C mutation at position 216 of a k-ras nucleotide sequence; 4) a G ⁇ T mutation at position 215 of a k-ras nucleotide sequence; 5) a G ⁇ A mutation at position 215 of a k-ras nucleotide sequence; 6) a G ⁇ C mutation at position 215 of a k-ras nucleotide sequence; and 7) a G ⁇ A mutation at position 219 of a k-ras nucleotide sequence.
- An example of a KRAS-negative tumour is one that does not include
- detecting the presence or absence of an activating KRAS mutation can be carried out in combination with assessing a normalized level of a single response indicator gene product, or one or more response gene products, or one or more sets of response indicator gene products.
- the following are non-limiting examples of possible combinations: 1) KRAS mutation status; PHLDA1 normalized expression level detection; 2) KRAS mutation status; KRT17 normalized expression level detection; 3) KRAS mutation status; SERPINB1 normalized expression level detection; 4) KRAS mutation status; DUSP4 normalized expression level detection; 5) KRAS mutation status; ANXA2P2 normalized expression level detection; 6) KRAS mutation status; EPHA2 normalized expression level detection; 7) KRAS mutation status; PTP4A3 normalized expression level detection; 8) KRAS mutation status; EREG normalized expression level detection; 9) KRAS mutation status; AREG normalized expression level detection; 10) KRAS mutation status; QPRT normalized expression level detection; 11) KRAS mutation status
- detecting the presence or absence of an activating KRAS mutation can be carried out in combination with assaying a normalized level of multiple (e.g., two, three, four, five, six, seven, or more) response indicator gene products.
- a normalized level of multiple e.g., two, three, four, five, six, seven, or more
- Detection of an activating KRAS mutation can be carried out using any of a variety of methods. Numerous methods are known in the art for detection of sequence variations (polymorphisms and mutations) in nucleic acid samples, and can be used for detecting an activating KRAS mutation. Such methods include methods based on de novo sequencing of nucleic acids as well as methods designed to detect sequence variants (e.g., known variants) at a targeted position in the nucleic acid sequence. Sequence variants are detected using as probes or primers oligonucleotides that hybridize differentially to each variant. Many approaches have been developed to increase the selectivity of hybridization of sequence specific probes to targeted variants; the extent of hybridization is of the sequence specific probes is often detected based on detecting and/or quantifying the amount of product formed in a subsequent polymerase chain reaction.
- the present disclosure provides methods for determining whether an EGFR-expressing cancer is an EGFR inhibitor-responsive or EGFR inhibitor-non-responsive cancer.
- the methods generally involves: a) assaying a test sample obtained from an EGFR-expressing tumour sample of the patient and determining a normalized expression level of: i) a response indicator gene, or its gene product, that correlates positively with EGFR inhibitor responsiveness, wherein the positively correlating response indicator gene is one or more of ATP5E, TITF1, CLTC, BRCA1, AREG, PTP4A3, EREG, VAV3, SATB2, CEACAM6, EGFR, CHN2, FGFR3, C13orf18, QPRT, AMACR1, CKMT2, ID1, SORBS1, SLC26A3, and ErbB3; and/or ii) a response indicator gene, or its gene product, that correlates negatively with EGFR inhibitor responsiveness, wherein the negatively correlating response indicator is one or more of DUSP6, VDAC2, ANX
- the methods of the present disclosure are particularly useful when the EGFR-expressing cancer is a KRAS-negative cancer.
- the methods generally involve: a) assaying a test sample obtained from an EGFR-expressing tumour sample from the patient and determining a normalized expression level of: i) a response indicator gene, or its gene product, that correlates positively with EGFR inhibitor responsiveness, wherein the positively correlating response indicator gene is a product of one or more of EGF, ADAM17, PTP4A3, ADAM15, QPRT, SATB2, RASSF1, VAV3, CEACAM6, EREG, AREG, TITF1, SORBS1, C13orf18, CKMT2, BTC, ATP5E, beta-Catenin (also referred to herein as "B.Catenin”), CCNE1, EGFR, Bclx, BRCA1, CDC25B, CHN2, ID1, and SLC26A3; and/or ii) a response indicator gene, or its gene product, that correlate
- the method can involve determining a normalized expression level of a set of response indicator genes, where exemplary sets are described above. Also as described above, the method can also include determining the presence or the absence of an activating KRAS mutation in nucleic acid obtained from a EGFR-expressing tumour sample.
- Methods of gene expression profiling include methods based on hybridization analysis of polynucleotides, methods based on sequencing of polynucleotides, and proteomics- based methods.
- Exemplary methods known in the art for the quantification of mRNA expression in a sample include northern blotting and in situ hybridization ( Parker & Barnes, Methods in Molecular Biology 106:247-283 (1999 )); RNAse protection assays ( Hod, Biotechniques 13:852-854 (1992 )); and PCR-based methods, such as reverse transcription PCT (RT-PCR) ( Weis et al., Trends in Genetics 8:263-264 (1992 )).
- Antibodies may be employed that can recognize sequence-specific duplexes, including DNA duplexes, RNA duplexes, and DNA-RNA hybrid duplexes or DNA-protein duplexes.
- Representative methods for sequencing-based gene expression analysis include Serial Analysis of Gene Expression (SAGE), and gene expression analysis by massively parallel signature sequencing (MPSS).
- RT-PCR Reverse Transcriptase PCR
- mRNA is isolated from a test sample.
- the starting material is typically total RNA isolated from a human tumour, usually from a primary tumour.
- normal tissues from the same patient can be used as an internal control.
- mRNA can be extracted from a tissue sample, e.g., from a sample that is fresh, frozen (e.g. fresh frozen), or paraffin-embedded and fixed (e.g. formalin-fixed).
- RNA isolation can be performed using a purification kit, buffer set and protease from commercial manufacturers, such as Qiagen, according to the manufacturer's instructions. For example, total RNA from cells in culture can be isolated using Qiagen RNeasy mini-columns.
- RNA isolation kits include MasterPureTM Complete DNA and RNA Purification Kit (EPICENTRE®, Madison, WI), and Paraffin Block RNA Isolation Kit (Ambion, Inc.). Total RNA from tissue samples can be isolated using RNA Stat-60 (Tel-Test). RNA prepared from tumour can be isolated, for example, by cesium chloride density gradient centrifugation.
- the sample containing the RNA is then subjected to reverse transcription to produce cDNA from the RNA template, followed by exponential amplification in a PCR reaction.
- the two most commonly used reverse transcriptase enzymes are avilo myeloblastosis virus reverse transcriptase (AMV-RT) and Moloney murine leukemia virus reverse transcriptase (MMLV-RT).
- AMV-RT avilo myeloblastosis virus reverse transcriptase
- MMLV-RT Moloney murine leukemia virus reverse transcriptase
- the reverse transcription step is typically primed using specific primers, random hexamers, or oligo-dT primers, depending on the circumstances and the goal of expression profiling.
- extracted RNA can be reverse-transcribed using a GeneAmp RNA PCR kit (Perkin Elmer, CA, USA), following the manufacturer's instructions.
- the derived cDNA can then be used as a template in the subsequent PCR reaction.
- PCR-based methods use a thermostable DNA-dependent DNA polymerase, such as a Taq DNA polymerase.
- TaqMan® PCR typically utilizes the 5'-nuclease activity of Taq or Tth polymerase to hydrolyse a hybridization probe bound to its target amplicon, but any enzyme with equivalent 5' nuclease activity can be used.
- Two oligonucleotide primers are used to generate an amplicon typical of a PCR reaction product.
- a third oligonucleotide, or probe can be designed to facilitate detection of a nucleotide sequence of the amplicon located between the hybridization sites the two PCR primers.
- the probe can be detectably labeled, e.g., with a reporter dye, and can further be provided with both a fluorescent dye, and a quencher fluorescent dye, as in a Taqman® probe configuration.
- a Taqman® probe is used, during the amplification reaction, the Taq DNA polymerase enzyme cleaves the probe in a template-dependent manner. The resultant probe fragments disassociate in solution, and signal from the released reporter dye is free from the quenching effect of the second fluorophore.
- One molecule of reporter dye is liberated for each new molecule synthesized, and detection of the unquenched reporter dye provides the basis for quantitative interpretation of the data.
- TaqMan® RT-PCR can be performed using commercially available equipment, such as, for example, ABI PRISM 7700TM Sequence Detection SystemTM (Perkin-Elmer-Applied Biosystems, Foster City, CA, USA), or Lightcycler (Roche Molecular Biochemicals, Mannheim, Germany).
- the 5' nuclease procedure is run on a real-time quantitative PCR device such as the ABI PRISM 7700TM Sequence Detection SystemTM.
- the system consists of a thermocycler, laser, charge-coupled device (CCD), camera and computer.
- the system amplifies samples in a 96-well format on a thermocycler.
- laser-induced fluorescent signal is collected in real-time through fiber optics cables for all 96 wells, and detected at the CCD.
- the system includes software for running the instrument and for analysing the data.
- 5'-Nuclease assay data are initially expressed as a threshold cycle ("C t "). Fluorescence values are recorded during every cycle and represent the amount of product amplified to that point in the amplification reaction.
- the threshold cycle (C t ) is generally described as the point when the fluorescent signal is first recorded as statistically significant.
- RT-PCR is usually performed using an internal standard.
- the ideal internal standard gene (also referred to as a reference gene) is expressed at a constant level among cancerous and non-cancerous tissue of the same origin (i.e., a level that is not significantly different among normal and cancerous tissues), and is not significantly unaffected by the experimental treatment (i.e., does not exhibit a significant difference in expression level in the relevant tissue as a result of exposure to chemotherapy).
- reference genes useful in the methods disclosed herein should not exhibit significantly different expression levels in cancerous colon as compared to normal colon tissue.
- RNAs most frequently used to normalize patterns of gene expression are mRNAs for the housekeeping genes glyceraldehyde-3-phosphate-dehydrogenase (GAPDH) and ⁇ -actin.
- exemplary reference genes used for normalization comprise one or more of the following genes: ATP5E, GPX1, PGK1, UBB, and VDAC2.
- Gene expression measurements can be normalized relative to the mean of one or more (e.g., 2, 3, 4, 5, or more) reference genes.
- Reference-normalized expression measurements can range from 0 to 15, where a one unit increase generally reflects a 2-fold increase in RNA quantity.
- Real time PCR is compatible both with quantitative competitive PCR, where internal competitor for each target sequence is used for normalization, and with quantitative comparative PCR using a normalization gene contained within the sample, or a housekeeping gene for RT-PCR.
- quantitative competitive PCR where internal competitor for each target sequence is used for normalization
- quantitative comparative PCR using a normalization gene contained within the sample, or a housekeeping gene for RT-PCR.
- RNA isolation, purification, primer extension and amplification can be preformed according to methods available in the art. (see, e.g., Godfrey et al. J. Molec. Diagnostics 2: 84-91 (2000 ); Specht et al., Am. J. Pathol. 158: 419-29 (2001 )). Briefly, a representative process starts with cutting about 10 ⁇ m thick sections of paraffin-embedded tumour tissue samples. The RNA is then extracted, and protein and DNA depleted from the RNA-containing sample. After analysis of the RNA concentration, RNA is reverse transcribed using gene specific primers followed by RT-PCR to provide for cDNA amplification products..
- PCR primers and probes can be designed based upon exon or intron sequences present in the mRNA transcript of the gene of interest.
- Primer/probe design can be performed using publicly available software, such as the DNA BLAT software developed by Kent, W.J., Genome Res. 12(4):656-64 (2002 ), or by the BLAST software including its variations.
- repetitive sequences of the target sequence can be masked to mitigate non-specific signals.
- exemplary tools to accomplish this include the Repeat Masker program available on-line through the Baylor College of Medicine, which screens DNA sequences against a library of repetitive elements and returns a query sequence in which the repetitive elements are masked.
- the masked intron sequences can then be used to design primer and probe sequences using any commercially or otherwise publicly available primer/probe design packages, such as Primer Express (Applied Biosystems); MGB assay-by-design (Applied Biosystems); Primer3 ( Steve Rozen and Helen J. Skaletsky (2000) Primer3 on the WWW for general users and for biologist programmers.
- Primer Express Applied Biosystems
- MGB assay-by-design Applied Biosystems
- Primer3 Steve Rozen and Helen J. Skaletsky (2000) Primer3 on the WWW for general users and for biologist programmers.
- PCR primer design Other factors that can influence PCR primer design include primer length, melting temperature (Tm), and G/C content, specificity, complementary primer sequences, and 3'-end sequence.
- optimal PCR primers are generally 17-30 bases in length, and contain about 20-80%, such as, for example, about 50-60% G+C bases, and exhibit Tm's between 50 and 80 °C, e.g. about 50 to 70 °C.
- Tables A and B provide further information concerning the primer, probe, and amplicon sequences associated with the Examples disclosed herein.
- the obtained cDNA is spiked with a synthetic DNA molecule (competitor), which matches the targeted cDNA region in all positions, except a single base, and serves as an internal standard.
- the cDNA/competitor mixture is PCR amplified and is subjected to a post-PCR shrimp alkaline phosphatase (SAP) enzyme treatment, which results in the dephosphorylation of the remaining nucleotides.
- SAP post-PCR shrimp alkaline phosphatase
- the PCR products from the competitor and cDNA are subjected to primer extension, which generates distinct mass signals for the competitor- and cDNA-derived PCR products. After purification, these products are dispensed on a chip array, which is pre-loaded with components needed for analysis with matrix-assisted laser desorption ionization time-of-flight mass spectrometry (MALDI-TOF MS) analysis.
- MALDI-TOF MS matrix-assisted laser desorption ionization time-of-flight mass spectrometry
- the cDNA present in the reaction is then quantified by analysing the ratios of the peak areas in the mass spectrum generated. For further details see, e.g. Ding and Cantor, Proc. Natl. Acad. Sci. USA 100:3059-3064 (2003 ).
- PCR-based techniques that can find use in the methods disclosed herein include, for example, BeadArray® technology (Illumina, San Diego, CA; Oliphant et al., Discovery of Markers for Disease (Supplement to Biotechniques), June 2002 ; Ferguson et al., Analytical Chemistry 72:5618 (2000 )); BeadsArray for Detection of Gene Expression® (BADGE), using the commercially available Luminex 100 LabMAP® system and multiple color-coded microspheres (Luminex Corp., Austin, TX) in a rapid assay for gene expression ( Yang et al., Genome Res. 11:1888-1898 (2001 )); and high coverage expression profiling (HiCEP) analysis ( Fukumura et al., Nucl. Acids. Res. 31 (16) e94 (2003 ).
- BeadArray® technology Illumina, San Diego, CA; Oliphant et al., Discovery of Markers for Disease (Supplement to Biotechniques),
- Expression levels of a gene of interest can also be assessed using the microarray technique.
- polynucleotide sequences of interest including cDNAs and oligonucleotides
- the arrayed sequences are then contacted under conditions suitable for specific hybridization with detectably labeled cDNA generated from mRNA of a test sample.
- the source of mRNA typically is total RNA isolated from a tumour sample, and optionally from normal tissue of the same patient as an internal control or cell lines.
- mRNA can be extracted, for example, from frozen or archived paraffin-embedded and fixed (e.g. formalin-fixed) tissue samples.
- PCR amplified inserts of cDNA clones of a gene to be assayed are applied to a substrate in a dense array. Usually at least 10,000 nucleotide sequences are applied to the substrate.
- the microarrayed genes, immobilized on the microchip at 10,000 elements each are suitable for hybridization under stringent conditions. Fluorescently labeled cDNA probes may be generated through incorporation of fluorescent nucleotides by reverse transcription of RNA extracted from tissues of interest. Labeled cDNA probes applied to the chip hybridize with specificity to each spot of DNA on the array.
- the chip After washing under stringent conditions to remove non-specifically bound probes, the chip is scanned by confocal laser microscopy or by another detection method, such as a CCD camera. Quantitation of hybridization of each arrayed element allows for assessment of corresponding mRNA abundance.
- Serial analysis of gene expression is a method that allows the simultaneous and quantitative analysis of a large number of gene transcripts, without the need of providing an individual hybridization probe for each transcript.
- a short sequence tag (about 10-14 bp) is generated that contains sufficient information to uniquely identify a transcript, provided that the tag is obtained from a unique position within each transcript.
- many transcripts are linked together to form long serial molecules, that can be sequenced, revealing the identity of the multiple tags simultaneously.
- the expression pattern of any population of transcripts can be quantitatively evaluated by determining the abundance of individual tags, and identifying the gene corresponding to each tag. For more details see, e.g. Velculescu et al., Science 270:484-487 (1995 ); and Velculescu et al., Cell 88:243-51 (1997 ).
- Nucleic acid sequencing technologies are suitable methods for analysis of gene expression.
- the principle underlying these methods is that the number of times a cDNA sequence is detected in a sample is directly related to the relative expression of the mRNA corresponding to that sequence.
- DGE Digital Gene Expression
- Early methods applying this principle were Serial Analysis of Gene Expression (SAGE) and Massively Parallel Signature Sequencing (MPSS). See, e.g., S. Brenner, et al., Nature Biotechnology 18(6):630-634 (2000 ). More recently, the advent of "next-generation" sequencing technologies has made DGE simpler, higher throughput, and more affordable.
- RNA for expression analysis from blood, plasma and serum See for example, Tsui NB et al. (2002) 48,1647-53 and references cited therein
- urine See for example, Boom R et al. (1990) J Clin Microbiol. 28, 495-503 and reference cited therein) have been described.
- Immunochemical (also referred to herein as "immunological") methods are also suitable for detecting the expression levels of genes and applied to the method disclosed herein.
- Antibodies e.g., monoclonal antibodies
- the antibodies can be detected by direct labeling of the antibodies themselves, for example, with radioactive labels, fluorescent labels, haptene labels such as, biotin, or an enzyme such as horse radish peroxidase or alkaline phosphatase.
- unlabeled primary antibody can be used in conjunction with a labeled secondary antibody specific for the primary antibody.
- Immunochemical protocols and kits are well known in the art and are commercially available.
- Exemplary suitable immunochemical methods include enzyme-linked immunosorbent assays, radioimmunoassays, protein blot methods (also referred to as "Western” blot methods), and enzyme immunoassays.
- proteome is defined as the totality of the proteins present in a sample (e.g. tissue, organism, or cell culture) at a certain point of time.
- Proteomics includes, among other things, study of the global changes of protein expression in a sample (also referred to as "expression proteomics").
- Proteomics typically includes the following steps: (1) separation of individual proteins in a sample by 2-D gel electrophoresis (2-D PAGE); (2) identification of the individual proteins recovered from the gel, e.g. my mass spectrometry or N- terminal sequencing, and (3) analysis of the data using bioinformatics.
- RNA isolation, purification, primer extension and amplification are provided in various published journal articles.
- mRNA isolation, purification, primer extension and amplification are provided in various published journal articles.
- a representative process starts with cutting a tissue sample section (e.g. about 10 ⁇ m thick sections of a paraffin-embedded tumour tissue sample).
- RNA is then extracted, and protein and DNA are removed. After analysis of the RNA concentration, RNA repair is performed if desired.
- the sample can then be subjected to analysis, e.g., by reverse transcribed using gene specific promoters followed by RT-PCR.
- the expression level of a response indicator gene is normalized, thereby providing a normalized value.
- the expression level of a response indicator gene may be normalized relative to the level of an expression product of a reference gene(s).
- the expression level of a response indicator gene can be normalized relative to the mean level of gene products of one or more reference genes.
- the expression level of a response indicator gene can be normalized relative to the mean level of gene products of all assayed genes, or a subset of the assayed genes, where a subset of the assayed genes can include 1, 2, 3, 4, 5, 6, 7, 8, 9, or more assayed genes.
- the expression level of a response indicator gene can be normalized relative to the mean level of the gene products of all of the genes, or a subset of the gene, listed in one or more of Table 1A, Table 1 B, Table 2A, Table 2B, Table 6A, Table 6B, Table 7A, and Table 7B.
- the expression level of a response indicator gene can be normalized to the mean expression level of the following reference genes: ATP5E, PGK1, UBB, VDAC2, and GPX1.
- reference genes ATP5E, PGK1, UBB, VDAC2, and GPX1.
- GPDH glyceraldehyde-3-phosphate dehydrogenase
- GPDH glyceraldehyde-3-phosphate dehydrogenase
- phosphoglycerate kinase 1 see, e.g., GenBank Accession No. NM_000291
- lactate dehydrogenase A see, e.g., GenBank Accession No. NM_005566
- ribosomal protein L32 see, e.g., GenBank Accession No. NM_000994
- ribosomal protein S18 see, e.g., GenBank Accession No.
- TUBB tubulin, beta polypeptide
- beta actin see, e.g., GenBank Accession No. NM_001101. See, e.g., Eisenberg and Levanon (2003) Trends in Genetics 19:362 , for a list of additional suitable reference genes.
- the level of an RNA transcript as measured by TaqMan® RT-PCR refers to the cycle threshold (C t ) value.
- C t cycle threshold
- the lower the C t the greater the amount of mRNA present in the sample(Relative Quantitation Using Comparative C t ; Getting Started Guide, Applied Biosystems, Inc., Part Number 4364016 Rev. C, 11/2007).
- the expression value of a RNA transcript in a sample is normalized, e.g., by first determining the mean expression value in Ct of designated reference genes in a sample (C tRef ).
- the normalized expression value for a gene (C tGene ) is then calculated as C tGene -C tRef .
- the normalized expression values for all genes can be adjusted, e.g., so that all adjusted normalized Ct have a value >0.
- a normalized level of a response indicator gene, or its gene product, determined for an individual patient can be compared to normalized expression level values for said response indicator gene determined in a population of patients for which the clinical outcome is already known in order to determine an individual patient's probability of beneficial response to EGFR inhibitor therapy.
- Normalized expression level values e.g., expressed as C t
- a normalized level of a response indicator gene, or its gene product can be compared graphically as shown in Figures 3A-10D, to determine the probability of beneficial response to EGFR inhibitor therapy.
- the likelihood that a patient will exhibit a beneficial response to an EGFR inhibitor is assessed by determining a normalized expression level of a response indicator gene or set response indicator genes.
- the patient's likelihood of response to EGFR inhibitor treatment is provided in a report.
- the report may further include information regarding the patient's likelihood of response.
- a subject method can further include a step of generating or outputting a report providing the results of a subject response likelihood assessment, which report can be provided in the form of an electronic medium (e.g., an electronic display on a computer monitor), or in the form of a tangible medium (e.g., a report printed on paper or other tangible medium).
- An assessment as to the likelihood that a patient having an EGFR-expressing cancer will respond to treatment with an EGFR inhibitor is referred to below as a “response likelihood assessment” or, simply, “likelihood assessment.”
- a person or entity who prepares a report (“report generator”) will also perform the likelihood assessment.
- the report generator may also perform one or more of sample gathering, sample processing, and data generation, e.g., the report generator may also perform one or more of: a) sample gathering; b) sample processing; c) measuring a level of an indicator response gene product(s); d) measuring a level of a reference gene product(s); e) detecting the presence or absence of an activating KRAS mutation; and f) determining a normalized level of a response indicator gene, or its gene product,(s).
- an entity other than the report generator can perform one or more sample gathering, sample processing, and data generation.
- the person or entity to whom a report is transmitted may be the same person or entity who does one or more of the following: a) collects a sample; b) processes a sample; c) provides a sample or a processed sample; and d) generates data (e.g., level of a response indicator gene, or its gene product,(s); level of a reference gene product(s); normalized level of a response indicator gene, or its gene product,(s)) for use in the likelihood assessment.
- data e.g., level of a response indicator gene, or its gene product,(s); level of a reference gene product(s); normalized level of a response indicator gene, or its gene product,(s)
- the person(s) or entity(ies) who provides sample collection and/or sample processing and/or data generation, and the person who receives the results and/or report may be different persons, but are both referred to as "users" or "clients” herein to avoid confusion.
- the individual who, after computerized data processing according to the methods of the invention, reviews data output is referred to herein as a "reviewer.”
- the reviewer may be located at a location remote to the user (e.g., at a service provided separate from a healthcare facility where a user may be located).
- a "report,” as described herein, is an electronic or tangible document which includes report elements that provide information of interest relating to a subject likelihood assessment and its results.
- a subject report includes at least a likelihood assessment, e.g., an indication as to the likelihood that a patient having an EGFR-expressing cancer will exhibit a beneficial clinical response to an EGFR inhibitor treatment regimen.
- a subject report can be completely or partially electronically generated.
- a subject report can further include one or more of: 1) information regarding the testing facility; 2) service provider information; 3) patient data; 4) sample data; 5) an interpretive report, which can include various information including: a) indication; b) test data, where test data can include: i) normalized level of one or more response indicator gene products; and/or ii) presence or absence of an activating KRAS mutation recommendations; and 6) other features.
- the report can include information about the testing facility, which information is relevant to the hospital, clinic, or laboratory in which sample gathering and/or data generation was conducted.
- Sample gathering can include obtaining a cancer cell sample from a biopsy, a surgically removed tumour, surgically removed tissue comprising a tumour, or other tissue or bodily fluid from a patient.
- Data generation can include one or more of: a) measuring a level of a gene product(s) (e.g., an indicator response gene product(s), a reference gene product(s)); b) detecting the presence or absence of an activating KRAS mutation; and c) determination of a normalized level of an indicator response gene product.
- This information can include one or more details relating to, for example, the name and location of the testing facility, the identity of the lab technician who conducted the assay and/or who entered the input data, the date and time the assay was conducted and/or analysed, the location where the sample and/or result data is stored, the lot number of the reagents (e.g., kit, etc.) used in the assay, and the like. Report fields with this information can generally be populated using information provided by the user.
- the report can include information about the service provider, which may be located outside the healthcare facility at which the user is located, or within the healthcare facility. Examples of such information can include the name and location of the service provider, the name of the reviewer, and where necessary or desired the name of the individual who conducted sample gathering and/or data generation. Report fields with this information can generally be populated using data entered by the user, which can be selected from among pre-scripted selections (e.g., using a drop-down menu). Other service provider information in the report can include contact information for technical information about the result and/or about the interpretive report.
- the patient data can include patient medical history (which can include, e.g., data about prior treatment for cancer), personal history; administrative patient data (that is, data that are not essential to the likelihood assessment), such as information to identify the patient (e.g., name, patient date of birth (DOB), gender, mailing and/or residence address, medical record number (MRN), room and/or bed number in a healthcare facility), insurance information, and the like), the name of the patient's physician or other health professional who ordered the response likelihood assessment and, if different from the ordering physician, the name of a staff physician who is responsible for the patient's care (e.g., primary care physician). Report fields with this information can generally be populated using data entered by the user.
- patient medical history which can include, e.g., data about prior treatment for cancer), personal history
- administrative patient data that is, data that are not essential to the likelihood assessment
- information to identify the patient e.g., name, patient date of birth (DOB), gender, mailing and/or residence address, medical record number (MRN
- the sample data can provide information about the biological sample analysed in the likelihood assessment, such as the source of biological sample obtained from the patient (e.g., tumour biopsy, surgically removed tumour, unknown, etc.) and the date and time collected. Report fields with this information can generally be populated using data entered by the user, some of which may be provided as pre-scripted selections (e.g., using a drop-down menu).
- the source of biological sample obtained from the patient e.g., tumour biopsy, surgically removed tumour, unknown, etc.
- Report fields with this information can generally be populated using data entered by the user, some of which may be provided as pre-scripted selections (e.g., using a drop-down menu).
- the interpretive report portion of the report includes information generated after processing of the data as described herein.
- the interpretive report can include an indication of the likelihood that the patient will respond to treatment with an EGFR inhibitor.
- the interpretive report can include, for example, Indication (e.g., type of EGFR-expressing cancer, etc.); Result of screen for KRAS mutation (e.g., "Negative for mutations tested”); Result of normalized level of response indicator gene(s) (e.g., "normalized level of response indicator gene(s)”); Interpretation; and, optionally, Recommendation(s).
- the Interpretation portion of the report can include a Recommendation(s).
- the recommendation can include a recommendation that an EGFR inhibitor regimen is indicated.
- the recommendation can include a recommendation for an alternative treatment regimen.
- the report can include all or some of the elements above, with the proviso that the report generally includes at least the elements sufficient to provide the analysis requested by the user (e.g., likelihood assessment).
- the reports can include additional elements or modified elements.
- the report can contain hyperlinks which point to internal or external databases which provide more detailed information about selected elements of the report.
- the patient data element of the report can include a hyperlink to an electronic patient record, or a site for accessing such a patient record, which patient record is maintained in a confidential database. This latter embodiment may be of interest in an in-hospital system or in-clinic setting.
- the methods and systems described herein can be implemented in numerous ways. In one embodiment of particular interest, the methods involve use of a communications infrastructure, for example the internet. Several embodiments of the invention are discussed below. It is also to be understood that the present invention may be implemented in various forms of hardware, software, firmware, processors, or a combination thereof. The methods and systems described herein can be implemented as a combination of hardware and software.
- the software can be implemented as an application program tangibly embodied on a program storage device, or different portions of the software implemented in the user's computing environment (e.g., as an applet) and on the reviewer's computing environment, where the reviewer may be located at a remote site associated (e.g., at a service provider's facility).
- portions of the data processing can be performed in the user-side computing environment.
- the user-side computing environment can be programmed to provide for defined test codes to denote a likelihood "score," where the score is transmitted as processed or partially processed responses to the reviewer's computing environment in the form of test code for subsequent execution of one or more algorithms to provide a results and/or generate a report in the reviewer's computing environment.
- the score can be a numerical score (representative of a numerical value) or a non-numerical score representative of a numerical value or range of numerical values (e.g., "A" representative of a 90-95% likelihood of an outcome).
- the application program for executing the algorithms described herein may be uploaded to, and executed by, a machine comprising any suitable architecture.
- the machine involves a computer platform having hardware such as one or more central processing units (CPU), a random access memory (RAM), and input/output (I/O) interface(s).
- the computer platform also includes an operating system and microinstruction code.
- the various processes and functions described herein may either be part of the microinstruction code or part of the application program (or a combination thereof) which is executed via the operating system.
- various other peripheral devices may be connected to the computer platform such as an additional data storage device and a printing device.
- the system generally includes a processor unit.
- the processor unit operates to receive information, which can include test data (e.g., level of a response gene, level of a reference gene product(s); normalized level of a response gene; and may also include other data such as patient data.
- This information received can be stored at least temporarily in a database, and data analysed to generate a report as described above.
- Part or all of the input and output data can also be sent electronically; certain output data (e.g., reports) can be sent electronically or telephonically (e.g., by facsimile, e.g., using devices such as fax back).
- Exemplary output receiving devices can include a display element, a printer, a facsimile device and the like.
- Electronic forms of transmission and/or display can include email, interactive television, and the like.
- all or a portion of the input data and/or all or a portion of the output data (e.g., usually at least the final report) are maintained on a web server for access, preferably confidential access, with typical browsers. The data may be accessed or sent to health professionals as desired.
- the input and output data, including all or a portion of the final report can be used to populate a patient's medical record which may exist in a confidential database at the healthcare facility.
- a system for use in the methods described herein generally includes at least one computer processor (e.g., where the method is carried out in its entirety at a single site) or at least two networked computer processors (e.g., where data is to be input by a user (also referred to herein as a "client") and transmitted to a remote site to a second computer processor for analysis, where the first and second computer processors are connected by a network, e.g., via an intranet or internet).
- the system can also include a user component(s) for input; and a reviewer component(s) for review of data, generated reports, and manual intervention.
- Additional components of the system can include a server component(s); and a database(s) for storing data (e.g., as in a database of report elements, e.g., interpretive report elements, or a relational database (RDB) which can include data input by the user and data output.
- the computer processors can be processors that are typically found in personal desktop computers (e.g., IBM, Dell, Macintosh), portable computers, mainframes, minicomputers, or other computing devices.
- the networked client/server architecture can be selected as desired, and can be, for example, a classic two or three tier client server model.
- a relational database management system (RDMS), either as part of an application server component or as a separate component (RDB machine) provides the interface to the database.
- RDMS relational database management system
- the architecture is provided as a database-centric client/server architecture, in which the client application generally requests services from the application server which makes requests to the database (or the database server) to populate the report with the various report elements as required, particularly the interpretive report elements, especially the interpretation text and alerts.
- the server(s) e.g., either as part of the application server machine or a separate RDB/relational database machine responds to the client's requests.
- the input client components can be complete, stand-alone personal computers offering a full range of power and features to run applications.
- the client component usually operates under any desired operating system and includes a communication element (e.g., a modem or other hardware for connecting to a network), one or more input devices (e.g., a keyboard, mouse, keypad, or other device used to transfer information or commands), a storage element (e.g., a hard drive or other computer-readable, computer-writable storage medium), and a display element (e.g., a monitor, television, LCD, LED, or other display device that conveys information to the user).
- the user enters input commands into the computer processor through an input device.
- the user interface is a graphical user interface (GUI) written for web browser applications.
- GUI graphical user interface
- the server component(s) can be a personal computer, a minicomputer, or a mainframe and offers data management, information sharing between clients, network administration and security.
- the application and any databases used can be on the same or different servers.
- client and server(s) including processing on a single machine such as a mainframe, a collection of machines, or other suitable configuration are contemplated.
- client and server machines work together to accomplish the processing of the present invention.
- the database(s) is usually connected to the database server component and can be any device which will hold data.
- the database can be a any magnetic or optical storing device for a computer (e.g., CDROM, internal hard drive, tape drive).
- the database can be located remote to the server component (with access via a network, modem, etc.) or locally to the server component.
- the database can be a relational database that is organized and accessed according to relationships between data items.
- the relational database is generally composed of a plurality of tables (entities). The rows of a table represent records (collections of information about separate items) and the columns represent fields (particular attributes of a record).
- the relational database is a collection of data entries that "relate" to each other through at least one common field.
- Additional workstations equipped with computers and printers may be used at point of service to enter data and, in some embodiments, generate appropriate reports, if desired.
- the computer(s) can have a shortcut (e.g., on the desktop) to launch the application to facilitate initiation of data entry, transmission, analysis, report receipt, etc. as desired.
- the present disclosure also contemplates a computer-readable storage medium (e.g. CD-ROM, memory key, flash memory card, diskette, etc.) having stored thereon a program which, when executed in a computing environment, provides for implementation of algorithms to carry out all or a portion of the results of a response likelihood assessment as described herein.
- a computer-readable storage medium e.g. CD-ROM, memory key, flash memory card, diskette, etc.
- the program includes program instructions for collecting, analysing and generating output, and generally includes computer readable code devices for interacting with a user as described herein, processing that data in conjunction with analytical information, and generating unique printed or electronic media for that user.
- the storage medium provides a program which provides for implementation of a portion of the methods described herein (e.g., the user-side aspect of the methods (e.g., data input, report receipt capabilities, etc.))
- the program provides for transmission of data input by the user (e.g., via the internet, via an intranet, etc.) to a computing environment at a remote site. Processing or completion of processing of the data is carried out at the remote site to generate a report. After review of the report, and completion of any needed manual intervention, to provide a complete report, the complete report is then transmitted back to the user as an electronic document or printed document (e.g., fax or mailed paper report).
- the storage medium containing a program according to the invention can be packaged with instructions (e.g., for program installation, use, etc.) recorded on a suitable substrate or a web address where such instructions may be obtained.
- the computer-readable storage medium can also be provided in combination with one or more reagents for carrying out response likelihood assessment (e.g., primers, probes, arrays, or other such kit components).
- the normalized expression levels of response indicator genes can be used in conducting a multivariate analysis so as to construct a multi-gene model useful in assessing a patient's likelihood of EGFR inhibitor treatment response.
- the present disclosure provides a method for conducting a multivariate analysis and/or constructing a multi-gene model.
- the method generally involves: a) assembling values of normalized expression levels of two or more response indicator gene products; b) determining whether a mathematical combination of the normalized expression levels of any combination of the response indicator genes is more indicative of a likelihood that a patient will respond to treatment with an EGFR inhibitor than the normalized expression level of any one of the response indicator genes individually; and c) using the mathematical combination to assess the likelihood that a patient will respond to treatment with a EGFR inhibitor ( Ambroise C and McLachlan GJ (2002) Proc Nat Acad Sci USA 99, 6562-6566 ).
- treatment methods which treatment methods generally involve treating an individual having an EGFR-expressing cancer with a treatment regimen that is selected based on the results of a response likelihood assessment as described herein.
- the present disclosure also provides a method for classifying a patient as a "responder” or a "non-responder” based on the results of a subject likelihood assessment.
- the method involves assaying a test sample obtained from an EGFR-expressing cancer cell from a patient; and determining a normalized level of a gene product of a response indicator gene, as described above.
- the normalized level of the gene product(s) indicate whether the patient is likely to exhibit a clinically beneficial response to treatment with an EGFR inhibitor, thereby allowing classification of the patient as a "responder” or a "non-responder.”
- the present disclosure provides arrays for use in carrying out a subject method to predict the likelihood of patient beneficial response to EGFR inhibitor treatment.
- a subject array includes a plurality of polynucleotides immobilized on the surface of an insoluble support.
- the immobilized polynucleotides comprise nucleotide sequences that are capable of hybridizing with a response indicator gene or a reference gene.
- hybridizing refers to the complementary base-pairing interaction of one nucleic acid with another nucleic acid that results in formation of a duplex, triplex, or other higher-ordered structure.
- the primary interaction is base specific, e.g., A/T and G/C, by Watson/Crick hydrogen bonding. Base stacking and hydrophobic interactions can also contribute to duplex stability.
- an immobilized polynucleotide comprises a nucleotide sequence that hybridizes to a response indicator gene selected from a gene listed in one of Table 1A, Table 1 B, Table 2A, Table 2B, Table 6A, Table 6B, Table 7A, and Table 7B, above.
- Nucleotide sequences of the aforementioned response indicator genes are known in the art.
- generation of probes that hybridize under suitable hybridization conditions is well within the skill level of those of ordinary skill in the art.
- a subject array can comprise a probe that provides for detection of one or more gene product(s) encoded by a response indicator gene selected from: ATP5E, TITF1, CLTC, BRCA1, AREG, PTP4A3, EREG, VAV3, SATB2, CEACAM6, EGFR, CHN2, FGFR3, C13orf18, QPRT, AMACR1, CKMT2, ID1, SORBS1, SLC26A3, and ErbB3.
- a response indicator gene selected from: ATP5E, TITF1, CLTC, BRCA1, AREG, PTP4A3, EREG, VAV3, SATB2, CEACAM6, EGFR, CHN2, FGFR3, C13orf18, QPRT, AMACR1, CKMT2, ID1, SORBS1, SLC26A3, and ErbB3.
- a subject array can comprise a probe that provides for detection of one or more gene product(s) encoded by a response indicator gene selected from: DUSP6, VDAC2, ANXA2P2, SERPINB1, NT5E, GPC3, DUSP4, PHLDA1, K-ras, DR5, VIL2, LAMC2, SFN, ANXA1, EPHA2, P14ARF, CA9, KRT17, p14ARF, Maspin, PLAUR, LAMA3, and GCNT3.
- a response indicator gene selected from: DUSP6, VDAC2, ANXA2P2, SERPINB1, NT5E, GPC3, DUSP4, PHLDA1, K-ras, DR5, VIL2, LAMC2, SFN, ANXA1, EPHA2, P14ARF, CA9, KRT17, p14ARF, Maspin, PLAUR, LAMA3, and GCNT3.
- a subject array can comprise a probe that provides for detection of one or more gene product(s) encoded by a response indicator gene selected from ATP5E, TITF1, CLTC, BRCA1, AREG, PTP4A3, EREG, VAV3, SATB2, CEACAM6, EGFR, CHN2, FGFR3, C13orf18, QPRT, AMACR1, CKMT2, ID1, SORBS1, SLC26A3, ErbB3, DUSP6, VDAC2, ANXA2P2, SERPINB1, NT5E, GPC3, DUSP4, PHLDA1, K-ras, DR5, VIL2, LAMC2, SFN, ANXA1, EPHA2, P14ARF, CA9, KRT17, p14ARF, Maspin, PLAUR, LAMA3, and GCNT3.
- a response indicator gene selected from ATP5E, TITF1, CLTC, BRCA1, AREG, PTP4A3, EREG, VAV3, SATB2, CEACAM6,
- a subject array can comprise a probe that provides for detection of one or more gene product(s) encoded by a response indicator gene selected from EGF, ADAM17, PTP4A3, ADAM15, QPRT, SATB2, RASSF1, VAV3, CEACAM6, EREG, AREG, TITF1, SORBS1, C13orf18, CKMT2, BTC, ATP5E, B.Catenin, CCNE1, EGFR, Bclx, BRCA1, CDC25B, CHN2, ID1, SLC26A3, VDAC2, SERPINB1, PHLDA1, ANXA2P2, KRT17, EPHA2, DUSP4, CGA, CA9, Maspin, NEDD8, DUSP6, GPC3, NT5E, VIL2, and P14ARF.
- a response indicator gene selected from EGF, ADAM17, PTP4A3, ADAM15, QPRT, SATB2, RASSF1, VAV3, CEACAM6, EREG, AREG, TI
- a subject array can comprise probes that provides for detection of the gene products of genes included in the above-listed multi-gene sets, or any combination of multi-gene sets (e.g., multi-gene sets 1-64 and 65-167, above).
- the presence or absence of an activating KRAS mutation will be detected.
- one or more probes that provide for detection of known activating KRAS mutations are included in the array.
- the response indicator genes are represented in the array by probes immobilized on an insoluble support.
- the response indicator genes represent at least about 25% of the genes represented on the array.
- the response indicator gene represent at least about 25%, at least about 30%, at least about 35%, at least about 40%, at least about 50%, at least about 55%, at least about 60%, at least about 65%, at least about 70%, at least about 75%, at least about 80%, at least about 85%, at least about 90%, or at least about 95% of the gene represented on the array.
- a probe that hybridizes to a response indicator gene is referred to herein as a "response indicator gene probe.”
- Response indicator gene probes are single stranded nucleic acids, having a length of from about 10 nucleotides (nt) to about 100 nt, e.g., from about 15 nt to about 50 nt, from about 15 nt to about 20 nt, from about 20 nt to about 25 nt, or from about 25 nt to about 30 nt.
- the term “about” may be construed to mean 1, 2, 3, 4, 5, 6, 7, 8, 9, 10, 11, 12, 13, 14, 15, 16, 17, 18, 19 or 20 more nucleotides either 5' or 3' from either termini or from both termini.
- a subject array comprises one or more response indicator gene probes immobilized on a surface of a solid (insoluble) support.
- a subject array can include two or more ("a plurality") of response indicator gene probes immobilized on a surface of a solid support.
- a subject array can include 2, 3, 4, 5, 6, 7-10, 10-12, 12-15, 15-20, 20-25, 25-30, 30-35, 35-40, 40-45, 45-50, or more than 50, distinct response indicator gene probes immobilized on a surface of a solid support.
- a probe can be "addressable," e.g., the nucleotide sequence, or perhaps other physical or chemical characteristics, of a probe can be determined from its address, i.e. a one-to-one correspondence between the sequence or other property of the probe and a spatial location on, or characteristic of, the solid phase support to which it is attached.
- an address of a probe can be a spatial location, e.g. the planar coordinates of a particular region containing copies of the probe.
- a subject array includes a solid phase support, which may be planar or a collection of microparticles, that carries or carry probes as described above fixed or immobilized, e.g., covalently, at specific addressable locations.
- a subject array includes a solid phase support having a planar surface, which carries an plurality of nucleic acids, each member of the plurality comprising identical copies of an oligonucleotide or polynucleotide probe immobilized to a fixed region, which does not overlap with those of other members of the plurality.
- the nucleic acid probes are single stranded and are covalently attached to the solid phase support at known, determinable, or addressable, locations.
- the density of non-overlapping regions containing nucleic acids in a microarray is typically greater than 100 per cm 2 , e.g., greater than 1000 per cm 2 .
- the substrates of the subject arrays may be fabricated from a variety of materials.
- the materials from which the substrate is fabricated should ideally exhibit a low level of non-specific binding during hybridization events. In many situations, it will also be preferable to employ a material that is transparent to visible and/or UV light.
- materials of interest include: nylon, both modified and unmodified, nitrocellulose, polypropylene, and the like, where a nylon membrane, as well as derivatives thereof, is of particular interest in this embodiment.
- specific materials of interest include: glass; plastics, e.g. polytetrafluoroethylene, polypropylene, polystyrene, polycarbonate, and blends thereof, and the like; metals, e.g. gold, platinum, and the like; etc.
- composite materials such as glass or plastic coated with a membrane, e.g. nylon or nitrocellulose, etc.
- Hybridization between a probe and a test nucleic acid results in a "readout," where "readout” refers to a parameter, or parameters, which are measured and/or detected that can be converted to a number or value.
- readout may refer to an actual numerical representation of such collected or recorded data.
- a readout of fluorescent intensity signals from an array is the address and fluorescence intensity of a signal being generated at each hybridization site of the array; thus, such a readout may be registered or stored in various ways, for example, as an image of the array, as a table of numbers, or the like.
- the total number of spots on the substrate will vary depending on the number of different oligonucleotide probe spots (oligonucleotide probe compositions) one wishes to display on the surface, as well as the number of non probe spots, e.g., control spots, orientation spots, calibrating spots and the like, as may be desired depending on the particular application in which the subject arrays are to be employed.
- the pattern present on the surface of the array can include at least 2 distinct nucleic acid probe spots, at least about 5 distinct nucleic acid probe spots, at least about 10 distinct nucleic acid spots, at least about 20 nucleic acid spots, or at least about 50 nucleic acid spots.
- each distinct probe spot or probe composition it may be desirable to have each distinct probe spot or probe composition be presented in duplicate, i.e. so that there are two duplicate probe spots displayed on the array for a given target.
- each target represented on the array surface is only represented by a single type of oligonucleotide probe. In other words, all of the oligonucleotide probes on the array for a give target represented thereon have the same sequence. In certain embodiments, the number of spots will range from about 200 to 1200.
- the number of probe spots present in the array can make up a substantial proportion of the total number of nucleic acid spots on the array, where in many embodiments the number of probe spots is at least about 25 number %, at least 50 number %, at least about 80 number %, or at least about 90 number % of the total number of nucleic acid spots on the array.
- a subject array can be prepared using any convenient methods and compositions.
- one method of preparing an array is to first synthesize the oligonucleotides for each spot and then deposit the oligonucleotides as a spot on the support surface.
- the oligonucleotides may be prepared using any convenient methodology, where chemical synthesis procedures using phosphoramidite or analogous protocols in which individual bases are added sequentially without the use of a polymerase, e.g. such as is found in automated solid phase synthesis protocols, where such techniques are well known to those of skill in the art.
- Targets e.g., a nucleic acid sample from a patient's cancer cell
- mRNA can be labeled and used directly as a target, or converted to a labeled cDNA target.
- mRNA can be labeled non-specifically (randomly) directly using chemically, photochemically or enzymatically activated labeling compounds.
- An mRNA target can be labeled specifically in the sequences which are complementary to the probes. This specific labeling can be achieved by using covalent or non-covalent binding of additional labeled oligonucleotides to the target sequences which flank the probe complementary sequence or the complementary probe sequence.
- the hybridized fraction of labeled oligonucleotides with mRNA can be purified or separated from the non-hybridized fraction and then hybridized to the array.
- Methods for generating labeled cDNA probes are known in the art, and include the use of oligonucleotide primers and labeled nucleotide triphosphate(s).
- Primers that may be employed include oligo(dT), random primers, e.g. random hexamers and gene specific primers.
- the target nucleic acid is then contacted with the array under hybridization conditions, where such conditions can be adjusted, as desired, to provide for an optimum level of specificity in view of the particular assay being performed.
- Suitable hybridization conditions are well known to those of skill in the art and reviewed in Maniatis et al, supra, and WO 95/21944 .
- stringent conditions are known to those of skill in the art.
- non-hybridized labeled nucleic acid is removed from the support surface, conveniently by washing, generating a pattern of hybridized nucleic acid on the substrate surface.
- wash solutions are known to those of skill in the art and may be used.
- Methods of detecting hybridization between a probe nucleic acid and a target nucleic acid include scintillation counting, autoradiography, fluorescence measurement, colorimetric measurement, light emission measurement, light scattering, and the like.
- Non-limiting examples of probes that would be suitable for inclusion in a subject array include the probe sequences set forth in the tables provided in Figures 1 and 2 .
- a subject array can be used in a subject method to predict the likelihood that a patient will respond to an EGFR inhibitor treatment.
- the present disclosure provides a method to predict the likelihood that a patient having an EGFR-expressing cancer will exhibit a beneficial response to treatment with an EGFR inhibitor, where the method involves: (a) contacting an array comprising a plurality of distinct response indicator gene nucleic acid probes immobilized on a surface of a solid support with a nucleic acid sample from a cancer cell from the patient, to produce a sample contacted array; and (b) detecting hybridization between the immobilized probes and nucleic acids from the patient. Detection of hybridization provides for determination of a normalized level of a response indicator gene, or its gene product,, and therefore allows for an assessment as to the likelihood that the patient will exhibit a beneficial response to EGFR inhibitor treatment.
- the instant disclosure also provides methods of preparing a subject array.
- the methods generally involve immobilizing on a solid support one or more probes that provide for detection of nucleic acid products of at least two genes selected from: ATP5E, TITF1, CLTC, BRCA1, AREG, PTP4A3, EREG, VAV3, SATB2, CEACAM6, EGFR, CHN2, FGFR3, C13orf18, QPRT, AMACR1, CKMT2, ID1, SORBS1, SLC26A3, and ErbB3 and/or at least one gene selected from: DUSP6, VDAC2, ANXA2P2, SERPINB1, NT5E, GPC3, DUSP4, PHLDA1, K-ras, DR5, VIL2, LAMC2, SFN, ANXA1, EPHA2, P14ARF, CA9, KRT17, p14ARF, Maspin, PLAUR, LAMA3, and GCNT3, where the genes comprise at least 25% of the genes represented on the array.
- a method of preparing a subject array involves immobilizing on a solid support one or more probes that provide for detection of nucleic acid products of at least two genes selected from: EGF, ADAM17, PTP4A3, ADAM15, QPRT, SATB2, RASSF1, VAV3, CEACAM6, EREG, AREG, TITF1, SORBS1, C13orf18, CKMT2, BTC, ATP5E, B.Catenin, CCNE1, EGFR, Bclx, BRCA1, CDC25B, CHN2, ID1, SLC26A3, VDAC2, SERPINB1, PHLDA1, ANXA2P2, KRT17, EPHA2, DUSP4, CGA, CA9, Maspin, NEDD8, DUSP6, GPC3, NT5E, VIL2, and P14ARF, where the genes comprise at least 25% of the genes represented on the array.
- kits comprising reagents, which may include gene-specific or gene-selective probes and/or primers useful for assaying the expression of genes disclosed herein and for assessing the likelihood of response to treatment with EGFR inhibitors.
- a subject kit can include one or more nucleic acid probes that hybridize specifically to nucleic acid response indicator gene products.
- a subject kit can include, e.g., one or more nucleic acid probes, where each of the one or more probes hybridizes specifically to a different response indicator gene product.
- a subject kit can include probes that hybridize specifically to nucleic acid products of response indicator genes set forth in one or more of Tables 1A, 1 B, 2A, 2B, 6A, 6B, 7A, and 7B.
- a subject kit can include a set of two or more nucleic acid probes, where each probe of the set hybridizes to a nucleic acid product of a different response indicator gene.
- a subject kit can include a set of two, three, four, five, six, seven, or more, nucleic acid probes, where each probe of the set hybridizes to a nucleic acid product of a different member of a set of response indicator genes, where exemplary sets of response indicator genes are depicted in Tables 8 and 9.
- a subject kit can comprise probes that provides for detection of the gene products of genes included in the above-listed multi-gene sets (e.g., multi-gene sets 1-64 and 65-167, above).
- a subject kit will include, in addition to a probe that hybridizes specifically to a nucleic acid product of a response indicator gene, one or more probes that hybridize specifically to a reference gene product. Such probes can be used in determining normalized expression levels of a response indicator gene.
- a subject kit can include one or more nucleic acid primer pairs, where the primer pairs, when used as primers in a polymerase chain reaction, amplify a target nucleic acid response indicator gene product, or a target region of a nucleic acid response indicator gene product.
- a subject kit can include primer pairs for multiple response indicator genes.
- a subject kit can include primer pairs that provides for amplification of the gene products of genes included in the above-listed multi-gene sets (e.g., multi-gene sets 1-64 and 65-167, above).
- nucleic acid primers and probes are set forth in the tables provided in Figures 1 and 2 .
- probe and primer sequences are also possible, and are readily obtained based on known nucleotide sequences of response indicator genes, and/or based on known nucleotide sequences of reference genes.
- a subject kit can further include one or more nucleic acid probes that hybridize to target nucleic acids (e.g., nucleic acid from a cancer cell obtained from a patient) that may include one or more activating KRAS mutations.
- target nucleic acids e.g., nucleic acid from a cancer cell obtained from a patient
- a subject kit can comprise reagents for the extraction and/or isolation of RNA from tumour samples, in particular fixed paraffin-embedded tissue samples and/or reagents for preparing a cDNA copy of an mRNA, and/or reagents for nucleic acid amplification.
- Primers and probes can be designed based on known sequences of response indicator genes, and are readily synthesized by standard techniques, e.g., solid phase synthesis via phosphoramidite chemistry, as disclosed in U.S. Pat. Nos. 4,458,066 and 4,415,732 , incorporated herein by reference; Beaucage et al. (1992) Tetrahedron 48:2223-2311 ; and Applied Biosystems User Bulletin No. 13 (1 Apr. 1987 ).
- Other chemical synthesis methods include, for example, the phosphotriester method described by Narang et al., Meth. Enzymol. (1979) 68:90 and the phosphodiester method disclosed by Brown et al., Meth. Enzymol.
- a probe or a primer can include a detectable label.
- exemplary labels include fluorochromes, e.g. fluorescein isothiocyanate (FITC), rhodamine, Texas Red, phycoerythrin, allophycocyanin, 6-carboxyfluorescein (6-FAM), 2',7'-dimethoxy-4',5'-dichloro-6-carboxyfluorescein (JOE), 6-carboxy-X-rhodamine (ROX), 6-carboxy-2',4',7',4,7-hexachlorofluorescein (HEX), 5-carboxyfluorescein (5-FAM), N,N,N',N'-tetramethyl-6-carboxyrhodamine (TAMRA), Cy5, Cy3, and the like; and radioactive labels (e.g., 32 P, etc.).
- FITC fluorescein isothiocyanate
- rhodamine Texas Red
- Probes and primers for inclusion in a subject kit include those useful in various amplification and/or detection systems.
- Exemplary amplification and/or detection systems include SunriseTM primer-based systems, Molecular Beacons, the TaqmanTM system, an AmplifluorTM hairpin primer-based system, a Scorpions technology (e.g., bi-functional molecules containing a PCR primer element covalently linked to a probe element), and a Light Upon Extension or LUXTM-based system.
- Further exemplary detection systems include those based on a melt-curve analysis, and using intercalating dyes such as the fluorescent dye SYBR Green.
- kits may optionally comprise reagent(s) with an identifying description or label or instructions relating to their use in the methods of the present invention.
- the kits may comprise containers (including microtiter plates suitable for use in an automated implementation of the method), each with one or more of the various reagents (typically in concentrated form) utilized in the methods of the invention, including, for example, pre-fabricated microarrays, buffers, the appropriate nucleotide triphosphates (e.g., dATP, dCTP, dGTP and dTTP; or rATP, rCTP, rGTP and UTP), reverse transcriptase, DNA polymerase, RNA polymerase, and one or more probes and primers of the present invention (e.g., appropriate length poly(T) or random primers linked to a promoter reactive with the RNA polymerase).
- a subject kit Instructions for the use of mathematical algorithms used to assess the likelihood of patient response to EGFR inhibitors can also be included in a subject kit.
- Standard abbreviations may be used, e.g., bp, base pair(s); kb, kilobase(s); pl, picoliter(s); s or sec, second(s); min, minute(s); h or hr, hour(s); aa, amino acid(s); kb, kilobase(s); bp, base pair(s); nt, nucleotide(s); i.m., intramuscular(ly); i.p., intraperitoneal(ly); s.c., subcutaneous(ly); and the like.
- EXAMPLE 1 IDENTIFICATION OF MARKERS OF RESPONSE TO AN EGFR INHIBITOR IN CANCER PATIENTS
- Gene products that can serve as predictors of response to an EGFR inhibitor were identified by analysing normalized levels of gene products from tumours obtained from patients that had undergone cetuximab treatment for colon cancer. Expression levels of the gene products were measured; and normalized levels were determined relative to expression levels of one or more reference genes.
- Identification of an response indicator gene product was carried out by analysing gene expression levels in cancer cells from a number of patients for whom the following criteria applied: 1) the patients had cancer and were treated for the cancer with an EGFR inhibitor; and 2) the outcome of treatment was documented, i.e., the patients' response to treatment was documented.
- Nucleic acid from cancer cells from the patients was analysed to measure the expression level of a test gene(s) and a reference gene(s).
- the expression level of the test gene(s) was then normalized to the expression level of the reference gene(s), thereby generating a normalized expression level (a "normalized expression value") of the test gene. Normalization was carried out to correct for variation in the absolute level of gene product in a cancer cell.
- the final algorithm can utilize various manipulations of the normalized expression values such as application of thresholds to the expression value (assigning maximum and/or minimum values to particular genes) grouping genes, taking the average value of genes in a group or weighting the genes within a group, weighting the group as a whole or some combination of the above.
- a total of 65 amplicons were tested representing cancer related genes, reference genes and KRAS mutation assays.
- the sequences of probes and primers used to assay each amplicon are provided in the table depicted in Figure 1 ; and the sequences of the resulting amplicons are provided in the table depicted in Figure 2 .
- tumour samples were collected, e.g., from patients enrolled in clinical trials or from case studies where well-curated clinical outcome were available.
- a thin section of each tumour sample was hematoxylin & eosin (H&E) stained.
- the stained slide was used to evaluate the amount of tumour present. If the tumour amount was low, then macrodissection was carried out using the H&E slide as template.
- the H&E section was also used to confirm physician diagnosis.
- Quality control (QC) steps were carried out to confirm adequate RNA and to confirm the absence of contaminating DNA.
- the raw Ct data were normalized, using, e.g., a set of 5 reference genes, resulting in normalized expression values (normalized Ct).
- the model is an algorithm (or equation) that can be used to produce a recurrence score or a response-to-treatment score for an individual patient that is strongly correlated with the likelihood of response to an EGFR inhibitor in the set of samples utilized for the analysis.
- cycle threshold (C T ) measurements obtained by RT-PCR were normalized relative to the mean expression of a set of five reference genes: ATP5E, PGK1, UBB, VDAC2, and GPX1.
- a one unit increase in normalized expression measurements generally reflects a 2-fold increase in RNA quantity.
- PFS progression free survival
- Figures 3A-10D display plots of the predicted probability of disease control (on the y-axis) by normalized gene expression in C T units (on the x-axis).
- KRAS mutation status is strongly associated with ORR
- we chose to build multigene models in two ways 1) utilizing all patients in model building but including interaction terms between KRAS mutation status and individual gene expression and 2) using the subset of wild type patients (n 144) to identify genes beyond KRAS mutation status that would be predictive of response to cetuximab therapy.
- the first scenario we captured how the KRAS mutation status modifies the relationship of gene expression and outcome by including all possible one-way interaction terms between each individual gene and KRAS mutation status.
- Tables 1A and 1 B show genes whose normalized expression is correlated (univariate analysis) positively (Table 1A) or negatively (Table 1 B) with Overall Response Rate (ORR) in colon cancer patients treated with cetuximab.
- Figures 3A-3D show probability curves that correspond to the data reported in Table 1A;
- Figures 4A-4F show probability curves that correspond to the data reported in Table 1 B.
- Tables 2A and 2B show genes whose normalized expression is correlated (univariate analysis) positively (Table 2A) or negatively (Table 2B) with Disease Control in colon cancer patients treated with cetuximab.
- Figures 5A-5E show probability curves that correspond to the data reported in Table 2A;
- Figures 6A-6F shows probability curves that correspond to the data reported in Table 2B.
- Table 3 presents a table that shows genes and gene combinations whose expression levels can be combined in multigene models that significantly correlate with Overall Response Rate in colon cancer patients treated with cetuximab.
- aregereg is the average of the normalized AREG value and the normalized EREG value.
- MetInd is the K-Ras mutation status indicator variable that is included as an interaction variable with each gene.
- EPHA2 PHLDA1 aregereg 1 4% 0.73 . 0.73 EGFR EREG KRT17 PHLDA1 1 4% 0.76 . 0.76 EGFR EREG PHLDA1 PTP4A3 1 4% 0.82 . 0.82 EGFR KRT17 PHLDA1 PTP4A3 1 4% 0.73 . 0.73 EPHA2 PHLDA1 PTP4A3 aregereg 1 4% 0.69 . 0.69 EREG KRT17 PHLDA1 SORBS1 1 4% 0.79 . 0.79 EREG PHLDA1 PLAUR SATB2 1 4% 0.74 . 0.74 KRT17 MutInd_PTP4A3 PHLDA1 aregereg 1 4% 0.75 .
- EREG PHLDA1 QPRT SATB2 SORBS1 1 7% 0.57 . 0.57 KRT17 PHLDA1 SORBS1 aregereg . mutant_ind 1 7% 0.75 . 0.75 Total 15 6% 0.78 0.07 0.78 6-Gene Models AREG EGFR EPHA2 LAMA3 PHLDA1 PTP4A3 1 20% 0.88 . 0.88 AREG EGFR KRT17 PHLDA1 PTP4A3 SORBS1 1 20% 0.85 . 0.85 EGFR EPHA2 EREG PHLDA1 PLAUR SATB2 1 20% 0.72 .
- Table 4 presents a table that shows genes and gene combinations whose expression levels can be combined in multigene models that significantly correlate with Disease Control in colon cancer patients treated with cetuximab.
- aregereg is the average of the normalized AREG value and the normalized EREG value.
- MetInd is the K-Ras mutation status indicator variable that is included as an interaction variable with each gene.
- EREG MutInd_EGFR 1 1% 0.73 . 0.73
- EREG MutInd_SLC26A3 1 1% 0.73 . 0.73
- MutInd_EGFR aregereg 1 1% 0.91 . 0.91
- MutInd-SFN aregereg 1 1% 0.79 . 0.79
- MutInd-SLC26A3 aregereg 1 1% 0.80 .
- DUSP6 EPHA2 NT5E aregereg 1 4% 0.69 . 0.69 DUSP6 EREG ID1 MutInd_EREG 1 4% 0.83 . 0.83 DUSP6 EREG MutInd_AMACR1 1 4% 0.86 . 0.86 DUSP6 EREG MutInd_EREG 1 4% 0.82 . 0.82 DUSP6 EREG MutInd_EREG 1 4% 0.83 . 0.83 DUSP6 EREG MutInd_EREG 1 4% 0.76 . 0.76 Table 4 (DCS) # Models % of Models Mean AUC SD AUC Median AUC Genes DUSP6 MutInd_EREG MutInd_LAMC2 1 4% 0.70 .
- DCS DCS # Models % of Models Mean AUC SD AUC Median AUC Genes DUSP6 MutInd_EREG MutInd_LAMC2 1 4% 0.70 .
- KRAS mutations were observed in 82 of the 226 cases in this study (36.3%).
- Table 5 presents a table that depicts activating KRAS mutations. Those tumours that tested positive for one or more of these mutations were classified KRAS-positive and all other tumours were classified KRAS-negative. Table 5 - Tested Activating Mutations in KRAS Name Exon Position on NM_033360 KRAS Codon WT codon Event Mutant codon snp1 2 216 12 GGT G->T GTT snp2 2 216 12 GGT G->A GAT snp3 2 219 13 GGC G->A GAC snp4 215 12 GGT G->A AGT snp5 2 215 12 GGT G->T TGT snp6 215 12 GGT G->C CGT snp7 2 216 12 GGT G->C GCT
- Tables 6A and 6B present tables that show genes for which the normalized expression is correlated (univariate analysis) positively (Table 6A) or negatively (Table 6B) with Overall Response Rate in KRAS-Negative colon cancer patients treated with cetuximab.
- Figures 7A-7C show probability curves that correspond to the data reported in Table 6A;
- Figures 8A-8C show probability curves that correspond to the data reported in Table 6B.
- EXAMPLE 8 - IDENTIFICATION OF GENE MARKERS OF RESPONSE TO AN EGFR INHIBITOR IN KRAS-NEGATIVE COLON CANCER PATIENTS (DC ENDPOINT)
- Tables 7A and 7B present tables that show genes for which the normalized expression is correlated (univariate analysis) positively (Table 7A) or negatively (Table 7B) with Disease Control in KRAS-Negative colon cancer patients treated with cetuximab.
- Figures 9A-9E shows probability curves that correspond to the data reported in Table 7A;
- Figures 10A-10D shows probability curves that correspond to the data reported in Table 7B.
- Table 8 shows genes and gene combinations, the expression levels of which can be combined in multigene models to correlate with Overall Response Rate in KRAS-Negative colon cancer patients treated with Cetuximab. Note: “aregereg” is the average of the normalized AREG value and the normalized EREG value.
- Table 8 (ORR) 1-gene # of Model s % of Models Mea n AUC SD AU C Media n AUC PTP4A3 40 71% 0.69 0.07 0.68 EREG 8 14% 0.62 0.08 0.64 PHLDA1 5 9% 0.65 0.11 0.65 aregereg 3 5% 0.70 0.10 0.70 Total 56 100% 0.66 0.09 0.67 2-gene PHLDA1 PTP4A3 45 46% 0.77 0.08 0.78 KRT17 PTP4A3 13 13% 0.72 0.09 0.76 EREG PHLDA1 10 10% 0.77 0.06 0.78 aregereg PHLDA1 9 9% 0.76 0.06 0.77 EREG KRT17 6 6% 0.75 0.08 0.74 aregereg KRT17 5 5% 0.68 0.16 0.73 AREG PHLDA1 3 3% 0.76 0.01 0.76 KRT17 SERPINB1 2 2% 0.58 0.04 0.58 CEACAM6 PTP4A3 1 1% 0.58 .
- Table 9 presents a table that shows genes and gene combinations, the expression levels of which can be combined in multigene models to correlate with Disease Control in KRAS-Negative colon cancer patients treated with Cetuximab. Note: “aregereg” is the average of the normalized AREG value and the normalized EREG value.
- Table 10 presents a table that compares observed patient response (DC endpoint) to treatment with cetuximab and response predicted using a 4-gene model based on expression levels of AREG, EREG, SLC26A3 and DUSP6.
- the threshold for the 4-gene model was determined by identifying the cutpoint that yielded the highest number of true negatives plus true positives on the DC endpoint.
- Table 10 illustrates the number of patients who would be classified as responders versus non-responders using the 4-gene model. The percentages are row percents, summarizing the number of patients with observed DC status given the predicted DC status from the 4-gene model.
- Table 11 presents a table that compares the progression free survival time for patients for all KRAS-positive patients, for all KRAS-negative patients, for patients predicted by the four-gene classifier as having a high likelihood of response to treatment with an EGFR inhibitor and for patients predicted by the four-gene classifier as having a low likelihood of response to treatment with an EGFR inhibitor.
- the four gene classifier identifies a subset of KRAS-Negative patients that have a higher likelihood of response to treatment with an EGFR inhibitor (longer progression free survival (PFS) than the unclassified KRAS-Negative patients.
- the four gene classifier also identifies a subset of KRAS-Negative patients that have a lower likelihood of response (shorter progression free survival) than the unclassified KRAS-Negative patients; in these patients, PFS is similar to that seen in KRAS-Positive patients, who are generally resistant to treatment.
- the response indicator genes may comprise at least SLC26A3, DUSP6 and AREG or EREG.
- the tumour sample may be obtained from a tissue biopsy.
- the cancer may be colorectal cancer, colon cancer, non-small cell lung cancer, squamous cell cancer of the head and neck, endometrial cancer, multiple myeloma, rectal cancer, or esophageal cancer.
- the expression product may be an RNA transcript.
- the EGFR inhibitor may be an antibody specific for EGFR.
- the EGFR inhibitor may be a small molecule, such as an EGFR-selective tyrosine kinase inhibitor.
- the normalized expression level may be determined relative to an expression level of at least one reference gene.
- the expression level may be determined by polymerase chain reaction (PCR).
- the normalized expression level may be weighted by its contribution to response to the EGFR inhibitor.
- a method for predicting a likelihood that a human patient having a KRAS-negative EGFR - expressing cancer will exhibit a beneficial response to an EGFR inhibitor comprising: (a) measuring, in a tumour sample obtained from the patient, an expression level of at least one response indicator gene, or its expression product, selected from a group consisting of EGF, ADAM17, PTP4A3, ADAM15, QPRT, SATB2, RASSF1, VAV3, CEACAM6, EREG, AREG, TITF1, SORBS1, C13orf18, CKMT2, BTC, ATP5E, B.Catenin, CCNE1, EGFR, Bclx, BRCA1, CDC25B, CHN2, ID1, SLC26A3, VDAC2, SERPINB1, PHLDA1, ANXA2P2, KRT17, EPHA2, DUSP4, CGA, CA9, Maspin, NEDD8, DUSP6, GPC3, NT5E, V
- the response indicator genes may comprise at least SLC26A3, DUSP6 and AREG or EREG.
- the tumour sample may be obtained from a tissue biopsy.
- the cancer may be colorectal cancer, colon cancer, non-small cell lung cancer, squamous cell cancer of the head and neck, endometrial cancer, multiple myeloma, rectal cancer, or esophageal cancer.
- the expression product may be an RNA transcript.
- the EGFR inhibitor may be an antibody specific for EGFR.
- the EGFR inhibitor may be a small molecule, such as an EGFR-selective tyrosine kinase inhibitor.
- the normalized expression level may be determined relative to an expression level of one or more reference genes.
- the expression level may be obtained using polymerase chain reaction (PCR).
- the normalized expression level may be weighted by its contribution to response to EGFR inhibitor.
- an array comprising a plurality of polynucleotides immobilized on a surface of a solid support suitable for carrying out the above-specified methods.
- the array may further comprise a probe that hybridizes under stringent hybridization conditions to a nucleic acid comprising an activating KRAS mutation.
- a method of preparing an array comprising: immobilizing on a surface of a solid support a probe for detection of a gene product of at least two genes selected from: ATP5E, TITF1, CLTC, BRCA1, AREG, PTP4A3, EREG, VAV3, SATB2, CEACAM6, EGFR, CHN2, FGFR3, C13orf18, QPRT, AMACR1, CKMT2, ID1, SORBS1, SLC26A3, and ErbB3 and/or at least one gene selected from: DUSP6, VDAC2, ANXA2P2, SERPINB1, NT5E, GPC3, DUSP4, PHLDA1, K-ras, DR5, VIL2, LAMC2, SFN, ANXA1, EPHA2, P14ARF, CA9, KRT17, p14ARF, Maspin, PLAUR, LAMA3, and GCNT3, wherein said gene comprise at least 25% of genes represented on said array.
- a method of preparing an array comprising: immobilizing on a surface of a solid support a probe for detection of a gene product of at least two genes selected from: EGF, ADAM17, PTP4A3, ADAM15, QPRT, SATB2, RASSF1, VAV3, CEACAM6, EREG, AREG, TITF1, SORBS1, C13orf18, CKMT2, BTC, ATP5E, B.Catenin, CCNE1, EGFR, Bclx, BRCA1, CDC25B, CHN2, ID1, SLC26A3, VDAC2, SERPINB1, PHLDA1, ANXA2P2, KRT17, EPHA2, DUSP4, CGA, CA9, Maspin, NEDD8, DUSP6, GPC3, NT5E, VIL2, and P14ARF, wherein said gene comprise at least 25% of genes represented on said array.
- the method may comprise: (a) determining, in a tumour sample obtained from human cancer patients having an EGFR -expressing cancer, normalized expression levels of response indicator genes from the multi-gene model, or their expression products; and (b) using the normalized expression levels to predict the likelihood that the patient will exhibit a beneficial response to the EGFR inhibitor based on the normalized expression level of the multi-gene model.
Abstract
Description
- The present disclosure provides genes and gene sets, the expression levels of which are useful for predicting response of cancer patients to an epidermal growth factor receptor (EGFR) inhibitor therapy.
- Epidermal growth factor receptor (EGFR), also known as ERBB and HER1, is a gene that encodes a receptor protein found on the surface of some cells and to which an epidermal growth factor binds, causing the cell to divide. EGFR is a member of the HER family of receptors, and the dimerization of EGFR and v-erb-b2 erythroblastic leukemia viral oncogene homolog 2 (ERBB2), also known as HER2, is an important stimulus for breast cancer growth in ERBB2-positive breast cancers. Expression levels of EGFR are amplified in a subset of breast cancers and the resulting overexpression of the receptor contributes to breast cancer etiology.
- Because cancer is characterized by rapidly proliferating cells, most cancer drugs attack rapidly dividing cells indiscriminately and, as a result, often exhibited a high degree of toxicity. In most instances, little is known regarding the mechanisms of action of these cytotoxic drugs. Targeted EGFR inhibitors, e.g., have demonstrated activity against a number of cancer types. Anti-EGFR monoclonal antibodies have shown antitumour activity in advanced colorectal cancer, in squamous cell carcinomas of the head and neck, non-small-cell lung cancer (NSCLC) and renal cell carcinomas (Baselga J and Arteaga CL (2005) J Clin Oncol 2445-2459. Clinical trials are ongoing in early stage cancer and in other tumour types and are expected to show activity in cancer types where EGFR is expressed and where EGFR ligands promote tumour growth and progression.
- Given the importance in selection of therapy, there has been a push to develop drugs in concert with companion diagnostic tests capable of identifying responsive patients. Such diagnostics would address the situations where some patients who might benefit from treatment do not receive the drug, and other patients who are unlikely to benefit are unnecessarily exposed to toxic side effects, incur unnecessary expense, and/or experience a delay in being treated with alternative drugs that might prove more effective.
- The present disclosure provides methods and compositions to facilitate determining whether an EGFR-expressing cancer in an individual is an EGFR inhibitor-responsive cancer, as well as methods for determining the likelihood that a patient having an EGFR-expressing cancer will exhibit a beneficial response to an EGFR inhibitor therapy. The methods generally involve determining a normalized expression level of a gene product that correlates with EGFR inhibitor responsiveness.
- The disclosure provides methods for predicting the likelihood that a human patient with an EGFR -expressing cancer will exhibit a beneficial response to an EGFR inhibitor cancer therapy based on expression levels of one or more response indicator genes in a biological sample obtained from a tumour in the patient. Specifically, the method entails measuring an expression level of at least one response indicator gene, or its expression product. The response indicator gene is one or more selected from a group consisting of ATP5E, TITF1, CLTC, BRCA1, AREG, PTP4A3, EREG, VAV3, SATB2, CEACAM6, EGFR, CHN2, FGFR3, C13orf18, QPRT, AMACR1, CKMT2, ID1, SORBS1, SLC26A3, ErbB3, DUSP6, VDAC2, ANXA2P2, SERPINB1, NT5E, GPC3, DUSP4, PHLDA1, K-ras, DR5, VIL2, LAMC2, SFN, ANXA1, EPHA2, P14ARF, CA9, KRT17, p14ARF, Maspin, PLAUR, LAMA3, and GCNT3. The expression level is normalized, and the normalized expression level is used to determine or predict likelihood of beneficial response, wherein increased normalized expression levels of one or more of the following are measured: ATP5E, TITF1, CLTC, BRCA1, AREG, PTP4A3, EREG, VAV3, SATB2, CEACAM6, EGFR, CHN2, FGFR3, C13orf18, QPRT, AMACR1, CKMT2, ID1, SORBS1, SLC26A3, and ErbB3 are positively correlated with the likelihood that the patient will exhibit a beneficial response to the EGFR inhibitor cancer therapy; and increased normalized expression levels of DUSP6, VDAC2, ANXA2P2, SERPINB1, NT5E, GPC3, DUSP4, PHLDA1, K-ras, DR5, VIL2, LAMC2, SFN, ANXA1, EPHA2, P14ARF, CA9, KRT17, p14ARF, Maspin, PLAUR, LAMA3, and GCNT3 are negatively correlated with the likelihood that the patient will exhibit a beneficial response to the EGFR inhibitor cancer therapy. A report is generated based on the determined likelihood of response.
- The disclosure provides methods for predicting a likelihood that a human patient with a KRAS-negative, EGFR-expressing cancer will exhibit a beneficial response to an EGFR inhibitor cancer therapy based on expression levels of one or more response indicator genes in a biological sample obtained from a tumour in the patient. Specifically, the method entails measuring an expression level of at least one response indicator gene, or its expression product, selected from a group consisting of EGF, ADAM17, PTP4A3, ADAM15, QPRT, SATB2, RASSF1, VAV3, CEACAM6, EREG, AREG, TITF1, SORBS1, C13orf18, CKMT2, BTC, ATP5E, B.Catenin, CCNE1, EGFR, Bclx, BRCA1, CDC25B, CHN2, ID1, SLC26A3, VDAC2, SERPINB1, PHLDA1, ANXA2P2, KRT17, EPHA2, DUSP4, CGA, CA9, Maspin, NEDD8, DUSP6, GPC3, NT5E, VIL2, and P14ARF. The expression level is normalized, and the normalized expression level is used to determine or predict likelihood of beneficial response,, wherein increased normalized expression levels of one or more of the following are measured: EGF, ADAM17, PTP4A3, ADAM15, QPRT, SATB2, RASSF1, VAV3, CEACAM6, EREG, AREG, TITF1, SORBS1, C13orf18, CKMT2, BTC, ATP5E, B.Catenin, CCNE1, EGFR, Bclx, BRCA1, CDC25B, CHN2, ID1, and SLC26A3 are positively correlated with the likelihood that the patient will exhibit a beneficial response to the EGFR inhibitor cancer therapy; and increased normalized expression levels of VDAC2, SERPINB1, PHLDA1, ANXA2P2, KRT17, EPHA2, DUSP4, CGA, CA9, Maspin, NEDD8, DUSP6, GPC3, NT5E, VIL2, and P14ARF are negatively correlated with the likelihood that the patient will exhibit a beneficial response to the EGFR inhibitor cancer therapy.
- The methods of the present disclosure contemplate using a normalized expression level to determine or predict likelihood of beneficial response, based on normalized expression level(s) for single response indicator genes and/or multi-gene sets. Exemplary multi-gene sets are disclosed. The expression values are normalized relative to an expression level of one or more reference genes. The disclosure provides for measurement of normalized expression level(s) of at least one response indicator gene product. For all aspects of the present disclosure, the methods may further include determining the expression levels of at least two of said genes, or their expression products. It is further contemplated that the methods of the present disclosure may further include determining the expression levels of at least three of said genes, or their expression products. It is contemplated that the methods of the present disclosure may further include determining the expression levels of at least four of said genes, or their expression products. It is contemplated that the methods of the present disclosure may further include determining the expression levels of at least five of said genes, or their expression products. It is contemplated that the methods of the present disclosure may further include determining the expression levels of at least six of said genes, or their expression products. It is contemplated that the methods of the present disclosure may further include determining the expression levels of at least seven of said genes, or their expression products. It is contemplated that the methods of the present disclosure may further include determining the expression levels of at least eight of said genes, or their expression products. It is contemplated that the methods of the present disclosure may further include determining the expression levels of at least nine of said genes, or their expression products. The methods may involve determination of the expression levels of at least ten (10) or at least fifteen (15) of the genes listed above or their products.
- A normalized expression level(s), generated as discussed above, is used to determine or predict likelihood of beneficial response, The normalized expression level(s) is indicative of the likelihood that the patient will exhibit a beneficial response to an EGFR inhibitor therapy, such as an EGFR-specific antibody or small molecule. A likelihood score (e.g., a score predicting likelihood of beneficial response to EGFR inhibitor treatment) can be calculated based on the normalized expression level(s). A score may be calculated using weighted values based on a normalized expression level of a response indicator gene and its contribution to response to EGFR inhibitor cancer therapy.
- In addition, the disclosure provides arrays for carrying out the methods disclose herein, or for analysing whether a mathematical combination of the normalized expression levels of any combination of the response indicator genes is more indicative of a likelihood that a patient will respond to treatment with an EGFR inhibitor. The arrays may include, for example, probes that hybridize to a nucleic acid sequence in a response indicator genes or an activating KRAS mutation.
- Determining the expression level of one or more genes may be accomplished by, for example, a method of gene expression profiling. The method of gene expression profiling may be, for example, a PCR-based method. The expression level of said genes can be determined, for example, by RT-PCR (reverse transcriptase PCR), quantitative RT-PCR (qRT-PCR), or other PCR-based methods, immunohistochemistry, proteomics techniques, an array-based method, or any other methods known in the art or their combination. In one aspect the RNA transcripts are fragmented.
- Detection of an RNA transcript of a response indicator gene may be accomplished by assaying for an exon-based sequence or an intron-based sequence, the expression of which correlates with the expression of a corresponding exon sequence.
- In an exemplary embodiment, the assay for the measurement of response indicator genes, or their gene products, and/or activating KRAS mutations is provided in the form of a kit or kits.
- The expression levels of the genes may be normalized relative to the expression levels of one or more reference genes, or their expression products.
- The tumour sample may be, for example, a tissue sample containing cancer cells, or portion(s) of cancer cells, where the tissue can be fixed, paraffin-embedded or fresh or frozen tissue. For example, the tissue may be from a biopsy (fine needle, core or other types of biopsy) or obtained by fine needle aspiration, or by obtaining body fluid containing a cancer cell, e.g. urine, blood, etc.
- For all aspects of the methods of the present disclosure, it is contemplated that for every increment of an increase in the level of one or more genes or their expression products, the patient is identified to show an incremental increase in clinical outcome.
- The determination of expression levels may occur more than one time in the practice of the methods disclosed herein.
- The methods may further include the step of creating a report based on the determined or predicted likelihood of beneficial response. In another aspect the present disclosure provides reports for a patient containing a summary of the expression levels of the one or more response indicator genes, or their expression products, in a tumour sample obtained from said patient. In one aspect the report is in electronic form.
- In one embodiment, the EGFR inhibitor is an antibody specific for EGFR. In another, the EGFR inhibitor is a small molecule, for example an EGFR-selective tyrosine kinase inhibitor.
-
Figure 1 shows the sequences of probes and primers used to assay each gene identified in the studies. -
Figure 2 shows the sequences of amplicons expected from the use of the probes and primers shown inFigure 1 . -
Figures 3A - 10D provide sets of graphs showing probability curves. Each graph contains three lines - a centre dark line and two lighter lines above and below the dark centreline. Each graph has a centre dark line representing the model-predicted relationship between normalized gene expression on the x-axis and likelihood of beneficial response to an EGFR inhibitor on the y-axis (predicted probability curve). The lighter grey lines above and below the black line represent the 95% Confidence Interval for the predicted probability, i.e. at a particular expression value for the gene, there is a 95% probability that the upper and lower grey lines include the that the actual probability of response. Confidence Intervals for the probability curves were calculated using the normal approximation method. The name of the gene analysed is indicated below each graph by the text preceding the period; for example, "AREG.2" refers to AREG. Each ofFigures 3A-10D are described in more detail below. -
Figures 3A-3D show probability curves that correspond to the data reported in Table 1 A for analysis of ORR in all patients (K-ras negative and K-ras positive); Odds Ratio >1. -
Figures 4A-4F show probability curves that correspond to the data reported in Table 1 B for analysis of ORR in all patients (K-ras negative and K-ras positive); Odds Ratio <1. -
Figures 5A-5E show probability curves that correspond to the data reported in Table 2A for analysis of DC in all patients (K-ras negative and K-ras positive); Odds Ratio >1. -
Figures 6A-6F shows probability curves that correspond to the data reported in Table 2B for analysis of DC in all patients (K-ras negative and K-ras positive); Odds Ratio <1. -
Figures 7A-7C show probability curves that correspond to the data reported in Table 6A for analysis of ORR in K-ras negative patients; Odds Ratio >1. -
Figures 8A-8C show probability curves that correspond to the data reported in Table 6B for analysis of ORR in K-ras negative patients; Odds Ratio <1. -
Figures 9A-9E show probability curves that correspond to the data reported in Table 7A for analysis of DC in K-ras negative patients; Odds Ratio >1. -
Figures 10A-10D show probability curves that correspond to the data reported in Table 7B for analysis of DC in K-ras negative patients; Odds Ratio <1. - Each of Tables 1A, 1 B, 2A, 2B, 6A, 6B, 7A and 7B provides an Odds Ratio for each response indicator and gene listed in the table. The Odds Ratio reported for a gene is related to the overall slope of the probability curve shown in the corresponding Figure and is a measure of the change in the model-predicted probability of response for every unit change in normalized gene expression. As shown, genes with stronger odds ratios (further from 1) in the tables are depicted with steeper slopes in the figures.
- Unless defined otherwise, technical and scientific terms used herein have the same meaning as commonly understood by one of ordinary skill in the art to which this invention belongs. Singleton et al., Dictionary of Microbiology and Molecular Biology 2nd ed., J. Wiley & Sons (New York, NY 1994), and March, Advanced Organic Chemistry Reactions, Mechanisms and Structure 4th ed., John Wiley & Sons (New York, NY 1992), provide one skilled in the art with a general guide to many of the terms used in the present application.
- One skilled in the art will recognize many methods and materials similar or equivalent to those described herein, which could be used in the practice of the present invention. Indeed, the present invention is in no way limited to the methods and materials described. For purposes of the present invention, the following terms are defined below.
- The terms "k-ras" and "KRAS" as used herein (including in tables and figures) are used interchangeably and refer to the KRAS gene identified as of the date of this filing in the NCBI Entrez Gene database as Accession No. NM_004985.3 (Entrez Gene database, NCBI), and/or its expression products.
- As used herein, the term "KRAS status", refers to whether a patient's cancer is negative for an activating KRAS mutation (KRAS-negative) or positive for an activating KRAS mutation (KRAS-positive).
- As used herein, the term "activating KRAS mutation" refers to a mutation in a k-ras gene that results in constitutive activation of a protein encoded by k-ras, i.e. the k-ras protein activates molecules downstream in its signaling pathway in the absence of receptor bound ligand. As an example, the k-ras protein might activate downstream signaling in the absence of EGF, amphiregulin, or epiregulin binding to EGFR.
- As used herein, the term "EGFR-expressing cancer" refers to a cancer tumour with cells that express a cell surface epidermal growth factor receptor (EGFR) polypeptide.
- As used herein, the term "epidermal growth factor receptor" ("EGFR") refers to a gene that encodes a membrane polypeptide that binds, and is thereby activated by, epidermal growth factor (EGF). EGFR is also known in the literature as ERBB, ERBB1 and HER1. An exemplary EGFR is the human epidermal growth factor receptor (see Ullrich et al. (1984) Nature 309:418-425; Genbank accession number NP_005219.2). Binding of an EGF ligand activates the EGFR (e.g. resulting in activation of intracellular mitogenic signaling, autophosphorylation of EGFR). One of skill in the art will appreciate that other ligands, in addition to EGF, can bind to and activate the EGFR. Examples of such ligands include, but are not limited to, amphiregulin, epiregulin, TGF-α, betacellulin, and heparin-binding EGF (HB-EGF) (Strawn and Shawver (1998) Exp. Opin. Invest. Drugs 7(4)553-573, and "The Protein Kinase Facts Book: Protein Tyrosine Kinases" (1995) Hardie, et al. (eds.), Academic Press, NY, NY). See also, Oda et al. ((2005) Molec. Systems Biol. 1:2005.0010; and Moulder et al. ((2001) Cancer Res. 61:8887.
- As used herein, an "EGFR gene" refers to a nucleic acid that encodes an EGFR gene product, e.g., an EGFR mRNA, an EGFR polypeptide, and the like.
- As used herein, "EGFR inhibitor" refers to any agent capable of directly or indirectly inhibiting activation of an EGFR. EGFR inhibitors include agents that bind to an EGFR and inhibit its activation. EGFR inhibitors include antibodies that bind to an EGFR and inhibit activation of the EGFR; as well as small molecule tyrosine kinase inhibitors that inhibit activation of an EGFR. Antibodies to EGFR include IgG; IgM; IgA; antibody fragments that retain EGFR binding capability, e.g., Fv, Fab, F(ab)2, single-chain antibodies, and the like; chimeric antibodies; etc. Small molecule tyrosine kinase inhibitors of EGFR include EGFR-selective tyrosine kinase inhibitors. Small molecule tyrosine kinase inhibitors of EGFR can have a molecular weight in a range of from about 50 Da to about 10,000 Da.
- The term "tumour," as used herein, refers to any neoplastic cell growth and proliferation, whether malignant or benign, and all pre-cancerous and cancerous cells and tissues.
- The terms "cancer" and "cancerous" refer to or describe the physiological condition in mammals that is typically characterized in part by unregulated cell growth. Examples of cancer include, but are not limited to, colorectal cancer, breast cancer, ovarian cancer, lung cancer, prostate cancer, hepatocellular cancer, gastric cancer, pancreatic cancer, cervical cancer, liver cancer, bladder cancer, cancer of the urinary tract, thyroid cancer, renal cancer, carcinoma, melanoma, brain cancer, non-small cell lung cancer, squamous cell cancer of the head and neck, endometrial cancer, multiple myeloma, rectal cancer, and esophageal cancer. In an exemplary embodiment, the cancer is colorectal cancer.
- As used herein, the term "pathology" of cancer includes all phenomena that compromise the well-being of the patient. This includes, without limitation, abnormal or uncontrollable cell growth, metastasis, interference with the normal functioning of neighboring cells, release of cytokines or other secretory products at abnormal levels, suppression or aggravation of inflammatory or immunological response, neoplasia, premalignancy, malignancy, invasion of surrounding or distant tissues or organs, such as lymph nodes, etc.
- The terms "subject," "individual," and "patient" are used interchangeably herein to refer to a mammal being assessed for treatment and/or being treated. In an embodiment, the mammal is a human. The terms "subject," "individual," and "patient" thus encompass individuals having cancer (e.g., colorectal cancer or other cancer referenced herein), including those who have undergone or are candidates for resection (surgery) to remove cancerous tissue (e.g., cancerous colorectal tissue or other cancer referenced herein).
- As used herein, the terms "treatment," "treating," and the like, refer to administering an agent, or carrying out a procedure (e.g., radiation, a surgical procedure, etc.), for the purposes of obtaining an effect. The effect may be prophylactic in terms of completely or partially preventing a disease or symptom thereof and/or may be therapeutic in terms of effecting a partial or complete cure for a disease and/or symptoms of the disease. "Treatment," as used herein, covers any treatment of a disease in a mammal, particularly in a human, and includes: (a) preventing the disease or a symptom of a disease from occurring in a subject which may be predisposed to the disease but has not yet been diagnosed as having it (e.g., including diseases that may be associated with or caused by a primary disease; (b) inhibiting the disease, i.e., arresting its development; and (c) relieving the disease, i.e., causing regression of the disease.
- As used herein in the context of patient response to an EGFR inhibitor treatment, the terms "beneficial response," "beneficial patient response," and "clinically beneficial response," "clinical benefit," and the like, are used interchangeably and refer to favorable patient response to a drug as opposed to unfavorable responses, i.e. adverse events. In individual patients, beneficial response can be expressed in terms of a number of clinical parameters, including loss of detectable tumour (complete response, CR), decrease in tumour size and/or cancer cell number (partial response, PR), tumour growth arrest (stable disease, SD), enhancement of anti-tumour immune response, possibly resulting in regression or rejection of the tumour; relief, to some extent, of one or more symptoms associated with the tumour; increase in the length of survival following treatment; and/or decreased mortality at a given point of time following treatment.. Continued increase in tumour size and/or cancer cell number and/or tumour metastasis is indicative of lack of beneficial response to treatment.
- In a population the clinical benefit of a drug, i.e. its efficacy can be evaluated on the basis of one or more endpoints. For example, analysis of overall response rate (ORR) classifies as responders those patients who experience CR or PR after treatment with drug. Analysis of disease control (DC) classifies as responders those patients who experience CR, PR or SD after treatment with drug.
- As is used herein, the term "progression free survival" refers to the time interval from treatment of the patient until the progression of cancer or death of the patient, whichever occurs first.
- As used herein, the term "responder" refers to a patient who has an EGFR-expressing cancer, and who exhibits a beneficial clinical response following treatment with an EGFR inhibitor.
- As used herein, the term "non-responder" refers to a patient who has an EGFR-expressing cancer, and who has not shown a beneficial response following treatment with an EGFR inhibitor.
- As used herein, the term "correlates," or "correlates with," and like terms, refers to a statistical association between instances of two events, where events include numbers, data sets, and the like. For example, when the events involve numbers, a positive correlation (also referred to herein as a "direct correlation") means that as one increases, the other increases as well. A negative correlation (also referred to herein as an "inverse correlation") means that as one increases, the other decreases. The correlation need not necessarily be a linear correlation and need not apply across the entire range of the variables.
- The term "tumour sample" as used herein means a sample comprising tumour material obtained from a cancerous patient. The term encompasses clinical samples, for example tissue obtained by surgical resection and tissue obtained by biopsy, such as for example a core biopsy or a fine needle biopsy. The term also encompasses samples comprising tumour cells obtained from sites other than the primary tumour, e.g., circulating tumour cells. The term encompasses cells that are the progeny of the patient's tumour cells, e.g. cell culture samples derived from primary tumour cells or circulating tumour cells. The term encompasses samples that may comprise protein or nucleic acid material shed from tumour cells in vivo, e.g. bone marrow, blood, plasma, serum, and the like. The term also encompasses samples that have been enriched for tumour cells or otherwise manipulated after their procurement and samples comprising polynucleotides and/or polypeptides that are obtained from a patient's tumour material.
- The terms "gene product" and "expression product" are used interchangeably herein in reference to a molecule produced using a gene's information. For example, a gene product or expression product would include RNA transcription products (transcripts) of the gene, including mRNA and the polypeptide translation products of such RNA transcripts, whether such product is modified post-translationally or not (e.g., unspliced RNA, a splice variant mRNA, RNA fragment, etc.). In addition, a gene product or expression product includes the polypeptide translation products of such RNA, whether such product is modified post-translationally or not (e.g., a splice variant polypeptide, etc.)
- As used herein, the term "normalized expression level" refers to an expression level of a response indicator gene relative to the level of an expression product of a reference gene(s).
- As used herein, the term "response indicator gene" refers to a gene, the expression of which correlates positively or negatively with beneficial patient response to EGFR inhibitor treatment. The expression of a response indicator gene may be measured by determining the expression level of an expression product of the response indicator gene.
- The term "increased expression" or "increased normalized expression" with regard to a gene or an RNA transcript (or other expression product, e.g., protein) is used to refer to the level of the transcript (or fragmented RNA) determined by normalization to the level of one or more reference mRNA(s), which might be all measured transcripts in the specimen, a single reference mRNA, or a particular reference set of mRNAs. A gene exhibits "increased expression" in a subpopulation of subjects when the normalized expression level of an RNA transcript (or its gene product) is higher in one clinically relevant subpopulation of patients (e.g., patients who are responsive to an EGFR inhibitor) than in a related subpopulation (e.g., patients who are not responsive to said EGF inhibitor). In the context of an analysis of a normalized expression level of a gene in tissue obtained from an individual subject, a gene is exhibits "increased expression" when the normalized expression level of the gene trends toward or more closely approximates the normalized expression level characteristic of such a clinically relevant subpopulation of patients. Thus, for example, when the gene analysed is a gene that shows increased expression in responsive subjects as compared to non-responsive subjects, then if the expression level of the gene in the patient sample trends toward a level of expression characteristic of a responsive subject, then the gene expression level supports a determination that the individual patient is likely to be a responder. Similarly, where the gene analysed is a gene that is increased in expression in non-responsive patients as compared to responsive patients, then if the expression level of the gene in the patient sample trends toward a level of expression characteristic of a non-responsive subject, then the gene expression level supports a determination that the individual patient will be non-responsive. Thus normalized expression of a given gene as disclosed herein can be described as being positively correlated with an increased likelihood of positive clinical response to chemotherapy or as being positively correlated with a decreased likelihood of a positive clinical response to chemotherapy.
- As used herein, the terms "label" and "detectable label" refer to a molecule capable of being detected, where such molecules include, but are not limited to, radioactive isotopes, fluorescers (fluorophores), chemiluminescers, chromophores, enzymes, enzyme substrates, enzyme cofactors, enzyme inhibitors, chromophores, dyes, metal ions, metal sols, ligands (e.g., biotin, avidin, strepavidin or haptens), intercalating dyes and the like. The term "fluorescer" or "fluorophore" refers to a substance or a portion thereof which is capable of exhibiting fluorescence in a detectable range.
- As used herein, the term "target nucleic acid region" or "target nucleic acid" refers to a nucleic acid with a "target sequence" to be detected (e.g., in a method involving nucleic acid hybridization and/or amplification). The target nucleic acid may be either single-stranded or double-stranded and may or may not include other sequences besides the target sequence (e.g., the target nucleic acid may or may not include nucleic acid sequences upstream or 5' flanking sequence, and may or may not include downstream or 3' flanking sequence. Where detection is by amplification, these other sequences in addition to the target sequence may or may not be amplified with the target sequence.
- The term "primer" or "oligonucleotide primer" as used herein, refers to an oligonucleotide which acts to initiate synthesis of a complementary nucleic acid strand when placed under conditions in which synthesis of a primer extension product is induced, e.g., in the presence of nucleotides and a polymerization-inducing agent such as a DNA or RNA polymerase and at suitable temperature, pH, metal ion concentration, and salt concentration. Primers are generally of a length compatible with their use in synthesis of primer extension products, and can be in the range of between about 8 nucleotides and about 100 nucleotides (nt) in length, such as about 10 nt to about 75 nt, about 15 nt to about 60 nt, about 15 nt to about 40 nt, about 18 nt to about 30 nt, about 20 nt to about 40 nt, about 21 nt to about 50 nt, about 22 nt to about 45 nt, about 25 nt to about 40 nt, and so on, e.g., in the range of between about 18 nt and about 40 nt, between about 20 nt and about 35 nt, between about 21 and about 30 nt in length, inclusive, and any length between the stated ranges. Primers can be in the range of between about 10-50 nucleotides long, such as about 15-45, about 18-40, about 20-30, about 21-25 nt and so on, and any length between the stated ranges. In some embodiments, the primers are not more than about 10, 12, 15, 20, 21, 22, 23, 24, 25, 26, 27, 28, 29, 30, 35, 40, 45, 50, 55, 60, 65, or 70 nucleotides in length. In this context, the term "about" may be construed to mean 1, 2, 3, 4, 5, 6, 7, 8, 9, 10, 11, 12, 13, 14, 15, 16, 17, 18, 19 or 20 more nucleotides either 5' or 3' from either termini or from both termini.
- Primers are in many embodiments single-stranded for maximum efficiency in amplification, but may alternatively be double-stranded. If double-stranded, the primer is in many embodiments first treated to separate its strands before being used to prepare extension products. This denaturation step is typically effected by heat, but may alternatively be carried out using alkali, followed by neutralization. Thus, a "primer" is complementary to a template, and complexes by hydrogen bonding or hybridization with the template to give a primer/template complex for initiation of synthesis by a polymerase, which is extended by the covalent addition of bases at its 3' end.
- A "primer pair" as used herein refers to first and second primers having nucleic acid sequence suitable for nucleic acid-based amplification of a target nucleic acid. Such primer pairs generally include a first primer having a sequence that is the same or similar to that of a first portion of a target nucleic acid, and a second primer having a sequence that is complementary to a second portion of a target nucleic acid to provide for amplification of the target nucleic acid or a fragment thereof. Reference to "first" and "second" primers herein is arbitrary, unless specifically indicated otherwise. For example, the first primer can be designed as a "forward primer" (which initiates nucleic acid synthesis from a 5' end of the target nucleic acid) or as a "reverse primer" (which initiates nucleic acid synthesis from a 5' end of the extension product produced from synthesis initiated from the forward primer). Likewise, the second primer can be designed as a forward primer or a reverse primer.
- As used herein, the term "probe" or "oligonucleotide probe", used interchangeable herein, refers to a structure comprised of a polynucleotide, as defined above, which contains a nucleic acid sequence complementary to a nucleic acid sequence present in the target nucleic acid analyte (e.g., a nucleic acid amplification product). The polynucleotide regions of probes may be composed of DNA, and/or RNA, and/or synthetic nucleotide analogs. Probes are generally of a length compatible with their use in specific detection of all or a portion of a target sequence of a target nucleic acid, and are in many embodiments in the range of between about 8 nt and about 100 nt in length, such as about 8 to about 75 nt, about 10 to about 74 nt, about 12 to about 72 nt, about 15 to about 60 nt, about 15 to about 40 nt, about 18 to about 30 nt, about 20 to about 40 nt, about 21 to about 50 nt, about 22 to about 45 nt, about 25 to about 40 nt in length, and so on, e.g., in the range of between about 18-40 nt, about 20-35 nt, or about 21-30 nt in length, and any length between the stated ranges. In some embodiments, a probe is in the range of between about 10-50 nucleotides long, such as about 15-45, about 18-40, about 20-30, about 21-28, about 22-25 and so on, and any length between the stated ranges. In some embodiments, the primers are not more than about 10, 12, 15, 20, 21, 22, 23, 24, 25, 26, 27, 28, 29, 30, 35, 40, 45, 50, 55, 60, 65, or 70 nucleotides in length. In this context, the term "about" may be construed to mean 1, 2, 3, 4, 5, 6, 7, 8, 9, 10, 11, 12, 13, 14, 15, 16, 17, 18, 19 or 20 more nucleotides either 5' or 3' from either termini or from both termini.
- Where a nucleic acid is said to hybridize to a recited nucleic acid sequence, hybridization is under stringent conditions. An example of stringent hybridization conditions is hybridization at 50°C or higher and 0.1×SSC (15 mM sodium chloride/1.5 mM sodium citrate). Another example of stringent hybridization conditions is overnight incubation at 42°C in a solution: 50 % formamide, 5 x SSC (150 mM NaCl, 15 mM trisodium citrate), 50 mM sodium phosphate (pH7.6), 5 × Denhardt's solution, 10% dextran sulfate, and 20 µg/ml denatured, sheared salmon sperm DNA, followed by washing the filters in 0.1 × SSC at about 65°C. Stringent hybridization conditions are hybridization conditions that are at least as stringent as the above representative conditions, where conditions are considered to be at least as stringent if they are at least about 80% as stringent, e.g., at least about 90% as stringent as the above specific stringent conditions.
- The term "computer-based system", as used herein refers to the hardware, software, and data storage system used to analyse information. The minimum hardware of a patient computer-based system comprises a central processing unit (CPU), input device, output device, and data storage device. A skilled artisan can readily appreciate that many of the currently available computer-based system are suitable for use in the present invention and may be programmed to perform the specific measurement and/or calculation functions of the methods as disclosed herein.
- To "record" data, programming or other information on a computer readable medium refers to a process for storing information, using any such methods as known in the art. Any convenient data storage structure may be chosen, based on the method and/or device used to access the stored information. A variety of data processor programs and formats can be used for storage, e.g. word processing text file, database format, etc.
- A "processor" or "computing system" or "computing device" references any hardware and/or software combination that will perform the functions required of it. For example, any processor herein may be a programmable digital microprocessor such as available in the form of an electronic controller, mainframe, server or personal computer (desktop or portable). Where the processor is programmable, suitable programming can be communicated from a remote location to the processor, or previously saved in a computer program product (such as a portable or fixed computer readable storage medium, whether magnetic, optical or solid state device based). For example, a magnetic medium or optical disk may carry the programming, and can be read by a suitable reader communicating with each processor at its corresponding station.
- Before the present invention and specific exemplary embodiments of the invention are described, it is to be understood that this invention is not limited to particular embodiments described, as such may, of course, vary. It is also to be understood that the terminology used herein is for the purpose of describing particular embodiments only, and is not intended to be limiting, since the scope of the present invention will be limited only by the appended claims.
- Where a range of values is provided, it is understood that each intervening value, to the tenth of the unit of the lower limit unless the context clearly dictates otherwise, between the upper and lower limit of that range and any other stated or intervening value in that stated range is encompassed within the invention. The upper and lower limits of these smaller ranges may independently be included in the smaller ranges is also encompassed within the invention, subject to any specifically excluded limit in the stated range. Where the stated range includes one or both of the limits, ranges excluding either both of those included limits are also included in the invention.
- As used herein and in the appended claims, the singular forms "a," "an," and "the" include plural referents unless the context clearly dictates otherwise. Thus, for example, reference to "a reference gene" includes a plurality of such genes and reference to "the EGFR inhibitor" includes reference to one or more EGFR inhibitors, and so forth. It is further noted that the claims may be drafted to exclude any optional element. As such, this statement is intended to serve as antecedent basis for use of such exclusive terminology as "solely," "only" and the like in connection with the recitation of claim elements, or use of a "negative" limitation.
- The publications discussed herein are provided solely for their disclosure prior to the filing date of the present application. Nothing herein is to be construed as an admission that the present invention is not entitled to antedate such publication by virtue of prior invention. Further, the dates of publication provided may be different from the actual publication dates which may need to be independently confirmed.
- The practice of the methods and compositions of the present disclosure will employ, unless otherwise indicated, conventional techniques of molecular biology (including recombinant techniques), microbiology, cell biology, and biochemistry, which are within the skill of the art. Such techniques are explained fully in the literature, such as, "Molecular Cloning: A Laboratory Manual", 2nd edition (Sambrook et al., 1989); "Oligonucleotide Synthesis" (M.J. Gait, ed., 1984); "Animal Cell Culture" (R.I. Freshney, ed., 1987); "Methods in Enzymology" (Academic Press, Inc.); "Handbook of Experimental Immunology", 4th edition (D.M. Weir & C.C. Blackwell, eds., Blackwell Science Inc., 1987); "Gene Transfer Vectors for Mammalian Cells" (J.M. Miller & M.P. Calos, eds., 1987); "Current Protocols in Molecular Biology" (F.M. Ausubel et al., eds., 1987); and "PCR: The Polymerase Chain Reaction", (Mullis et al., eds., 1994).
- Based on evidence of differential expression of a gene (e.g., as detected by assaying for an RNA transcript) in cancer cells that positively respond to an EGFR-inhibitor and non-responsive cancer cells, the present disclosure provides response indicator genes and gene modules. These response indicator genes and/or gene modules and associated information provided by the present disclosure allow physicians to make more intelligent treatment decisions, and to customize the treatment of EGFR-expressing cancer to the needs of individual patients, thereby maximizing the benefit of treatment and minimizing the exposure of patients to unnecessary treatments, which do not provide any significant benefits and often carry serious risks due to toxic side-effects.
- The response indicator genes and/or gene modules and associated information provided by the present disclosure have utility in the development of therapies to treat EGFR-expressing cancer and screening patients for inclusion in clinical trials that test the efficacy of EGFR inhibitors. Said genes and/or gene modules and association information may also be used to design or produce a reagent that modulates the level or activity of the gene's transcript (i.e., RNA transcript) or its expression product. Said reagents may include but are not limited to an antisense RNA, a small inhibitory RNA, a ribozyme, a monoclonal or polyclonal antibody.
- In various embodiments of the methods of the present disclosure, various technological approaches are available for determination of expression levels of the disclosed genes, including, without limitation, RT-PCR, microarrays, serial analysis of gene expression (SAGE) and nucleic acid sequencing, which will be discussed in detail below. In particular embodiments, the expression level of each gene may be determined in relation to various features of the expression products of the gene including exons, introns, protein epitopes and protein activity
- The present disclosure provides methods to predict the likelihood that a patient having an EGFR-expressing cancer will exhibit a beneficial response to an EGFR inhibitor therapy. Patients subject to such an assessment include: 1) patients who have an EGFR-expressing cancer and who have not yet undergone any treatment for the cancer; 2) patients who have an EGFR-expressing cancer and who have undergone complete or partial resection of the cancer, e.g., who have undergone surgical removal of cancerous tissues to the extent clinically possible; and 3) patients who have an EGFR-expressing cancer and who have been treated with a treatment regimen other than an EGFR inhibitor treatment regimen. Patients who are subject to a likelihood assessment as disclosed herein also include those whose cancer is KRAS-negative (e.g., patients who have a (KRAS-) tumour).
- It will be appreciated that the same patient sample, and even the same assay, may be used for both determining whether a cancer is an EGFR-expressing cancer and assessing the likelihood that the patient having an EGFR - expressing cancer will exhibit a beneficial response to an EGFR inhibitor cancer therapy. For example, the assay(s) used to determine whether the cancer is an EGFR-expressing cancer may be carried out at the same time as the assay(s) used to assess the likelihood that the patient having an EGFR -expressing cancer will exhibit a beneficial response to an EGFR inhibitor. Alternatively, the result of the assay(s) used to determine whether the cancer is an EGFR-expressing cancer may guide the decision as to whether and how to apply an additional assay(s) used to assess the likelihood that the patient having an EGFR -expressing cancer will exhibit a beneficial response to an EGFR inhibitor.
- EGFR-expressing cancers include cancers comprising cells that express an EGFR on their cell surface. Such cancers include, but are not limited to, breast cancer, lung cancer, colorectal cancer, renal cancer prostate cancer, brain cancer, liver cancer, pancreatic cancer, and head and neck cancer.
- A patient who is being assessed using the method disclosed in the present disclosure is one who may be considered for treatment with an EGFR inhibitor. EGFR inhibitors include, e.g., antibodies that bind to and inhibit EGFR, EGFR-selective tyrosine kinase inhibitors, and the like. EGFR inhibitors include, but are not limited to, cetuximab (Erbitux®) and panitumumab (Vectibix®), both monoclonal antibodies that block EGFR and EGFR-dependent cell growth; gefitinib (Iressa®; N-(3-chloro-4-fluoro-phenyl)-7-methoxy-6-(3-morpholin-4-ylpropoxy)quinazolin-4-amine); OSI774 (erlotinib, Tarceva®; N-(3-ethynylphenyl)-6,7-bis(2-methoxyethoxy) quinazolin-4-amine); and alpha-cyano-beta-methyl-N-[(trifluoromethoxy)phenyl]-propenamide (LFM-A12), all small molecule tyrosine kinase inhibitors; and the like. Erbitux is a registered trademark of Bristol-Myers Squibb Co. Vectibix is a registered trademark of Amgen, Inc. Iressa is a registered trademark of AstraZeneca. Tarceva is a registered trademark of Genentech, Inc.
- EGFR inhibitors also include EGFR tyrosine kinase inhibitors such as quinazolines, such as PD 153035 (Fry et al. (1994) Science 265:1093; and Traxler et al. (1997) J. Pharm. Belg. 52:1997), 4-(3-chloroanilino) quinazoline, or CP-358,774; pyrrolopyrimidines, such as CGP 59326, CGP 60261 and CGP 62706 (Traxler et al. (1997) J. Pharm. Belg. 52:1997); pyrazolopyrimidines (Strawn and Shawver (April 1998) Exp. Opin. Invest. Drugs 7:553-573); 4-(phenylamino)-7H-pyrrolo[2,3-d] pyrimidines (Traxler et al., (1996) J. Med. Chem 39:2285-2292); curcumin (diferuloyl methane) (Laxminarayana, et al., (1995), Carcinogen 16:1741-1745); 4,5-bis (4-fluoroanilino)phthalimide (Buchdunger et al. (1995) Clin. Cancer Res. 1:813-821; Dinney et al. (1997) Clin. Cancer Res. 3:161-168); tyrphostins containing nitrothiophene moieties (Brunton et al. (1996) Anti Cancer Drug Design 11:265-295); the protein kinase inhibitor ZD-1839 (AstraZeneca) (
U.S. Patent No. 5,770,599 ; Strawn and Shawver (April 1998) Exp. Opin. Invest. Drugs 7:553-573; and Woodburn et al. (1997) Abstract #4251, Proc. Am. Assoc. Cancer Res. 38:633); CP-358774 (Pfizer, Inc.) (Moyer et al. (1997) Cancer Res. 57:4838); PD-0183805 (Warner-Lambert); inhibitors as described in International patent applicationWO99/09016 WO98/43960 WO97/38983 (Warner Lambert WO99/06378 (Warner Lambert) WO99/06396 (Warner Lambert WO96/30347 WO96/33978 WO96/33977 WO96/33980 - The present disclosure provides methods to predict the likelihood that a patient having an EGFR-expressing cancer will exhibit a beneficial response to an EGFR inhibitor therapy. The methods generally involve determining a normalized expression level of a gene or gene product that correlates with EGFR inhibitor responsiveness. Genes that correlate with EGFR inhibitor responsiveness are referred to herein as "response indicator genes."
- As discussed in more detail below, a normalized level of one or more response indicator genes can be determined.
- Particular mutations in a k-ras gene result in constitutive activation of protein encoded by k-ras. The presence of such activating mutations correlates with patient response to EGFR inhibitor treatment. Khambata-Ford et al. (2007) Clin. Oncol. 25:3230; Lièvre et al. (2008) J. Clin. Oncol. 26:374;
WO 2006/086777 ; andWO 2007/001868 . Mutations in a k-ras gene that result in constitutive activation of the k-ras-encoded protein are referred to herein as "KRAS mutations" or "activating KRAS mutations." Detection of activating KRAS mutations can be carried out in conjunction with determination of normalized levels of one or more response indicator genes. Thus, the present disclosure provides methods to predict the likelihood that a patient will exhibit a beneficial response to treatment with an EGFR inhibitor, where the method involves: a) detecting a KRAS mutation in a tumour sample obtained from the patient; and b) determining a normalized level of a response indicator gene(s). - In carrying out a subject method, a level of a response indicator gene, or its gene product, in a tumour sample from a patient is assayed. The level of the response indicator gene, or its gene product, is then "normalized," generating a normalized expression level. A number of response indicator genes were identified. The normalized expression levels of these response indicator genes correlate, positively or negatively, with beneficial patient response to EGFR inhibitor treatment. Thus, normalized expression levels of one or more of these response indicator genes can be determined to assess the likelihood that a patient having an EGFR-expressing cancer will exhibit a beneficial response to an EGFR inhibitor therapy. Response indicator genes are identified as described in detail below and in the Examples.
- Response indicator genes of the present disclosure include: ATP5E, TITF1, CLTC, BRCA1, AREG, PTP4A3, EREG, VAV3, SATB2, CEACAM6, EGFR, CHN2, FGFR3, C13orf18, QPRT, AMACR1, CKMT2, ID1, SORBS1, SLC26A3, and ErbB3, and one or more of these may be measured in order to assess the likelihood of beneficial response. Normalized expression levels of each of these genes are positively correlated with beneficial response to EGFR inhibitor treatment. In other words, normalized expression levels of these genes positively correlate with likelihood that a patient will exhibit a beneficial response to EGFR inhibitor treatment.
- Response indicator genes of the present disclosure include: DUSP6, VDAC2, ANXA2P2, SERPINB1, NT5E, GPC3, DUSP4, PHLDA1, K-ras, DR5, VIL2, LAMC2, SFN, ANXA1, EPHA2, P14ARF, CA9, KRT17, p14ARF, Maspin, PLAUR, LAMA3, and GCNT3, and one or more of these may be measured in order to assess the likelihood of beneficial response. Normalized expression levels of each of these genes are negatively correlated with beneficial response to EGFR inhibitor treatment. In other words, normalized expression levels of these genes indicate a decreased likelihood that a patient will exhibit a beneficial response to EGFR inhibitor treatment.
- Response indicator genes of the present disclosure include: EGF, ADAM17, PTP4A3, ADAM15, QPRT, SATB2, RASSF1, VAV3, CEACAM6, EREG, AREG, TITF1, SORBS1, C13orf18, CKMT2, BTC, ATP5E, B.Catenin, CCNE1, EGFR, Bclx, BRCA1, CDC25B, CHN2, ID1, and SLC26A3, and one or more of these may be measured in order to assess the likelihood of beneficial response. Normalized expression levels of each of these genes are positively correlated with beneficial response to EGFR inhibitor treatment. In other words, normalized expression levels of these genes positively correlate with likelihood that a patient will exhibit a beneficial response to EGFR inhibitor treatment. These response indicator genes can be of particular interest in assessment of patients with KRAS-negative tumours.
- Response indicator genes of the present disclosure include: VDAC2, SERPINB1, PHLDA1, ANXA2P2, KRT17, EPHA2, DUSP4, CGA, CA9, Maspin, NEDD8, DUSP6, GPC3, NT5E, VIL2, and P14ARF, and one or more of these may be measured in order to assess the likelihood of beneficial response. Normalized expression levels of each of these genes are negatively correlated with beneficial response to EGFR inhibitor treatment. In other words, normalized expression levels of these genes indicate a decreased likelihood that a patient will exhibit a beneficial response to EGFR inhibitor treatment. These response indicator genes can be of particular interest in assessment of patients with KRAS-negative tumours.
- As described above, a number of response indicator genes were identified in multi-patient studies. Normalized levels of these indicator gene products can then be determined in an individual patient who has cancer and for whom treatment with an EGFR inhibitor is being contemplated. Depending on the outcome of the assessment, treatment with an EGFR inhibitor may be indicated, or an alternative treatment regimen may be indicated.
- In carrying out a subject assessment, a tumour sample comprising a response indicator gene is assayed for a level of a response indicator gene or gene product(s). The tumour sample can be obtained from a solid tumour, e.g., via biopsy, or from a surgical procedure carried out to remove a tumour; or from a tissue or bodily fluid that contains cancer cells.
- An expression level of a response indicator gene is normalized relative to the level of an expression product of a reference gene(s). Assessing the response likelihood is conducted by comparing the normalized expression level to a range of values of normalized expression levels of one or more reference genes in an EGFR-expressing cancer cell.
- Normalized expression level of one or more response indicator genes can be carried out to assess the likelihood that a patient will respond to EGFR inhibitor treatment. Thus, this disclosure provides that the normalized expression level of a single or multiple response indicator genes can be used to assess the likelihood that a patient will respond to EGFR inhibitor treatment. The analysis can be more stringent, e.g., the likelihood that a patient will exhibit a beneficial response to an EGFR inhibitor treatment by exhibiting a partial response or a complete response can be assessed. The analysis can be less stringent, e.g., the likelihood that a patient will exhibit a beneficial response to an EGFR inhibitor treatment by exhibiting disease control (DC) can be assessed.
- It will be appreciated that assessment of likelihood of beneficial response to EGFR inhibitor therapy can be conducted by determining normalized expression levels of a set of response indicator genes, i.e. two or more response indicator genes (e.g., 2, 3, 4, 5, 6, 7, 8, 9, 10, or more response indicator genes), or any combination of one or more sets of response indicator genes. The assessment can involve analysing expression levels of a combination of response indicator genes, and determining normalized expression levels of the combination of response indicator genes, where the response indicator gene products can include gene products that are positively correlated with clinical benefit and gene products that are negatively correlated with clinical benefit. For example, a normalized level of a first gene that positively correlates with beneficial response to EGFR inhibitor treatment, and a normalized level of a second gene that negatively correlates with beneficial response to EGFR inhibitor treatment, can be determined. The following are non-limiting examples of response indicator genes whose normalized levels can be used in combination, either alone or in combination with other multi-gene response indicator sets, to assess the likelihood of response to EGFR inhibitor treatment:
- Exemplary multi-gene sets including two genes: set 1: PHLDA1; PTP4A3; set 2: PHLDA1; AREG; set 3: PHLDA1; EREG set 4: CHN2; PTP4A3; set 5: PTP4A3; SATB2; set 6: EPHA2; AREG; set 7: EPHA2; EREG; set 8: EREG; PTP4A3 set 9: PTP4A3; SLC26A3; set 10: EREG; AREG; set 11: DUSP6; AREG; set 12: DUSP6; EREG; set 13: EGFR; EREG; set 14: SLC26A3; EREG; and set 15: SFN; EREG.
- Exemplary multi-gene sets including three genes: set 16: PHLDA1; PTP4A3; AREG; set 17: EGFR; PHLDA1; PTP4A3; set 18: PHLDA1; PTP4A3; SATB2; set 19: AREG; PHLDA1; PTP4A3; set 20: EGFR; PHLDA1; AREG; set 21: EREG; KRT17; PHLDA1; set 22: EREG; PHLDA1; PTP4A3; set 23: EREG; PHLDA1; SATB2; set 24: EREG; PHLDA1; SORBS1; set 25: KRT17; PHLDA1; AREG; set 26: PHLDA1; SATB2; AREG; set 27: AREG; CEACAM6; PHLDA1; set 28: AREG; EGFR; PHLDA1; set 29: DUSP6; PTP4A3; SORBS1; set 30: EGFR; EPHA2; PTP4A3; set 31: EGFR; EREG; PHLDA1; set 32: EREG; KRT17; PTP4A3; set 33: PHLDA1; PTP4A3; SORBS1; set 34: DUSP6; SORBS1; AREG; and set 35: AMACR1; EREG; AREG.
- Exemplary multi-gene sets including four genes: set 36: EREG; KRT17; PHLDA1; SORBS1; set 37: AREG; KRT17; PHLDA1; PTP4A3; set 38: EREG; KRT17; PHLDA1; PTP4A3; set 39: AREG; PHLDA1; PTP4A3; SATB2; set 40: EREG; PHLDA1; PTP4A3; SATB2; set 41: AREG; PHLDA1; PTP4A3; SORBS1; set 42: EREG; PHLDA1; PTP4A3; SORBS1; set 43: AREG; EGFR; PHLDA1; PTP4A3; set 44: KRT17; PHLDA1; SORBS1; AREG; set 45: KRT17; PHLDA1; SORBS1; EREG; set 46: CEACAM6; PHLDA1; PTP4A3; AREG; set 47: CEACAM6; PHLDA1; PTP4A3; EREG; set 48: EGFR; PHA2; PHLDA1; AREG; set 49: EGFR; PHA2; PHLDA1; EREG; set 50: EGFR; EREG; KRT17; PHLDA1; set 51: EGFR; EREG; PHLDA1; PTP4A3; set 52: EREG; KRT17; PHLDA1; PTP4A3; set 53: EPHA12; PHLDA1; PTP4A3; AREG; set 54: EPHA12; PHLDA1; PTP4A3; EREG; set 55: EREG; PHLDA1; PLAUR; STAB2; set 56: KRT17; PHLDA1; PTP4A3; SATB2; set 57: DUSP6; EREG; ID1; AREG; set 58: DUSP6; EPHA2; NT5E; AREG; set 59: DUSP6; EPHA2; NT5E; EREG; set 60: DUSP6; EREG; VIL2; AREG; set 61: DUSP6; EREG; VIL2; EREG; set 62: EPHA2; EREG; GPC3; AREG; set 63: EPHA2; EREG; ID1; AREG; and set 64: DUSP6; EREG; Maspin; AREG.
- Additional exemplary multi-gene sets are shown in the Tables 3 and 4. Those skilled in the art will appreciate that normalized levels of any combination of two or more response indicator genes (e.g., two or more response indicator genes as listed in Tables 1A, 1 B, 2A, 2B, 6A, 6B, 7A, and 7B) can be determined. It should be noted that, for any of the above-listed exemplary multi-gene sets that include AREG or EREG, AREG or EREG can be substituted with the average of the normalized AREG value and the normalized EREG value.
- Further exemplary multi-gene sets include the following sets (e.g., multi-gene sets 65-167) that include two or more genes. These exemplary multi-gene sets find particular use when KRAS mutation status of the subject is taken into account.
- Exemplary multi-gene sets including two genes: set 65: PHLDA1; PTP4A3; set 66: KRT17; PTP4A3; set 67: EREG; PHLDA1; set 68: AREG; PHLDA1; set 69: EREG; KRT17; set 70: AREG; KRT17; set 71: KRT17; SERPINB1; set 72: CEACAM6; PTP4A3; set 73: EREG; PTP4A3; set 74: KRT17; SORBS1; set 75: PHLDA1; SORBS1; set 76: SATB2; SERPINB1; set 77: aregereg; PHLDA1; set 78: SLC26A3; AREG; set 79: SLC26A3; EREG; set 80: DUSP6; AREG; set 81: DUSP6; EREG; set 81: VIL2; AREG; set 82: VIL2; EREG; set 83: DR5; AREG; set 84: DR5; EREG; set 85: EPHA2; AREG; set 86: EPHA2; EREG; set 87: EREG; NT5E; set 88: SATB2; AREG; and set 89: SATB2; EREG.
- Further exemplary multi-gene sets include the following sets that include three genes: set 90: DUSP6; EREG; SLC26A3; set 91: DUSP6; SLC26A3; EREG; set 92: DUSP6; SLC26A3; AREG; set 93: CA9; EREG; NT5E; set 94: CLTC; DUSP6; AREG; set 95: CLTC; DUSP6; EREG; set 96: DR5; SLC26A3; AREG; set 97: DR5; SCL26A3; EREG; set 98: DUSP6; VIL2; AREG; set 99: DUSP6; VIL2; EREG; set 100: EPHA2; EREG; SLC26A3; set 101: EREG; SLC26A3; VIL2; set 102: KIRT17; SLC26A3; EREG; set 103: KIRT17; SLC26A3; AREG; set 104: SLC26A3; VIL2; AREG; set 105: SLC26A3; VIL2; EREG; set 106: AREG; PHLDA1; PTP4A3; set 107: AREG; KRT17; PHLDA1; set 108: EREG; PHLDA1; SORBS1; set 109: EGFR; PHLDA1; PTP4A3; set 110: KRT17; PTP4A3; SORBS1; set 111: EREG; KRT17; PHLDA1; set 112: PHLDA1; PTP4A3; SORBS1; set 113: ERGF; EREG; PHLDA1; set 114: EREG; PHLDA1; SATB2; set 115: AREG; KRT17; PHLDA1; set 116: CEACAM6; PHLDA1; PTP4A3; set 117: EGFR; EHHA1; EREG; set 118: EREG; KRT17; SLC26A3; set 119: EREG; PHLDA1; PTP4A3; set 120: EREG; PHLDA1; QPRT; and set 121: PHLDA1; PTP4A3; SATB2.
- Further exemplary multi-gene sets include the following sets that include four genes: set 122: EREG; KRT17; PHDLA1; SORBS1; set 123: AREG; KRT17; PHLDA1; PTP4A3; set 124: DUSP6; EREG; KRT17; SORBS1; set 125: AREG; KRT17; PHLDA1; PTP4A3; set 126: AREG; KRT17; PHLDA1; PTP4A3; set 127: AREG; PHLDA1; PTP4A3; SORBS1; set 128: AREG; EGFR; EPHA2; PHLDA1; set 129: AREG; CEACAM6; KRT17; SORBS1; set 130: AREG; CEACAM6; KRT17; SORBS1; set 131: AREG; EGFR; KRT17; PHLDA1; set 132: AREG; KRT17; PHLDA1; SORBS1; set 133: AREG; KRT17; PTP4A3; SORBS1; set 134: CEACAM6; EREG; PHDLA1; SORBS1; set 135: CEACAM6; KRT17; PHLDA1; PTP4A3; set 136: CEACAM6; KRT17; PTP4A3; SORBS1; set 137: EGFR; EPHA2; PHLDA2; PTP4A3; set 138: EGFR; EREG; KRT17; PHLDA1; set 139: EGFR; KRT17; PHLDA1; PTP4A3; set 140: EREG; KRT17; PTP4A3; SORBS1; set 141: EREG; LAMA3; PHLDA2; QPRT; set 142 EREG; PHLDA1; PTP4A3; QPRT; set 143: KRT17; PHLDA1; PTP4A3; SORBS1; set 144: KRT17; PTP4A3; SORBS1; VDAC2; set 145: AREG; DR5; DUSP6; SLC26A3; set 146: EREG; DR5; DUSP6; SLC26A3; set 147: AMACR1; AREG; DUSP6; SATB2; set 148: AREG, EREG, SLC26A3, DUSP6; set 149: AREG; CLTC; DUSP6; SLC26A3; set 150: EREG; CLTC; DUSP6; SLC26A3; set 151: AREG; DUSP6; KRT17; SLC26A3; set 152: EREG; DUSP6; KRT17; SLC26A3; and set 153: EGFR; EREG; SLC26A3; VIL2.
- Further exemplary multi-gene sets include the following sets that include five genes: set 154: AREG; EGFR; KRT17; PHLDA1; PTP4A3; set 155: AREG; KRT17; PHLDA1; PTP4A3; SORBS1; set 156: AREG; CEACAM6; KRT17; PHLDA1; SORBS1; set 157: EREG; CEACAM6; KRT17; PHLDA1; SORBS1; set 158: AREG; EGFR; KRT17; PHLDA1; PTP4A3; set 159: EREG; EGFR; KRT17; PHLDA1; PTP4A3; set 160: CEACAM6; KRT17; PHLDA1; PTP4A3; SORBS1 set 161: EREG; KRT17; HLDA1; PLAUR; SORBS1. set 162: DUSP6; EREG; QPRT; SLC26A3; VIL2.
- Exemplary multi-gene sets including six genes: set 163: AREG; EPHA2; KRT17; LAMC2; PHLDA1; PTP4A3.
- Exemplary multi-gene sets including seven genes: set 164: ANXA1; BRCA1; CHN2; PHLDA1; PTP4A3; SORBS1; AREG; set 165: ANXA1; BRCA1; CHN2; PHLDA1; PTP4A3; SORBS1; EREG; set 166: CEACAM6; KRT17; LAMA3; PHLDA1; PTP4A3; SORBS1; AREG; and set 167: CEACAM6; KRT17; LAMA3; PHLDA1; PTP4A3; SORBS1; EREG.
- The above-listed multi-gene sets (e.g., multi-gene sets 65-167) are particularly useful in combination with KRAS status, e.g., where the individual is negative for an activating KRAS mutation. The above-listed multi-gene sets are meant to be exemplary only. Those skilled in the art will appreciate that normalized levels of any combination of two or more response indicator genes (e.g., two or more response indicator genes as listed in Tables 1A, 1 B, 2A, 2B, 6A, 6B, 7A, and 7B) can be determined. Exemplary multi-gene sets are shown in the Tables 8 and 9. It should be noted that, for any of the above-listed exemplary multi-gene sets that include AREG or EREG, AREG or EREG can be substituted with the average of the normalized AREG value and the normalized EREG value.
- As noted above, the presence of an activating mutation in a k-ras gene (a "KRAS mutation") indicates reduced likelihood of a clinically beneficial response to an EGFR inhibitor. The presence or absence of an activating KRAS mutation can be assayed in conjunction with assaying an expression level of a response indicator gene, or its gene product, and determining a normalized expression level of a response indicator gene. Thus, the present disclosure provides methods for assessing the likelihood that a patient will exhibit a beneficial response to EGFR inhibitor treatment, where the method generally involves: a) determining a normalized level of a response indicator gene, or its gene product, in a sample obtained from a tumour sample from the patient; and b) detecting the presence or absence of an activating KRAS mutation. The method will in some cases include a step of assigning a probability of response based on the determined normalized expression level(s) of the one or more response indicator genes. For example, a subject method can involve: a) determining a normalized expression level of one or more response indicator genes in a sample obtained from cancer cells of a patient; b) determining a KRAS mutation status in a cancer cell from the patient; and, optionally, c) assigning a probability of response based on the determined normalized expression level(s) of the one or more response indicator genes.
- Detection of an activating KRAS mutation can be carried out in conjunction with determining a normalized level of a response indicator gene, or its gene product, where "in conjunction with" includes in the same or different sample, and at the same time or at a different time and/or location. For example, the presence or absence of an activating KRAS mutation can be detected in a sample (e.g., a sample comprising a polynucleotide obtained from a patient's cancer cell; or a sample comprising a patient's cancer cell); and a level of a response indicator gene, or its gene product, can be detected in the same sample at substantially the same time and in the same location (e.g., in the same laboratory). Alternatively, the presence or absence of an activating KRAS mutation can be detected in a sample (e.g., a sample comprising a polynucleotide obtained from a patient's cancer cell; or a sample comprising a patient's cancer cell); and a level of a response indicator gene, or its gene product, can be detected in the same sample at substantially the same time and in different locations (e.g., in different laboratories). As another example, the presence or absence of an activating KRAS mutation can be detected in a first sample (e.g., a sample comprising a polynucleotide obtained from a patient's cancer cell) at a first time; and a level of a response indicator gene, or its gene product, can be detected in a second sample (e.g., a sample comprising a polynucleotide obtained from a patient's cancer cell; or a sample comprising a patient's cancer cell) at a second time, where the first and second samples are assayed in the same location. As another example, Alternatively, the presence or absence of an activating KRAS mutation can be detected in a first sample (e.g., a sample comprising a polynucleotide obtained from a patient's cancer cell) at a first time; and a level of a response indicator gene, or its gene product, can be detected in a second sample (e.g., a sample comprising a polynucleotide obtained from a patient's cancer cell; or a sample comprising a patient's cancer cell) at a second time, where the first and second samples are assayed in different locations.
- For example, a "KRAS-positive" cancer cell is one that comprises an activating mutation in a k-ras gene; and a "KRAS-positive" patient is one who has a KRAS-positive cancer cell. Conversely, a "KRAS-negative" cancer cell is one that does not comprise an activation mutation in a k-ras gene. For example, a "KRAS-negative" tumour is one in which no activating KRAS mutations are detectable. A "KRAS-negative" patient is one who has a KRAS-negative tumour.
- Detection of a KRAS mutation in a tumour sample from the patient or in a sample obtained from a cancer cell from the patient involves detecting a KRAS mutation in a nucleic acid of a cancer cell present in the patient. It is possible, but not necessary, that all cancer cells in the patient comprise a KRAS mutation, e.g., a tumour can be heterogeneous with respect to KRAS mutation status. For example, the KRAS mutation may be present in less than 100%, less than 95%, less than 80%, less than 70%, less than 50%, or less than 25%, of the cancer cells present in the sample and/or in the patient. The presence of an activating KRAS mutation in any proportion of the cancer cells in the sample will indicate that the patient is not likely to respond to EGFR inhibitor treatment.
- The presence of an activating KRAS mutation in a k-ras gene of a cancer cell is negatively correlated with a clinically beneficial response to EGFR inhibitor treatment. Exemplary activating mutations are shown in Table 5. Other activating KRAS mutations are found in, e.g.,
WO 2006/086777 andWO 2007/001868 . - As an example, activating KRAS mutations include: 1) a G → T mutation at
position 216 of a k-ras nucleotide sequence (e.g., the nucleotide sequence set forth in GenBank Accession No. NM_033360.2); 2) a G→A mutation atposition 216 of a k-ras nucleotide sequence; 3) a G→C mutation atposition 216 of a k-ras nucleotide sequence; 4) a G→T mutation atposition 215 of a k-ras nucleotide sequence; 5) a G→A mutation atposition 215 of a k-ras nucleotide sequence; 6) a G→C mutation atposition 215 of a k-ras nucleotide sequence; and 7) a G→A mutation atposition 219 of a k-ras nucleotide sequence. An example of a KRAS-negative tumour is one that does not include any of the 7 mutations listed above, and shown in Table 5. - The presence of an activating KRAS mutation in a k-ras gene of a cancer cell correlates inversely with clinically beneficial response to EGFR inhibitor treatment.
- As noted above, detecting the presence or absence of an activating KRAS mutation can be carried out in combination with assessing a normalized level of a single response indicator gene product, or one or more response gene products, or one or more sets of response indicator gene products. The following are non-limiting examples of possible combinations: 1) KRAS mutation status; PHLDA1 normalized expression level detection; 2) KRAS mutation status; KRT17 normalized expression level detection; 3) KRAS mutation status; SERPINB1 normalized expression level detection; 4) KRAS mutation status; DUSP4 normalized expression level detection; 5) KRAS mutation status; ANXA2P2 normalized expression level detection; 6) KRAS mutation status; EPHA2 normalized expression level detection; 7) KRAS mutation status; PTP4A3 normalized expression level detection; 8) KRAS mutation status; EREG normalized expression level detection; 9) KRAS mutation status; AREG normalized expression level detection; 10) KRAS mutation status; QPRT normalized expression level detection; 11) KRAS mutation status; VAV3 normalized expression level detection; 12) KRAS mutation status; STAB2 normalized expression level detection; and 13) KRAS mutation status; CKMT2 normalized expression level detection.
- Additional possible combinations are shown in Tables 6A, 6B, 7A, and 7B.
- As noted above, detecting the presence or absence of an activating KRAS mutation (e.g., assessing KRAS mutation status) can be carried out in combination with assaying a normalized level of multiple (e.g., two, three, four, five, six, seven, or more) response indicator gene products. Various possible combinations are depicted in the Tables 8 and 9.
- Detection of an activating KRAS mutation can be carried out using any of a variety of methods. Numerous methods are known in the art for detection of sequence variations (polymorphisms and mutations) in nucleic acid samples, and can be used for detecting an activating KRAS mutation. Such methods include methods based on de novo sequencing of nucleic acids as well as methods designed to detect sequence variants (e.g., known variants) at a targeted position in the nucleic acid sequence. Sequence variants are detected using as probes or primers oligonucleotides that hybridize differentially to each variant. Many approaches have been developed to increase the selectivity of hybridization of sequence specific probes to targeted variants; the extent of hybridization is of the sequence specific probes is often detected based on detecting and/or quantifying the amount of product formed in a subsequent polymerase chain reaction.
- The present disclosure provides methods for determining whether an EGFR-expressing cancer is an EGFR inhibitor-responsive or EGFR inhibitor-non-responsive cancer. The methods generally involves: a) assaying a test sample obtained from an EGFR-expressing tumour sample of the patient and determining a normalized expression level of: i) a response indicator gene, or its gene product, that correlates positively with EGFR inhibitor responsiveness, wherein the positively correlating response indicator gene is one or more of ATP5E, TITF1, CLTC, BRCA1, AREG, PTP4A3, EREG, VAV3, SATB2, CEACAM6, EGFR, CHN2, FGFR3, C13orf18, QPRT, AMACR1, CKMT2, ID1, SORBS1, SLC26A3, and ErbB3; and/or ii) a response indicator gene, or its gene product, that correlates negatively with EGFR inhibitor responsiveness, wherein the negatively correlating response indicator is one or more of DUSP6, VDAC2, ANXA2P2, SERPINB1, NT5E, GPC3, DUSP4, PHLDA1, K-ras, DR5, VIL2, LAMC2, SFN, ANXA1, EPHA2, P14ARF, CA9, KRT17, p14ARF, Maspin, PLAUR, LAMA3, and GCNT3, wherein the normalized expression level of the one or more response indicator genes indicates that the EGFR-expressing cancer in a patient is likely to exhibit sensitivity or resistance to treatment with an EGFR inhibitor.
- The methods of the present disclosure are particularly useful when the EGFR-expressing cancer is a KRAS-negative cancer. The methods generally involve: a) assaying a test sample obtained from an EGFR-expressing tumour sample from the patient and determining a normalized expression level of: i) a response indicator gene, or its gene product, that correlates positively with EGFR inhibitor responsiveness, wherein the positively correlating response indicator gene is a product of one or more of EGF, ADAM17, PTP4A3, ADAM15, QPRT, SATB2, RASSF1, VAV3, CEACAM6, EREG, AREG, TITF1, SORBS1, C13orf18, CKMT2, BTC, ATP5E, beta-Catenin (also referred to herein as "B.Catenin"), CCNE1, EGFR, Bclx, BRCA1, CDC25B, CHN2, ID1, and SLC26A3; and/or ii) a response indicator gene, or its gene product, that correlates negatively with EGFR inhibitor responsiveness, wherein the negatively correlating response indicator gene is one or more of VDAC2, SERPINB1, PHLDA1, ANXA2P2, KRT17, EPHA2, DUSP4, CGA, CA9, Maspin, NEDD8, DUSP6, GPC3, NT5E, VIL2, and P14ARF, wherein the normalized expression level of the one or more response indicator genes indicates that the EGFR-expressing cancer in a patient is likely to exhibit sensitivity or resistance to treatment with an EGFR inhibitor.
- The method can involve determining a normalized expression level of a set of response indicator genes, where exemplary sets are described above. Also as described above, the method can also include determining the presence or the absence of an activating KRAS mutation in nucleic acid obtained from a EGFR-expressing tumour sample.
- The methods and compositions of the present disclosure will employ, unless otherwise indicated, conventional techniques of molecular biology (including recombinant techniques), microbiology, cell biology, and biochemistry, which are within the skill of the art. Exemplary techniques are explained fully in the literature, such as, "Molecular Cloning: A Laboratory Manual", 2nd edition (Sambrook et al., 1989); "Oligonucleotide Synthesis" (M.J. Gait, ed., 1984); "Animal Cell Culture" (R.I. Freshney, ed., 1987); "Methods in Enzymology" (Academic Press, Inc.); "Handbook of Experimental Immunology", 4th edition (D.M. Weir & C.C. Blackwell, eds., Blackwell Science Inc., 1987); "Gene Transfer Vectors for Mammalian Cells" (J.M. Miller & M.P. Calos, eds., 1987); "Current Protocols in Molecular Biology" (F.M. Ausubel et al., eds., 1987); and "PCR: The Polymerase Chain Reaction", (Mullis et al., eds., 1994).
- Methods of gene expression profiling include methods based on hybridization analysis of polynucleotides, methods based on sequencing of polynucleotides, and proteomics- based methods. Exemplary methods known in the art for the quantification of mRNA expression in a sample include northern blotting and in situ hybridization (Parker & Barnes, Methods in Molecular Biology 106:247-283 (1999)); RNAse protection assays (Hod, Biotechniques 13:852-854 (1992)); and PCR-based methods, such as reverse transcription PCT (RT-PCR) (Weis et al., Trends in Genetics 8:263-264 (1992)). Antibodies may be employed that can recognize sequence-specific duplexes, including DNA duplexes, RNA duplexes, and DNA-RNA hybrid duplexes or DNA-protein duplexes. Representative methods for sequencing-based gene expression analysis include Serial Analysis of Gene Expression (SAGE), and gene expression analysis by massively parallel signature sequencing (MPSS).
- Typically, mRNA is isolated from a test sample. The starting material is typically total RNA isolated from a human tumour, usually from a primary tumour. Optionally, normal tissues from the same patient can be used as an internal control. mRNA can be extracted from a tissue sample, e.g., from a sample that is fresh, frozen (e.g. fresh frozen), or paraffin-embedded and fixed (e.g. formalin-fixed).
- General methods for mRNA extraction are well known in the art and are disclosed in standard textbooks of molecular biology, including Ausubel et al., Current Protocols of Molecular Biology, John Wiley and Sons (1997). Methods for RNA extraction from paraffin embedded tissues are disclosed, for example, in Rupp and Locker, Lab Invest. 56:A67 (1987), and De Andrés et al., BioTechniques 18:42044 (1995). In particular, RNA isolation can be performed using a purification kit, buffer set and protease from commercial manufacturers, such as Qiagen, according to the manufacturer's instructions. For example, total RNA from cells in culture can be isolated using Qiagen RNeasy mini-columns. Other commercially available RNA isolation kits include MasterPure™ Complete DNA and RNA Purification Kit (EPICENTRE®, Madison, WI), and Paraffin Block RNA Isolation Kit (Ambion, Inc.). Total RNA from tissue samples can be isolated using RNA Stat-60 (Tel-Test). RNA prepared from tumour can be isolated, for example, by cesium chloride density gradient centrifugation.
- The sample containing the RNA is then subjected to reverse transcription to produce cDNA from the RNA template, followed by exponential amplification in a PCR reaction. The two most commonly used reverse transcriptase enzymes are avilo myeloblastosis virus reverse transcriptase (AMV-RT) and Moloney murine leukemia virus reverse transcriptase (MMLV-RT). The reverse transcription step is typically primed using specific primers, random hexamers, or oligo-dT primers, depending on the circumstances and the goal of expression profiling. For example, extracted RNA can be reverse-transcribed using a GeneAmp RNA PCR kit (Perkin Elmer, CA, USA), following the manufacturer's instructions. The derived cDNA can then be used as a template in the subsequent PCR reaction.
- PCR-based methods use a thermostable DNA-dependent DNA polymerase, such as a Taq DNA polymerase. For example, TaqMan® PCR typically utilizes the 5'-nuclease activity of Taq or Tth polymerase to hydrolyse a hybridization probe bound to its target amplicon, but any enzyme with equivalent 5' nuclease activity can be used. Two oligonucleotide primers are used to generate an amplicon typical of a PCR reaction product. A third oligonucleotide, or probe, can be designed to facilitate detection of a nucleotide sequence of the amplicon located between the hybridization sites the two PCR primers. The probe can be detectably labeled, e.g., with a reporter dye, and can further be provided with both a fluorescent dye, and a quencher fluorescent dye, as in a Taqman® probe configuration. Where a Taqman® probe is used, during the amplification reaction, the Taq DNA polymerase enzyme cleaves the probe in a template-dependent manner. The resultant probe fragments disassociate in solution, and signal from the released reporter dye is free from the quenching effect of the second fluorophore. One molecule of reporter dye is liberated for each new molecule synthesized, and detection of the unquenched reporter dye provides the basis for quantitative interpretation of the data.
- TaqMan® RT-PCR can be performed using commercially available equipment, such as, for example, ABI PRISM 7700™ Sequence Detection System™ (Perkin-Elmer-Applied Biosystems, Foster City, CA, USA), or Lightcycler (Roche Molecular Biochemicals, Mannheim, Germany). In a preferred embodiment, the 5' nuclease procedure is run on a real-time quantitative PCR device such as the ABI PRISM 7700™ Sequence Detection System™. The system consists of a thermocycler, laser, charge-coupled device (CCD), camera and computer. The system amplifies samples in a 96-well format on a thermocycler. During amplification, laser-induced fluorescent signal is collected in real-time through fiber optics cables for all 96 wells, and detected at the CCD. The system includes software for running the instrument and for analysing the data.
- 5'-Nuclease assay data are initially expressed as a threshold cycle ("Ct"). Fluorescence values are recorded during every cycle and represent the amount of product amplified to that point in the amplification reaction. The threshold cycle (Ct) is generally described as the point when the fluorescent signal is first recorded as statistically significant.
- To minimize errors and the effect of sample-to-sample variation, RT-PCR is usually performed using an internal standard. The ideal internal standard gene (also referred to as a reference gene) is expressed at a constant level among cancerous and non-cancerous tissue of the same origin (i.e., a level that is not significantly different among normal and cancerous tissues), and is not significantly unaffected by the experimental treatment (i.e., does not exhibit a significant difference in expression level in the relevant tissue as a result of exposure to chemotherapy). For example, reference genes useful in the methods disclosed herein should not exhibit significantly different expression levels in cancerous colon as compared to normal colon tissue. RNAs most frequently used to normalize patterns of gene expression are mRNAs for the housekeeping genes glyceraldehyde-3-phosphate-dehydrogenase (GAPDH) and β-actin. Exemplary reference genes used for normalization comprise one or more of the following genes: ATP5E, GPX1, PGK1, UBB, and VDAC2. Gene expression measurements can be normalized relative to the mean of one or more (e.g., 2, 3, 4, 5, or more) reference genes. Reference-normalized expression measurements can range from 0 to 15, where a one unit increase generally reflects a 2-fold increase in RNA quantity.
- Real time PCR is compatible both with quantitative competitive PCR, where internal competitor for each target sequence is used for normalization, and with quantitative comparative PCR using a normalization gene contained within the sample, or a housekeeping gene for RT-PCR. For further details see, e.g. Held et al., Genome Res. 6:986-994 (1996).
- The steps of a representative protocol for use in the methods of the present disclosure use fixed, paraffin-embedded tissues as the RNA source. mRNA isolation, purification, primer extension and amplification can be preformed according to methods available in the art. (see, e.g., Godfrey et al. J. Molec. Diagnostics 2: 84-91 (2000); Specht et al., Am. J. Pathol. 158: 419-29 (2001)). Briefly, a representative process starts with cutting about 10 µm thick sections of paraffin-embedded tumour tissue samples. The RNA is then extracted, and protein and DNA depleted from the RNA-containing sample. After analysis of the RNA concentration, RNA is reverse transcribed using gene specific primers followed by RT-PCR to provide for cDNA amplification products..
- PCR primers and probes can be designed based upon exon or intron sequences present in the mRNA transcript of the gene of interest. Primer/probe design can be performed using publicly available software, such as the DNA BLAT software developed by Kent, W.J., Genome Res. 12(4):656-64 (2002), or by the BLAST software including its variations.
- Where necessary or desired, repetitive sequences of the target sequence can be masked to mitigate non-specific signals. Exemplary tools to accomplish this include the Repeat Masker program available on-line through the Baylor College of Medicine, which screens DNA sequences against a library of repetitive elements and returns a query sequence in which the repetitive elements are masked. The masked intron sequences can then be used to design primer and probe sequences using any commercially or otherwise publicly available primer/probe design packages, such as Primer Express (Applied Biosystems); MGB assay-by-design (Applied Biosystems); Primer3 (Steve Rozen and Helen J. Skaletsky (2000) Primer3 on the WWW for general users and for biologist programmers. In: Rrawetz S, Misener S (eds.) Bioinformatics Methods and Protocols: Methods in Molecular Biology. Humana Press, Totowa, NJ, pp 365-386).
- Other factors that can influence PCR primer design include primer length, melting temperature (Tm), and G/C content, specificity, complementary primer sequences, and 3'-end sequence. In general, optimal PCR primers are generally 17-30 bases in length, and contain about 20-80%, such as, for example, about 50-60% G+C bases, and exhibit Tm's between 50 and 80 °C, e.g. about 50 to 70 °C.
- For further guidelines for PCR primer and probe design see, e.g. Dieffenbach, CW. et al, "General Concepts for PCR Primer Design" in: PCR Primer, A Laboratory Manual, Cold Spring Harbor Laboratory Press, New York, 1995, pp. 133-155; Innis and Gelfand, "Optimization of PCRs" in: PCR Protocols, A Guide to Methods and Applications, CRC Press, London, 1994, pp. 5-11; and Plasterer, T.N. Primerselect: Primer and probe design. Methods Mol. Biol. 70:520-527 (1997), the entire disclosures of which are hereby expressly incorporated by reference.
- Tables A and B provide further information concerning the primer, probe, and amplicon sequences associated with the Examples disclosed herein.
- In MassARRAY-based methods, such as the exemplary method developed by Sequenom, Inc. (San Diego, CA) following the isolation of RNA and reverse transcription, the obtained cDNA is spiked with a synthetic DNA molecule (competitor), which matches the targeted cDNA region in all positions, except a single base, and serves as an internal standard. The cDNA/competitor mixture is PCR amplified and is subjected to a post-PCR shrimp alkaline phosphatase (SAP) enzyme treatment, which results in the dephosphorylation of the remaining nucleotides. After inactivation of the alkaline phosphatase, the PCR products from the competitor and cDNA are subjected to primer extension, which generates distinct mass signals for the competitor- and cDNA-derived PCR products. After purification, these products are dispensed on a chip array, which is pre-loaded with components needed for analysis with matrix-assisted laser desorption ionization time-of-flight mass spectrometry (MALDI-TOF MS) analysis. The cDNA present in the reaction is then quantified by analysing the ratios of the peak areas in the mass spectrum generated. For further details see, e.g. Ding and Cantor, Proc. Natl. Acad. Sci. USA 100:3059-3064 (2003).
- Further PCR-based techniques that can find use in the methods disclosed herein include, for example, BeadArray® technology (Illumina, San Diego, CA; Oliphant et al., Discovery of Markers for Disease (Supplement to Biotechniques), June 2002; Ferguson et al., Analytical Chemistry 72:5618 (2000)); BeadsArray for Detection of Gene Expression® (BADGE), using the commercially
available Luminex 100 LabMAP® system and multiple color-coded microspheres (Luminex Corp., Austin, TX) in a rapid assay for gene expression (Yang et al., Genome Res. 11:1888-1898 (2001)); and high coverage expression profiling (HiCEP) analysis (Fukumura et al., Nucl. Acids. Res. 31 (16) e94 (2003). - Expression levels of a gene of interest can also be assessed using the microarray technique. In this method, polynucleotide sequences of interest (including cDNAs and oligonucleotides) are arrayed on a substrate. The arrayed sequences are then contacted under conditions suitable for specific hybridization with detectably labeled cDNA generated from mRNA of a test sample. As in the RT-PCR method, the source of mRNA typically is total RNA isolated from a tumour sample, and optionally from normal tissue of the same patient as an internal control or cell lines. mRNA can be extracted, for example, from frozen or archived paraffin-embedded and fixed (e.g. formalin-fixed) tissue samples.
- For example, PCR amplified inserts of cDNA clones of a gene to be assayed are applied to a substrate in a dense array. Usually at least 10,000 nucleotide sequences are applied to the substrate. For example, the microarrayed genes, immobilized on the microchip at 10,000 elements each, are suitable for hybridization under stringent conditions. Fluorescently labeled cDNA probes may be generated through incorporation of fluorescent nucleotides by reverse transcription of RNA extracted from tissues of interest. Labeled cDNA probes applied to the chip hybridize with specificity to each spot of DNA on the array. After washing under stringent conditions to remove non-specifically bound probes, the chip is scanned by confocal laser microscopy or by another detection method, such as a CCD camera. Quantitation of hybridization of each arrayed element allows for assessment of corresponding mRNA abundance.
- With dual color fluorescence, separately labeled cDNA probes generated from two sources of RNA are hybridized pair wise to the array. The relative abundance of the transcripts from the two sources corresponding to each specified gene is thus determined simultaneously. The miniaturized scale of the hybridization affords a convenient and rapid evaluation of the expression pattern for large numbers of genes. Such methods have been shown to have the sensitivity required to detect rare transcripts, which are expressed at a few copies per cell, and to reproducibly detect at least approximately two-fold differences in the expression levels (Schena et at, Proc. Natl. Acad. Sci. USA 93(2):106-149 (1996)). Microarray analysis can be performed by commercially available equipment, following manufacturer's protocols, such as by using the Affymetrix GenChip® technology.
- Serial analysis of gene expression (SAGE) is a method that allows the simultaneous and quantitative analysis of a large number of gene transcripts, without the need of providing an individual hybridization probe for each transcript. First, a short sequence tag (about 10-14 bp) is generated that contains sufficient information to uniquely identify a transcript, provided that the tag is obtained from a unique position within each transcript. Then, many transcripts are linked together to form long serial molecules, that can be sequenced, revealing the identity of the multiple tags simultaneously. The expression pattern of any population of transcripts can be quantitatively evaluated by determining the abundance of individual tags, and identifying the gene corresponding to each tag. For more details see, e.g. Velculescu et al., Science 270:484-487 (1995); and Velculescu et al., Cell 88:243-51 (1997).
- Nucleic acid sequencing technologies are suitable methods for analysis of gene expression. The principle underlying these methods is that the number of times a cDNA sequence is detected in a sample is directly related to the relative expression of the mRNA corresponding to that sequence. These methods are sometimes referred to by the term Digital Gene Expression (DGE) to reflect the discrete numeric property of the resulting data. Early methods applying this principle were Serial Analysis of Gene Expression (SAGE) and Massively Parallel Signature Sequencing (MPSS). See, e.g., S. Brenner, et al., Nature Biotechnology 18(6):630-634 (2000). More recently, the advent of "next-generation" sequencing technologies has made DGE simpler, higher throughput, and more affordable. As a result, more laboratories are able to utilize DGE to screen the expression of more genes in more individual patient samples than previously possible. See, e.g., J. Marioni, Genome Research 18(9):1509-1517 (2008); R. Morin, Genome Research 18(4):610-621 (2008); A. Mortazavi, Nature Methods 5(7):621-628 (2008); N. Cloonan, Nature Methods 5(7):613-619 (2008).
- Methods of isolating RNA for expression analysis from blood, plasma and serum (See for example, Tsui NB et al. (2002) 48,1647-53 and references cited therein) and from urine (See for example, Boom R et al. (1990) J Clin Microbiol. 28, 495-503 and reference cited therein) have been described.
- Immunochemical (also referred to herein as "immunological") methods are also suitable for detecting the expression levels of genes and applied to the method disclosed herein. Antibodies (e.g., monoclonal antibodies) that specifically bind a gene product of a gene of interest can be used in such methods. The antibodies can be detected by direct labeling of the antibodies themselves, for example, with radioactive labels, fluorescent labels, haptene labels such as, biotin, or an enzyme such as horse radish peroxidase or alkaline phosphatase. Alternatively, unlabeled primary antibody can be used in conjunction with a labeled secondary antibody specific for the primary antibody. Immunochemical protocols and kits are well known in the art and are commercially available. Exemplary suitable immunochemical methods include enzyme-linked immunosorbent assays, radioimmunoassays, protein blot methods (also referred to as "Western" blot methods), and enzyme immunoassays.
- The term "proteome" is defined as the totality of the proteins present in a sample (e.g. tissue, organism, or cell culture) at a certain point of time. Proteomics includes, among other things, study of the global changes of protein expression in a sample (also referred to as "expression proteomics"). Proteomics typically includes the following steps: (1) separation of individual proteins in a sample by 2-D gel electrophoresis (2-D PAGE); (2) identification of the individual proteins recovered from the gel, e.g. my mass spectrometry or N- terminal sequencing, and (3) analysis of the data using bioinformatics.
- The steps of a representative protocol for profiling gene expression using fixed, paraffin-embedded tissues as the RNA source, including mRNA isolation, purification, primer extension and amplification are provided in various published journal articles. (See, e.g., T.E. Godfrey et al,. J. Molec. Diagnostics 2: 84-91 (2000); K. Specht et al., Am. J. Pathol. 158: 419-29 (2001), M. Cronin, et al., Am J Pathol 164:35-42 (2004)). Briefly, a representative process starts with cutting a tissue sample section (e.g. about 10 µm thick sections of a paraffin-embedded tumour tissue sample). The RNA is then extracted, and protein and DNA are removed. After analysis of the RNA concentration, RNA repair is performed if desired. The sample can then be subjected to analysis, e.g., by reverse transcribed using gene specific promoters followed by RT-PCR.
- As discussed above, the expression level of a response indicator gene is normalized, thereby providing a normalized value. The expression level of a response indicator gene may be normalized relative to the level of an expression product of a reference gene(s).
- For example, the expression level of a response indicator gene can be normalized relative to the mean level of gene products of one or more reference genes. As an example, the expression level of a response indicator gene can be normalized relative to the mean level of gene products of all assayed genes, or a subset of the assayed genes, where a subset of the assayed genes can include 1, 2, 3, 4, 5, 6, 7, 8, 9, or more assayed genes.
- The expression level of a response indicator gene can be normalized relative to the mean level of the gene products of all of the genes, or a subset of the gene, listed in one or more of Table 1A, Table 1 B, Table 2A, Table 2B, Table 6A, Table 6B, Table 7A, and Table 7B. As one non-limiting example, the expression level of a response indicator gene can be normalized to the mean expression level of the following reference genes: ATP5E, PGK1, UBB, VDAC2, and GPX1. Those skilled in the art will readily appreciate that other combinations of genes can be used as reference genes for the purposes of determining a normalized level of a response indicator gene, or its gene product.
- Additional suitable reference genes include, but are not limited to, glyceraldehyde-3-phosphate dehydrogenase (GAPDH) (see, e.g., GenBank Accession No. NM_002046; phosphoglycerate kinase 1 (see, e.g., GenBank Accession No. NM_000291); lactate dehydrogenase A (see, e.g., GenBank Accession No. NM_005566); ribosomal protein L32 (see, e.g., GenBank Accession No. NM_000994); ribosomal protein S18 (see, e.g., GenBank Accession No. NM_022551); tubulin, beta polypeptide (TUBB) (see, e.g., GenBank Accession No. NM_001069); and beta actin (see, e.g., GenBank Accession No. NM_001101). See, e.g., Eisenberg and Levanon (2003) Trends in Genetics 19:362, for a list of additional suitable reference genes.
- The level of an RNA transcript as measured by TaqMan® RT-PCR refers to the cycle threshold (Ct) value. The lower the Ct, the greater the amount of mRNA present in the sample(Relative Quantitation Using Comparative Ct; Getting Started Guide, Applied Biosystems, Inc., Part Number 4364016 Rev. C, 11/2007). The expression value of a RNA transcript in a sample is normalized, e.g., by first determining the mean expression value in Ct of designated reference genes in a sample (CtRef). The normalized expression value for a gene (CtGene) is then calculated as CtGene -CtRef. Optionally, the normalized expression values for all genes can be adjusted, e.g., so that all adjusted normalized Ct have a value >0.
- A normalized level of a response indicator gene, or its gene product, determined for an individual patient can be compared to normalized expression level values for said response indicator gene determined in a population of patients for which the clinical outcome is already known in order to determine an individual patient's probability of beneficial response to EGFR inhibitor therapy. Normalized expression level values (e.g., expressed as Ct) correlated with a probability can be used. For example, a normalized level of a response indicator gene, or its gene product, can be compared graphically as shown in
Figures 3A-10D, to determine the probability of beneficial response to EGFR inhibitor therapy. - The analyses and determinations described herein in connection with a subject method for assessing likelihood of response can be made without the need for assessing any change in the level of a response indicator gene over time.
- As discussed above, the likelihood that a patient will exhibit a beneficial response to an EGFR inhibitor is assessed by determining a normalized expression level of a response indicator gene or set response indicator genes. The patient's likelihood of response to EGFR inhibitor treatment is provided in a report. The report may further include information regarding the patient's likelihood of response. For example, a subject method can further include a step of generating or outputting a report providing the results of a subject response likelihood assessment, which report can be provided in the form of an electronic medium (e.g., an electronic display on a computer monitor), or in the form of a tangible medium (e.g., a report printed on paper or other tangible medium).
- An assessment as to the likelihood that a patient having an EGFR-expressing cancer will respond to treatment with an EGFR inhibitor is referred to below as a "response likelihood assessment" or, simply, "likelihood assessment." A person or entity who prepares a report ("report generator") will also perform the likelihood assessment. The report generator may also perform one or more of sample gathering, sample processing, and data generation, e.g., the report generator may also perform one or more of: a) sample gathering; b) sample processing; c) measuring a level of an indicator response gene product(s); d) measuring a level of a reference gene product(s); e) detecting the presence or absence of an activating KRAS mutation; and f) determining a normalized level of a response indicator gene, or its gene product,(s). Alternatively, an entity other than the report generator can perform one or more sample gathering, sample processing, and data generation.
- The person or entity to whom a report is transmitted may be the same person or entity who does one or more of the following: a) collects a sample; b) processes a sample; c) provides a sample or a processed sample; and d) generates data (e.g., level of a response indicator gene, or its gene product,(s); level of a reference gene product(s); normalized level of a response indicator gene, or its gene product,(s)) for use in the likelihood assessment. In some cases, the person(s) or entity(ies) who provides sample collection and/or sample processing and/or data generation, and the person who receives the results and/or report may be different persons, but are both referred to as "users" or "clients" herein to avoid confusion.
- In embodiments where the user only executes a portion of the method, the individual who, after computerized data processing according to the methods of the invention, reviews data output (e.g., results prior to release to provide a complete report, a complete, or reviews an "incomplete" report and provides for manual intervention and completion of an interpretive report) is referred to herein as a "reviewer." The reviewer may be located at a location remote to the user (e.g., at a service provided separate from a healthcare facility where a user may be located).
- A "report," as described herein, is an electronic or tangible document which includes report elements that provide information of interest relating to a subject likelihood assessment and its results. A subject report includes at least a likelihood assessment, e.g., an indication as to the likelihood that a patient having an EGFR-expressing cancer will exhibit a beneficial clinical response to an EGFR inhibitor treatment regimen. A subject report can be completely or partially electronically generated. A subject report can further include one or more of: 1) information regarding the testing facility; 2) service provider information; 3) patient data; 4) sample data; 5) an interpretive report, which can include various information including: a) indication; b) test data, where test data can include: i) normalized level of one or more response indicator gene products; and/or ii) presence or absence of an activating KRAS mutation recommendations; and 6) other features.
- Where government regulations or other restrictions apply (e.g., requirements by health, malpractice, or liability insurance), all results, whether generated wholly or partially electronically, are subjected to a quality control routine prior to release to the user.
- The report can include information about the testing facility, which information is relevant to the hospital, clinic, or laboratory in which sample gathering and/or data generation was conducted. Sample gathering can include obtaining a cancer cell sample from a biopsy, a surgically removed tumour, surgically removed tissue comprising a tumour, or other tissue or bodily fluid from a patient. Data generation can include one or more of: a) measuring a level of a gene product(s) (e.g., an indicator response gene product(s), a reference gene product(s)); b) detecting the presence or absence of an activating KRAS mutation; and c) determination of a normalized level of an indicator response gene product. This information can include one or more details relating to, for example, the name and location of the testing facility, the identity of the lab technician who conducted the assay and/or who entered the input data, the date and time the assay was conducted and/or analysed, the location where the sample and/or result data is stored, the lot number of the reagents (e.g., kit, etc.) used in the assay, and the like. Report fields with this information can generally be populated using information provided by the user.
- The report can include information about the service provider, which may be located outside the healthcare facility at which the user is located, or within the healthcare facility. Examples of such information can include the name and location of the service provider, the name of the reviewer, and where necessary or desired the name of the individual who conducted sample gathering and/or data generation. Report fields with this information can generally be populated using data entered by the user, which can be selected from among pre-scripted selections (e.g., using a drop-down menu). Other service provider information in the report can include contact information for technical information about the result and/or about the interpretive report.
- The patient data can include patient medical history (which can include, e.g., data about prior treatment for cancer), personal history; administrative patient data (that is, data that are not essential to the likelihood assessment), such as information to identify the patient (e.g., name, patient date of birth (DOB), gender, mailing and/or residence address, medical record number (MRN), room and/or bed number in a healthcare facility), insurance information, and the like), the name of the patient's physician or other health professional who ordered the response likelihood assessment and, if different from the ordering physician, the name of a staff physician who is responsible for the patient's care (e.g., primary care physician). Report fields with this information can generally be populated using data entered by the user.
- The sample data can provide information about the biological sample analysed in the likelihood assessment, such as the source of biological sample obtained from the patient (e.g., tumour biopsy, surgically removed tumour, unknown, etc.) and the date and time collected. Report fields with this information can generally be populated using data entered by the user, some of which may be provided as pre-scripted selections (e.g., using a drop-down menu).
- The interpretive report portion of the report includes information generated after processing of the data as described herein. The interpretive report can include an indication of the likelihood that the patient will respond to treatment with an EGFR inhibitor. The interpretive report can include, for example, Indication (e.g., type of EGFR-expressing cancer, etc.); Result of screen for KRAS mutation (e.g., "Negative for mutations tested"); Result of normalized level of response indicator gene(s) (e.g., "normalized level of response indicator gene(s)"); Interpretation; and, optionally, Recommendation(s).
- The Interpretation portion of the report can include a Recommendation(s). Where the results indicate a likelihood of beneficial response to an EGFR inhibitor treatment, the recommendation can include a recommendation that an EGFR inhibitor regimen is indicated. Where the results indicate that a beneficial response to an EGFR inhibitor treatment is not likely, the recommendation can include a recommendation for an alternative treatment regimen.
- It will be readily appreciated that the report can include all or some of the elements above, with the proviso that the report generally includes at least the elements sufficient to provide the analysis requested by the user (e.g., likelihood assessment).
- It will also be readily appreciated that the reports can include additional elements or modified elements. For example, where electronic, the report can contain hyperlinks which point to internal or external databases which provide more detailed information about selected elements of the report. For example, the patient data element of the report can include a hyperlink to an electronic patient record, or a site for accessing such a patient record, which patient record is maintained in a confidential database. This latter embodiment may be of interest in an in-hospital system or in-clinic setting.
- The methods and systems described herein can be implemented in numerous ways. In one embodiment of particular interest, the methods involve use of a communications infrastructure, for example the internet. Several embodiments of the invention are discussed below. It is also to be understood that the present invention may be implemented in various forms of hardware, software, firmware, processors, or a combination thereof. The methods and systems described herein can be implemented as a combination of hardware and software. The software can be implemented as an application program tangibly embodied on a program storage device, or different portions of the software implemented in the user's computing environment (e.g., as an applet) and on the reviewer's computing environment, where the reviewer may be located at a remote site associated (e.g., at a service provider's facility).
- For example, during or after data input by the user, portions of the data processing can be performed in the user-side computing environment. For example, the user-side computing environment can be programmed to provide for defined test codes to denote a likelihood "score," where the score is transmitted as processed or partially processed responses to the reviewer's computing environment in the form of test code for subsequent execution of one or more algorithms to provide a results and/or generate a report in the reviewer's computing environment. The score can be a numerical score (representative of a numerical value) or a non-numerical score representative of a numerical value or range of numerical values (e.g., "A" representative of a 90-95% likelihood of an outcome).
- The application program for executing the algorithms described herein may be uploaded to, and executed by, a machine comprising any suitable architecture. In general, the machine involves a computer platform having hardware such as one or more central processing units (CPU), a random access memory (RAM), and input/output (I/O) interface(s). The computer platform also includes an operating system and microinstruction code. The various processes and functions described herein may either be part of the microinstruction code or part of the application program (or a combination thereof) which is executed via the operating system. In addition, various other peripheral devices may be connected to the computer platform such as an additional data storage device and a printing device.
- As a computer system, the system generally includes a processor unit. The processor unit operates to receive information, which can include test data (e.g., level of a response gene, level of a reference gene product(s); normalized level of a response gene; and may also include other data such as patient data. This information received can be stored at least temporarily in a database, and data analysed to generate a report as described above.
- Part or all of the input and output data can also be sent electronically; certain output data (e.g., reports) can be sent electronically or telephonically (e.g., by facsimile, e.g., using devices such as fax back). Exemplary output receiving devices can include a display element, a printer, a facsimile device and the like. Electronic forms of transmission and/or display can include email, interactive television, and the like. In an embodiment of particular interest, all or a portion of the input data and/or all or a portion of the output data (e.g., usually at least the final report) are maintained on a web server for access, preferably confidential access, with typical browsers. The data may be accessed or sent to health professionals as desired. The input and output data, including all or a portion of the final report, can be used to populate a patient's medical record which may exist in a confidential database at the healthcare facility.
- A system for use in the methods described herein generally includes at least one computer processor (e.g., where the method is carried out in its entirety at a single site) or at least two networked computer processors (e.g., where data is to be input by a user (also referred to herein as a "client") and transmitted to a remote site to a second computer processor for analysis, where the first and second computer processors are connected by a network, e.g., via an intranet or internet). The system can also include a user component(s) for input; and a reviewer component(s) for review of data, generated reports, and manual intervention. Additional components of the system can include a server component(s); and a database(s) for storing data (e.g., as in a database of report elements, e.g., interpretive report elements, or a relational database (RDB) which can include data input by the user and data output. The computer processors can be processors that are typically found in personal desktop computers (e.g., IBM, Dell, Macintosh), portable computers, mainframes, minicomputers, or other computing devices.
- The networked client/server architecture can be selected as desired, and can be, for example, a classic two or three tier client server model. A relational database management system (RDMS), either as part of an application server component or as a separate component (RDB machine) provides the interface to the database.
- In one example, the architecture is provided as a database-centric client/server architecture, in which the client application generally requests services from the application server which makes requests to the database (or the database server) to populate the report with the various report elements as required, particularly the interpretive report elements, especially the interpretation text and alerts. The server(s) (e.g., either as part of the application server machine or a separate RDB/relational database machine) responds to the client's requests.
- The input client components can be complete, stand-alone personal computers offering a full range of power and features to run applications. The client component usually operates under any desired operating system and includes a communication element (e.g., a modem or other hardware for connecting to a network), one or more input devices (e.g., a keyboard, mouse, keypad, or other device used to transfer information or commands), a storage element (e.g., a hard drive or other computer-readable, computer-writable storage medium), and a display element (e.g., a monitor, television, LCD, LED, or other display device that conveys information to the user). The user enters input commands into the computer processor through an input device. Generally, the user interface is a graphical user interface (GUI) written for web browser applications.
- The server component(s) can be a personal computer, a minicomputer, or a mainframe and offers data management, information sharing between clients, network administration and security. The application and any databases used can be on the same or different servers.
- Other computing arrangements for the client and server(s), including processing on a single machine such as a mainframe, a collection of machines, or other suitable configuration are contemplated. In general, the client and server machines work together to accomplish the processing of the present invention.
- Where used, the database(s) is usually connected to the database server component and can be any device which will hold data. For example, the database can be a any magnetic or optical storing device for a computer (e.g., CDROM, internal hard drive, tape drive). The database can be located remote to the server component (with access via a network, modem, etc.) or locally to the server component.
- Where used in the system and methods, the database can be a relational database that is organized and accessed according to relationships between data items. The relational database is generally composed of a plurality of tables (entities). The rows of a table represent records (collections of information about separate items) and the columns represent fields (particular attributes of a record). In its simplest conception, the relational database is a collection of data entries that "relate" to each other through at least one common field.
- Additional workstations equipped with computers and printers may be used at point of service to enter data and, in some embodiments, generate appropriate reports, if desired. The computer(s) can have a shortcut (e.g., on the desktop) to launch the application to facilitate initiation of data entry, transmission, analysis, report receipt, etc. as desired.
- The present disclosure also contemplates a computer-readable storage medium (e.g. CD-ROM, memory key, flash memory card, diskette, etc.) having stored thereon a program which, when executed in a computing environment, provides for implementation of algorithms to carry out all or a portion of the results of a response likelihood assessment as described herein. Where the computer-readable medium contains a complete program for carrying out the methods described herein, the program includes program instructions for collecting, analysing and generating output, and generally includes computer readable code devices for interacting with a user as described herein, processing that data in conjunction with analytical information, and generating unique printed or electronic media for that user.
- Where the storage medium provides a program which provides for implementation of a portion of the methods described herein (e.g., the user-side aspect of the methods (e.g., data input, report receipt capabilities, etc.)), the program provides for transmission of data input by the user (e.g., via the internet, via an intranet, etc.) to a computing environment at a remote site. Processing or completion of processing of the data is carried out at the remote site to generate a report. After review of the report, and completion of any needed manual intervention, to provide a complete report, the complete report is then transmitted back to the user as an electronic document or printed document (e.g., fax or mailed paper report). The storage medium containing a program according to the invention can be packaged with instructions (e.g., for program installation, use, etc.) recorded on a suitable substrate or a web address where such instructions may be obtained. The computer-readable storage medium can also be provided in combination with one or more reagents for carrying out response likelihood assessment (e.g., primers, probes, arrays, or other such kit components).
- The normalized expression levels of response indicator genes can be used in conducting a multivariate analysis so as to construct a multi-gene model useful in assessing a patient's likelihood of EGFR inhibitor treatment response. Thus, the present disclosure provides a method for conducting a multivariate analysis and/or constructing a multi-gene model.
- The method generally involves: a) assembling values of normalized expression levels of two or more response indicator gene products; b) determining whether a mathematical combination of the normalized expression levels of any combination of the response indicator genes is more indicative of a likelihood that a patient will respond to treatment with an EGFR inhibitor than the normalized expression level of any one of the response indicator genes individually; and c) using the mathematical combination to assess the likelihood that a patient will respond to treatment with a EGFR inhibitor (Ambroise C and McLachlan GJ (2002) Proc Nat ).
- The present disclosure provides treatment methods, which treatment methods generally involve treating an individual having an EGFR-expressing cancer with a treatment regimen that is selected based on the results of a response likelihood assessment as described herein.
- The present disclosure also provides a method for classifying a patient as a "responder" or a "non-responder" based on the results of a subject likelihood assessment. For example, the method involves assaying a test sample obtained from an EGFR-expressing cancer cell from a patient; and determining a normalized level of a gene product of a response indicator gene, as described above. The normalized level of the gene product(s) indicate whether the patient is likely to exhibit a clinically beneficial response to treatment with an EGFR inhibitor, thereby allowing classification of the patient as a "responder" or a "non-responder."
- The present disclosure provides arrays for use in carrying out a subject method to predict the likelihood of patient beneficial response to EGFR inhibitor treatment.
- The present disclosure provides an array for use in a subject method. A subject array includes a plurality of polynucleotides immobilized on the surface of an insoluble support. The immobilized polynucleotides comprise nucleotide sequences that are capable of hybridizing with a response indicator gene or a reference gene. As used herein, the term "hybridizing" refers to the complementary base-pairing interaction of one nucleic acid with another nucleic acid that results in formation of a duplex, triplex, or other higher-ordered structure. Typically, the primary interaction is base specific, e.g., A/T and G/C, by Watson/Crick hydrogen bonding. Base stacking and hydrophobic interactions can also contribute to duplex stability. Conditions for hybridizing detector probes and primers to complementary and substantially complementary target sequences are known in the art (see e.g., Nucleic Acid Hybridization, A Practical Approach, B. Hames and S. Higgins, eds., IRL Press, Washington, D.C. (1985) and Wetmur J and Davidson N (1968) Mol Biol 31, 349-37.
- For example, an immobilized polynucleotide comprises a nucleotide sequence that hybridizes to a response indicator gene selected from a gene listed in one of Table 1A, Table 1 B, Table 2A, Table 2B, Table 6A, Table 6B, Table 7A, and Table 7B, above. Nucleotide sequences of the aforementioned response indicator genes are known in the art. As such, generation of probes that hybridize under suitable hybridization conditions (e.g., stringent hybridization conditions) is well within the skill level of those of ordinary skill in the art.
- As an example, a subject array can comprise a probe that provides for detection of one or more gene product(s) encoded by a response indicator gene selected from: ATP5E, TITF1, CLTC, BRCA1, AREG, PTP4A3, EREG, VAV3, SATB2, CEACAM6, EGFR, CHN2, FGFR3, C13orf18, QPRT, AMACR1, CKMT2, ID1, SORBS1, SLC26A3, and ErbB3. As another example, a subject array can comprise a probe that provides for detection of one or more gene product(s) encoded by a response indicator gene selected from: DUSP6, VDAC2, ANXA2P2, SERPINB1, NT5E, GPC3, DUSP4, PHLDA1, K-ras, DR5, VIL2, LAMC2, SFN, ANXA1, EPHA2, P14ARF, CA9, KRT17, p14ARF, Maspin, PLAUR, LAMA3, and GCNT3. As yet another example, a subject array can comprise a probe that provides for detection of one or more gene product(s) encoded by a response indicator gene selected from ATP5E, TITF1, CLTC, BRCA1, AREG, PTP4A3, EREG, VAV3, SATB2, CEACAM6, EGFR, CHN2, FGFR3, C13orf18, QPRT, AMACR1, CKMT2, ID1, SORBS1, SLC26A3, ErbB3, DUSP6, VDAC2, ANXA2P2, SERPINB1, NT5E, GPC3, DUSP4, PHLDA1, K-ras, DR5, VIL2, LAMC2, SFN, ANXA1, EPHA2, P14ARF, CA9, KRT17, p14ARF, Maspin, PLAUR, LAMA3, and GCNT3.
- As yet another example, a subject array can comprise a probe that provides for detection of one or more gene product(s) encoded by a response indicator gene selected from EGF, ADAM17, PTP4A3, ADAM15, QPRT, SATB2, RASSF1, VAV3, CEACAM6, EREG, AREG, TITF1, SORBS1, C13orf18, CKMT2, BTC, ATP5E, B.Catenin, CCNE1, EGFR, Bclx, BRCA1, CDC25B, CHN2, ID1, SLC26A3, VDAC2, SERPINB1, PHLDA1, ANXA2P2, KRT17, EPHA2, DUSP4, CGA, CA9, Maspin, NEDD8, DUSP6, GPC3, NT5E, VIL2, and P14ARF. Such an array is particularly useful for predicting the likelihood that a patient having an KRAS-negative, EGFR-expressing cancer will exhibit a beneficial response to an EGFR inhibitor therapy.
- As yet another example, a subject array can comprise probes that provides for detection of the gene products of genes included in the above-listed multi-gene sets, or any combination of multi-gene sets (e.g., multi-gene sets 1-64 and 65-167, above).
- As noted above, in some cases, the presence or absence of an activating KRAS mutation will be detected. In these cases, one or more probes that provide for detection of known activating KRAS mutations are included in the array.
- The response indicator genes are represented in the array by probes immobilized on an insoluble support. The response indicator genes (as represented by immobilized probes) represent at least about 25% of the genes represented on the array. For examples, the response indicator gene represent at least about 25%, at least about 30%, at least about 35%, at least about 40%, at least about 50%, at least about 55%, at least about 60%, at least about 65%, at least about 70%, at least about 75%, at least about 80%, at least about 85%, at least about 90%, or at least about 95% of the gene represented on the array.
- A probe that hybridizes to a response indicator gene is referred to herein as a "response indicator gene probe." Response indicator gene probes are single stranded nucleic acids, having a length of from about 10 nucleotides (nt) to about 100 nt, e.g., from about 15 nt to about 50 nt, from about 15 nt to about 20 nt, from about 20 nt to about 25 nt, or from about 25 nt to about 30 nt. In this context, the term "about" may be construed to mean 1, 2, 3, 4, 5, 6, 7, 8, 9, 10, 11, 12, 13, 14, 15, 16, 17, 18, 19 or 20 more nucleotides either 5' or 3' from either termini or from both termini.
- A subject array comprises one or more response indicator gene probes immobilized on a surface of a solid (insoluble) support. A subject array can include two or more ("a plurality") of response indicator gene probes immobilized on a surface of a solid support. For example, a subject array can include 2, 3, 4, 5, 6, 7-10, 10-12, 12-15, 15-20, 20-25, 25-30, 30-35, 35-40, 40-45, 45-50, or more than 50, distinct response indicator gene probes immobilized on a surface of a solid support.
- A probe can be "addressable," e.g., the nucleotide sequence, or perhaps other physical or chemical characteristics, of a probe can be determined from its address, i.e. a one-to-one correspondence between the sequence or other property of the probe and a spatial location on, or characteristic of, the solid phase support to which it is attached. For example, an address of a probe can be a spatial location, e.g. the planar coordinates of a particular region containing copies of the probe.
- A subject array includes a solid phase support, which may be planar or a collection of microparticles, that carries or carry probes as described above fixed or immobilized, e.g., covalently, at specific addressable locations. For example, a subject array includes a solid phase support having a planar surface, which carries an plurality of nucleic acids, each member of the plurality comprising identical copies of an oligonucleotide or polynucleotide probe immobilized to a fixed region, which does not overlap with those of other members of the plurality. Typically, the nucleic acid probes are single stranded and are covalently attached to the solid phase support at known, determinable, or addressable, locations. The density of non-overlapping regions containing nucleic acids in a microarray is typically greater than 100 per cm2, e.g., greater than 1000 per cm2.
- The substrates of the subject arrays may be fabricated from a variety of materials. The materials from which the substrate is fabricated should ideally exhibit a low level of non-specific binding during hybridization events. In many situations, it will also be preferable to employ a material that is transparent to visible and/or UV light. For flexible substrates, materials of interest include: nylon, both modified and unmodified, nitrocellulose, polypropylene, and the like, where a nylon membrane, as well as derivatives thereof, is of particular interest in this embodiment. For rigid substrates, specific materials of interest include: glass; plastics, e.g. polytetrafluoroethylene, polypropylene, polystyrene, polycarbonate, and blends thereof, and the like; metals, e.g. gold, platinum, and the like; etc. Also of interest are composite materials, such as glass or plastic coated with a membrane, e.g. nylon or nitrocellulose, etc.
- Hybridization between a probe and a test nucleic acid (where a test nucleic acid includes a nucleic acid sample obtained from a cancer cell from a patient) results in a "readout," where "readout" refers to a parameter, or parameters, which are measured and/or detected that can be converted to a number or value. In some contexts, readout may refer to an actual numerical representation of such collected or recorded data. For example, a readout of fluorescent intensity signals from an array is the address and fluorescence intensity of a signal being generated at each hybridization site of the array; thus, such a readout may be registered or stored in various ways, for example, as an image of the array, as a table of numbers, or the like.
- The total number of spots on the substrate will vary depending on the number of different oligonucleotide probe spots (oligonucleotide probe compositions) one wishes to display on the surface, as well as the number of non probe spots, e.g., control spots, orientation spots, calibrating spots and the like, as may be desired depending on the particular application in which the subject arrays are to be employed. The pattern present on the surface of the array can include at least 2 distinct nucleic acid probe spots, at least about 5 distinct nucleic acid probe spots, at least about 10 distinct nucleic acid spots, at least about 20 nucleic acid spots, or at least about 50 nucleic acid spots.
- In some cases, it may be desirable to have each distinct probe spot or probe composition be presented in duplicate, i.e. so that there are two duplicate probe spots displayed on the array for a given target. In some cases, each target represented on the array surface is only represented by a single type of oligonucleotide probe. In other words, all of the oligonucleotide probes on the array for a give target represented thereon have the same sequence. In certain embodiments, the number of spots will range from about 200 to 1200. The number of probe spots present in the array can make up a substantial proportion of the total number of nucleic acid spots on the array, where in many embodiments the number of probe spots is at least about 25 number %, at least 50 number %, at least about 80 number %, or at least about 90 number % of the total number of nucleic acid spots on the array.
- A subject array can be prepared using any convenient methods and compositions. For example, one method of preparing an array is to first synthesize the oligonucleotides for each spot and then deposit the oligonucleotides as a spot on the support surface. The oligonucleotides may be prepared using any convenient methodology, where chemical synthesis procedures using phosphoramidite or analogous protocols in which individual bases are added sequentially without the use of a polymerase, e.g. such as is found in automated solid phase synthesis protocols, where such techniques are well known to those of skill in the art.
- Targets (e.g., a nucleic acid sample from a patient's cancer cell) may be generated by methods known in the art. mRNA can be labeled and used directly as a target, or converted to a labeled cDNA target. mRNA can be labeled non-specifically (randomly) directly using chemically, photochemically or enzymatically activated labeling compounds. An mRNA target can be labeled specifically in the sequences which are complementary to the probes. This specific labeling can be achieved by using covalent or non-covalent binding of additional labeled oligonucleotides to the target sequences which flank the probe complementary sequence or the complementary probe sequence. The hybridized fraction of labeled oligonucleotides with mRNA can be purified or separated from the non-hybridized fraction and then hybridized to the array. Methods for generating labeled cDNA probes are known in the art, and include the use of oligonucleotide primers and labeled nucleotide triphosphate(s). Primers that may be employed include oligo(dT), random primers, e.g. random hexamers and gene specific primers.
- Following preparation of the target nucleic acid from the tissue or cell of interest, the target nucleic acid is then contacted with the array under hybridization conditions, where such conditions can be adjusted, as desired, to provide for an optimum level of specificity in view of the particular assay being performed. Suitable hybridization conditions are well known to those of skill in the art and reviewed in Maniatis et al, supra, and
WO 95/21944 - Following hybridization, non-hybridized labeled nucleic acid is removed from the support surface, conveniently by washing, generating a pattern of hybridized nucleic acid on the substrate surface. A variety of wash solutions are known to those of skill in the art and may be used. Methods of detecting hybridization between a probe nucleic acid and a target nucleic acid include scintillation counting, autoradiography, fluorescence measurement, colorimetric measurement, light emission measurement, light scattering, and the like.
- Non-limiting examples of probes that would be suitable for inclusion in a subject array include the probe sequences set forth in the tables provided in
Figures 1 and2 . - A subject array can be used in a subject method to predict the likelihood that a patient will respond to an EGFR inhibitor treatment. Thus, the present disclosure provides a method to predict the likelihood that a patient having an EGFR-expressing cancer will exhibit a beneficial response to treatment with an EGFR inhibitor, where the method involves: (a) contacting an array comprising a plurality of distinct response indicator gene nucleic acid probes immobilized on a surface of a solid support with a nucleic acid sample from a cancer cell from the patient, to produce a sample contacted array; and (b) detecting hybridization between the immobilized probes and nucleic acids from the patient. Detection of hybridization provides for determination of a normalized level of a response indicator gene, or its gene product,, and therefore allows for an assessment as to the likelihood that the patient will exhibit a beneficial response to EGFR inhibitor treatment.
- The instant disclosure also provides methods of preparing a subject array. The methods generally involve immobilizing on a solid support one or more probes that provide for detection of nucleic acid products of at least two genes selected from: ATP5E, TITF1, CLTC, BRCA1, AREG, PTP4A3, EREG, VAV3, SATB2, CEACAM6, EGFR, CHN2, FGFR3, C13orf18, QPRT, AMACR1, CKMT2, ID1, SORBS1, SLC26A3, and ErbB3 and/or at least one gene selected from: DUSP6, VDAC2, ANXA2P2, SERPINB1, NT5E, GPC3, DUSP4, PHLDA1, K-ras, DR5, VIL2, LAMC2, SFN, ANXA1, EPHA2, P14ARF, CA9, KRT17, p14ARF, Maspin, PLAUR, LAMA3, and GCNT3, where the genes comprise at least 25% of the genes represented on the array.
- In some cases, a method of preparing a subject array involves immobilizing on a solid support one or more probes that provide for detection of nucleic acid products of at least two genes selected from: EGF, ADAM17, PTP4A3, ADAM15, QPRT, SATB2, RASSF1, VAV3, CEACAM6, EREG, AREG, TITF1, SORBS1, C13orf18, CKMT2, BTC, ATP5E, B.Catenin, CCNE1, EGFR, Bclx, BRCA1, CDC25B, CHN2, ID1, SLC26A3, VDAC2, SERPINB1, PHLDA1, ANXA2P2, KRT17, EPHA2, DUSP4, CGA, CA9, Maspin, NEDD8, DUSP6, GPC3, NT5E, VIL2, and P14ARF, where the genes comprise at least 25% of the genes represented on the array.
- The materials for use in the methods of the present invention are suited for preparation of kits produced in accordance with well known procedures. The invention thus provides kits comprising reagents, which may include gene-specific or gene-selective probes and/or primers useful for assaying the expression of genes disclosed herein and for assessing the likelihood of response to treatment with EGFR inhibitors.
- For example, a subject kit can include one or more nucleic acid probes that hybridize specifically to nucleic acid response indicator gene products. A subject kit can include, e.g., one or more nucleic acid probes, where each of the one or more probes hybridizes specifically to a different response indicator gene product. For example, a subject kit can include probes that hybridize specifically to nucleic acid products of response indicator genes set forth in one or more of Tables 1A, 1 B, 2A, 2B, 6A, 6B, 7A, and 7B. As another example, a subject kit can include a set of two or more nucleic acid probes, where each probe of the set hybridizes to a nucleic acid product of a different response indicator gene. For example, a subject kit can include a set of two, three, four, five, six, seven, or more, nucleic acid probes, where each probe of the set hybridizes to a nucleic acid product of a different member of a set of response indicator genes, where exemplary sets of response indicator genes are depicted in Tables 8 and 9. For example, a subject kit can comprise probes that provides for detection of the gene products of genes included in the above-listed multi-gene sets (e.g., multi-gene sets 1-64 and 65-167, above).
- In some cases, a subject kit will include, in addition to a probe that hybridizes specifically to a nucleic acid product of a response indicator gene, one or more probes that hybridize specifically to a reference gene product. Such probes can be used in determining normalized expression levels of a response indicator gene.
- A subject kit can include one or more nucleic acid primer pairs, where the primer pairs, when used as primers in a polymerase chain reaction, amplify a target nucleic acid response indicator gene product, or a target region of a nucleic acid response indicator gene product. A subject kit can include primer pairs for multiple response indicator genes. For example, a subject kit can include primer pairs that provides for amplification of the gene products of genes included in the above-listed multi-gene sets (e.g., multi-gene sets 1-64 and 65-167, above).
- Exemplary sequences of nucleic acid primers and probes are set forth in the tables provided in
Figures 1 and2 . Those skilled in the art will readily appreciate that other probe and primer sequences are also possible, and are readily obtained based on known nucleotide sequences of response indicator genes, and/or based on known nucleotide sequences of reference genes. - A subject kit can further include one or more nucleic acid probes that hybridize to target nucleic acids (e.g., nucleic acid from a cancer cell obtained from a patient) that may include one or more activating KRAS mutations.
- In addition to the above-mentioned probes and primers, a subject kit can comprise reagents for the extraction and/or isolation of RNA from tumour samples, in particular fixed paraffin-embedded tissue samples and/or reagents for preparing a cDNA copy of an mRNA, and/or reagents for nucleic acid amplification.
- Primers and probes can be designed based on known sequences of response indicator genes, and are readily synthesized by standard techniques, e.g., solid phase synthesis via phosphoramidite chemistry, as disclosed in
U.S. Pat. Nos. 4,458,066 and4,415,732 , incorporated herein by reference; Beaucage et al. (1992) Tetrahedron 48:2223-2311; and Applied Biosystems User Bulletin No. 13 (1 Apr. 1987). Other chemical synthesis methods include, for example, the phosphotriester method described by Narang et al., Meth. Enzymol. (1979) 68:90 and the phosphodiester method disclosed by Brown et al., Meth. Enzymol. (1979) 68:109. Poly(A) or poly(C), or other non-complementary nucleotide extensions may be incorporated into probes using these same methods. Hexaethylene oxide extensions may be coupled to probes by methods known in the art. Cload et al. (1991) J. Am. Chem. Soc. 113:6324-6326;U.S. Pat. No. 4,914,210 to Levenson et al. ; Durand et al. (1990) Nucleic Acids Res. 18:6353-6359; and Horn et al. (1986) Tet. Lett. 27:4705-4708. - A probe or a primer can include a detectable label. Exemplary labels include fluorochromes, e.g. fluorescein isothiocyanate (FITC), rhodamine, Texas Red, phycoerythrin, allophycocyanin, 6-carboxyfluorescein (6-FAM), 2',7'-dimethoxy-4',5'-dichloro-6-carboxyfluorescein (JOE), 6-carboxy-X-rhodamine (ROX), 6-carboxy-2',4',7',4,7-hexachlorofluorescein (HEX), 5-carboxyfluorescein (5-FAM), N,N,N',N'-tetramethyl-6-carboxyrhodamine (TAMRA), Cy5, Cy3, and the like; and radioactive labels (e.g., 32P, etc.).
- Probes and primers for inclusion in a subject kit include those useful in various amplification and/or detection systems. Exemplary amplification and/or detection systems include Sunrise™ primer-based systems, Molecular Beacons, the Taqman™ system, an Amplifluor™ hairpin primer-based system, a Scorpions technology (e.g., bi-functional molecules containing a PCR primer element covalently linked to a probe element), and a Light Upon Extension or LUX™-based system. Further exemplary detection systems include those based on a melt-curve analysis, and using intercalating dyes such as the fluorescent dye SYBR Green.
- The kits may optionally comprise reagent(s) with an identifying description or label or instructions relating to their use in the methods of the present invention. The kits may comprise containers (including microtiter plates suitable for use in an automated implementation of the method), each with one or more of the various reagents (typically in concentrated form) utilized in the methods of the invention, including, for example, pre-fabricated microarrays, buffers, the appropriate nucleotide triphosphates (e.g., dATP, dCTP, dGTP and dTTP; or rATP, rCTP, rGTP and UTP), reverse transcriptase, DNA polymerase, RNA polymerase, and one or more probes and primers of the present invention (e.g., appropriate length poly(T) or random primers linked to a promoter reactive with the RNA polymerase). Instructions for the use of mathematical algorithms used to assess the likelihood of patient response to EGFR inhibitors can also be included in a subject kit.
- The following examples are put forth so as to provide those of ordinary skill in the art with a complete disclosure and description of how to make and use the present invention, and are not intended to limit the scope of what the inventors regard as their invention nor are they intended to represent that the experiments below are all or the only experiments performed. Efforts have been made to ensure accuracy with respect to numbers used (e.g. amounts, temperature, etc.) but some experimental errors and deviations should be accounted for. Unless indicated otherwise, parts are parts by weight, molecular weight is weight average molecular weight, temperature is in degrees Celsius, and pressure is at or near atmospheric. Standard abbreviations may be used, e.g., bp, base pair(s); kb, kilobase(s); pl, picoliter(s); s or sec, second(s); min, minute(s); h or hr, hour(s); aa, amino acid(s); kb, kilobase(s); bp, base pair(s); nt, nucleotide(s); i.m., intramuscular(ly); i.p., intraperitoneal(ly); s.c., subcutaneous(ly); and the like.
- Gene products that can serve as predictors of response to an EGFR inhibitor ("response indicator genes") were identified by analysing normalized levels of gene products from tumours obtained from patients that had undergone cetuximab treatment for colon cancer. Expression levels of the gene products were measured; and normalized levels were determined relative to expression levels of one or more reference genes.
- Identification of an response indicator gene product was carried out by analysing gene expression levels in cancer cells from a number of patients for whom the following criteria applied: 1) the patients had cancer and were treated for the cancer with an EGFR inhibitor; and 2) the outcome of treatment was documented, i.e., the patients' response to treatment was documented.
- Nucleic acid from cancer cells from the patients was analysed to measure the expression level of a test gene(s) and a reference gene(s). The expression level of the test gene(s) was then normalized to the expression level of the reference gene(s), thereby generating a normalized expression level (a "normalized expression value") of the test gene. Normalization was carried out to correct for variation in the absolute level of gene product in a cancer cell.
- Finally, statistical correlations were made between normalized expression values of each gene and one or more measures of clinical outcome following EGFR inhibitor treatment that reflect a likelihood of response to treatment with an EGFR inhibitor. Directed by this univariate analysis, statistical methods were used to construct multi-gene models that are predictive of likelihood of response to EGFR inhibitor. The model is an algorithm (or equation) that can be used to produce a recurrence score or a response-to-treatment score for an individual patient that is strongly correlated with the likelihood of response to an EGFR inhibitor in the set of samples utilized for the analysis.
- The final algorithm can utilize various manipulations of the normalized expression values such as application of thresholds to the expression value (assigning maximum and/or minimum values to particular genes) grouping genes, taking the average value of genes in a group or weighting the genes within a group, weighting the group as a whole or some combination of the above.
-
- 1) Tissue from patients who consented to participate in one of the following studies: a) Clinical Protocol CA225045: "An Exploratory Pharmacogenomic Study of Erbitux Monotherapy in Patients with Metastatic Colorectal Carcinoma" (Khambata-Ford et al. (2007) 25: 3230-3237); b) IMCL CP02-0141: "Phase II Study of an Anti-Epidermal Growth Factor Receptor (EGFR) Antibody, Cetuximab, in Patients with Irinotecan-Refractory, Stage IV Colorectal Carcinoma" (Saltz et al. (2004) J. Clin. Oncol. 22: 1201-1208); c) IMCL CP02-0144: "A Phase II Multicentre Study of Erbitux (Cetuximab) in Patients with Metastatic Colorectal Carcinoma" (Lenz et al. (2006) J. Clin. Oncol. 24: 4914-4921);
- 2) Adequate tissue from the primary and/or metastatic site, defined as a minimum of three 5-micron sections on unstained slides
-
- a) Insufficient tumour in block as assessed by examination of H&E slide (<5% of total tissue on slide)
- b) EGFR inhibitor response data from clinical study is unknown
- c) Insufficient total RNA yield (<400 ng) extracted from available sections
- A total of 65 amplicons were tested representing cancer related genes, reference genes and KRAS mutation assays. The sequences of probes and primers used to assay each amplicon are provided in the table depicted in
Figure 1 ; and the sequences of the resulting amplicons are provided in the table depicted inFigure 2 . - A number of tumour samples were collected, e.g., from patients enrolled in clinical trials or from case studies where well-curated clinical outcome were available.
- A thin section of each tumour sample was hematoxylin & eosin (H&E) stained. The stained slide was used to evaluate the amount of tumour present. If the tumour amount was low, then macrodissection was carried out using the H&E slide as template. The H&E section was also used to confirm physician diagnosis.
- RNA was extracted from additional thin sections of the tumour.
- Quality control (QC) steps were carried out to confirm adequate RNA and to confirm the absence of contaminating DNA.
- An expression value for each test (and reference) gene was assayed using gene-specific probes and primers in quantitative reverse-transcription PCR. (e.g., TaqMan®), resulting in raw expression values (Ct).
- The raw Ct data were normalized, using, e.g., a set of 5 reference genes, resulting in normalized expression values (normalized Ct).
- Statistical correlations were made between normalized expression values of each gene and one or more measures of clinical outcome that reflect likelihood of recurrence (univariate analysis), or likelihood of response to EGFR inhibitor.
- Directed by the results of univariate analysis, statistical methods were used to construct multi-gene models that are predictive of likelihood of response to EGFR inhibitor. The model is an algorithm (or equation) that can be used to produce a recurrence score or a response-to-treatment score for an individual patient that is strongly correlated with the likelihood of response to an EGFR inhibitor in the set of samples utilized for the analysis.
- For normalization of extraneous effects, cycle threshold (CT) measurements obtained by RT-PCR were normalized relative to the mean expression of a set of five reference genes: ATP5E, PGK1, UBB, VDAC2, and GPX1. A one unit increase in normalized expression measurements generally reflects a 2-fold increase in RNA quantity.
- For each of the genes under study, we used univariate logistic regression models (SAS version 9.1.3) to examine the relationship between gene expression and overall response rate (ORR). For each logistic regression model, we generated a p-value under the likelihood ratio test of the hypothesis that the odds ratio is significantly different from one. The minimum false discovery rate (FDR) at which each null hypothesis could be rejected using the method of Benjamini and Hochberg (Benjamini, Y. and Hochberg, Y. (1995) J.R. Statist. Soc. B57:289) was also calculated as a conservative statistical adjustment for multiplicity. All analyses were repeated for the alternative endpoint: Disease Control (DC). To examine the relationship between gene expression and progression free survival (PFS), we used univariate Cox Regression models (SAS version 9.1.3). When examining these relationships gene expression levels were treated as continuous variables. PFS was defined as the time from study entry to the date of first evidence of progression for patients with documented progressive disease, or the date of death for patients who died within 90 days of their last tumour assessment without documented progression. Those who did not progress or die were censored at the date of the last tumour assessment. All hypothesis tests were reported using two-sided p-values, and unadjusted p-values of < 0.05 were considered statistically significant.
- Another useful measure of effect size is provided by plots of the predicted probabilities of disease control, estimated using logistic regression modeling, as a function of gene expression measurements. As examples,
Figures 3A-10D display plots of the predicted probability of disease control (on the y-axis) by normalized gene expression in CT units (on the x-axis). - Because KRAS mutation status is strongly associated with ORR, we chose to build multigene models in two ways 1) utilizing all patients in model building but including interaction terms between KRAS mutation status and individual gene expression and 2) using the subset of wild type patients (n=144) to identify genes beyond KRAS mutation status that would be predictive of response to cetuximab therapy. In the first scenario, we captured how the KRAS mutation status modifies the relationship of gene expression and outcome by including all possible one-way interaction terms between each individual gene and KRAS mutation status. We followed a supervised approach using only a subset of genes that were identified as significantly associated with outcome based on univariate analyses in all patients for
scenario 1. Similarly, we utilized a supervised approach using only a subset of genes that were identified as significantly associated with outcome based on univariate analyses in the subset of wild type patients inscenario 2. To build these models we performed two-layer 5-fold cross-validation separately forscenarios - Derivation of multivariate models was carried out according to the following steps:
- 1) The data were randomly partitioned into 5 equal subsets A-E (outer layer). 2) The data from 4 outer layer subsets were pooled (Subsets B-E in the example below) and these data were partitioned into 5 equal subsets a1-e1 (inner layer), reserving one outer layer subset (Subset A in the example below). 3) For each of the 5 inner layer subsets, cross validation of forward stepwise logistic regression models was performed in which the maximum number of genes allowed in the final model is 1, 2, 3, 4, 5, 6, 7, 8, 9, and 10 genes. Cross validation is performed as follows (using the example below):
- a. Training set (a1-d1) Test set (e1)
- b. Training set (b1-e1) Test set (a1)
- c. Training set (c1-a1) Test set (b1)
- d. Training set (d1-b1) Test set (c1)
- e. Training set (e1-c1) Test set (d1)
- 4) This resulted in 5 models with 1 gene, 5 models with 2 genes, etc.
- 5) From each of these models, the following model performance measure of the Test Set was obtained: AUC (Area under the receiver operating characteristic curve - used to evaluate the combined sensitivity and specificity of the model). 6) The median AUC of the Test Sets across the 5 models was obtained for each of the 1, 2, 3, 4, 5, 6, 7, 8, 9, and 10 models. 7) Sorting in ascending order by the number of genes in the model, the first median AUC maxima was picked to identify the optimal number of genes in the model. 8) Using the optimal number of genes identified through the inner layer, forward stepwise logistic regression was performed on the entire inner layer (a1-e1), fixing the number of genes in the final model to the optimal number of genes identified in
step 7. 8a) Using the model estimated from the full inner layer, the model was tested on the reserved outer layer (Subset A in the example below). 8b) The following model performance measures were obtained: AUC, sensitivity, and specificity.
- 9) This process was repeated 4 more times, reserving outer layer Subsets B, C, D, and E in a similar manner. This 2-layer process resulted in 5 models tested on the outer layer with the initial random partition of the data. Each of the 5 models had a different number of genes and different genes with different coefficients.
- The entire approach described in steps 1-9 was repeated fifty times with different random partitions of the outer layer data. This resulted in 250 models. The models derived for each of four analyses are shown in the Table 3 (all patients, ORR), Table 4(all patients, DC), Table 7 (KRAS-Negative patients, ORR) and Table 9 (KRAS-Negative patients, DC).
- Tables 1A and 1 B show genes whose normalized expression is correlated (univariate analysis) positively (Table 1A) or negatively (Table 1 B) with Overall Response Rate (ORR) in colon cancer patients treated with cetuximab.
Figures 3A-3D show probability curves that correspond to the data reported in Table 1A;Figures 4A-4F show probability curves that correspond to the data reported in Table 1 B.Table 1A Gene N Likelihood Ratio Chi-sq Likelihood Ratio p-value Odds Ratio Wald 95% CI for OR SATB2 226 18.9637 <0.0001 2.9534 (1.68,5.20) PTP4A3 225 26.0286 <0.0001 2.8221 (1.84,4.33) QPRT 226 23.0849 <0.0001 2.7047 (1.62,4.52) VAV3 226 20.3475 <0.0001 2.4744 (1.58,3.88) CEACAM6 226 9.733 0.0018 2.3749 (1.33,4.26) EREG 226 24.8105 <0.0001 2.0472 (1.48,2.82) ErbB3 226 4.5578 0.0328 2.0275 (1.04,3.97) EGFR 226 7.5416 0.006 2.015 (1.20,3.38) AREG 226 20.3261 <0.0001 2.0087 (1.44,2.81) BRCA1 226 5.1436 0.0233 1.955 (1.08,3.55) TITF1 226 9.245 0.0024 1.8605 (1.25,2.76) SORBS1 226 7.7284 0.0054 1.7668 (1.17,2.66) CHN2 226 7.7635 0.0053 1.5934 (1.15,2.21) C13orf18 226 7.664 0.0056 1.5249 (1.11,2.10) CKMT2 226 7.8393 0.0051 1.4147 (1.11,1.80) SLC26A3 226 7.4754 0.0063 1.304 (1.07,1.58) Table 1B Gene N Likelihood Ratio Chi-sq Likelihood Ratio p-value Odds Ratio Wald 95% CI for OR VDAC2 226 8.5381 0.0035 0.2000 (0.06,0.62) SERPINB1 226 19.1870 <0.0001 0.2276 (0.11,0.48) PHLDA1 226 29.6796 <0.0001 0.2467 (0.14,0.44) K-ras 226 10.8371 0.0010 0.2577 (0.11,0.60) ANXA2P2 226 13.9775 0.0002 0.2578 (0.12,0.55) GPC3 226 4.7438 0.0294 0.2591 (0.06,1.17) DUSP6 226 12.2004 0.0005 0.3275 (0.17,0.63) KRT17 226 18.7538 <0.0001 0.4037 (0.24,0.67) DUSP4 226 18.6992 <0.0001 0.4284 (0.28,0.66) EPHA2 226 10.3795 0.0013 0.4435 (0.26,0.75) DR5 226 6.1028 0.0135 0.4919 (0.28,0.88) PLAUR 226 4.7090 0.0300 0.5990 (0.38,0.96) LAMA3 226 6.8684 0.0088 0.6103 (0.42,0.89) LAMC2 226 5.3802 0.0204 0.6338 (0.43,0.94) ANXA1 226 3.8575 0.0495 0.6395 (0.41,1.01) CA9 226 8.3394 0.0039 0.6671 (0.49,0.90) Maspin 226 6.9632 0.0083 0.6891 (0.52,0.92) GCNT3 226 4.0035 0.0454 0.7833 (0.62,1.00) - Tables 2A and 2B show genes whose normalized expression is correlated (univariate analysis) positively (Table 2A) or negatively (Table 2B) with Disease Control in colon cancer patients treated with cetuximab.
Figures 5A-5E show probability curves that correspond to the data reported in Table 2A;Figures 6A-6F shows probability curves that correspond to the data reported in Table 2B.Table 2A Gene N Likelihood Ratio Chi-sq Likelihood Ratio p-value Odds Ratio Wald 95% CI for OR ATP5E 226 6.8380 0.0089 2.6122 (1.25,5.46) TITF1 226 14.1821 0.0002 2.6063 (1.33,5.11) CLTC 226 3.9206 0.0477 2.2407 (1.00,5.04) BRCA1 226 13.3432 0.0003 2.1392 (1.39,3.29) AREG 226 38.6000 <0.0001 1.9568 (1.55,2.48) PTP4A3 225 18.2969 <0.0001 1.8994 (1.39,2.60) EREG 226 43.3856 <0.0001 1.8979 (1.54,2.34) VAV3 226 25.3219 <0.0001 1.8784 (1.43,2.46) SATB2 226 18.0834 <0.0001 1.8534 (1.36,2.53) CEACAM6 226 10.7223 0.0011 1.8100 (1.24,2.63) EGFR 226 7.9284 0.0049 1.7682 (1.16,2.69) CHN2 226 9.2413 0.0024 1.4595 (1.14,1.87) FGFR3 226 4.8531 0.0276 1.4321 (1.03,1.98) C13orf18 226 12.3329 0.0004 1.4219 (1.16,1.75) QPRT 226 11.3648 0.0007 1.4045 (1.14,1.73) AMACR1 226 7.3968 0.0065 1.3774 (1.09,1.75) CKMT2 226 10.4841 0.0012 1.3646 (1.12,1.66) ID1 226 6.6866 0.0097 1.3422 (1.07,1.69) SORBS1 226 4.0375 0.0445 1.3366 (1.00,1.78) SLC26A3 226 12.3503 0.0004 1.2744 (1.11,1.46) Table 2B Gene N Likelihood Ratio Chi-sq Likelihood Ratio p-value Odds Ratio Wald 95% CI for OR DUSP6 226 28.9122 <0.0001 0.2867 (0.18,0.47) VDAC2 226 8.8433 0.0029 0.3326 (0.16,0.70) ANXA2P2 226 15.7199 0.0001 0.3762 (0.23,0.63) SERPINB1 226 17.4287 <0.0001 0.4071 (0.26,0.64) NT5E 226 25.7449 <0.0001 0.4798 (0.35,0.65) GPC3 226 5.5891 0.0181 0.4926 (0.25,0.96) DUSP4 226 25.0584 <0.0001 0.5403 (0.42,0.70) PHLDA1 226 14.7168 0.0001 0.5431 (0.39,0.75) K-ras 226 4.7480 0.0293 0.5510 (0.32,0.95) DR5 226 8.2890 0.0040 0.5640 (0.38,0.84) VIL2 226 5.4978 0.0190 0.5898 (0.38,0.93) LAMC2 226 11.8210 0.0006 0.6184 (0.46,0.82) SFN 226 7.5520 0.0060 0.6232 (0.44,0.88) ANXA1 226 7.5088 0.0061 0.6433 (0.46,0.89) EPHA2 226 6.0724 0.0137 0.6641 (0.48,0.93) P14ARF 226 7.2707 0.0070 0.6889 (0.52,0.92) CA9 226 11.8606 0.0006 0.7375 (0.62,0.88) KRT17 226 8.3190 0.0039 0.7385 (0.60,0.92) p14ARF 226 3.9325 0.0474 0.7580 (0.57,1.00) Maspin 226 7.9126 0.0049 0.7589 (0.62,0.92) - Table 3 presents a table that shows genes and gene combinations whose expression levels can be combined in multigene models that significantly correlate with Overall Response Rate in colon cancer patients treated with cetuximab. Note: "aregereg" is the average of the normalized AREG value and the normalized EREG value. Note: "MutInd" is the K-Ras mutation status indicator variable that is included as an interaction variable with each gene.
Table 3 (ORR) # Models % of Models Mean AUC SD AUC Median AUC Genes 1-Gene Models PTP4A3 18 64% 0.71 0.11 0.74 PHLDA1 6 21% 0.71 0.06 0.73 Aregereg 2 7% 0.67 0.05 0.67 EREG 2 8% 0.81 0.07 0.81 Total 28 11% 0.72 0.07 0.74 2-Gene Models PHLDA1 PTP4A3 64 52% 0.82 0.08 0.83 PHLDA1 aregereg 31 25% 0.86 0.05 0.85 EREG PHLDA1 18 15% 0.83 0.06 0.84 AREG PHLDA1 2 2% 0.84 0.10 0.84 CHN2 PTP4A3 2 2% 0.69 0.02 0.69 PTP4A3 SATB2 2 2% 0.66 0.03 0.66 Table 3 (ORR) # Models % of Models Mean AUC SD AUC Median AUC Genes EPHA2 aregereg 1 1% 0.76 . 0.76 EREG PTP4A3 1 1% 0.70 . 0.70 PTP4A3 SLC26A3 1 1% 0.74 . 0.74 Total 122 49% 0.77 0.06 0.77 3-Gene Models PHLDA1 PTP4A3 aregereg 10 19% 0.87 0.04 0.89 EGFR PHLDA1 PTP4A3 5 9% 0.83 0.06 0.85 PHLDA1 PTP4A3 SATB2 5 9% 0.76 0.03 0.77 AREG PHLDA1 PTP4A3 3 6% 0.91 0.04 0.89 EGFR PHLDA1 aregereg 3 6% 0.81 0.11 0.87 EREG KRT17 PHLDA1 3 6% 0.81 0.08 0.79 EREG PHLDA1 PTP4A3 3 6% 0.86 0.04 0.88 EREG PHLDA1 SATB2 3 6% 0.79 0.09 0.82 EREG PHLDA1 SORBS1 3 6% 0.82 0.02 0.81 KRT17 PHLDA1 aregereg 3 6% 0.82 0.05 0.79 MutInd_PTP4A3 PHLDA1 PTP4A3 2 4% 0.78 0.02 0.78 PHLDA1 SATB2 aregereg 2 4% 0.75 0.00 0.75 AREG CEACAM6 PHLDA1 1 2% 0.74 . 0.74 AREG EGFR PHLDA1 1 2% 0.79 . 0.79 DUSP6 PTP4A3 SORBS1 1 2% 0.52 . 0.52 EGFR EPHA2 PTP4A3 1 2% 0.76 . 0.76 EGFR EREG PHLDA1 1 2% 0.86 . 0.86 EREG KRT17 PTP4A3 1 2% 0.81 . 0.81 MutInd_DUSP6 MutInd_EGFR PTP4A3 1 2% 0.79 . 0.79 PHLDA1 PTP4A3 SORBS1 1 2% 0.82 . 0.82 Total 53 21% 0.80 0.05 0.80 4-Gene Models AREG EGFR PHLDA1 PTP4A3 3 13% 0.87 0.02 0.88 AREG MutInd_PTP4A3 PHLDA1 PTP4A3 3 13% 0.74 0.01 0.74 PHLDA1 PTP4A3 SATB2 aregereg 3 13% 0.81 0.12 0.84 PHLDA1 PTP4A3 SORBS1 aregereg 3 13% 0.79 0.07 0.79 KRT17 PHLDA1 SORBS1 aregereg 2 8% 0.82 0.05 0.82 CEACAM6 PHLDA1 PTP4A3 aregereg 1 4% 0.74 . 0.74 EGFR EPHA2 PHLDA1 aregereg 1 4% 0.73 . 0.73 EGFR EREG KRT17 PHLDA1 1 4% 0.76 . 0.76 EGFR EREG PHLDA1 PTP4A3 1 4% 0.82 . 0.82 EGFR KRT17 PHLDA1 PTP4A3 1 4% 0.73 . 0.73 EPHA2 PHLDA1 PTP4A3 aregereg 1 4% 0.69 . 0.69 EREG KRT17 PHLDA1 SORBS1 1 4% 0.79 . 0.79 EREG PHLDA1 PLAUR SATB2 1 4% 0.74 . 0.74 KRT17 MutInd_PTP4A3 PHLDA1 aregereg 1 4% 0.75 . 0.75 KRT17 PHLDA1 PTP4A3 SATB2 1 4% 0.83 . 0.83 Total 24 10% 0.77 0.06 0.78 5-Gene Models CEACAM6 KRT17 PHLDA1 SORBS1 aregereg 2 13% 0.84 0.10 0.84 PHLDA1 PTP4A3 SATB2 SORBS1 aregereg 2 13% 0.86 0.04 0.86 AREG EGFR EPHA2 PHLDA1 PTP4A3 1 7% 0.89 0.89 Table 3 (ORR) # Models % of Models Mean AUC SD AUC Median AUC Genes CEACAM6 EGFR KRT17 PHLDA1 aregereg 1 7% 0.80 . 0.80 CEACAM6 KRT17 PHLDA1 PTP4A3 SORBS1 1 7% 0.81 . 0.81 EGFR EPHA2 EREG PHLDA1 SATB2 1 7% 0.73 . 0.73 EGFR EREG KRT17 PHLDA1 SATB2 1 7% 0.81 . 0.81 EGFR EREG KRT17 PHLDA1 SORBS1 1 7% 0.77 . 0.77 EGFR KRT17 PHLDA1 PTP4A3 aregereg 1 7% 0.79 . 0.79 EGFR KRT17 PHLDA1 PTP4A3 SATB2 1 7% 0.71 . 0.71 EGFR PHLDA1 PTP4A3 SORBS1 aregereg 1 7% 0.83 . 0.83 EREG PHLDA1 QPRT SATB2 SORBS1 1 7% 0.57 . 0.57 KRT17 PHLDA1 SORBS1 aregereg . mutant_ind 1 7% 0.75 . 0.75 Total 15 6% 0.78 0.07 0.78 6-Gene Models AREG EGFR EPHA2 LAMA3 PHLDA1 PTP4A3 1 20% 0.88 . 0.88 AREG EGFR KRT17 PHLDA1 PTP4A3 SORBS1 1 20% 0.85 . 0.85 EGFR EPHA2 EREG PHLDA1 PLAUR SATB2 1 20% 0.72 . 0.72 KRT17 MutInd_DUSP6 MutInd_EGFR PTP4A3 SORBS1 aregereg 1 20% 0.92 . 0.92 KRT17 MutInd_PTP4A3 PHLDA1 PTP4A3 SORBS1 aregereg 1 20% 0.77 . 0.77 Total 5 2% 0.83 0.83 - Table 4 presents a table that shows genes and gene combinations whose expression levels can be combined in multigene models that significantly correlate with Disease Control in colon cancer patients treated with cetuximab. Note: "aregereg" is the average of the normalized AREG value and the normalized EREG value. Note: "MutInd" is the K-Ras mutation status indicator variable that is included as an interaction variable with each gene.
Table 4 (DCS) # Models % of Models Mean AUC SD AUC Median AUC Genes 1-Gene Models aregereg 22 65% 0.70 0.06 0.71 EREG 12 35% 0.72 0.05 0.72 Total 34 14% 0.71 0.05 0.71 2-Gene Models MutInd_EREG aregereg 73 61% 0.78 0.07 0.80 Table 4 (DCS) # Models % of Models Mean AUC SD AUC Median AUC Genes EREG MutInd_EREG 28 24% 0.78 0.06 0.80 DUSP6 aregereg 4 3% 0.73 0.03 0.73 DUSP6 EREGjh 3 3% 0.75 0.08 0.71 MutInd_EPHA2 aregereg 3 3% 0.78 0.05 0.75 EREG MutInd_EPHA2 2 2% 0.76 0.07 0.76 EPHA2 aregereg 1 1% 0.84 . 0.84 EREG MutInd_EGFR 1 1% 0.73 . 0.73 EREG MutInd_SLC26A3 1 1% 0.73 . 0.73 MutInd_EGFR aregereg 1 1% 0.91 . 0.91 MutInd- SFN aregereg 1 1% 0.79 . 0.79 MutInd- SLC26A3 aregereg 1 1% 0.80 . 0.80 Total 119 48% 0.78 0.06 0.78 3-Gene Models DUSP6 MutInd_EREG aregereg 27 42% 0.79 0.06 0.80 MutInd_EREG VIL2 aregereg 7 11% 0.80 0.02 0.81 DUSP6 EREG MutInd_EREG 6 9% 0.81 0.05 0.78 EPHA2 MutInd_EREG aregereg 5 8% 0.79 0.09 0.77 EREG MutInd_EREG MutInd_ID1 4 6% 0.80 0.05 0.81 EPHA2 EREG MutInd_EREG 2 3% 0.73 0.01 0.73 DR5 MutInd_EREG aregereg 1 2% 0.71 . 0.71 DUSP4 MutInd_EREG aregereg 1 2% 0.83 0.83 DUSP6 MutInd_SORBS1 aregereg 1 2% 0.82 . 0.82 EREG MutInd_AMACR1 MutInd_EREG 1 2% 0.71 . 0.71 EREG MutInd_BRCA1 MutInd_EREG 1 2% 0.74 . 0.74 EREG MutInd_EREG MutInd_GPC3 1 2% 0.63 . 0.63 EREG MutInd_EREG MutInd_PHLDAl 1 2% 0.71 . 0.71 EREG MutInd_EREG MutInd_SERPINB1 1 2% 0.77 . 0.77 EREG MutInd_EREG SFN 1 2% 0.78 . 0.78 EREG MutInd_EREG VIL2 1 2% 0.76 . 0.76 MutInd_AMACR1 MutInd_EREG aregereg 1 2% 0.69 . 0.69 MutInd_EREG MutInd_ID1 aregereg 1 2% 0.74 . 0.74 MutInd_EREG NT5E aregereg 1 2% 0.70 . 0.70 Total 64 26% 0.75 0.05 0.75 4-Gene Models DUSP6 MutInd_EREG MutInd_ID1 5 18% 0.78 0.09 0.79 MutInd_EREG MutInd_ID1 VIL2 3 11% 0.82 0.02 0.82 DUSP6 MutInd_AMACR1 MutInd_EREG 2 7% 0.87 0.04 0.87 DUSP6 MutInd_EREG MutInd_FGFR3 2 7% 0.76 0.01 0.76 DUSP6 MutInd_EREG 2 7% 0.76 0.03 0.76 MutInd_EREG MutInd_SERPINB1 VIL2 2 7% 0.84 0.07 0.84 CA9 DUSP6 MutInd_EREG aregereg 1 4% 0.86 . 0.86 DUSP6 EPHA2 NT5E aregereg 1 4% 0.69 . 0.69 DUSP6 EREG ID1 MutInd_EREG 1 4% 0.83 . 0.83 DUSP6 EREG MutInd_AMACR1 1 4% 0.86 . 0.86 DUSP6 EREG MutInd_EREG 1 4% 0.82 . 0.82 DUSP6 EREG MutInd_EREG 1 4% 0.83 . 0.83 DUSP6 EREG MutInd_EREG 1 4% 0.76 . 0.76 Table 4 (DCS) # Models % of Models Mean AUC SD AUC Median AUC Genes DUSP6 MutInd_EREG MutInd_LAMC2 1 4% 0.70 . 0.70 DUSP6 MutInd_EREG MutInd_Maspin 1 4% 0.69 . 0.69 DUSP6 MutInd_EREG VIL2 aregereg 1 4% 0.78 . 0.78 EPHA2 MutInd_EREG MutInd_GPC3 1 4% 0.72 . 0.72 EPHA2 MutInd_EREG MutInd_ID1 1 4% 0.74 . 0.74 Total 28 11% 0.78 0.04 0.78 5-Gene Models AMACR1 DUSP6 MutInd_EREG 1 33% 0.89 . 0.89 CA9 DUSP6 MutInd_EREG 1 33% 0.82 . 0.82 DUSP6 MutInd_EGFR MutInd_EREG 1 33% 0.79 . 0.79 Total 3 1% 0.83 . 0.83 6-Gene Models AMACR1 DUSP6 EREG MutInd_EREG 1 50% 0.67 . 0.67 DUSP6 EREG MutInd_EREG 1 50% 0.66 . 0.66 Total 2 1% 0.66 0.66 - We estimated a probability of each K-Ras SNP variant for each sample using a logistic model. The model was developed using samples from an external training dataset in which KRAS mutation status of each sample was known. The model was then applied to the colon cetuximab dataset. When the predicted probability of a mutation was greater than 0.5 the sample was classified as positive for the particular KRAS mutation variant. Overall, KRAS mutations were observed in 82 of the 226 cases in this study (36.3%).
- Table 5 presents a table that depicts activating KRAS mutations. Those tumours that tested positive for one or more of these mutations were classified KRAS-positive and all other tumours were classified KRAS-negative.
Table 5 - Tested Activating Mutations in KRAS Name Exon Position on NM_033360 KRAS Codon WT codon Event Mutant codon snp1 2 216 12 GGT G->T GTT snp2 2 216 12 GGT G->A GAT snp3 2 219 13 GGC G->A GAC snp4 2 215 12 GGT G->A AGT snp5 2 215 12 GGT G->T TGT snp6 2 215 12 GGT G->C CGT snp7 2 216 12 GGT G->C GCT - Tables 6A and 6B present tables that show genes for which the normalized expression is correlated (univariate analysis) positively (Table 6A) or negatively (Table 6B) with Overall Response Rate in KRAS-Negative colon cancer patients treated with cetuximab.
Figures 7A-7C show probability curves that correspond to the data reported in Table 6A;Figures 8A-8C show probability curves that correspond to the data reported in Table 6B.Table 6A Gene N Likelihood Ratio Chi-sq Likelihood Ratio p-value Odds Ratio Wald 95% CI for OR EGF 144 9.4751 0.0021 9.2269 (2.05,41.48) ADAM 17 144 6.4427 0.0111 3.0131 (1.22,7.42) PTP4A3 143 18.1613 <0.0001 2.5136 (1.59,3.97) ADAM 15 144 6.1496 0.0131 2.3126 (1.17,4.58) QPRT 144 13.2414 0.0003 2.2400 (1.32,3.79) SATB2 144 8.3216 0.0039 2.1358 (1.21,3.75) RASSF1 144 4.7588 0.0291 2.0634 (1.04,4.11) VAV3 144 9.8051 0.0017 1.9745 (1.24,3.15) CEACAM6 144 6.0508 0.0139 1.9605 (1.10,3.50) EREG 144 16.2494 0.0001 1.8354 (1.32,2.56) AREG 144 13.6972 0.0002 1.8113 (1.28,2.57) TITF1 144 5.7005 0.0170 1.6256 (1.09,2.42) SORBS1 144 4.2346 0.0396 1.5921 (1.01,2.50) C13orf18 144 4.1806 0.0409 1.3947 (1.00,1.95) CKMT2 144 6.3844 0.0115 1.3876 (1.08,1.79) Table 6B Gene N Likelihood Ratio Chi-sq Likelihood Ratio p-value Odds Ratio Wald 95% CI for OR VDAC2 144 5.3929 0.0202 0.2638 (0.08,0.85) SERPINB1 144 13.1397 0.0003 0.2651 (0.12,0.59) PHLDA1 144 18.6782 <0.0001 0.2794 (0.14,0.54) ANXA2P2 144 8.3899 0.0038 0.3144 (0.14,0.72) KRT17 144 14.1475 0.0002 0.4140 (0.24,0.72) EPHA2 144 6.8218 0.0090 0.4954 (0.28,0.86) DUSP4 144 10.6961 0.0011 0.5045 (0.32,0.80) CGA 144 4.6113 0.0318 0.6350 (0.40, 1.02) CA9 144 4.6837 0.0304 0.7263 (0.53,0.99) Maspin 144 4.1275 0.0422 0.7325 (0.54,1.00) - Tables 7A and 7B present tables that show genes for which the normalized expression is correlated (univariate analysis) positively (Table 7A) or negatively (Table 7B) with Disease Control in KRAS-Negative colon cancer patients treated with cetuximab.
Figures 9A-9E shows probability curves that correspond to the data reported in Table 7A;Figures 10A-10D shows probability curves that correspond to the data reported in Table 7B.Table 7A Gene N Likelihood Ratio Chi-sq Likelihood Ratio p-value Odds Ratio Wald 95% CI for OR BTC 144 5.3672 0.0205 6.1503 (1.07,35.43) ATP5E 144 9.0584 0.0026 3.9235 (1.55,9.94) ADAM 17 144 10.1802 0.0014 3.0447 (1.49,6.24) B.Catenin 144 8.5174 0.0035 2.7911 (1.36,5.72) EREG 144 47.5095 <0.0001 2.4680 (1.82,3.34) AREG 144 40.8964 <0.0001 2.4514 (1.77,3.40) CCNE1 144 4.0422 0.0444 2.4162 (0.95,6.13) SATB2 144 16.5332 <0.0001 2.3352 (1.49,3.66) EGFR 144 9.6293 0.0019 2.3261 (1.30,4.17) VAV3 144 21.8405 <0.0001 2.2939 (1.55,3.40) TITF1 144 8.0228 0.0046 2.2678 (1.05,4.88) PTP4A3 143 17.1734 <0.0001 2.2669 (1.47,3.48) CEACAM6 144 9.2498 0.0024 1.9068 (1.22,2.97) Bclx 144 5.5095 0.0189 1.8321 (1.09,3.09) BRCA1 144 5.0594 0.0245 1.7790 (1.06,2.98) C13orf18 144 13.0916 0.0003 1.6136 (1.23,2.13) CKMT2 144 11.7838 0.0006 1.5504 (1.18,2.04) CDC25B 144 5.0597 0.0245 1.4596 (1.04,2.04) CHN2 144 5.2658 0.0217 1.4339 (1.04,1.97) QPRT 144 5.7732 0.0163 1.3853 (1.05,1.82) ID1 144 5.1205 0.0236 1.3698 (1.04,1.81) SLC26A3 144 11.8812 0.0006 1.3611 (1.13,1.64) Table 7B Gene N Likelihood Ratio Chi-sq Likelihood Ratio p-value Odds Ratio Wald 95% CI for OR NEDD8 144 7.4988 0.0062 0.2196 (0.07,0.67) VDAC2 144 8.6138 0.0033 0.2504 (0.10,0.65) SERPINB1 144 16.9744 <0.0001 0.3055 (0.17,0.56) DUSP6 144 13.8060 0.0002 0.3191 (0.17,0.61) GPC3 144 6.6733 0.0098 0.3497 (0.13,0.94) ANXA2P2 144 7.6631 0.0056 0.4116 (0.21,0.79) NT5E 144 16.6993 <0.0001 0.4617 (0.31,0.69) DUSP4 144 17.4132 <0.0001 0.5194 (0.37,0.72) VIL2 144 4.1446 0.0418 0.5608 (0.32,0.99) PHLDA1 144 7.4036 0.0065 0.5656 (0.37,0.86) P14ARF 144 7.2519 0.0071 0.6121 (0.42,0.89) KRT17 144 8.3225 0.0039 0.6501 (0.48,0.88) CA9 144 6.8230 0.0090 0.7422 (0.59,0.93) Maspin 144 5.3058 0.0213 0.7451 (0.58,0.96) - Table 8 shows genes and gene combinations, the expression levels of which can be combined in multigene models to correlate with Overall Response Rate in KRAS-Negative colon cancer patients treated with Cetuximab. Note: "aregereg" is the average of the normalized AREG value and the normalized EREG value.
Table 8 (ORR) 1-gene # of Model s % of Models Mea n AUC SD AU C Media n AUC PTP4A3 40 71% 0.69 0.07 0.68 EREG 8 14% 0.62 0.08 0.64 PHLDA1 5 9% 0.65 0.11 0.65 aregereg 3 5% 0.70 0.10 0.70 Total 56 100% 0.66 0.09 0.67 2- gene PHLDA1 PTP4A3 45 46% 0.77 0.08 0.78 KRT17 PTP4A3 13 13% 0.72 0.09 0.76 EREG PHLDA1 10 10% 0.77 0.06 0.78 aregereg PHLDA1 9 9% 0.76 0.06 0.77 EREG KRT17 6 6% 0.75 0.08 0.74 aregereg KRT17 5 5% 0.68 0.16 0.73 AREG PHLDA1 3 3% 0.76 0.01 0.76 KRT17 SERPINB1 2 2% 0.58 0.04 0.58 CEACAM6 PTP4A3 1 1% 0.58 . 0.58 EREG PTP4A3 1 1% 0.70 . 0.70 KRT17 SORBS1 1 1% 0.60 . 0.60 PHLDA1 SORBS1 1 1% 0.53 . 0.53 SATB2 SERPINB1 1 1% 0.52 . 0.52 Total 98 100% 0.67 0.07 0.68 3-gene AREG PHLDA1 PTP4A3 7 13% 0.80 0.06 0.80 aregereg KRT17 PHLDA1 7 13% 0.85 0.06 0.86 aregereg PHLDA1 PTP4A3 5 10% 0.79 0.07 0.77 EREG PHLDA1 SORBS1 5 10% 0.69 0.06 0.71 EGFR PHLDA1 PTP4A3 4 8% 0.59 0.09 0.62 KRT17 PTP4A3 SORBS1 4 8% 0.62 0.12 0.58 aregereg KRT17 PTP4A3 3 6% 0.80 0.06 0.79 EREG KRT17 PHLDA1 3 6% 0.69 0.14 0.70 PHLDA1 PTP4A3 SORBS1 3 6% 0.73 0.12 0.67 EGFR EREG PHLDA1 2 4% 0.66 0.04 0.66 EREG PHLDA1 SATB2 2 4% 0.62 0.01 0.62 AREG KRT17 PHLDA1 1 2% 0.63 . 0.63 CEACAM6 PHLDA1 PTP4A3 1 2% 0.73 . 0.73 EGFR EPHA2 EREG 1 2% 0.65 . 0.65 EREG KRT17 SLC26A3 1 2% 0.47 . 0.47 EREG PHLDA1 PTP4A3 1 2% 0.71 . 0.71 EREG PHLDA1 QPRT 1 2% 0.58 . 0.58 PHLDA1 PTP4A3 SATB2 1 2% 0.66 . 0.66 Total 52 100% 0.68 0.08 0.68 4-gene EREG KRT17 PHLDA1 SORBS1 6 19% 0.76 0.10 0.74 AREG KRT17 PHLDA1 PTP4A3 2 6% 0.92 0.05 0.92 aregereg KRT17 PHLDA1 PTP4A3 2 6% 0.80 0.03 0.80 aregereg PHLDA1 PTP4A3 SATB2 2 6% 0.72 0.06 0.72 aregereg PHLDA1 PTP4A3 SORBS1 2 6% 0.84 0.12 0.84 Table 8 (ORR) DUSP6 EREG KRT17 SORBS1 2 6% 0.60 0.05 0.60 AREG EGFR EPHA2 PHLDA1 1 3% 0.74 0.74 aregereg CEACAM6 KRT17 SORBS1 1 3% 0.79 0.79 aregereg EGFR KRT17 PHLDA1 1 3% 0.78 0.78 aregereg KRT17 PHLDA1 SORBS1 1 3% 0.80 0.80 aregereg KRT17 PTP4A3 SORBS1 1 3% 0.84 0.84 CEACAM6 EREG PHLDA1 SORBS1 1 3% 0.81 0.81 CEACAM6 KRT17 PHLDA1 PTP4A3 1 3% 0.73 0.73 CEACAM6 KRT17 PTP4A3 SORBS1 1 3% 0.78 0.78 EGFR EPHA2 PHLDA1 PTP4A3 1 3% 0.63 0.63 EGFR EREG KRT17 PHLDA1 1 3% 0.74 0.74 EGFR KRT17 PHLDA1 PTP4A3 1 3% 0.69 0.69 EREG KRT17 PTP4A3 SORBS1 1 3% 0.57 0.57 EREG LAMA3 PHLDA1 QPRT 1 3% 0.57 0.57 EREG PHLDA1 PTP4A3 QPRT 1 3% 0.66 0.66 KRT17 PHLDA1 PTP4A3 SORBS1 1 3% 0.85 0.85 KRT17 PTP4A3 SORBS1 VDAC2 1 3% 0.77 0.77 Total 32 100% 0.74 0.07 0.74 5-gene AREG EGFR KRT17 PHLDA1 PTP4A3 1 11% 0.79 . 0.79 AREG KRT17 PHLDA1 PTP4A3 2 22% 0.87 0.10 0.87 aregereg CEACAM6 KRT17 PHLDA1 2 22% 0.76 0.10 0.76 aregereg EGFR KRT17 PHLDA1 PTP4A3 1 11% 0.80 . 0.80 aregereg EPHA2 KRT17 PTP4A3 1 11% 0.81 . 0.81 CEACAM6 KRT17 PHLDA1 PTP4A3 1 11% 0.69 . 0.69 EREG KRT17 PHLDA1 PLAUR SORBS1 1 11% 0.72 . 0.72 Total 9 100% 0.78 0.10 0.78 6-gene AREG EPHA2 KRT17 LAMC2 PHLDA1 1 100% 0.74 . . 7-gene ANXA1 BRCA1 CHN2 PHLDA1 PTP4A3 1 50% 0.44 . . CEACAM6 KRT17 LAMA3 PHLDA1 1 50% 0.76 . . Total 2 100% 0.60 - Table 9 presents a table that shows genes and gene combinations, the expression levels of which can be combined in multigene models to correlate with Disease Control in KRAS-Negative colon cancer patients treated with Cetuximab. Note: "aregereg" is the average of the normalized AREG value and the normalized EREG value.
Table 9 (DC) 1-Gene Models Aregereg 96 53% 0.81 0.08 0.82 EREG 84 47% 0.8 0.07 0.81 Total 180 100% 0.8 0.08 0.81 2-Gene Models SLC26A3 aregereg 12 29% 0.8 0.05 0.81 DUSP6 EREG 10 24% 0.78 0.08 0.76 DUSP6 aregereg 8 19% 0.84 0.05 0.84 EREG SLC26A3 5 12% 0.84 0.04 0.83 VIL2 aregereg 2 5% 0.83 0.07 0.83 DR5 aregereg 1 2% 0.78 . 0.78 EPHA2 aregereg 1 2% 0.71 . 0.71 EREG NT5E 1 2% 0.72 . 0.72 KRT17 aregereg 1 2% 0.84 . 0.84 SATB2 aregereg 1 2% 0.63 . 0.63 Total 42 100% 0.78 0.06 0.77 3-Gene Models DUSP6 EREG SLC26A3 7 33% 0.8 0.06 0.82 DUSP6 SLC26A3 aregereg 6 29% 0.81 0.07 0.83 CA9 EREG NT5E 1 5% 0.59 . 0.59 CLTC DUSP6 aregereg 1 5% 0.68 . 0.68 DR5 SLC26A3 aregereg 1 5% 0.79 . 0.79 DUSP6 VIL2 aregereg 1 5% 0.82 . 0.82 EPHA2 EREG SLC26A3 1 5% 0.65 . 0.65 EREG SLC26A3 VIL2 1 5% 0.75 . 0.75 KRT17 SLC26A3 aregereg 1 5% 0.8 . 0.8 SLC26A3 VIL2 aregereg 1 5% 0.95 . 0.95 Total 21 100% 0.76 0.07 0.77 4-Gene Models aregereg DR5 DUSP6 SLC26A3 1 20% 0.93 . . AMACR1 aregereg DUSP6 SATB2 1 20% 0.69 . . aregereg CLTC DUSP6 SLC26A3 1 20% 0.84 . . aregereg DUSP6 KRT17 SLC26A3 1 20% 0.76 . . EGFR EREG SLC26A3 VIL2 1 20% 0.92 . . 5-Gene Model DUSP6 EREG QPRT SLC26A3 VIL2 Total 1 100% 0.74 . . - Table 10 presents a table that compares observed patient response (DC endpoint) to treatment with cetuximab and response predicted using a 4-gene model based on expression levels of AREG, EREG, SLC26A3 and DUSP6. The threshold for the 4-gene model was determined by identifying the cutpoint that yielded the highest number of true negatives plus true positives on the DC endpoint. Table 10 illustrates the number of patients who would be classified as responders versus non-responders using the 4-gene model. The percentages are row percents, summarizing the number of patients with observed DC status given the predicted DC status from the 4-gene model.
Table 10 Observed DC Status No Yes Predicted DC Total Predicted DC Status using 4-gene logistic model No 44 (36, 50) 16 (10, 24) 60 (42%) 73% (60%, 84%) 27% (16%, 40%) Yes 13 (8, 21) 71 (63,77) 84 (58%) 15% (9%, 25%) 85% (75%, 92%) Observed DC Total 57 (40%) 87 (60%) 144 - Table 11 presents a table that compares the progression free survival time for patients for all KRAS-positive patients, for all KRAS-negative patients, for patients predicted by the four-gene classifier as having a high likelihood of response to treatment with an EGFR inhibitor and for patients predicted by the four-gene classifier as having a low likelihood of response to treatment with an EGFR inhibitor. The four gene classifier identifies a subset of KRAS-Negative patients that have a higher likelihood of response to treatment with an EGFR inhibitor (longer progression free survival (PFS) than the unclassified KRAS-Negative patients. The four gene classifier also identifies a subset of KRAS-Negative patients that have a lower likelihood of response (shorter progression free survival) than the unclassified KRAS-Negative patients; in these patients, PFS is similar to that seen in KRAS-Positive patients, who are generally resistant to treatment.
Table 11 No. of Patients Median Survival (95% CI) KRAS- Positive 82 41 (40,51) KRAS-Negative with Low Predicted Likelihood of Response 60 40 (38,46) KRAS-Negative with High Predicted Likelihood of Response 84 163 (126,180) All KRAS- Negative 144 103 8,126) - While the present invention has been described with reference to the specific embodiments thereof, it should be understood by those skilled in the art that various changes may be made and equivalents may be substituted without departing from the true spirit and scope of the invention. In addition, many modifications may be made to adapt a particular situation, material, composition of matter, process, process step or steps, to the objective, spirit and scope of the present invention. All such modifications are intended to be within the scope of the claims appended hereto.
- The disclosures of
US 61/127,816EP 09747492.8 - Further aspects of the present invention include a method for predicting a likelihood that a human patient with an EGFR -expressing cancer will exhibit a beneficial response to an EGFR inhibitor comprising: (a) measuring, in a tumour sample obtained from the patient, an expression level of at least one response indicator gene, or its expression product, selected from a group consisting of ATP5E, TITF1, CLTC, BRCA1, AREG, PTP4A3, EREG, VAV3, SATB2, CEACAM6, EGFR, CHN2, FGFR3, C13orf18, QPRT, AMACR1, CKMT2, ID1, SORBS1, SLC26A3, ErbB3, DUSP6, VDAC2, ANXA2P2, SERPINB1, NT5E, GPC3, DUSP4, PHLDA1, K-ras, DR5, VIL2, LAMC2, SFN, ANXA1, EPHA2, P14ARF, CA9, KRT17, p14ARF, Maspin, PLAUR, LAMA3, and GCNT3; (b) normalizing the expression level to obtain a normalized expression level; (c) using the normalized expression level to determine the likelihood that the patient will exhibit a beneficial response to an EGFR inhibitor, wherein increased normalized expression levels of ATP5E, TITF1, CLTC, BRCA1, AREG, PTP4A3, EREG, VAV3, SATB2, CEACAM6, EGFR, CHN2, FGFR3, C13orf18, QPRT, AMACR1, CKMT2, ID1, SORBS1, SLC26A3, and ErbB3 are positively correlated with the likelihood that the patient will exhibit a beneficial response to the EGFR inhibitor; and wherein increased normalized expression levels of DUSP6, VDAC2, ANXA2P2, SERPINB1, NT5E, GPC3, DUSP4, PHLDA1, K-ras, DR5, VIL2, LAMC2, SFN, ANXA1, EPHA2, P14ARF, CA9, KRT17, p14ARF, Maspin, PLAUR, LAMA3, and GCNT3 are negatively correlated with the likelihood that the patient will exhibit a beneficial response to the EGFR inhibitor; and (d) generating a report based on the determined likelihood.
- The response indicator genes may comprise at least SLC26A3, DUSP6 and AREG or EREG.
- The tumour sample may be obtained from a tissue biopsy.
- The cancer may be colorectal cancer, colon cancer, non-small cell lung cancer, squamous cell cancer of the head and neck, endometrial cancer, multiple myeloma, rectal cancer, or esophageal cancer.
- The expression product may be an RNA transcript.
- The EGFR inhibitor may be an antibody specific for EGFR.
- The EGFR inhibitor may be a small molecule, such as an EGFR-selective tyrosine kinase inhibitor.
- The normalized expression level may be determined relative to an expression level of at least one reference gene.
- The expression level may be determined by polymerase chain reaction (PCR).
- The normalized expression level may be weighted by its contribution to response to the EGFR inhibitor.
- In an aspect of the invention, there is provided a method for predicting a likelihood that a human patient having a KRAS-negative EGFR - expressing cancer will exhibit a beneficial response to an EGFR inhibitor comprising: (a) measuring, in a tumour sample obtained from the patient, an expression level of at least one response indicator gene, or its expression product, selected from a group consisting of EGF, ADAM17, PTP4A3, ADAM15, QPRT, SATB2, RASSF1, VAV3, CEACAM6, EREG, AREG, TITF1, SORBS1, C13orf18, CKMT2, BTC, ATP5E, B.Catenin, CCNE1, EGFR, Bclx, BRCA1, CDC25B, CHN2, ID1, SLC26A3, VDAC2, SERPINB1, PHLDA1, ANXA2P2, KRT17, EPHA2, DUSP4, CGA, CA9, Maspin, NEDD8, DUSP6, GPC3, NT5E, VIL2, and P14ARF; (b) normalizing the expression level to obtain a normalized expression level; (c) using the normalized expression level to determine the likelihood that the patient will exhibit a beneficial response to the EGFR inhibitor, wherein increased normalized expression levels of EGF, ADAM17, PTP4A3, ADAM15, QPRT, SATB2, RASSF1, VAV3, CEACAM6, EREG, AREG, TITF1, SORBS1, C13orf18, CKMT2, BTC, ATP5E, B.Catenin, CCNE1, EGFR, Bclx, BRCA1, CDC25B, CHN2, ID1, and SLC26A3 are positively correlated with the likelihood that the patient will exhibit a beneficial response to the EGFR inhibitor; and wherein increased normalized expression levels of response indicator genes VDAC2, SERPINB1, PHLDA1, ANXA2P2, KRT17, EPHA2, DUSP4, CGA, CA9, Maspin, NEDD8, DUSP6, GPC3, NT5E, VIL2, and P14ARF are negatively correlated with the likelihood that the patient will exhibit a beneficial response to the EGFR inhibitor; and (d) generating a report based on the determined likelihood.
- The response indicator genes may comprise at least SLC26A3, DUSP6 and AREG or EREG.
- The tumour sample may be obtained from a tissue biopsy.
- The cancer may be colorectal cancer, colon cancer, non-small cell lung cancer, squamous cell cancer of the head and neck, endometrial cancer, multiple myeloma, rectal cancer, or esophageal cancer.
- The expression product may be an RNA transcript.
- The EGFR inhibitor may be an antibody specific for EGFR.
- The EGFR inhibitor may be a small molecule, such as an EGFR-selective tyrosine kinase inhibitor.
- The normalized expression level may be determined relative to an expression level of one or more reference genes.
- The expression level may be obtained using polymerase chain reaction (PCR).
- The normalized expression level may be weighted by its contribution to response to EGFR inhibitor.
- According to another aspect, there is provided an array comprising a plurality of polynucleotides immobilized on a surface of a solid support suitable for carrying out the above-specified methods.
- The array may further comprise a probe that hybridizes under stringent hybridization conditions to a nucleic acid comprising an activating KRAS mutation.
- In another aspect, there is provided a method of preparing an array comprising: immobilizing on a surface of a solid support a probe for detection of a gene product of at least two genes selected from: ATP5E, TITF1, CLTC, BRCA1, AREG, PTP4A3, EREG, VAV3, SATB2, CEACAM6, EGFR, CHN2, FGFR3, C13orf18, QPRT, AMACR1, CKMT2, ID1, SORBS1, SLC26A3, and ErbB3 and/or at least one gene selected from: DUSP6, VDAC2, ANXA2P2, SERPINB1, NT5E, GPC3, DUSP4, PHLDA1, K-ras, DR5, VIL2, LAMC2, SFN, ANXA1, EPHA2, P14ARF, CA9, KRT17, p14ARF, Maspin, PLAUR, LAMA3, and GCNT3, wherein said gene comprise at least 25% of genes represented on said array.
- In another aspect, there is provided a method of preparing an array comprising: immobilizing on a surface of a solid support a probe for detection of a gene product of at least two genes selected from: EGF, ADAM17, PTP4A3, ADAM15, QPRT, SATB2, RASSF1, VAV3, CEACAM6, EREG, AREG, TITF1, SORBS1, C13orf18, CKMT2, BTC, ATP5E, B.Catenin, CCNE1, EGFR, Bclx, BRCA1, CDC25B, CHN2, ID1, SLC26A3, VDAC2, SERPINB1, PHLDA1, ANXA2P2, KRT17, EPHA2, DUSP4, CGA, CA9, Maspin, NEDD8, DUSP6, GPC3, NT5E, VIL2, and P14ARF, wherein said gene comprise at least 25% of genes represented on said array.
- The method may comprise: (a) determining, in a tumour sample obtained from human cancer patients having an EGFR -expressing cancer, normalized expression levels of response indicator genes from the multi-gene model, or their expression products; and (b) using the normalized expression levels to predict the likelihood that the patient will exhibit a beneficial response to the EGFR inhibitor based on the normalized expression level of the multi-gene model.


Claims (15)
- A method for predicting a likelihood that a human patient with an EGFR-expressing colorectal cancer will exhibit a beneficial response to an EGFR inhibitor comprising:(a) measuring, in a tumour sample obtained from the patient, a level of an RNA transcript, or its expression product, of PTP4A3;(b) normalizing the level of the RNA transcript of PTP4A3, or its expression product, to obtain a normalized expression level of PTP4A3; and(c) using the normalized expression level of PTP4A3 to determine the likelihood that the patient will exhibit a beneficial response to an EGFR inhibitor,wherein an increased normalized expression level of PTP4A3 is positively correlated with the likelihood that the patient will exhibit a beneficial response to the EGFR inhibitor.
- A method as claimed in claim 1, wherein the EGFR-expressing colorectal cancer is a KRAS-negative EGFR-expressing colorectal cancer.
- A method as claimed in claim 1 or 2, wherein the tumour sample is a fixed, paraffin-embedded tissue sample.
- A method as claimed in claim 1, 2 or 3 wherein the EGFR inhibitor is an antibody specific for EGFR.
- A method as claimed in claim 4, wherein the EGFR inhibitor is cetuximab.
- A method as claimed in claim 1, 2 or 3, wherein the EGFR inhibitor is a small molecule.
- A method as claimed in claim 6, wherein the small molecule is an EGFR-selective tyrosine kinase inhibitor.
- A method as claimed in any preceding claim, wherein the normalized expression level is determined relative to an expression level of at least one reference gene.
- A method as claimed in any preceding claim, wherein the level of the RNA transcript of PTP4A3 is measured.
- A method as claimed in claim 9, wherein the level of the RNA transcript of PTP4A3 is measured by reverse transcriptase polymerase chain reaction (RT-PCR).
- A method as claimed in any preceding claim, wherein the protein level of PTP4A3 is measured.
- A method as claimed in claim 11, wherein the protein level is measured by immunohistochemistry or proteomics techniques.
- A method as claimed in any preceding claim, wherein beneficial response is expressed in terms of Overall Response Rate (ORR) or Disease Control (DC).
- A method as claimed in any preceding claim, wherein the normalized expression level is weighted by its contribution to response to the EGFR inhibitor.
- A method as claimed in any preceding claim, further comprising the step of creating a report summarizing said prediction.
Applications Claiming Priority (2)
| Application Number | Priority Date | Filing Date | Title |
|---|---|---|---|
| US12781608P | 2008-05-14 | 2008-05-14 | |
| EP09747492.8A EP2288727B1 (en) | 2008-05-14 | 2009-05-13 | Predictors of patient response to treatment with egf receptor inhibitors |
Related Parent Applications (2)
| Application Number | Title | Priority Date | Filing Date |
|---|---|---|---|
| EP09747492.8 Division | 2009-05-13 | ||
| EP09747492.8A Division EP2288727B1 (en) | 2008-05-14 | 2009-05-13 | Predictors of patient response to treatment with egf receptor inhibitors |
Publications (2)
| Publication Number | Publication Date |
|---|---|
| EP2615183A1 true EP2615183A1 (en) | 2013-07-17 |
| EP2615183B1 EP2615183B1 (en) | 2014-10-08 |
Family
ID=41319044
Family Applications (2)
| Application Number | Title | Priority Date | Filing Date |
|---|---|---|---|
| EP13163561.7A Not-in-force EP2615183B1 (en) | 2008-05-14 | 2009-05-13 | Predictors of patient response to treatment with EGF receptor inhibitors |
| EP09747492.8A Active EP2288727B1 (en) | 2008-05-14 | 2009-05-13 | Predictors of patient response to treatment with egf receptor inhibitors |
Family Applications After (1)
| Application Number | Title | Priority Date | Filing Date |
|---|---|---|---|
| EP09747492.8A Active EP2288727B1 (en) | 2008-05-14 | 2009-05-13 | Predictors of patient response to treatment with egf receptor inhibitors |
Country Status (9)
| Country | Link |
|---|---|
| US (2) | US8273534B2 (en) |
| EP (2) | EP2615183B1 (en) |
| AU (1) | AU2009246398A1 (en) |
| CA (1) | CA2723984A1 (en) |
| DK (1) | DK2288727T3 (en) |
| ES (1) | ES2430590T3 (en) |
| HK (1) | HK1154054A1 (en) |
| NZ (3) | NZ610482A (en) |
| WO (1) | WO2009140409A1 (en) |
Families Citing this family (20)
| Publication number | Priority date | Publication date | Assignee | Title |
|---|---|---|---|---|
| EP1570080A4 (en) | 2002-11-15 | 2006-03-01 | Genomic Health Inc | Gene expression profiling of egfr positive cancer |
| US8765383B2 (en) * | 2009-04-07 | 2014-07-01 | Genomic Health, Inc. | Methods of predicting cancer risk using gene expression in premalignant tissue |
| MX2011011571A (en) * | 2009-05-01 | 2012-02-13 | Genomic Health Inc | Gene expression profile algorithm and test for likelihood of recurrence of colorectal cancer and response to chemotherapy. |
| CN105177119A (en) * | 2009-06-19 | 2015-12-23 | 默克专利有限公司 | Biomarkers and methods for determining efficacy of anti-EGFR antibodies in cancer therapy |
| US20130302321A1 (en) * | 2010-09-28 | 2013-11-14 | Agendia N.V. | Methods and Means for Typing a Sample Comprising Cancer Cells Based on Oncogenic Signal Transduction Pathways |
| US8691231B2 (en) | 2011-06-03 | 2014-04-08 | Merrimack Pharmaceuticals, Inc. | Methods of treatment of tumors expressing predominantly high affinity EGFR ligands or tumors expressing predominantly low affinity EGFR ligands with monoclonal and oligoclonal anti-EGFR antibodies |
| WO2012170715A1 (en) * | 2011-06-07 | 2012-12-13 | Caris Mpi, Inc. | Molecular profiling for cancer |
| WO2013052480A1 (en) * | 2011-10-03 | 2013-04-11 | The Board Of Regents Of The University Of Texas System | Marker-based prognostic risk score in colon cancer |
| US9822417B2 (en) | 2012-01-09 | 2017-11-21 | Oslo Universitetssykehus Hf | Methods and biomarkers for analysis of colorectal cancer |
| CN105407913A (en) * | 2012-07-31 | 2016-03-16 | 中美冠科生物技术(太仓)有限公司 | Biomarkers for identifying esophageal cancer patients for treatment with an anti-EGFR drug |
| WO2014028222A1 (en) * | 2012-07-31 | 2014-02-20 | Crown Bioscience, Inc. | Biomarkers for identifying esophageal cancer patients for treatment with an anti-egfr drug |
| WO2014071226A1 (en) * | 2012-11-02 | 2014-05-08 | The Regents Of The University Of California | Methods and systems for determining a likelihood of adverse prostate cancer pathology |
| GB201223025D0 (en) * | 2012-12-20 | 2013-02-06 | Medizinische Universitaet Graz | Prediction of the treatment response to an anti-EGFR molecule in colorectal cancer patients |
| SG10201807838SA (en) * | 2014-03-11 | 2018-10-30 | Council Queensland Inst Medical Res | Determining cancer aggressiveness, prognosis and responsiveness to treatment |
| US20160024585A1 (en) * | 2014-05-02 | 2016-01-28 | Duke University | Methods of predicting responsiveness of a cancer to an agent and methods of determining a prognosis for a cancer patient |
| MA39599A (en) | 2014-05-14 | 2016-10-05 | Merrimack Pharmaceuticals Inc | Dosage and administration anti-egfr therapeutics |
| FR3037403A1 (en) * | 2015-06-12 | 2016-12-16 | Centre Leon Berard | METHOD FOR PREDICTING SUSCEPTIBILITY OF GASTROINTESTINAL TUMOR TO INHIBITORY TREATMENT |
| CN106148533B (en) * | 2016-07-28 | 2019-06-11 | 北京泱深生物信息技术有限公司 | Marker for esophageal squamous cell carcinoma diagnosis and treatment |
| WO2018078143A1 (en) | 2016-10-28 | 2018-05-03 | MAX-PLANCK-Gesellschaft zur Förderung der Wissenschaften e.V. | Means and methods for determining efficacy of anti-egfr inhibitors in colorectal cancer (crc) therapy |
| WO2020080871A2 (en) * | 2018-10-18 | 2020-04-23 | (주)신테카바이오 | Biomarker composition for determining cancer drug responsiveness, method for determining cancer drug responsiveness using biomarker composition, and diagnostic chip for detecting biomarker composition for determining cancer drug responsiveness |
Citations (17)
| Publication number | Priority date | Publication date | Assignee | Title |
|---|---|---|---|---|
| US4415732A (en) | 1981-03-27 | 1983-11-15 | University Patents, Inc. | Phosphoramidite compounds and processes |
| US4458066A (en) | 1980-02-29 | 1984-07-03 | University Patents, Inc. | Process for preparing polynucleotides |
| US4914210A (en) | 1987-10-02 | 1990-04-03 | Cetus Corporation | Oligonucleotide functionalizing reagents |
| WO1995021944A1 (en) | 1994-02-14 | 1995-08-17 | Smithkline Beecham Corporation | Differentially expressed genes in healthy and diseased subjects |
| WO1996030347A1 (en) | 1995-03-30 | 1996-10-03 | Pfizer Inc. | Quinazoline derivatives |
| WO1996033977A1 (en) | 1995-04-27 | 1996-10-31 | Zeneca Limited | Quinazoline derivatives |
| WO1996033980A1 (en) | 1995-04-27 | 1996-10-31 | Zeneca Limited | Quinazoline derivatives |
| WO1996033978A1 (en) | 1995-04-27 | 1996-10-31 | Zeneca Limited | Quinazoline derivative |
| WO1997038983A1 (en) | 1996-04-12 | 1997-10-23 | Warner-Lambert Company | Irreversible inhibitors of tyrosine kinases |
| WO1998043960A1 (en) | 1997-04-03 | 1998-10-08 | American Cyanamid Company | Substituted 3-cyano quinolines |
| WO1999006396A1 (en) | 1997-07-29 | 1999-02-11 | Warner-Lambert Company | Irreversible bicyclic inhibitors of tyrosine kinases |
| WO1999006378A1 (en) | 1997-07-29 | 1999-02-11 | Warner-Lambert Company | Irreversible inhibitors of tyrosine kinases |
| WO1999009016A1 (en) | 1997-08-01 | 1999-02-25 | American Cyanamid Company | Substituted quinazoline derivatives and their use as tyrosine kinase inhibitors |
| WO2006086777A2 (en) | 2005-02-11 | 2006-08-17 | Memorial Sloan Kettering Cancer Center | Methods and compositions for detecting a drug resistant egfr mutant |
| WO2007001868A1 (en) | 2005-06-28 | 2007-01-04 | Genentech, Inc. | Egfr and kras mutations |
| WO2007025044A2 (en) * | 2005-08-24 | 2007-03-01 | Bristol-Myers Squibb Company | Biomarkers and methods for determining sensitivity to epidermal growth factor receptor modulators |
| WO2007067500A2 (en) * | 2005-12-05 | 2007-06-14 | Genomic Health, Inc. | Predictors of patient response to treatment with egfr inhibitors |
Family Cites Families (13)
| Publication number | Priority date | Publication date | Assignee | Title |
|---|---|---|---|---|
| WO2001022920A2 (en) | 1999-09-29 | 2001-04-05 | Human Genome Sciences, Inc. | Colon and colon cancer associated polynucleotides and polypeptides |
| EP1483401A1 (en) * | 2002-03-13 | 2004-12-08 | F.Hoffmann-La Roche Ag | Method for selecting drug sensitivity-determining factors and method for predicting drug sensitivity using the selected factors |
| EP2258872B1 (en) | 2002-03-13 | 2013-08-14 | Genomic Health, Inc. | Gene expression profiling in biopsied tumor tissues |
| EP1570080A4 (en) | 2002-11-15 | 2006-03-01 | Genomic Health Inc | Gene expression profiling of egfr positive cancer |
| CA2515096A1 (en) * | 2003-02-06 | 2004-08-26 | Genomic Health, Inc. | Gene expression markers for response to egfr inhibitor drugs |
| EP1597391B1 (en) | 2003-02-20 | 2008-10-29 | Genomic Health, Inc. | Use of intronic rna to measure gene expression |
| US20050164218A1 (en) | 2003-05-30 | 2005-07-28 | David Agus | Gene expression markers for response to EGFR inhibitor drugs |
| US20070009267A1 (en) * | 2005-06-22 | 2007-01-11 | Crews Darren S | Driving a laser using an electrical link driver |
| US7700299B2 (en) | 2005-08-12 | 2010-04-20 | Hoffmann-La Roche Inc. | Method for predicting the response to a treatment |
| DK1974058T3 (en) | 2006-01-11 | 2014-09-01 | Genomic Health Inc | Gene Expression Markers for Prognostication of Colorectal Cancer |
| US20090258795A1 (en) | 2007-03-15 | 2009-10-15 | Genomic Health, Inc. | Gene expression markers for prediction of patient response to chemotherapy |
| WO2009114836A1 (en) | 2008-03-14 | 2009-09-17 | Genomic Health, Inc. | Gene expression markers for prediction of patient response to chemotherapy |
| MX2011011571A (en) | 2009-05-01 | 2012-02-13 | Genomic Health Inc | Gene expression profile algorithm and test for likelihood of recurrence of colorectal cancer and response to chemotherapy. |
-
2009
- 2009-05-13 NZ NZ610482A patent/NZ610482A/en unknown
- 2009-05-13 ES ES09747492T patent/ES2430590T3/en active Active
- 2009-05-13 NZ NZ597292A patent/NZ597292A/en unknown
- 2009-05-13 EP EP13163561.7A patent/EP2615183B1/en not_active Not-in-force
- 2009-05-13 WO PCT/US2009/043823 patent/WO2009140409A1/en active Application Filing
- 2009-05-13 US US12/465,503 patent/US8273534B2/en active Active
- 2009-05-13 NZ NZ589143A patent/NZ589143A/en unknown
- 2009-05-13 DK DK09747492.8T patent/DK2288727T3/en active
- 2009-05-13 AU AU2009246398A patent/AU2009246398A1/en not_active Abandoned
- 2009-05-13 EP EP09747492.8A patent/EP2288727B1/en active Active
- 2009-05-13 CA CA2723984A patent/CA2723984A1/en not_active Abandoned
-
2011
- 2011-08-10 HK HK11108366.6A patent/HK1154054A1/en unknown
-
2012
- 2012-07-05 US US13/542,323 patent/US20120270228A1/en not_active Abandoned
Patent Citations (18)
| Publication number | Priority date | Publication date | Assignee | Title |
|---|---|---|---|---|
| US4458066A (en) | 1980-02-29 | 1984-07-03 | University Patents, Inc. | Process for preparing polynucleotides |
| US4415732A (en) | 1981-03-27 | 1983-11-15 | University Patents, Inc. | Phosphoramidite compounds and processes |
| US4914210A (en) | 1987-10-02 | 1990-04-03 | Cetus Corporation | Oligonucleotide functionalizing reagents |
| WO1995021944A1 (en) | 1994-02-14 | 1995-08-17 | Smithkline Beecham Corporation | Differentially expressed genes in healthy and diseased subjects |
| WO1996030347A1 (en) | 1995-03-30 | 1996-10-03 | Pfizer Inc. | Quinazoline derivatives |
| US5770599A (en) | 1995-04-27 | 1998-06-23 | Zeneca Limited | Quinazoline derivatives |
| WO1996033977A1 (en) | 1995-04-27 | 1996-10-31 | Zeneca Limited | Quinazoline derivatives |
| WO1996033980A1 (en) | 1995-04-27 | 1996-10-31 | Zeneca Limited | Quinazoline derivatives |
| WO1996033978A1 (en) | 1995-04-27 | 1996-10-31 | Zeneca Limited | Quinazoline derivative |
| WO1997038983A1 (en) | 1996-04-12 | 1997-10-23 | Warner-Lambert Company | Irreversible inhibitors of tyrosine kinases |
| WO1998043960A1 (en) | 1997-04-03 | 1998-10-08 | American Cyanamid Company | Substituted 3-cyano quinolines |
| WO1999006396A1 (en) | 1997-07-29 | 1999-02-11 | Warner-Lambert Company | Irreversible bicyclic inhibitors of tyrosine kinases |
| WO1999006378A1 (en) | 1997-07-29 | 1999-02-11 | Warner-Lambert Company | Irreversible inhibitors of tyrosine kinases |
| WO1999009016A1 (en) | 1997-08-01 | 1999-02-25 | American Cyanamid Company | Substituted quinazoline derivatives and their use as tyrosine kinase inhibitors |
| WO2006086777A2 (en) | 2005-02-11 | 2006-08-17 | Memorial Sloan Kettering Cancer Center | Methods and compositions for detecting a drug resistant egfr mutant |
| WO2007001868A1 (en) | 2005-06-28 | 2007-01-04 | Genentech, Inc. | Egfr and kras mutations |
| WO2007025044A2 (en) * | 2005-08-24 | 2007-03-01 | Bristol-Myers Squibb Company | Biomarkers and methods for determining sensitivity to epidermal growth factor receptor modulators |
| WO2007067500A2 (en) * | 2005-12-05 | 2007-06-14 | Genomic Health, Inc. | Predictors of patient response to treatment with egfr inhibitors |
Non-Patent Citations (76)
| Title |
|---|
| "Mechanisms and Structure 4th ed.", 1992, JOHN WILEY & SONS, article "March, Advanced Organic Chemistry Reactions" |
| "Methods in Enzymology", ACADEMIC PRESS, INC. |
| 1IIUMINA; AN DIEGO, CA; OLIPHANT ET AL.: "Discovery of Markers for Disease", SUPPLEMENT TO BIOTECHNIQUES, June 2002 (2002-06-01) |
| A. MORTAZAVI, NATURE METHODS, vol. 5, no. 7, 2008, pages 621 - 628 |
| AMBROISE C; MCLACHLAN GJ, PROC NAT ACAD SCI USA, vol. 99, 2002, pages 6562 - 6566 |
| APPLIED BIOSYSTEMS USER BULLETIN, no. 13, 1 April 1987 (1987-04-01) |
| AUSUBEL ET AL.: "Current Protocols of Molecular Biology", 1997, JOHN WILEY AND SONS |
| B. HAMES AND S. HIGGINS,: "Nucleic Acid Hybridization, A Practical Approach", 1985, IRL PRESS |
| BASELGA J; ARTEAGA CL, J CLIN ONCOL, 2005, pages 2445 - 2459 |
| BEAUCAGE ET AL., TETRAHEDRON, vol. 48, 1992, pages 2223 - 2311 |
| BENJAMINI, Y.; HOCHBERG, Y., J.R. STATIST. SOC., vol. B57, 1995, pages 289 |
| BOOM R ET AL., J CLIN MICROBIOL., vol. 28, 1990, pages 495 - 503 |
| BROWN ET AL., METH. ENZYMOL., vol. 68, 1979, pages 109 |
| BRUNTON ET AL., ANTI CANCER DRUG DESIGN, vol. 11, 1996, pages 265 - 295 |
| BUCHDUNGER ET AL., CLIN. CANCER RES., vol. 1, 1995, pages 813 - 821 |
| CLOAD ET AL., J. AM. CHEM. SOC., vol. 113, 1991, pages 6324 - 6326 |
| D.M. WEIR & C.C. BLACKWELL,: "Handbook of Experimental Immunology, 4th edition", 1987, BLACKWELL SCIENCE INC. |
| DE ANDRES ET AL., BIOTECHNIQUES, vol. 18, 1995, pages 42044 |
| DIEFFENBACH, CW. ET AL.: "General Concepts for PCR Primer Design'' in: PCR Primer, A Laboratory Manual", 1995, COLD SPRING HARBOR LABORATORY PRESS, pages: 133 - 155 |
| DING; CANTOR, PROC. NATL. ACAD. SCI. USA, vol. 100, 2003, pages 3059 - 3064 |
| DINNEY ET AL., CLIN. CANCER RES., vol. 3, 1997, pages 161 - 168 |
| DURAND ET AL., NUCLEIC ACIDS RES., vol. 18, 1990, pages 6353 - 6359 |
| EISENBERG; LEVANON, TRENDS IN GENETICS, vol. 19, 2003, pages 362 |
| F.M. AUSUBEL ET AL.: "Current Protocols in Molecular Biology", 1987 |
| FERGUSON ET AL., ANALYTICAL CHEMISTRY, vol. 72, 2000, pages 5618 |
| FRY ET AL., SCIENCE, vol. 265, 1994, pages 1093 |
| FUKUMURA ET AL., NUCL. ACIDS. RES., vol. 31, no. 16, 2003, pages E94 |
| GODFREY ET AL., J. MOLEC. DIAGNOSTICS, vol. 2, 2000, pages 84 - 91 |
| H. KATO: "High Expression of PRL-3 Promotes Cancer Cell Motility and Liver Metastasis in Human Colorectal Cancer: A Predictive Molecular Marker of Metachronous Liver and Lung Metastases", CLINICAL CANCER RESEARCH, vol. 10, no. 21, 1 November 2004 (2004-11-01), pages 7318 - 7328, XP055065019, ISSN: 1078-0432, DOI: 10.1158/1078-0432.CCR-04-0485 * |
| HARDIE, ET AL.: "The Protein Kinase Facts Book: Protein Tyrosine Kinases", 1995, ACADEMIC PRESS |
| HELD ET AL., GENOME RES., vol. 6, 1996, pages 986 - 994 |
| HOD, BIOTECHNIQUES, vol. 13, 1992, pages 852 - 854 |
| HORN ET AL., TET. LETT., vol. 27, 1986, pages 4705 - 4708 |
| INNIS; GELFAND: "PCR Protocols, A Guide to Methods and Applications", 1994, CRC PRESS, article "Optimization of PCRs", pages: 5 - 11 |
| J B BAKER ET AL: "Tumour gene expression predicts response to cetuximab in patients with KRAS wild-type metastatic colorectal cancer", BRITISH JOURNAL OF CANCER, vol. 104, no. 3, 1 February 2011 (2011-02-01), pages 488 - 495, XP055037917, ISSN: 0007-0920, DOI: 10.1038/sj.bjc.6606054 * |
| J. MARIONI, GENOME RESEARCH, vol. 18, no. 9, 2008, pages 1509 - 1517 |
| J.M. MILLER & M.P. CALOS,: "Gene Transfer Vectors for Mammalian Cells", 1987 |
| K. SPECHT ET AL., AM. J. PATHOL., vol. 158, 2001, pages 419 - 29 |
| KENT, W.J., GENOME RES., vol. 12, no. 4, 2002, pages 656 - 64 |
| KHAMBATA-FORD ET AL., AN EXPLORATORY PHARMACOGENOMIC STUDY OF ERBITUX MONOTHERAPY IN PATIENTS WITH METASTATIC COLORECTAL CARCINOMA, vol. 25, 2007, pages 3230 - 3237 |
| KHAMBATA-FORD ET AL., CLIN. ONCOL., vol. 25, 2007, pages 3230 |
| LAXMINARAYANA ET AL., CARCINOGEN, vol. 16, 1995, pages 1741 - 1745 |
| LENZ ET AL.: "A Phase II Multicentre Study of Erbitux (Cetuximab) in Patients with Metastatic Colorectal Carcinoma", J. CLIN. ONCOL., vol. 24, 2006, pages 4914 - 4921 |
| LIBVRE ET AL., J. CLIN. ONCOL., vol. 26, 2008, pages 374 |
| M. CRONIN ET AL., AM J PATHOL, vol. 164, 2004, pages 35 - 42 |
| M.J. GAIT,: "Oligonucleotide Synthesis", 1984 |
| MOULDER ET AL., CANCER RES., vol. 61, 2001, pages 8887 |
| MOYER ET AL., CANCER RES., vol. 57, 1997, pages 4838 |
| MULLIS ET AL.,: "PCR: The Polymerase Chain Reaction", 1994 |
| N. CLOONAN, NATURE METHODS, vol. 5, no. 7, 2008, pages 613 - 619 |
| NARANG ET AL., METH. ENZYMOL., vol. 68, 1979, pages 90 |
| ODA ET AL., MOLEC. SYSTEMS BIOL., vol. 1, 2005 |
| PARKER; BARNES, METHODS IN MOLECULAR BIOLOGY, vol. 106, 1999, pages 247 - 283 |
| PLASTERER, T.N.: "Primerselect: Primer and probe design", METHODS MOL. BIOL., vol. 70, 1997, pages 520 - 527 |
| R. MORIN, GENOME RESEARCH, vol. 18, no. 4, 2008, pages 610 - 621 |
| R.I. FRESHNEY,: "Animal Cell Culture", 1987 |
| RUPP; LOCKER, LAB INVEST., vol. 56, 1987, pages A67 |
| S. BRENNER ET AL., NATURE BIOTECHNOLOGY, vol. 18, no. 6, 2000, pages 630 - 634 |
| SALTZ ET AL.: "Phase II Study of an Anti-Epidermal Growth Factor Receptor (EGFR) Antibody, Cetuximab, in Patients with Irinotecan-Refractory, Stage IV Colorectal Carcinoma", J. CLIN. ONCOL., vol. 22, 2004, pages 1201 - 1208 |
| SAMBROOK ET AL.: "Molecular Cloning: A Laboratory Manual, 2nd edition", 1989 |
| SCHENA, PROC. NATL. ACAD. SCI. USA, vol. 93, no. 2, 1996, pages 106 - 149 |
| SINGLETON ET AL.: "Dictionary of Microbiology and Molecular Biology 2nd ed.", 1994, J. WILEY & SONS |
| SPECHT ET AL., AM. J. PATHOL., vol. 158, 2001, pages 419 - 29 |
| STEVE ROZEN; HELEN J. SKALETSKY: "Bioinformatics Methods and Protocols: Methods in Molecular Biology", 2000, HUMANA PRESS, article "Primer3 on the WWW for general users and for biologist programmers", pages: 365 - 386 |
| STRAWN; SHAWVER, EXP. OPIN. INVEST. DRUGS, vol. 7, April 1998 (1998-04-01), pages 553 - 573 |
| STRAWN; SHAWVER, EXP. OPIN. INVEST. DRUGS, vol. 7, no. 4, 1998, pages 553 - 573 |
| T.E. GODFREY ET AL., J. MOLEC. DIAGNOSTICS, vol. 2, 2000, pages 84 - 91 |
| TRAXLER ET AL., J. MED. CHEM, vol. 39, 1996, pages 2285 - 2292 |
| TRAXLER ET AL., J. PHARM. BELG., vol. 52, 1997 |
| ULLRICH ET AL., NATURE, vol. 309, 1984, pages 418 - 425 |
| VELCULESCU ET AL., CELL, vol. 88, 1997, pages 243 - 51 |
| VELCULESCU ET AL., SCIENCE, vol. 270, 1995, pages 484 - 487 |
| WEIS ET AL., TRENDS IN GENETICS, vol. 8, 1992, pages 263 - 264 |
| WETMUR J; DAVIDSON N, MOL BIOL, vol. 31, 1968, pages 349 - 37 |
| WOODBURN ET AL., PROC. AM. ASSOC. CANCER RES., vol. 38, 1997, pages 633 |
| YANG ET AL., GENOME RES., vol. 11, 2001, pages 1888 - 1898 |
Also Published As
| Publication number | Publication date |
|---|---|
| CA2723984A1 (en) | 2009-11-19 |
| US20120270228A1 (en) | 2012-10-25 |
| DK2288727T3 (en) | 2013-10-21 |
| EP2615183B1 (en) | 2014-10-08 |
| US8273534B2 (en) | 2012-09-25 |
| EP2288727A1 (en) | 2011-03-02 |
| HK1154054A1 (en) | 2012-04-20 |
| ES2430590T3 (en) | 2013-11-21 |
| EP2288727B1 (en) | 2013-07-10 |
| EP2288727A4 (en) | 2011-09-14 |
| AU2009246398A1 (en) | 2009-11-19 |
| WO2009140409A1 (en) | 2009-11-19 |
| NZ610482A (en) | 2014-08-29 |
| NZ589143A (en) | 2012-02-24 |
| NZ597292A (en) | 2013-06-28 |
| US20090298701A1 (en) | 2009-12-03 |
Similar Documents
| Publication | Publication Date | Title |
|---|---|---|
| EP2288727B1 (en) | Predictors of patient response to treatment with egf receptor inhibitors | |
| JP5486718B2 (en) | Gene expression markers for prognosis of colorectal cancer | |
| CA2776751C (en) | Methods to predict clinical outcome of cancer | |
| AU2013215448B2 (en) | Gene expression profile algorithm and test for determining prognosis of prostate cancer | |
| JP2020031642A (en) | Method for using gene expression to determine prognosis of prostate cancer | |
| US20070128636A1 (en) | Predictors Of Patient Response To Treatment With EGFR Inhibitors | |
| JP2008520192A (en) | Predicting response to chemotherapy using gene expression markers | |
| EP2195451A1 (en) | Expression profiles of biomarker genes in notch mediated cancers | |
| CA2588253A1 (en) | Methods and systems for prognosis and treatment of solid tumors | |
| WO2013130465A2 (en) | Gene expression markers for prediction of efficacy of platinum-based chemotherapy drugs | |
| WO2014130617A1 (en) | Method of predicting breast cancer prognosis | |
| WO2014130444A1 (en) | Method of predicting breast cancer prognosis |
Legal Events
| Date | Code | Title | Description |
|---|---|---|---|
| PUAI | Public reference made under article 153(3) epc to a published international application that has entered the european phase |
Free format text: ORIGINAL CODE: 0009012 |
|
| 17P | Request for examination filed |
Effective date: 20130412 |
|
| AC | Divisional application: reference to earlier application |
Ref document number: 2288727 Country of ref document: EP Kind code of ref document: P |
|
| AK | Designated contracting states |
Kind code of ref document: A1 Designated state(s): AT BE BG CH CY CZ DE DK EE ES FI FR GB GR HR HU IE IS IT LI LT LU LV MC MK MT NL NO PL PT RO SE SI SK TR |
|
| REG | Reference to a national code |
Ref country code: HK Ref legal event code: DE Ref document number: 1186216 Country of ref document: HK |
|
| GRAP | Despatch of communication of intention to grant a patent |
Free format text: ORIGINAL CODE: EPIDOSNIGR1 |
|
| INTG | Intention to grant announced |
Effective date: 20140514 |
|
| GRAS | Grant fee paid |
Free format text: ORIGINAL CODE: EPIDOSNIGR3 |
|
| GRAA | (expected) grant |
Free format text: ORIGINAL CODE: 0009210 |
|
| AC | Divisional application: reference to earlier application |
Ref document number: 2288727 Country of ref document: EP Kind code of ref document: P |
|
| AK | Designated contracting states |
Kind code of ref document: B1 Designated state(s): AT BE BG CH CY CZ DE DK EE ES FI FR GB GR HR HU IE IS IT LI LT LU LV MC MK MT NL NO PL PT RO SE SI SK TR |
|
| REG | Reference to a national code |
Ref country code: GB Ref legal event code: FG4D |
|
| REG | Reference to a national code |
Ref country code: AT Ref legal event code: REF Ref document number: 690653 Country of ref document: AT Kind code of ref document: T Effective date: 20141015 Ref country code: CH Ref legal event code: EP |
|
| REG | Reference to a national code |
Ref country code: IE Ref legal event code: FG4D |
|
| REG | Reference to a national code |
Ref country code: DE Ref legal event code: R096 Ref document number: 602009027155 Country of ref document: DE Effective date: 20141120 |
|
| REG | Reference to a national code |
Ref country code: NL Ref legal event code: VDEP Effective date: 20141008 |
|
| REG | Reference to a national code |
Ref country code: AT Ref legal event code: MK05 Ref document number: 690653 Country of ref document: AT Kind code of ref document: T Effective date: 20141008 |
|
| REG | Reference to a national code |
Ref country code: LT Ref legal event code: MG4D |
|
| PG25 | Lapsed in a contracting state [announced via postgrant information from national office to epo] |
Ref country code: NL Free format text: LAPSE BECAUSE OF FAILURE TO SUBMIT A TRANSLATION OF THE DESCRIPTION OR TO PAY THE FEE WITHIN THE PRESCRIBED TIME-LIMIT Effective date: 20141008 |
|
| PG25 | Lapsed in a contracting state [announced via postgrant information from national office to epo] |
Ref country code: LT Free format text: LAPSE BECAUSE OF FAILURE TO SUBMIT A TRANSLATION OF THE DESCRIPTION OR TO PAY THE FEE WITHIN THE PRESCRIBED TIME-LIMIT Effective date: 20141008 Ref country code: ES Free format text: LAPSE BECAUSE OF FAILURE TO SUBMIT A TRANSLATION OF THE DESCRIPTION OR TO PAY THE FEE WITHIN THE PRESCRIBED TIME-LIMIT Effective date: 20141008 Ref country code: IS Free format text: LAPSE BECAUSE OF FAILURE TO SUBMIT A TRANSLATION OF THE DESCRIPTION OR TO PAY THE FEE WITHIN THE PRESCRIBED TIME-LIMIT Effective date: 20150208 Ref country code: NO Free format text: LAPSE BECAUSE OF FAILURE TO SUBMIT A TRANSLATION OF THE DESCRIPTION OR TO PAY THE FEE WITHIN THE PRESCRIBED TIME-LIMIT Effective date: 20150108 Ref country code: PT Free format text: LAPSE BECAUSE OF FAILURE TO SUBMIT A TRANSLATION OF THE DESCRIPTION OR TO PAY THE FEE WITHIN THE PRESCRIBED TIME-LIMIT Effective date: 20150209 Ref country code: FI Free format text: LAPSE BECAUSE OF FAILURE TO SUBMIT A TRANSLATION OF THE DESCRIPTION OR TO PAY THE FEE WITHIN THE PRESCRIBED TIME-LIMIT Effective date: 20141008 |
|
| PG25 | Lapsed in a contracting state [announced via postgrant information from national office to epo] |
Ref country code: LV Free format text: LAPSE BECAUSE OF FAILURE TO SUBMIT A TRANSLATION OF THE DESCRIPTION OR TO PAY THE FEE WITHIN THE PRESCRIBED TIME-LIMIT Effective date: 20141008 Ref country code: PL Free format text: LAPSE BECAUSE OF FAILURE TO SUBMIT A TRANSLATION OF THE DESCRIPTION OR TO PAY THE FEE WITHIN THE PRESCRIBED TIME-LIMIT Effective date: 20141008 Ref country code: SE Free format text: LAPSE BECAUSE OF FAILURE TO SUBMIT A TRANSLATION OF THE DESCRIPTION OR TO PAY THE FEE WITHIN THE PRESCRIBED TIME-LIMIT Effective date: 20141008 Ref country code: AT Free format text: LAPSE BECAUSE OF FAILURE TO SUBMIT A TRANSLATION OF THE DESCRIPTION OR TO PAY THE FEE WITHIN THE PRESCRIBED TIME-LIMIT Effective date: 20141008 Ref country code: CY Free format text: LAPSE BECAUSE OF FAILURE TO SUBMIT A TRANSLATION OF THE DESCRIPTION OR TO PAY THE FEE WITHIN THE PRESCRIBED TIME-LIMIT Effective date: 20141008 Ref country code: GR Free format text: LAPSE BECAUSE OF FAILURE TO SUBMIT A TRANSLATION OF THE DESCRIPTION OR TO PAY THE FEE WITHIN THE PRESCRIBED TIME-LIMIT Effective date: 20150109 Ref country code: HR Free format text: LAPSE BECAUSE OF FAILURE TO SUBMIT A TRANSLATION OF THE DESCRIPTION OR TO PAY THE FEE WITHIN THE PRESCRIBED TIME-LIMIT Effective date: 20141008 |
|
| REG | Reference to a national code |
Ref country code: DE Ref legal event code: R097 Ref document number: 602009027155 Country of ref document: DE |
|
| PG25 | Lapsed in a contracting state [announced via postgrant information from national office to epo] |
Ref country code: SK Free format text: LAPSE BECAUSE OF FAILURE TO SUBMIT A TRANSLATION OF THE DESCRIPTION OR TO PAY THE FEE WITHIN THE PRESCRIBED TIME-LIMIT Effective date: 20141008 Ref country code: EE Free format text: LAPSE BECAUSE OF FAILURE TO SUBMIT A TRANSLATION OF THE DESCRIPTION OR TO PAY THE FEE WITHIN THE PRESCRIBED TIME-LIMIT Effective date: 20141008 Ref country code: DK Free format text: LAPSE BECAUSE OF FAILURE TO SUBMIT A TRANSLATION OF THE DESCRIPTION OR TO PAY THE FEE WITHIN THE PRESCRIBED TIME-LIMIT Effective date: 20141008 Ref country code: CZ Free format text: LAPSE BECAUSE OF FAILURE TO SUBMIT A TRANSLATION OF THE DESCRIPTION OR TO PAY THE FEE WITHIN THE PRESCRIBED TIME-LIMIT Effective date: 20141008 Ref country code: RO Free format text: LAPSE BECAUSE OF FAILURE TO SUBMIT A TRANSLATION OF THE DESCRIPTION OR TO PAY THE FEE WITHIN THE PRESCRIBED TIME-LIMIT Effective date: 20141008 |
|
| PLBE | No opposition filed within time limit |
Free format text: ORIGINAL CODE: 0009261 |
|
| STAA | Information on the status of an ep patent application or granted ep patent |
Free format text: STATUS: NO OPPOSITION FILED WITHIN TIME LIMIT |
|
| PG25 | Lapsed in a contracting state [announced via postgrant information from national office to epo] |
Ref country code: IT Free format text: LAPSE BECAUSE OF FAILURE TO SUBMIT A TRANSLATION OF THE DESCRIPTION OR TO PAY THE FEE WITHIN THE PRESCRIBED TIME-LIMIT Effective date: 20141008 |
|
| 26N | No opposition filed |
Effective date: 20150709 |
|
| REG | Reference to a national code |
Ref country code: DE Ref legal event code: R119 Ref document number: 602009027155 Country of ref document: DE |
|
| REG | Reference to a national code |
Ref country code: CH Ref legal event code: PL |
|
| GBPC | Gb: european patent ceased through non-payment of renewal fee |
Effective date: 20150513 |
|
| PG25 | Lapsed in a contracting state [announced via postgrant information from national office to epo] |
Ref country code: CH Free format text: LAPSE BECAUSE OF NON-PAYMENT OF DUE FEES Effective date: 20150531 Ref country code: LU Free format text: LAPSE BECAUSE OF FAILURE TO SUBMIT A TRANSLATION OF THE DESCRIPTION OR TO PAY THE FEE WITHIN THE PRESCRIBED TIME-LIMIT Effective date: 20150513 Ref country code: LI Free format text: LAPSE BECAUSE OF NON-PAYMENT OF DUE FEES Effective date: 20150531 Ref country code: MC Free format text: LAPSE BECAUSE OF FAILURE TO SUBMIT A TRANSLATION OF THE DESCRIPTION OR TO PAY THE FEE WITHIN THE PRESCRIBED TIME-LIMIT Effective date: 20141008 |
|
| REG | Reference to a national code |
Ref country code: IE Ref legal event code: MM4A |
|
| REG | Reference to a national code |
Ref country code: FR Ref legal event code: ST Effective date: 20160129 |
|
| PG25 | Lapsed in a contracting state [announced via postgrant information from national office to epo] |
Ref country code: SI Free format text: LAPSE BECAUSE OF FAILURE TO SUBMIT A TRANSLATION OF THE DESCRIPTION OR TO PAY THE FEE WITHIN THE PRESCRIBED TIME-LIMIT Effective date: 20141008 |
|
| PG25 | Lapsed in a contracting state [announced via postgrant information from national office to epo] |
Ref country code: DE Free format text: LAPSE BECAUSE OF NON-PAYMENT OF DUE FEES Effective date: 20151201 Ref country code: GB Free format text: LAPSE BECAUSE OF NON-PAYMENT OF DUE FEES Effective date: 20150513 Ref country code: IE Free format text: LAPSE BECAUSE OF NON-PAYMENT OF DUE FEES Effective date: 20150513 |
|
| PG25 | Lapsed in a contracting state [announced via postgrant information from national office to epo] |
Ref country code: FR Free format text: LAPSE BECAUSE OF NON-PAYMENT OF DUE FEES Effective date: 20150601 |
|
| PG25 | Lapsed in a contracting state [announced via postgrant information from national office to epo] |
Ref country code: MT Free format text: LAPSE BECAUSE OF FAILURE TO SUBMIT A TRANSLATION OF THE DESCRIPTION OR TO PAY THE FEE WITHIN THE PRESCRIBED TIME-LIMIT Effective date: 20141008 |
|
| PG25 | Lapsed in a contracting state [announced via postgrant information from national office to epo] |
Ref country code: HU Free format text: LAPSE BECAUSE OF FAILURE TO SUBMIT A TRANSLATION OF THE DESCRIPTION OR TO PAY THE FEE WITHIN THE PRESCRIBED TIME-LIMIT; INVALID AB INITIO Effective date: 20090513 Ref country code: BG Free format text: LAPSE BECAUSE OF FAILURE TO SUBMIT A TRANSLATION OF THE DESCRIPTION OR TO PAY THE FEE WITHIN THE PRESCRIBED TIME-LIMIT Effective date: 20141008 |
|
| PG25 | Lapsed in a contracting state [announced via postgrant information from national office to epo] |
Ref country code: TR Free format text: LAPSE BECAUSE OF FAILURE TO SUBMIT A TRANSLATION OF THE DESCRIPTION OR TO PAY THE FEE WITHIN THE PRESCRIBED TIME-LIMIT Effective date: 20141008 |
|
| PG25 | Lapsed in a contracting state [announced via postgrant information from national office to epo] |
Ref country code: BE Free format text: LAPSE BECAUSE OF FAILURE TO SUBMIT A TRANSLATION OF THE DESCRIPTION OR TO PAY THE FEE WITHIN THE PRESCRIBED TIME-LIMIT Effective date: 20141008 |
|
| PG25 | Lapsed in a contracting state [announced via postgrant information from national office to epo] |
Ref country code: MK Free format text: LAPSE BECAUSE OF FAILURE TO SUBMIT A TRANSLATION OF THE DESCRIPTION OR TO PAY THE FEE WITHIN THE PRESCRIBED TIME-LIMIT Effective date: 20141008 |
|
| REG | Reference to a national code |
Ref country code: HK Ref legal event code: WD Ref document number: 1186216 Country of ref document: HK |