US20020167544A1 - Graphical functions - Google Patents
Graphical functions Download PDFInfo
- Publication number
- US20020167544A1 US20020167544A1 US09/855,199 US85519901A US2002167544A1 US 20020167544 A1 US20020167544 A1 US 20020167544A1 US 85519901 A US85519901 A US 85519901A US 2002167544 A1 US2002167544 A1 US 2002167544A1
- Authority
- US
- United States
- Prior art keywords
- function
- graphical
- user input
- flow diagram
- defining
- Prior art date
- Legal status (The legal status is an assumption and is not a legal conclusion. Google has not performed a legal analysis and makes no representation as to the accuracy of the status listed.)
- Granted
Links
Images


Classifications
-
- G—PHYSICS
- G06—COMPUTING; CALCULATING OR COUNTING
- G06F—ELECTRIC DIGITAL DATA PROCESSING
- G06F8/00—Arrangements for software engineering
- G06F8/30—Creation or generation of source code
- G06F8/34—Graphical or visual programming
Definitions
- This invention relates to making and using graphical representations of functions that may be invoked in a modeling system for finite state machines.
- a finite state machine is a representation of an event-driven (reactive) system.
- the system makes a transition from one state (mode) to another prescribed state, provided that the condition defining the change is true.
- a state machine may be used to represent a car's automatic transmission.
- the transmission has a number of operating states: park, neutral, drive, reverse, and so on.
- the system makes a transition from one state to another when a driver shifts the stick from one position to another, for example, from park to neutral.
- Another method of modeling FSMs is to create a graphical representation (a statechart) of a finite state machine wherein states and transitions form the basic building blocks of the system.
- the invention provides a method and system using a computer having a graphical user interface and defining a function within a graphical representation of a finite state machine, representing the at least one function graphically; and calling the graphical function in a modeling system.
- the defining may include the using a function block, which in turn may have a function prototype and also a function flow diagram.
- the representation of the function uses graphical elements.
- the simulation system offers a means for graphical diagramming.
- the invention may be implemented as a computer program product, stored in a computer readable medium, having instructions to cause a computer to receive user input defining a graphical function and use it in a simulation.
- the invention may have further instructions to use a function block, a function prototype or a function flow diagram, or combinations thereof
- the function flow diagram may be assembled from graphical elements.
- the invention includes means for simulating a finite state machine.
- a user may cause the flow diagram to be hidden.
- FIG. 1 is a view of prior art showing a statechart modeling system screen.
- FIG. 2 is a graphical representation of a graphical function.
- FIG. 3 is a graphical function with the contents hidden.
- FIG. 4 is a diagram of a graphical function and an invocation of a graphical function.
- FIG. 5 is a view of an exemplary editing screen used to define a graphical function.
- FIG. 6 is a view of an exemplary editing screen showing an empty graphical function shell definition.
- FIG. 7 is a view of a graphical function showing a function prototype.
- FIG. 8 is a view of an exemplary function argument attributes editing screen.
- FIG. 9 shows a graphical function that shadows another graphical function.
- Graphical functions allow a user to use a diagram to represent visually a procedure performed by a function in a statechart system.
- a diagrammatic representation of the function procedure can be easier to understand and modify than a textual representation.
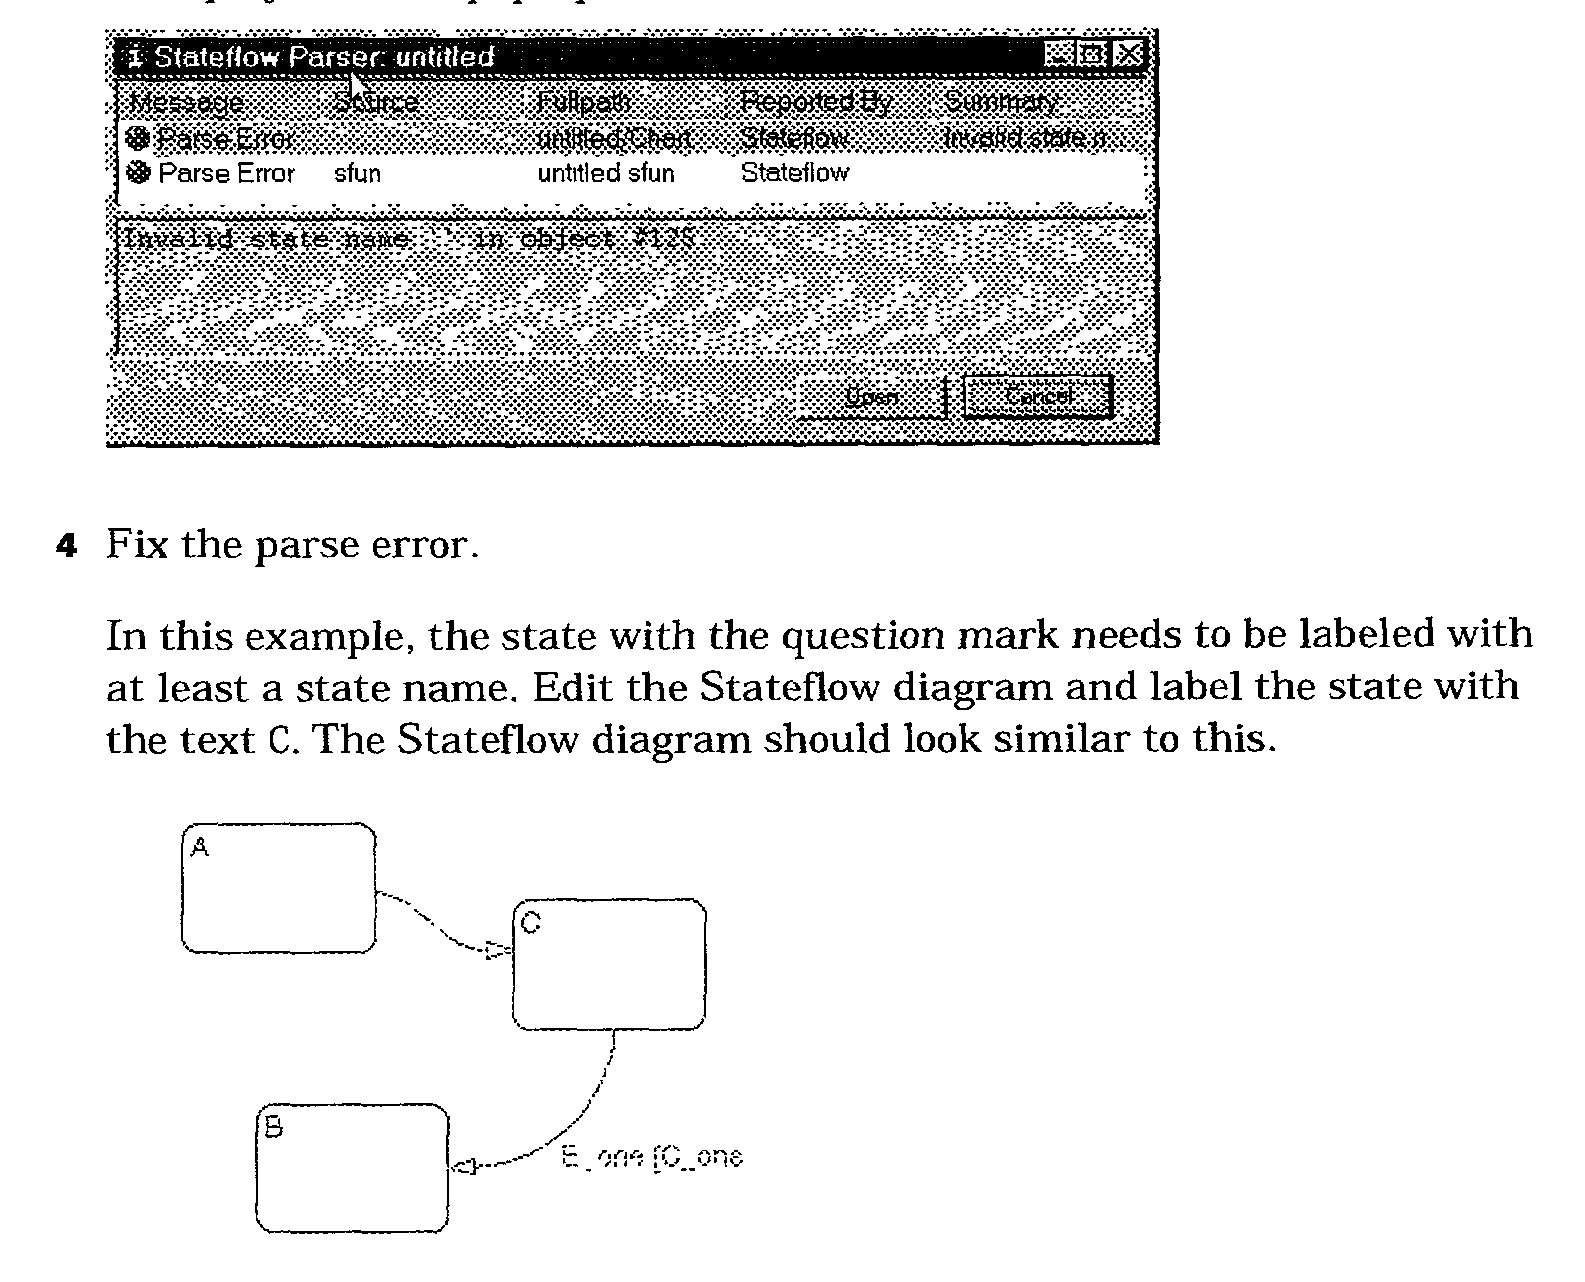
- the parser may be used to check the diagram for errors.
- a statechart system's diagram animation and debugging capabilities can be used to step through the graphical function to find errors.
- Stateflow® an example of a simple statechart 2 is shown using Stateflow®. Attached in Appendix I are portions of the user manual for Stateflow®, included herein by reference, containing descriptions and definitions of a number of terms use herein. States 4 , 6 , 8 and 10 are shown with transitions 12 , 14 , 16 , 18 20 and 22 modeling the states of an automobile transmission.
- FIG. 2 an exemplary implementation of a graphical function 30 is shown as embodied in Stateflow®.
- the graphical function as shown in this embodiment includes (i) a function block 32 ; (ii) a function prototype 34 ; (iii) a function flow diagram 36 ; (iv) function data (not shown) and (v) scoping rules (not shown). These are more specifically described below.
- a graphical function is represented in a state diagram by a function block 32 .
- the block 32 is named “function” to distinguish it from other block-like entities, such as states, and contains two elements: a function prototype 34 and a flow diagram 36 .
- the function prototype 34 specifies the syntax for invoking the function in state and transition actions. In an exemplary implementation described below, it has a function name 38 , a parameter list 40 listing arguments passed to the function when it is invoked, and a return parameter 44 representing a list of values returned by the function. Other structures may be used to accomplish a similar result.
- the number of parameters passed to the function may be any number.
- actions that invoke a graphical function pass arguments 40 and 42 to the function in the same order that they appear in the function's parameter list; however, other argument passing schemes could also be used beneficially.
- the function diagram 36 graphically defines the procedure performed by the graphical function.
- the function diagram 36 can by any type of diagram capable of describing a function (or procedure), including but not confined to data flow diagrams, control flow diagrams, state diagrams, etc.
- the function diagram can use the function's formal parameters 40 and 42 in actions performed by the flow diagram 36 .
- Argument parameters 40 and 42 are replaced by the actual argument values when the function is invoked.
- the last value assigned to the return parameter 44 is returned as the function's return value.
- a diagramming system in a statechart system preferably provides some way for a user to draw the function diagram.
- a function diagram for a complex function can take up a lot of space.
- a state diagramming system can save space by allowing a user to hide the function diagram.
- FIG. 3 shows an example of a function block 50 with its function diagram hidden.
- graphical functions use variables defined in a diagramming system's data dictionary to store intermediate results of computations.
- Variables that are defined within a graphical function are private to that function (and to any functions that are defined within that function), and thus need not be uniquely named in the system at large. This prevents one graphical function from overwriting the results of another function.
- the data dictionary approach allows a user to define special types of data items for use in functions, such as
- (i) Local a local data item persists from invocation to invocation. For example, if the item is equal to 1 when the function returns from one invocation, the item will equal 1 the next time the function is invoked;
- Constant a constant data item retains its initial value through all invocations of the function.
- a function's scope refers to the set of state diagram elements (states and transitions) that can invoke the function.
- the scope of a function is the scope of the state or statechart wherein it is defined statechart. The following exceptions apply:
- a statechart can export its functions.
- the functions exported by a chart can be invoked anywhere in the state machine in which the chart appears, including other charts that define the state machine.
- a graphical function shadows any functions of the same name defined in ancestors of that graphical function's parent state or chart.
- a state or transition that invokes function A will get the version of A defined closest to it in the state diagram hierarchy.
- FIG. 9 shows a transition condition 134 in state C 130 that invokes a graphical function name f1.
- the chart contains two definitions of f1, one 124 defined in state B 126 , the other 120 defined in state A 126 .
- state B's definition of f1 is the definition that is invoked when transition condition 134 is evaluated in state C. This is because state B is a more immediate ancestor of state C than is state A.
- a state or transition action may invoke a graphical function by replacing the formal parameters of the prototype with actual arguments and assigning the result to a variable.
- FIG. 4 shows a defined graphical function 60 named f1 62 that multiplies its arguments 64 and 66 and an invocation (call) 76 of f1 62 in the entry action 70 of a state 72 named A 74 .
- the return parameter 68 in the function prototype of f1 62 need not have the same name as the return parameter in the invocation of the function 78 .
- Invoking a graphical function generates an implicit CALL event. This event can be used within the graphical function in temporal logic expressions as conditions for executing state or transition actions.
- the system's statechart editor will handle development of graphical functions in a chart.
- the inputs may be user keystrokes, mouse actions, files or other common input methods.
- the output is normally a statechart containing graphical function definitions and invocations of graphical functions.
- graphical functions use existing charting elements of an existing statechart system, e.g., blocks, labels, and flow diagrams. No special chart editing techniques are required to create graphical functions.
- a person skilled in the art of computer graphics can readily enhance a chart editor to support creation of graphical functions.
- a statechart system's code generation subsystem handles conversion of graphical functions into generated code.
- the input to the code generation process is one or more charts containing graphical function definitions and invocations.
- the output may be in a high-level language code (such as C or other high level language) or if preferred, may be in assembly code or other lower level language that realizes the state machine represented by the charts.
- Graphical functions are usually represented by inline code or by the equivalent functional representations in the target language. For example, if the target language is C, graphical functions are translated into C functions in the generated code.
- Code generation from a statechart typically occurs in three phases: parse, optimization, and synthesis.
- parse optimization
- synthesis synthesis
- Parse Phase this phase accepts a chart as input and converts it to an intermediate representation (IR) that facilitates code generation in the final phase. Handling graphical functions in this phase requires adding a function definition parse phase at the beginning of the statechart parse phase. In this initial phase, the parser makes a pass through the statechart searching for graphical function definitions. For each definition, the system converts the graphical function to the intermediate representation for a function. In particular, the graphical function's prototype is converted to an IR function prototype and the graphical function's function graph is converted to IR code. If the function graph is a standard graph type of the charting system, no new programming is required to parse the function graph.
- IR intermediate representation
- the statechart parser parsing proceeds in the usual manner with one exception. Whenever the parser encounters a function invocation in a state or transition, it checks whether the function being invoked is a graphical function. If it is, the parser checks to ensure that the function invocation is complies with applicable syntax rules.a.
- optimization Phase When generating code, statechart systems typically look for opportunities to optimize the generated code. The performance of code generated from statecharts that use graphical functions can be improved by inlining the code generated for simple functions. Inlining is possible only if the function is never invoked recursively. Thus, the optimization phase must first determine for each graphical function, whether it is directly or indirectly recursive. A function, F, is directly recursive if F invokes itself. F is indirectly recursive, if F is invoked directly or indirectly by any function that F invokes. One method of determining if a graphical function is recursive is to construct the call graph for the function and examine the graph for cycles. If no cycles exist, the function is not recursive and can be inlined.
- Inlining presents a tradeoff between performance and footprint. Inlining functions increases the performance of the generated code but it also increases its read-only memory (ROM) requirements. Typically code generation systems handle this tradeoff by inlining only functions whose complexity is less than some predefined threshold. For example, one technique is to use the number of generated statements as a measure of complexity. Other well-known complexity measures can be used, such as ROM usage, RAM usage, or speed of execution, depending on the requirements of the system.
- Synthesis Phase The synthesis phase of code generation accepts the intermediate code representation as input and outputs code in a specified target language (e.g., C). Assuming that the IR used by the statechart system includes a scheme for representing functions, no special processing is necessary to handle graphical functions in this phase.
- a specified target language e.g., C
- a function can reside anywhere in a state diagram, either at the top level or within any state or subchart.
- the location of a function definition determines its scope, that is, the set of states and transitions that can invoke the function.
- the scope of a function is the scope of its parent state or chart, with two exceptions:
- a child of the function's parent defines a function of the same name, in which case the function defined in the parent is not visible anywhere in the child or its children.
- a function defined in a state or subchart shadows any functions of the same defined in the ancestors of that state or subchart.
- an exemplary object definition screen 80 is shown.
- a blank and undefined object 81 is shown, with a shortcut menu 86 .
- the undefined object is converted from a state to a graphical function.
- the selected function 90 appears as an unnamed object with a function label 91 .
- a function label 93 is shown wherein a user has entered a function prototype 92 in the function label 93 .
- the function prototype specifies a name 92 for the function and formal names for its arguments 98 , 100 and return value 96 .
- a prototype has the syntax
- f is the function's name
- a 1 , a 2 an are formal names for its arguments
- y is the formal name for its return value.
- the Scope field 104 indicates the role of the corresponding argument or return value.
- Arguments have scope Input 106 , and 108 .
- a return value has scope Output 110 .
- the number that appears in parentheses for the scope of each argument is the order in which the argument appears in the function's prototype. When a graphical function is invoked, arguments are preferably passed to the function in the same order as the function prototype.
- scope refers to the role (argument or return value) of the data items specified by the function's prototype. In this sense, arguments and return values have local scope. They are visible only in the flow diagram that implements the function.
- the system updates the data dictionary to reflect the changes.
- a user may specify other data properties such as data type 112 or initial value 114 , etc. of the function's arguments and return values.
- Other data properties may be defined as desired.
- a user defines any additional data items that the function may need to process when it is invoked.
- a function must use a qualified name to access a data item that it does not own.
- the qualified name of a data item is the data item's name prepended with the names of the data item's owner and the ancestors of the owner. For example, suppose that data item x is owned by state B which is the child of state A and that state A is parented by the chart. Then the qualified name of x is A.B.x.
- a function may use unqualified names to access items that it owns. The items created can have any of local, temporary or constant scopes.
- the flow diagram preferably includes a default transition terminated by a junction.
- FIG. 2 shows a minimal flow diagram 36 for a graphical function 32 that computes the product of its arguments 40 and 42 .
- the transition may include any function elements that the system is capable of supporting, such as sine, cosine, statistical functions, complex functions and the like.
- Any state or transition action that is in the scope of a graphical function can invoke that function.
- the invocation syntax is the same as that of the function prototype, with actual arguments replacing the formal parameters specified in the prototype. If the data types of the actual and formal argument differ, the exemplary embodiment casts the actual argument to the type of the formal parameter.
- FIG. 4, discussed above, shows an exemplary embodiment of a state entry action that invokes a function that returns the product of its arguments.
Abstract
Description
- This invention relates to making and using graphical representations of functions that may be invoked in a modeling system for finite state machines.
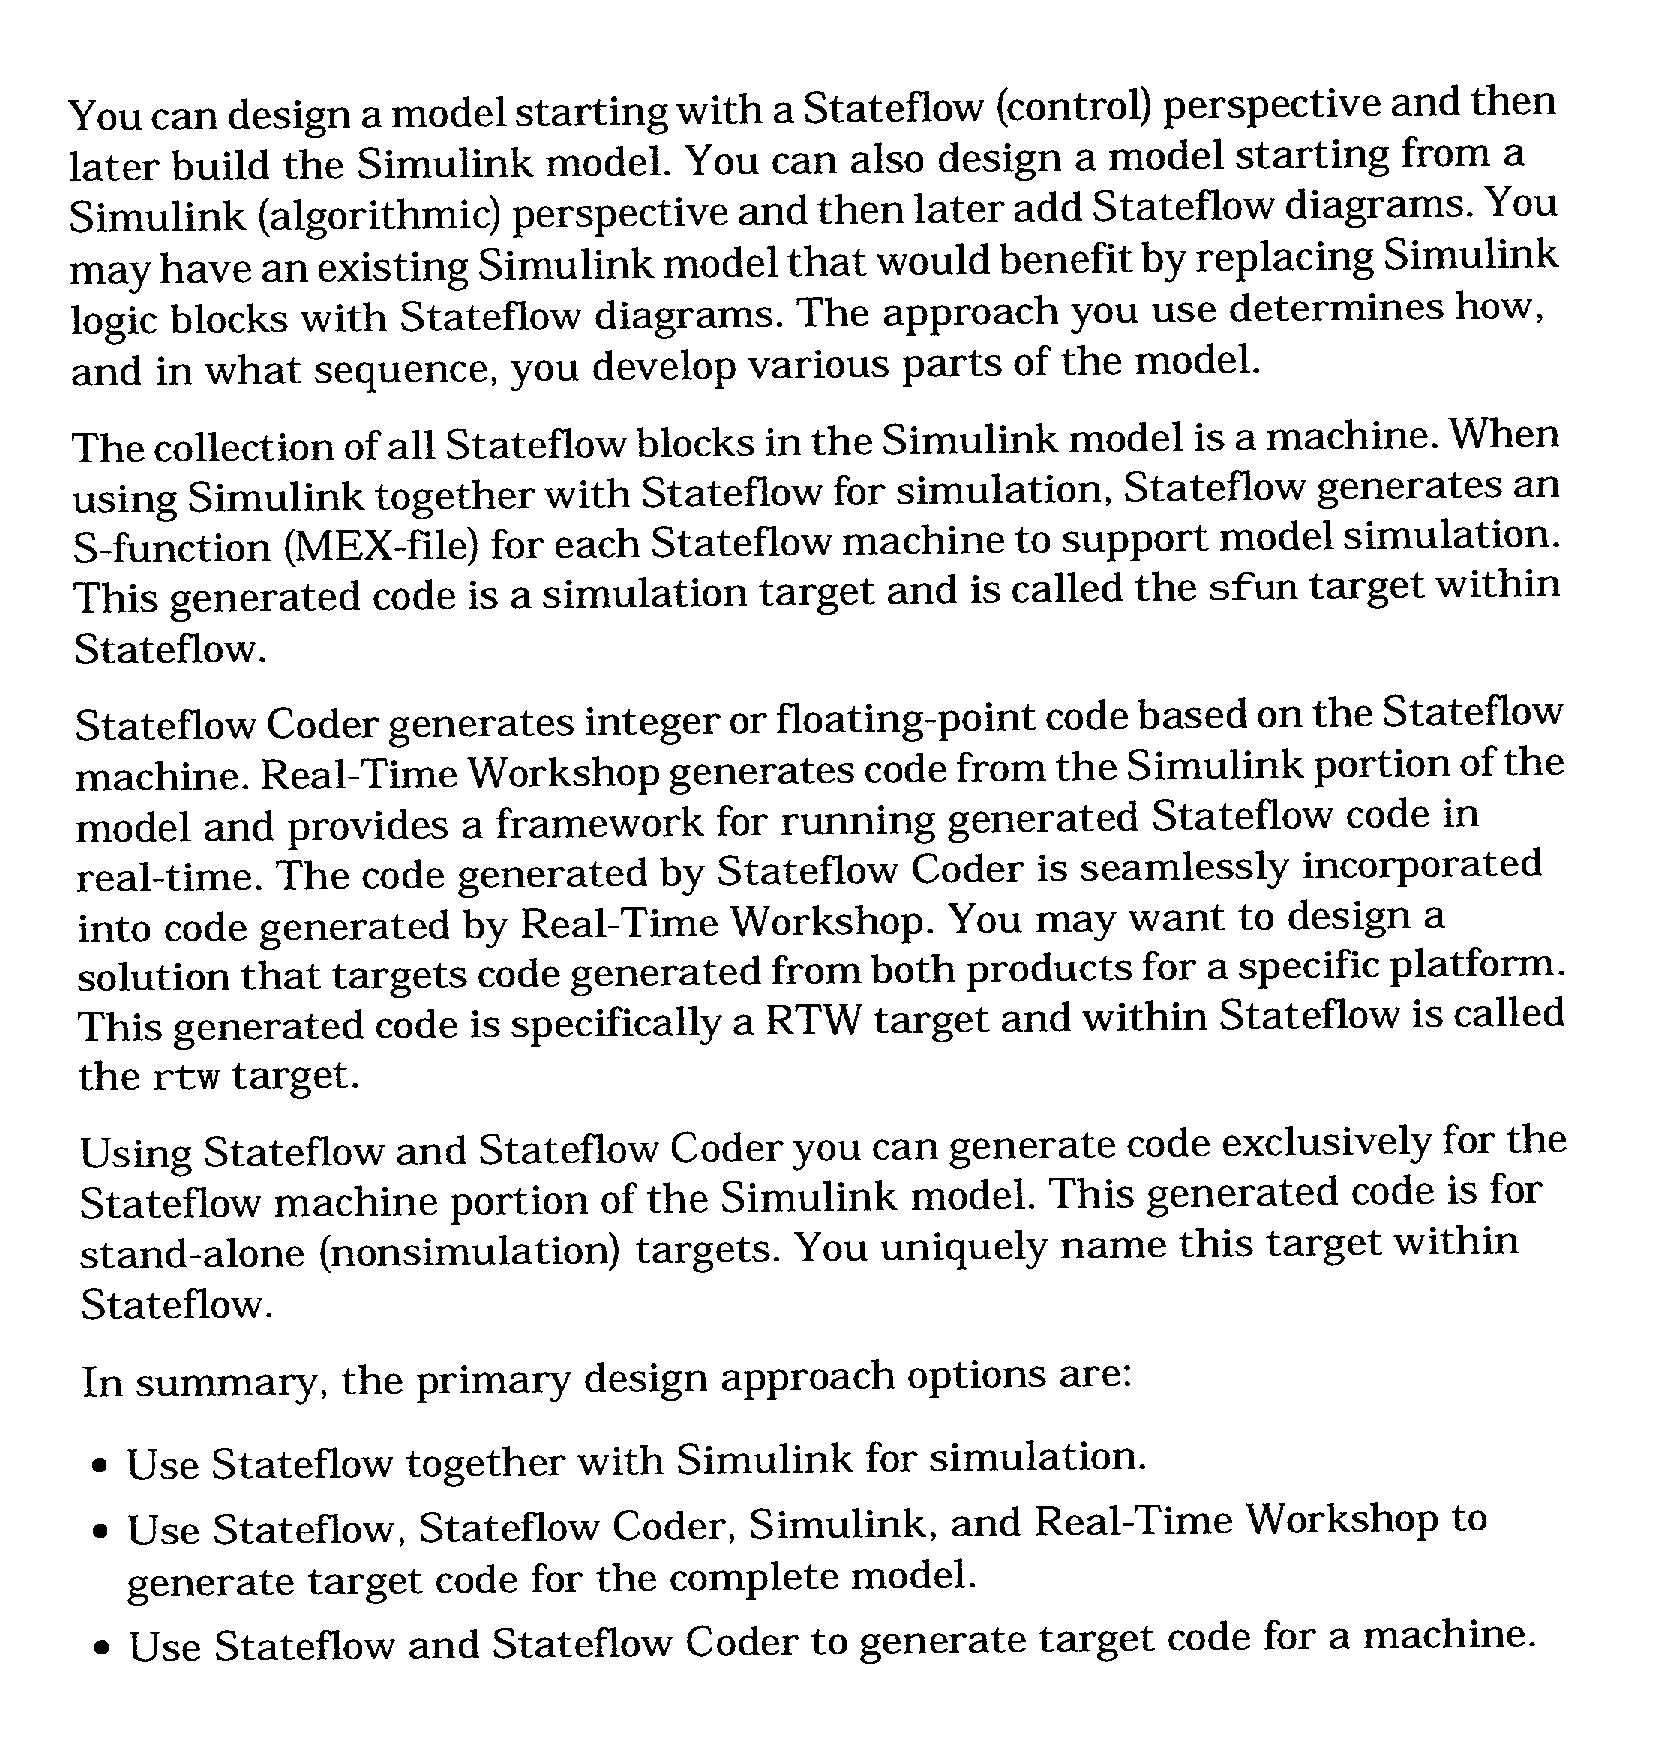
- A finite state machine (FSM) is a representation of an event-driven (reactive) system. In an event-driven system, the system makes a transition from one state (mode) to another prescribed state, provided that the condition defining the change is true. For example, a state machine may be used to represent a car's automatic transmission. The transmission has a number of operating states: park, neutral, drive, reverse, and so on. The system makes a transition from one state to another when a driver shifts the stick from one position to another, for example, from park to neutral.
- Designers have used truth tables to represent relationships among the inputs, outputs, and states of an FSM. The resulting table describes the logic necessary to control the behavior of the system under study. Another approach to designing event-driven systems is to model the behavior of the system by describing it in terms of transitions among states. The state that is active is determined based on the occurrence of events under certain conditions. State-transition diagrams (STDs) and bubble diagrams are graphical representations based on this approach.
- Another method of modeling FSMs is to create a graphical representation (a statechart) of a finite state machine wherein states and transitions form the basic building blocks of the system.
- Existing statechart systems for modeling finite state machines permit a user to embed textual definitions of functions in a statechart and invoke those functions in the statechart. In a textually defined function, the procedure performed by the function is defined by code.
- In one aspect, the invention provides a method and system using a computer having a graphical user interface and defining a function within a graphical representation of a finite state machine, representing the at least one function graphically; and calling the graphical function in a modeling system. The defining may include the using a function block, which in turn may have a function prototype and also a function flow diagram. In another aspect, the representation of the function uses graphical elements. In yet another aspect, the simulation system offers a means for graphical diagramming.
- In still another aspect, the invention may be implemented as a computer program product, stored in a computer readable medium, having instructions to cause a computer to receive user input defining a graphical function and use it in a simulation. In other aspects, the invention may have further instructions to use a function block, a function prototype or a function flow diagram, or combinations thereof The function flow diagram may be assembled from graphical elements.
- In yet another aspect, the invention includes means for simulating a finite state machine. In still another aspect, a user may cause the flow diagram to be hidden. The details of one or more embodiments of the invention are set forth in the accompanying drawings and the description below. Other features, objects, and advantages of the invention will be apparent from the description and drawings, and from the claims.
- FIG. 1 is a view of prior art showing a statechart modeling system screen.
- FIG. 2 is a graphical representation of a graphical function.
- FIG. 3 is a graphical function with the contents hidden.
- FIG. 4 is a diagram of a graphical function and an invocation of a graphical function.
- FIG. 5 is a view of an exemplary editing screen used to define a graphical function.
- FIG. 6 is a view of an exemplary editing screen showing an empty graphical function shell definition.
- FIG. 7 is a view of a graphical function showing a function prototype.
- FIG. 8 is a view of an exemplary function argument attributes editing screen.
- FIG. 9 shows a graphical function that shadows another graphical function.
- Like reference symbols in the various drawings indicate like elements.
- Graphical functions allow a user to use a diagram to represent visually a procedure performed by a function in a statechart system. A diagrammatic representation of the function procedure can be easier to understand and modify than a textual representation. In a statechart system which includes built-in state diagram parsing capabilities, the parser may be used to check the diagram for errors. A statechart system's diagram animation and debugging capabilities can be used to step through the graphical function to find errors.
- Referring to FIG. 1, an example of a
simple statechart 2 is shown using Stateflow®. Attached in Appendix I are portions of the user manual for Stateflow®, included herein by reference, containing descriptions and definitions of a number of terms use herein.States transitions - Referring to FIG. 2, an exemplary implementation of a
graphical function 30 is shown as embodied in Stateflow®. The graphical function as shown in this embodiment includes (i) afunction block 32; (ii) a function prototype 34; (iii) a function flow diagram 36; (iv) function data (not shown) and (v) scoping rules (not shown). These are more specifically described below. - A graphical function is represented in a state diagram by a
function block 32. In the example embodiment, theblock 32 is named “function” to distinguish it from other block-like entities, such as states, and contains two elements: a function prototype 34 and a flow diagram 36. - The function prototype 34 specifies the syntax for invoking the function in state and transition actions. In an exemplary implementation described below, it has a
function name 38, aparameter list 40 listing arguments passed to the function when it is invoked, and areturn parameter 44 representing a list of values returned by the function. Other structures may be used to accomplish a similar result. The number of parameters passed to the function may be any number. In the described embodiment, actions that invoke a graphicalfunction pass arguments - The function diagram 36 graphically defines the procedure performed by the graphical function. The function diagram 36 can by any type of diagram capable of describing a function (or procedure), including but not confined to data flow diagrams, control flow diagrams, state diagrams, etc. The function diagram can use the function's
formal parameters Argument parameters return parameter 44 is returned as the function's return value. - A diagramming system in a statechart system preferably provides some way for a user to draw the function diagram. A function diagram for a complex function can take up a lot of space. A state diagramming system can save space by allowing a user to hide the function diagram. FIG. 3 shows an example of a
function block 50 with its function diagram hidden. - In the described embodiment, graphical functions use variables defined in a diagramming system's data dictionary to store intermediate results of computations. Variables that are defined within a graphical function are private to that function (and to any functions that are defined within that function), and thus need not be uniquely named in the system at large. This prevents one graphical function from overwriting the results of another function. The data dictionary approach allows a user to define special types of data items for use in functions, such as
- (i) Local: a local data item persists from invocation to invocation. For example, if the item is equal to 1 when the function returns from one invocation, the item will equal 1 the next time the function is invoked;
- (ii) Temporary: the system initializes a new copy of a temporary item for each invocation of the function; and
- (iii) Constant: a constant data item retains its initial value through all invocations of the function.
- (iv) Input: a data item that is an argument to the function.
- (v) Output: a data item that is a value returned by the function.
- A function's scope refers to the set of state diagram elements (states and transitions) that can invoke the function. In the example embodiment, the scope of a function is the scope of the state or statechart wherein it is defined statechart. The following exceptions apply:
- (i) A statechart can export its functions. The functions exported by a chart can be invoked anywhere in the state machine in which the chart appears, including other charts that define the state machine.
- (ii) A graphical function shadows any functions of the same name defined in ancestors of that graphical function's parent state or chart. In other words, a state or transition that invokes function A will get the version of A defined closest to it in the state diagram hierarchy. For example, FIG. 9 shows a
transition condition 134 instate C 130 that invokes a graphical function name f1. The chart contains two definitions of f1, one 124 defined instate B 126, the other 120 defined instate A 126. In this example, state B's definition of f1 is the definition that is invoked whentransition condition 134 is evaluated in state C. This is because state B is a more immediate ancestor of state C than is state A. - A state or transition action may invoke a graphical function by replacing the formal parameters of the prototype with actual arguments and assigning the result to a variable. For example, FIG. 4 shows a defined
graphical function 60 namedf1 62 that multiplies itsarguments f1 62 in theentry action 70 of astate 72 namedA 74. Note that thereturn parameter 68 in the function prototype off1 62 need not have the same name as the return parameter in the invocation of thefunction 78. - Invoking a graphical function generates an implicit CALL event. This event can be used within the graphical function in temporal logic expressions as conditions for executing state or transition actions.
- In a typical embodiment in a statechart system, the system's statechart editor will handle development of graphical functions in a chart. The inputs may be user keystrokes, mouse actions, files or other common input methods. The output is normally a statechart containing graphical function definitions and invocations of graphical functions. In the embodiment described, graphical functions use existing charting elements of an existing statechart system, e.g., blocks, labels, and flow diagrams. No special chart editing techniques are required to create graphical functions. A person skilled in the art of computer graphics can readily enhance a chart editor to support creation of graphical functions.
- A statechart system's code generation subsystem handles conversion of graphical functions into generated code. The input to the code generation process is one or more charts containing graphical function definitions and invocations. The output may be in a high-level language code (such as C or other high level language) or if preferred, may be in assembly code or other lower level language that realizes the state machine represented by the charts. Graphical functions are usually represented by inline code or by the equivalent functional representations in the target language. For example, if the target language is C, graphical functions are translated into C functions in the generated code.
- Code generation from a statechart typically occurs in three phases: parse, optimization, and synthesis. The following describes an exemplary implementation to handle charts containing graphical function definitions. Other implementations are of course possible.
- Parse Phase: this phase accepts a chart as input and converts it to an intermediate representation (IR) that facilitates code generation in the final phase. Handling graphical functions in this phase requires adding a function definition parse phase at the beginning of the statechart parse phase. In this initial phase, the parser makes a pass through the statechart searching for graphical function definitions. For each definition, the system converts the graphical function to the intermediate representation for a function. In particular, the graphical function's prototype is converted to an IR function prototype and the graphical function's function graph is converted to IR code. If the function graph is a standard graph type of the charting system, no new programming is required to parse the function graph.
- Once the initial graphical function definition parsing phase is completed, the statechart parser parsing proceeds in the usual manner with one exception. Whenever the parser encounters a function invocation in a state or transition, it checks whether the function being invoked is a graphical function. If it is, the parser checks to ensure that the function invocation is complies with applicable syntax rules.a.
- Optimization Phase: When generating code, statechart systems typically look for opportunities to optimize the generated code. The performance of code generated from statecharts that use graphical functions can be improved by inlining the code generated for simple functions. Inlining is possible only if the function is never invoked recursively. Thus, the optimization phase must first determine for each graphical function, whether it is directly or indirectly recursive. A function, F, is directly recursive if F invokes itself. F is indirectly recursive, if F is invoked directly or indirectly by any function that F invokes. One method of determining if a graphical function is recursive is to construct the call graph for the function and examine the graph for cycles. If no cycles exist, the function is not recursive and can be inlined.
- Even if a function can be inlined, it may not be desirable to inline it. Inlining presents a tradeoff between performance and footprint. Inlining functions increases the performance of the generated code but it also increases its read-only memory (ROM) requirements. Typically code generation systems handle this tradeoff by inlining only functions whose complexity is less than some predefined threshold. For example, one technique is to use the number of generated statements as a measure of complexity. Other well-known complexity measures can be used, such as ROM usage, RAM usage, or speed of execution, depending on the requirements of the system.
- Synthesis Phase: The synthesis phase of code generation accepts the intermediate code representation as input and outputs code in a specified target language (e.g., C). Assuming that the IR used by the statechart system includes a scheme for representing functions, no special processing is necessary to handle graphical functions in this phase.
- The following describes the declaration and use of graphical functions in an exemplary statechart system.
- First determine one or more states in a model where it is desired that the function appear. A function can reside anywhere in a state diagram, either at the top level or within any state or subchart. The location of a function definition determines its scope, that is, the set of states and transitions that can invoke the function. In particular, the scope of a function is the scope of its parent state or chart, with two exceptions:
- (i) a chart containing the function exports its graphical functions, in which case the scope of the function is the scope of its parent state machine; and
- (ii) (ii) a child of the function's parent defines a function of the same name, in which case the function defined in the parent is not visible anywhere in the child or its children. In other words, a function defined in a state or subchart shadows any functions of the same defined in the ancestors of that state or subchart.
- Referring to FIG. 5, an exemplary
object definition screen 80 is shown. A blank andundefined object 81 is shown, with ashortcut menu 86. SelectingFunction 82 from the Type 88submenu 84 of the newly created state's 81shortcut menu 86. - The undefined object is converted from a state to a graphical function.
- Referring to FIG. 6, the selected
function 90 appears as an unnamed object with afunction label 91. - Referring to FIG. 7, a
function label 93 is shown wherein a user has entered afunction prototype 92 in thefunction label 93. The function prototype specifies aname 92 for the function and formal names for itsarguments value 96. A prototype has the syntax - y=f(a 1, a2, . . . an)
- where f is the function's name, a 1, a2, an are formal names for its arguments, and y is the formal name for its return value.
- Referring to FIG. 8, the
return value 96 andarguments function object 102. - The
Scope field 104 indicates the role of the corresponding argument or return value. Arguments havescope Input scope Output 110. The number that appears in parentheses for the scope of each argument is the order in which the argument appears in the function's prototype. When a graphical function is invoked, arguments are preferably passed to the function in the same order as the function prototype. - The term scope refers to the role (argument or return value) of the data items specified by the function's prototype. In this sense, arguments and return values have local scope. They are visible only in the flow diagram that implements the function.
- In the shown embodiment, one may use a graphics editor to change the prototype of a graphical function at any time. When done editing the prototype, the system updates the data dictionary to reflect the changes.
- If desired, a user may specify other data properties such as
data type 112 orinitial value 114, etc. of the function's arguments and return values. Other data properties may be defined as desired. - The following restrictions preferably apply to argument and return value properties.
- i. Arguments cannot have initial values.
- ii. Arguments must have scope Input.
- iii. Arguments must have scope Input. Note that the data item property “Input scope” has different meanings in different contexts. In the context of a graphical function, “Input scop” simply means that the data item is a function argument.
- iv. Return values must have scope Output. Note that the data property “Output scope” has different meanings in different contexts. In the context of a graphical function, “Output scope” simply means that the data item is a function return value.
- v. Arguments and return values cannot be referenced outside the graphical function.
- A user defines any additional data items that the function may need to process when it is invoked.
- A function must use a qualified name to access a data item that it does not own. The qualified name of a data item is the data item's name prepended with the names of the data item's owner and the ancestors of the owner. For example, suppose that data item x is owned by state B which is the child of state A and that state A is parented by the chart. Then the qualified name of x is A.B.x. A function may use unqualified names to access items that it owns. The items created can have any of local, temporary or constant scopes.
- In the example embodiment shown, the flow diagram preferably includes a default transition terminated by a junction. FIG. 2 shows a minimal flow diagram 36 for a
graphical function 32 that computes the product of itsarguments - Any state or transition action that is in the scope of a graphical function can invoke that function. The invocation syntax is the same as that of the function prototype, with actual arguments replacing the formal parameters specified in the prototype. If the data types of the actual and formal argument differ, the exemplary embodiment casts the actual argument to the type of the formal parameter. FIG. 4, discussed above, shows an exemplary embodiment of a state entry action that invokes a function that returns the product of its arguments.
- A number of embodiments of the invention have been described. Nevertheless, it will be understood that various modifications may be made without departing from the spirit and scope of the invention. For example, different graphical drawing schemes may be used to define graphical functions, and the scoping rules may be varied. Different data types may be used as well. Accordingly, other embodiments are within the scope of the following claims.


Claims (25)
Priority Applications (4)
| Application Number | Priority Date | Filing Date | Title |
|---|---|---|---|
| US09/855,199 US7720656B2 (en) | 2001-05-14 | 2001-05-14 | Graphical functions |
| US12/627,836 US7877245B1 (en) | 2001-05-14 | 2009-11-30 | Graphical functions |
| US13/012,314 US8170850B1 (en) | 2001-05-14 | 2011-01-24 | Graphical functions |
| US13/460,153 US20120215508A1 (en) | 2001-05-14 | 2012-04-30 | Graphical functions |
Applications Claiming Priority (1)
| Application Number | Priority Date | Filing Date | Title |
|---|---|---|---|
| US09/855,199 US7720656B2 (en) | 2001-05-14 | 2001-05-14 | Graphical functions |
Related Child Applications (1)
| Application Number | Title | Priority Date | Filing Date |
|---|---|---|---|
| US12/627,836 Continuation US7877245B1 (en) | 2001-05-14 | 2009-11-30 | Graphical functions |
Publications (2)
| Publication Number | Publication Date |
|---|---|
| US20020167544A1 true US20020167544A1 (en) | 2002-11-14 |
| US7720656B2 US7720656B2 (en) | 2010-05-18 |
Family
ID=25320591
Family Applications (4)
| Application Number | Title | Priority Date | Filing Date |
|---|---|---|---|
| US09/855,199 Active 2024-10-28 US7720656B2 (en) | 2001-05-14 | 2001-05-14 | Graphical functions |
| US12/627,836 Expired - Fee Related US7877245B1 (en) | 2001-05-14 | 2009-11-30 | Graphical functions |
| US13/012,314 Expired - Lifetime US8170850B1 (en) | 2001-05-14 | 2011-01-24 | Graphical functions |
| US13/460,153 Abandoned US20120215508A1 (en) | 2001-05-14 | 2012-04-30 | Graphical functions |
Family Applications After (3)
| Application Number | Title | Priority Date | Filing Date |
|---|---|---|---|
| US12/627,836 Expired - Fee Related US7877245B1 (en) | 2001-05-14 | 2009-11-30 | Graphical functions |
| US13/012,314 Expired - Lifetime US8170850B1 (en) | 2001-05-14 | 2011-01-24 | Graphical functions |
| US13/460,153 Abandoned US20120215508A1 (en) | 2001-05-14 | 2012-04-30 | Graphical functions |
Country Status (1)
| Country | Link |
|---|---|
| US (4) | US7720656B2 (en) |
Cited By (26)
| Publication number | Priority date | Publication date | Assignee | Title |
|---|---|---|---|---|
| US20050080600A1 (en) * | 2003-10-10 | 2005-04-14 | Synopsys, Inc. | Mixed-signal finite state machine models ensuring analog continuity |
| WO2007061784A2 (en) * | 2005-11-17 | 2007-05-31 | The Mathworks, Inc. | Application of optimization techniques to intermediate representations for code generation |
| US20070282606A1 (en) * | 2006-05-30 | 2007-12-06 | Motorola, Inc | Frame goals for dialog system |
| US20070282570A1 (en) * | 2006-05-30 | 2007-12-06 | Motorola, Inc | Statechart generation using frames |
| US20070282593A1 (en) * | 2006-05-30 | 2007-12-06 | Motorola, Inc | Hierarchical state machine generation for interaction management using goal specifications |
| US20080005739A1 (en) * | 2006-06-30 | 2008-01-03 | Wasim Sadiq | Defining a Status Model for a Computer System |
| US20080005152A1 (en) * | 2006-06-30 | 2008-01-03 | Frank Michael Kraft | Using Status Models with State Guards in a Computer System |
| US20080005162A1 (en) * | 2006-06-30 | 2008-01-03 | Frank Michael Kraft | Using Status Models in a Computer System |
| US20080147364A1 (en) * | 2006-12-15 | 2008-06-19 | Motorola, Inc. | Method and apparatus for generating harel statecharts using forms specifications |
| US20080162672A1 (en) * | 2006-12-28 | 2008-07-03 | Alexander Krasinskiy | Communicating with a Status Management Component in a Computer System |
| US20080263513A1 (en) * | 2007-04-20 | 2008-10-23 | Neumann Nicholas G | Event Firing Node for Asynchronously Passing Events from a Graphical Data Flow Program to a Statechart |
| US20080263463A1 (en) * | 2007-04-20 | 2008-10-23 | Neumann Nicholas G | Configurable Wires in a Statechart |
| US20090222246A1 (en) * | 2005-06-28 | 2009-09-03 | Do Linh N | High-Level, Graphical Programming Language and Tool for Well Management Programming |
| US8122354B1 (en) * | 2005-02-25 | 2012-02-21 | The Mathworks, Inc. | Systems and methods for providing an indicator of detection of input related to an element of a user interface |
| US8200715B1 (en) | 2006-06-30 | 2012-06-12 | Sap Ag | Using status models with adaptable process steps in a computer system |
| US20120291003A1 (en) * | 2005-08-30 | 2012-11-15 | The Mathworks, Inc. | System and method for creating and using graphical object instances in a statechart environment |
| US8365200B1 (en) | 2006-06-30 | 2013-01-29 | Sap Ag | Using cancellation status models in a computer system |
| US8504980B1 (en) | 2008-04-14 | 2013-08-06 | Sap Ag | Constraining data changes during transaction processing by a computer system |
| US20130275389A1 (en) * | 2012-04-16 | 2013-10-17 | Sap Ag | Verification of Status Schemas based on Business Goal Definitions |
| US20140040217A1 (en) * | 2012-08-06 | 2014-02-06 | Sap Ag | Checking Compatibility of Extended and Core SAM Schemas Based on Complex Goals |
| US8706776B1 (en) | 2006-06-30 | 2014-04-22 | Sap Ag | Extending status models in a computer system |
| US9460239B1 (en) * | 2003-12-10 | 2016-10-04 | The Mathworks, Inc. | System and method for using a graphical debugging tool in a modeling and execution environment |
| CN108334320A (en) * | 2016-12-22 | 2018-07-27 | 国立民用航空学院 | Method and apparatus for processing software code |
| US10223076B1 (en) * | 2016-08-29 | 2019-03-05 | The Mathworks, Inc. | Generating code based on user interactions with a user interface element in a code editor |
| US10417594B2 (en) | 2013-05-02 | 2019-09-17 | Sap Se | Validation of functional correctness of SAM schemas including action chains |
| US10949173B1 (en) | 2018-10-29 | 2021-03-16 | The Mathworks, Inc. | Systems and methods for automatic code generation |
Families Citing this family (11)
| Publication number | Priority date | Publication date | Assignee | Title |
|---|---|---|---|---|
| US7720656B2 (en) * | 2001-05-14 | 2010-05-18 | The Math Works, Inc. | Graphical functions |
| US8798971B2 (en) * | 2002-10-10 | 2014-08-05 | The Mathworks, Inc. | System and method for using a truth table graphical function in a statechart |
| US8046751B1 (en) | 2007-01-11 | 2011-10-25 | The Mathworks, Inc. | Structuring unstructured regions in a control flow graph |
| US8826255B1 (en) * | 2007-06-18 | 2014-09-02 | The Mathworks, Inc. | Restructuring control flow graphs generated from a model |
| US8250541B2 (en) * | 2007-09-20 | 2012-08-21 | The Boeing Company | Reversible object code compiler for mathematical models |
| US8381174B2 (en) * | 2007-10-31 | 2013-02-19 | National Instruments Corporation | Global variable structure in a graphical program |
| US8730245B2 (en) * | 2008-12-01 | 2014-05-20 | Naturalmotion Ltd. | Defining an animation of a virtual object within a virtual world |
| WO2013123376A1 (en) * | 2012-02-15 | 2013-08-22 | The Mathworks, Inc. | Unified state transition table describing a state machine model |
| JP6038959B2 (en) | 2012-02-15 | 2016-12-07 | ザ マスワークス, インクThe Mathworks, Inc. | Integrated state transition table describing state machine model |
| WO2016002076A1 (en) * | 2014-07-04 | 2016-01-07 | 三菱電機株式会社 | Synchronization control setting method for positioning control device |
| US10318251B1 (en) * | 2016-01-11 | 2019-06-11 | Altair Engineering, Inc. | Code generation and simulation for graphical programming |
Citations (1)
| Publication number | Priority date | Publication date | Assignee | Title |
|---|---|---|---|---|
| US20020083413A1 (en) * | 2000-12-20 | 2002-06-27 | National Instruments Corporation | System and method for programmatically generating a graphical program in response to a state diagram |
Family Cites Families (1)
| Publication number | Priority date | Publication date | Assignee | Title |
|---|---|---|---|---|
| US7720656B2 (en) * | 2001-05-14 | 2010-05-18 | The Math Works, Inc. | Graphical functions |
-
2001
- 2001-05-14 US US09/855,199 patent/US7720656B2/en active Active
-
2009
- 2009-11-30 US US12/627,836 patent/US7877245B1/en not_active Expired - Fee Related
-
2011
- 2011-01-24 US US13/012,314 patent/US8170850B1/en not_active Expired - Lifetime
-
2012
- 2012-04-30 US US13/460,153 patent/US20120215508A1/en not_active Abandoned
Patent Citations (1)
| Publication number | Priority date | Publication date | Assignee | Title |
|---|---|---|---|---|
| US20020083413A1 (en) * | 2000-12-20 | 2002-06-27 | National Instruments Corporation | System and method for programmatically generating a graphical program in response to a state diagram |
Cited By (49)
| Publication number | Priority date | Publication date | Assignee | Title |
|---|---|---|---|---|
| US20050080600A1 (en) * | 2003-10-10 | 2005-04-14 | Synopsys, Inc. | Mixed-signal finite state machine models ensuring analog continuity |
| US7299164B2 (en) * | 2003-10-10 | 2007-11-20 | Synopsys, Inc. | Mixed-signal finite state machine models ensuring analog continuity |
| US9460239B1 (en) * | 2003-12-10 | 2016-10-04 | The Mathworks, Inc. | System and method for using a graphical debugging tool in a modeling and execution environment |
| US8122354B1 (en) * | 2005-02-25 | 2012-02-21 | The Mathworks, Inc. | Systems and methods for providing an indicator of detection of input related to an element of a user interface |
| US8661344B1 (en) | 2005-02-25 | 2014-02-25 | The Mathworks, Inc. | Systems and methods for providing an indicator of detection of input related to an element of a user interface |
| US20090222246A1 (en) * | 2005-06-28 | 2009-09-03 | Do Linh N | High-Level, Graphical Programming Language and Tool for Well Management Programming |
| US20120291003A1 (en) * | 2005-08-30 | 2012-11-15 | The Mathworks, Inc. | System and method for creating and using graphical object instances in a statechart environment |
| US8881097B2 (en) * | 2005-08-30 | 2014-11-04 | The Mathworks, Inc. | System and method for creating and using graphical object instances in a statechart environment |
| US8918769B2 (en) | 2005-11-17 | 2014-12-23 | The Mathworks, Inc. | Application of optimization techniques to intermediate representations for code generation |
| WO2007061784A2 (en) * | 2005-11-17 | 2007-05-31 | The Mathworks, Inc. | Application of optimization techniques to intermediate representations for code generation |
| US8316359B2 (en) | 2005-11-17 | 2012-11-20 | The Mathworks, Inc. | Application of optimization techniques to intermediate representations for code generation |
| WO2007061784A3 (en) * | 2005-11-17 | 2007-09-07 | Mathworks Inc | Application of optimization techniques to intermediate representations for code generation |
| US20070169039A1 (en) * | 2005-11-17 | 2007-07-19 | The Mathworks, Inc. | Application of optimization techniques to intermediate representations for code generation |
| EP2418577A1 (en) * | 2005-11-17 | 2012-02-15 | The Mathworks, Inc. | Application of optimization techniques to intermediate representations for code generation |
| US20110239202A1 (en) * | 2005-11-17 | 2011-09-29 | The Mathworks, Inc. | Application of optimization techniques to intermediate representations for code generation |
| US7966610B2 (en) * | 2005-11-17 | 2011-06-21 | The Mathworks, Inc. | Application of optimization techniques to intermediate representations for code generation |
| WO2007143264A3 (en) * | 2006-05-30 | 2008-05-29 | Motorola Inc | Hierarchical state machine generation for interaction management using goal specifications |
| US20070282593A1 (en) * | 2006-05-30 | 2007-12-06 | Motorola, Inc | Hierarchical state machine generation for interaction management using goal specifications |
| WO2007143264A2 (en) * | 2006-05-30 | 2007-12-13 | Motorola, Inc. | Hierarchical state machine generation for interaction management using goal specifications |
| US7657434B2 (en) | 2006-05-30 | 2010-02-02 | Motorola, Inc. | Frame goals for dialog system |
| US7797672B2 (en) | 2006-05-30 | 2010-09-14 | Motorola, Inc. | Statechart generation using frames |
| US20070282570A1 (en) * | 2006-05-30 | 2007-12-06 | Motorola, Inc | Statechart generation using frames |
| US20070282606A1 (en) * | 2006-05-30 | 2007-12-06 | Motorola, Inc | Frame goals for dialog system |
| US7505951B2 (en) | 2006-05-30 | 2009-03-17 | Motorola, Inc. | Hierarchical state machine generation for interaction management using goal specifications |
| US8365200B1 (en) | 2006-06-30 | 2013-01-29 | Sap Ag | Using cancellation status models in a computer system |
| US8522261B2 (en) | 2006-06-30 | 2013-08-27 | Sap Ag | Using status models with state guards in a computer system |
| US8122063B2 (en) | 2006-06-30 | 2012-02-21 | Sap Ag | Using status models in a computer system |
| US8200715B1 (en) | 2006-06-30 | 2012-06-12 | Sap Ag | Using status models with adaptable process steps in a computer system |
| US8706776B1 (en) | 2006-06-30 | 2014-04-22 | Sap Ag | Extending status models in a computer system |
| US20080005162A1 (en) * | 2006-06-30 | 2008-01-03 | Frank Michael Kraft | Using Status Models in a Computer System |
| US20080005152A1 (en) * | 2006-06-30 | 2008-01-03 | Frank Michael Kraft | Using Status Models with State Guards in a Computer System |
| US20080005739A1 (en) * | 2006-06-30 | 2008-01-03 | Wasim Sadiq | Defining a Status Model for a Computer System |
| US20080147364A1 (en) * | 2006-12-15 | 2008-06-19 | Motorola, Inc. | Method and apparatus for generating harel statecharts using forms specifications |
| US20080162672A1 (en) * | 2006-12-28 | 2008-07-03 | Alexander Krasinskiy | Communicating with a Status Management Component in a Computer System |
| US8219650B2 (en) | 2006-12-28 | 2012-07-10 | Sap Ag | Communicating with a status management component in a computer system |
| US20080263513A1 (en) * | 2007-04-20 | 2008-10-23 | Neumann Nicholas G | Event Firing Node for Asynchronously Passing Events from a Graphical Data Flow Program to a Statechart |
| US7882445B2 (en) * | 2007-04-20 | 2011-02-01 | National Instruments Corporation | Configurable wires in a statechart |
| US20080263463A1 (en) * | 2007-04-20 | 2008-10-23 | Neumann Nicholas G | Configurable Wires in a Statechart |
| US8214796B2 (en) * | 2007-04-20 | 2012-07-03 | National Instruments Corporation | Event firing node for asynchronously passing events from a graphical data flow program to a statechart |
| US8504980B1 (en) | 2008-04-14 | 2013-08-06 | Sap Ag | Constraining data changes during transaction processing by a computer system |
| US8996472B2 (en) * | 2012-04-16 | 2015-03-31 | Sap Se | Verification of status schemas based on business goal definitions |
| US20130275389A1 (en) * | 2012-04-16 | 2013-10-17 | Sap Ag | Verification of Status Schemas based on Business Goal Definitions |
| US20140040217A1 (en) * | 2012-08-06 | 2014-02-06 | Sap Ag | Checking Compatibility of Extended and Core SAM Schemas Based on Complex Goals |
| US8996473B2 (en) * | 2012-08-06 | 2015-03-31 | Sap Se | Checking compatibility of extended and core SAM schemas based on complex goals |
| US10417594B2 (en) | 2013-05-02 | 2019-09-17 | Sap Se | Validation of functional correctness of SAM schemas including action chains |
| US10223076B1 (en) * | 2016-08-29 | 2019-03-05 | The Mathworks, Inc. | Generating code based on user interactions with a user interface element in a code editor |
| CN108334320A (en) * | 2016-12-22 | 2018-07-27 | 国立民用航空学院 | Method and apparatus for processing software code |
| US10949173B1 (en) | 2018-10-29 | 2021-03-16 | The Mathworks, Inc. | Systems and methods for automatic code generation |
| US11379194B2 (en) | 2018-10-29 | 2022-07-05 | The Mathworks, Inc. | Systems and methods for automatic code generation |
Also Published As
| Publication number | Publication date |
|---|---|
| US8170850B1 (en) | 2012-05-01 |
| US7877245B1 (en) | 2011-01-25 |
| US20120215508A1 (en) | 2012-08-23 |
| US7720656B2 (en) | 2010-05-18 |
Similar Documents
| Publication | Publication Date | Title |
|---|---|---|
| US8170850B1 (en) | Graphical functions | |
| CA2342814C (en) | A data processing system and development method | |
| US9639332B2 (en) | Applying coding standards in graphical programming environments | |
| JP5049280B2 (en) | Extensible XML format and object model for localization data | |
| US7171646B2 (en) | Generating source code for object oriented elements with language neutral transient meta model and correlating display of names, symbols and code | |
| Hou et al. | Using SCL to specify and check design intent in source code | |
| JP3033937B2 (en) | Computer system for visualizing the execution of an object-oriented program | |
| US20070261025A1 (en) | Configuration Model for Configuring an Adapter Software Component to Selectively Access Software Objects and Object Editor Using Instance of Same | |
| US8869100B1 (en) | Data objects for model-based design | |
| WO2003046694A2 (en) | Method and apparatus for creating software objects | |
| US10216501B2 (en) | Generating code in statically typed programming languages for dynamically typed array-based language | |
| US7921138B2 (en) | Comment processing | |
| EP1682983A2 (en) | Method and system for reversible design tree transformations | |
| US8423977B2 (en) | Implementing a class oriented data flow program on a programmable hardware element | |
| US8375355B2 (en) | Conversion of a class oriented data flow program to a structure oriented data flow program | |
| US8356290B2 (en) | Conversion of a class oriented data flow program with inheritance to a structure oriented data flow program | |
| Mosses | Component-based description of programming languages | |
| Rath et al. | Declarative specification of domain specific visual languages | |
| Soden | Operational semantics for MOF metamodels | |
| Jansen et al. | The Cider Toolkit Reference Manual Version 0.3. | |
| Schmeling et al. | Student Research Project | |
| Cornell et al. | Inheritance and Interfaces |
Legal Events
| Date | Code | Title | Description |
|---|---|---|---|
| AS | Assignment |
Owner name: MATHWORKS, INC., THE, MASSACHUSETTS Free format text: ASSIGNMENT OF ASSIGNORS INTEREST;ASSIGNORS:RAGHAVEN, VIJAYA;TORGERSON, JAY RYAN;REEL/FRAME:012109/0286 Effective date: 20010802 Owner name: MATHWORKS, INC., THE,MASSACHUSETTS Free format text: ASSIGNMENT OF ASSIGNORS INTEREST;ASSIGNORS:RAGHAVEN, VIJAYA;TORGERSON, JAY RYAN;REEL/FRAME:012109/0286 Effective date: 20010802 |
|
| STCF | Information on status: patent grant |
Free format text: PATENTED CASE |
|
| FPAY | Fee payment |
Year of fee payment: 4 |
|
| CC | Certificate of correction | ||
| FEPP | Fee payment procedure |
Free format text: PAYOR NUMBER ASSIGNED (ORIGINAL EVENT CODE: ASPN); ENTITY STATUS OF PATENT OWNER: LARGE ENTITY Free format text: PAYER NUMBER DE-ASSIGNED (ORIGINAL EVENT CODE: RMPN); ENTITY STATUS OF PATENT OWNER: LARGE ENTITY |
|
| MAFP | Maintenance fee payment |
Free format text: PAYMENT OF MAINTENANCE FEE, 8TH YEAR, LARGE ENTITY (ORIGINAL EVENT CODE: M1552) Year of fee payment: 8 |
|
| MAFP | Maintenance fee payment |
Free format text: PAYMENT OF MAINTENANCE FEE, 12TH YEAR, LARGE ENTITY (ORIGINAL EVENT CODE: M1553); ENTITY STATUS OF PATENT OWNER: LARGE ENTITY Year of fee payment: 12 |