US20030191408A1 - Neuron signal analysis system and method - Google Patents
Neuron signal analysis system and method Download PDFInfo
- Publication number
- US20030191408A1 US20030191408A1 US10/138,987 US13898702A US2003191408A1 US 20030191408 A1 US20030191408 A1 US 20030191408A1 US 13898702 A US13898702 A US 13898702A US 2003191408 A1 US2003191408 A1 US 2003191408A1
- Authority
- US
- United States
- Prior art keywords
- set forth
- distribution
- statistical
- signal data
- curve
- Prior art date
- Legal status (The legal status is an assumption and is not a legal conclusion. Google has not performed a legal analysis and makes no representation as to the accuracy of the status listed.)
- Granted
Links
Images


Classifications
-
- A—HUMAN NECESSITIES
- A61—MEDICAL OR VETERINARY SCIENCE; HYGIENE
- A61B—DIAGNOSIS; SURGERY; IDENTIFICATION
- A61B5/00—Measuring for diagnostic purposes; Identification of persons
- A61B5/68—Arrangements of detecting, measuring or recording means, e.g. sensors, in relation to patient
- A61B5/6846—Arrangements of detecting, measuring or recording means, e.g. sensors, in relation to patient specially adapted to be brought in contact with an internal body part, i.e. invasive
- A61B5/6847—Arrangements of detecting, measuring or recording means, e.g. sensors, in relation to patient specially adapted to be brought in contact with an internal body part, i.e. invasive mounted on an invasive device
- A61B5/685—Microneedles
-
- A—HUMAN NECESSITIES
- A61—MEDICAL OR VETERINARY SCIENCE; HYGIENE
- A61B—DIAGNOSIS; SURGERY; IDENTIFICATION
- A61B5/00—Measuring for diagnostic purposes; Identification of persons
- A61B5/24—Detecting, measuring or recording bioelectric or biomagnetic signals of the body or parts thereof
Definitions
- the present invention relates to the neuron signal analysis arts. It finds particular application to a system and method for analyzing signal data.
- Deep brain stimulation employs high-frequency stimulation to stimulate a targeted region of the brain. It includes a surgical procedure where one or more electrodes are positioned and placed into one of several possible targets in the brain. The electrode is then connected to an impulse generator that is implanted subcutaneously, in a manner similar to that used for a pacemaker. Stimulation parameters are adjusted to maximize therapeutic effects. Deep brain stimulation is, for example, a surgical treatment for Parkinson's disease.
- the stimulation electrode works effectively only if positioned near neurons that are targeted for stimulation.
- a recording microelectrode is used to record electrical signals from within the brain or other tissue. From these signals, a surgeon or other expert must identify and isolate extracellular action potentials of individual neurons. If the action potentials are properly identified, the location of the targeted neurons is more than likely determined.
- the present invention provides a new and useful system and method of analyzing electrical signals that addresses one or more of the above problems.
- a system of positioning a microelectrode within a tissue comprises a microelectrode for collecting electrical signals, and a distribution logic that generates a statistical distribution of the electrical signals.
- An identification logic identifies whether the statistical distribution resembles a noise distribution, and a position controller controls the position of microelectrode. The position controller moves or does not move the electrode based on the identification of the statistical distribution.
- a software product for analyzing electrical signal data collected from tissue includes first computer executable instructions that cause a computer to generate a statistical distribution of the electrical signal data. It further includes second computer executable instructions that cause a computer to analyze the statistical distribution and indicate whether neuronal activity is present in the electrical signal data based on a shape of the statistical distribution.
- a method of determining a nerve discharge from a plurality of electrical signals is provided. At least one characteristic of the plurality of electrical signals is statistically analyzed and a distribution curve is generated from at least one characteristic. A statistical characteristic of the distribution curve is determined. Whether at least one nerve discharge signal occurs within the electrical signal data is then determined based on the statistical characteristic of the distribution curve.
- FIG. 1 is an exemplary system diagram in accordance with one embodiment of the present invention
- FIG. 2 is an exemplary methodology of determining neuronal activity in accordance with one embodiment of the present invention
- FIG. 3 is an another embodiment of the signal data analyzer shown in FIG. 1;
- FIG. 4 is an exemplary tracing of electrical activity
- FIG. 5 is an exemplary statistical distribution curve of noise data based on voltage amplitudes
- FIG. 6 is an exemplary statistical distribution curve of noise data that contains neuron discharge signals
- FIG. 7 is another exemplary methodology of analyzing signal data
- FIG. 8 is an exemplary methodology of correlating neuronal activity with an applied stimulus in accordance with another embodiment of the invention.
- FIG. 9 is an exemplary graph of measured tail sizes of distributions generated for a plurality of time periods
- FIG. 10 is an exemplary graph measuring a stimulus or movement as applied or removed from an area over time.
- FIG. 11 is an exemplary graph showing a correlation of the data from FIGS. 9 and 10 in accordance with another embodiment of the invention.
- logic includes but is not limited to hardware, firmware, software and/or combinations of each to perform a function(s) or an action(s). For example, based on a desired application or needs, logic may include a software controlled microprocessor, discrete logic such as an application specific integrated circuit (ASIC), or other programmed logic device. Logic may also be fully embodied as software.
- ASIC application specific integrated circuit
- Signal includes but is not limited to one or more electrical signals, analog or digital signals, one or more computer instructions, a bit or bit stream, or the like.
- Software includes but is not limited to one or more computer executable instructions, routines, algorithms, modules or programs including separate applications or code from dynamically linked libraries for performing functions and actions as described herein.
- Software may also be implemented in various forms such as a stand-alone program, a servlet, an applet, instructions stored in a memory, part of an operating system or other type of executable instructions. It will be appreciated by one of ordinary skill in the art that the form of software is dependent on, for example, requirements of a desired application, the environment it runs on, and/or the desires of a designer/programmer or the like.
- Articles of manufacture may embody software such as computer readable media including magnetic, digital or optical storage devices, and electronic memory devices and circuits.
- the various embodiments of the invention provide for automatically advancing microelectrodes and determining when a neuronal action potential has been encountered as distinct from background electrical noise. Decisions as to whether a neuronal action potential is present does not depend on an operator's subjective judgment based on visual or auditory inspection. Rather, the system can objectively determine the presence of neuron activity within a collected set of signal data based on analyzing statistical characteristics of the signal data. For exemplary purposes, the discussion is based on recording signal data from brain tissue; however, it will readily apply to other types of tissues and signals.
- FIG. 1 Illustrated in FIG. 1 is one embodiment of a system 100 for positioning a microelectrode and analyzing electrical signal data.
- the system 100 is controlled by a computer 105 that may be a dedicated system, a general purpose computer, multiple computers, a computer connected to a network or other structural configuration as may be desired.
- Information from the computer 105 is displayed on a display 110 .
- An operator may input data and/or instructions to the computer 105 using an input device 115 such as a keyboard, mouse, pointer, touch screen, microphone and/or any other known input device.
- a microelectrode 120 once implanted into a subject, records electrical activity therein.
- the microelectrode 120 is implanted near a target position within the brain and records electrical signals for a predetermined time period, for example, ⁇ fraction (1/10) ⁇ of a second or any other desired time period.
- An analog-to-digital converter 125 converts the recorded signals into digital signal data.
- Optional signal processing 130 may be performed such as filtering, amplification and other desired effects.
- the recorded data signals are collected and stored by a data collector 135 that stores the signal data in one or more data arrays, data bases, files, or other data structures for further processing by the computer 105 .
- the electrical signal data is then analyzed by a signal data analyzer 140 that determines whether the signal data is noise or whether it contains neuron discharge signals.
- the analyzer 140 is embodied as software. The analysis is based on the observation that electrical noise in the signal data is over-represented compared to the relatively infrequent occurrence of a neuronal action potential. In other words, noise signals dominate the signal data whether or not a neuron discharge is present. So in this embodiment, the analysis focuses on examining the noise characteristics 145 of the signal data, and logic of the signal analyzer 140 determines the extent to which the signal data resembles exemplary noise data characteristics 150 .
- the analyzer 140 sets a flag, generates an instruction or other type of signal which causes a position controller 155 to move the microelectrode 120 to a new selected location.
- the position controller 155 controls the position of the microelectrode 120 based on the analyzed characteristics of the signal data.
- the position controller 155 may be a hydrolytic drive that advances or retracts the microelectrode. Of course, other types of drive mechanisms can be used.
- the microelectrode 120 then records a new set of signal data and the process repeats until a location that contains neuron discharge signals is found or the process is stopped by an operator.
- the signal data is judged to contain one or more neuron discharge signals. That is because the presence of neuron discharge signals will cause the departure. How much of a departure is needed before triggering an indication of neuron activity can be set by a threshold. When the departure is great enough to pass the threshold, it is determined that neural activity is present. In this manner, an objective analysis is made rather than a subjective determination from an operator.
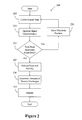
- FIG. 2 Illustrated in FIG. 2 is an exemplary methodology 200 of the system shown in FIG. 1 for collecting signal data and determining whether neuronal activity is present.
- the rectangular elements denote “processing blocks” and represent computer software instructions or groups of instructions.
- the diamond shaped elements denote “decision blocks” and represent computer software instructions or groups of instructions which affect the execution of the computer software instructions represented by the processing blocks.
- the processing and decision blocks represent steps, functions, and/or actions performed by functionally equivalent circuits such as a digital signal processor circuit, an application specific integrated circuit (ASIC) or microprocessor.
- ASIC application specific integrated circuit
- the diagram does not depict syntax of any particular programming language. Rather, the diagram illustrates the functional information one skilled in the art requires to fabricate circuits or to generate computer software to perform the processing of the system.
- the process begins by collecting signal data (block 205 ) after a recording device, such as a microelectrode, is inserted at a target location within the brain or other tissue. Signals are recorded for a selected time period to obtain a set of electrical signal data. Characteristics of the signal data are then analyzed to determine whether it resembles noise data (block 210 ). For example, a statistical analysis of one or more characteristics of the signal data are performed and compared to noise data characteristics. A decision is made as to whether the signal data represents noise (block 215 .) If it does, meaning that a neuron action potential has not been found, the microelectrode position is automatically moved to a new position (block 220 ) and the process repeats. If it does not resemble noise data to a predetermined level, neuronal activity is indicated to be contained in the signal data (block 225 ). In this manner, the position of microelectrode can be automatically controlled based on the analyzed signal characteristics.
- a recording device such as a microelectrode
- a statistical characteristic of the signal data reflects a departure from what is expected from the same statistical characteristic of typical noise data
- neuron discharges are present.
- One possible statistical characteristic includes comparing a range of voltages from the signals.
- Other statistical characteristics may include a shape of a signal distribution curve, the size of tails from the distribution curve, a kurtosis value from the distribution curve, other desired characteristics, or a combination of these.
- an amount of neuron discharges can be determined based on the amount of departure determined (block 230 ). As the departure from noise data increases, then the amount of neuron discharges present in the signal data is indicated to be greater. The statistical analysis and/or the results found can be displayed to an operator (block 235 ) for additional verification if desired.
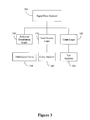
- FIG. 3 Illustrated in FIG. 3 is another embodiment of the signal data analyzer 140 shown as analyzer 300 .
- the analyzer 300 is programmed to analyze signal characteristics of the signal data using statistical analysis. It should be noted that although the elements of the analyzer 300 are shown as separate elements, one or more of them may be embodied together as part of the same software program. The elements can also be embodied such that they are called by the analyzer 300 when desired. Of course, software can be structured in many ways depending on the preferences of the designer/programmer.
- a statistical distribution logic 305 generates a statistical distribution curve 310 from the signal data based on one or more selected characteristics.
- voltage amplitude values of each recorded signal are used.
- FIG. 4 illustrates an exemplary signal data 400 that may be seen on an oscilloscope tracing of electrical activity.
- FIG. 5 illustrates an exemplary noise distribution curve 500 of voltage amplitude values, for example, as a histogram showing frequency of occurrences (y-axis) of each voltage amplitude value (x-axis). Since electrical noise is over-represented in signal data, the statistical distribution of signal amplitudes will be normally and narrowly distributed.
- distribution curve 500 of noise data is a normal distribution curve generally characterized as bell-shaped with a lesser degree of variance from the mean, in other words with shorter tails.
- the distribution curve 310 of the current signal data resembles the noise distribution curve 500 , then the signal data is determined to be noise without a neuron action potential. However, even when a neuronal signal is present in the signal data, the distribution curve 310 may appear normal or bell-shaped because neuron action potentials are relatively rare. But, the variance from the mean will be greater and the tails of the curve will be longer than that of a typical noise distribution curve 500 , and these characteristics can be used to identify if a neuron action potential is present. To assist in identifying such differences from the noise distribution curve, further processing of the distribution curve 310 may be performed to exaggerate the distribution values from the mean. For example, logic can be included to determine the 4th order moment about the mean (4MOM) for the signal data. Of course, other orders such as 3rd, 5th, or other order can be used.
- 4MOM 4th order moment about the mean
- a distribution curve that represents noise with neuron discharge signals present may look like distribution curve 600 shown in FIG. 6.
- the curve 600 is shown with exaggerated values in its tail regions which may be obtained, for example, by applying a 4th order moment about the mean.
- the curve 600 shows a greater number of voltage occurrences 605 , 610 in the tail regions beyond a central curve 615 as compared to the noise distribution curve 500 .
- the central curve 615 represents the greatest concentration of values (e.g. noise signals).
- the tails are lengthened as compared to the exemplary noise distribution curve 500 indicating a greater range of voltages in the signal data.
- the signal analyzer 300 will consider curve 600 as a departure from the generally bell-shaped noise curve 500 at least in part due to the longer tails.
- the signal analyzer 300 can determine if a neuron action potential is present by determining if the distribution curve resembles noise data (e.g., noise distribution curve 500 ) or if it is a departure from noise data (e.g., distribution curve 600 ), the latter meaning neuron discharge signals are present.
- noise data e.g., noise distribution curve 500
- distribution curve 600 e.g., distribution curve 600
- a distribution curve generated from signal data containing both noise and neuron discharge signals like curve 600 , will also resemble a bell-shaped curve. They differ from the “generally bell-shaped” noise curve 500 in their degree of kurtosis or width of distribution as will be described in greater detail below.
- an identification logic 315 analyzes the distribution curve 310 generated from the current signal data.
- the logic 315 performs a curve analysis 320 to determines what type of curve it most likely is. In particular, it determines whether the curve 310 resembles a generally bell-shaped curve of noise data (e.g. FIG. 5).
- the shape of the curve can be compared to the shape of a noise distribution curve.
- a central tendency value can be computed and then dispersions from the central tendency are measured. If a pre-selected amount of dispersions exists, then it is determined that neuron discharges are present.
- a kurtosis value is determined for the distribution curve.
- Kurtosis provides information about a curve's shape and, in particular, is based on the size of a distribution's tails. The larger the tails, the lower the kurtosis value. Thus, a generally normal distribution curve (representing only noise) will have smaller tails and a larger kurtosis value than a distribution curve with neuron discharges which will have larger tails.
- a threshold kurtosis value can be set such that if the kurtosis value of a distribution curve falls below the threshold, the analysis determines that one or more neuron discharges are present.
- Equation (1) An exemplary equation for determining kurtosis is shown in Equation (1) below.
- x is a current value from the signal data
- ⁇ is the mean of the data
- N is the number of values in the data
- ⁇ is the standard deviation.
- the kurtosis can be determined differently and/or with different variations of Equation (1).
- the subtraction of “3” can be optional.
- Kurtosis ⁇ ( x - ⁇ ) 4 N ⁇ ⁇ ⁇ 4 - 3 ( 1 )
- a count logic 325 can be included to determine a relative amount of neuron discharge signals once it is determined that they are present.
- the count logic 325 includes a tail analysis logic 330 that analyzes the tails of the distribution curve. Generally, as mentioned previously, larger tails indicate greater neuron activity. A number of occurrences beyond a selected threshold (e.g., beyond the 4th order moment about the mean) can indicate a quantity of neuron activity. Also, the kurtosis value can be used for this analysis. Again, the lower the kurtosis value, the larger the tails are, meaning, a greater amount of neuron discharges are present.
- the amount of neuron signal firings can also be found by Equation 2.
- the number of voltage values recorded is represented by n, (x ⁇ ) is the difference between each voltage point (x) and the average voltage ( ⁇ ) found in the signal data. This value is raised to the 4th power to exaggerate its distance from the mean.
- an exemplary methodology 700 is shown for the signal data analyzer 300 .
- the illustrated blocks may also represent an embodiment of the “analyze signal characteristics” block 210 from FIG. 2.
- a characteristic is selected, such as voltage amplitude values for each signal, and a distribution is generated using the selected values (block 710 ).
- Characteristics from the curve are then analyzed (block 715 ). For example, the curve's shape is determined and compared to a normal noise distribution curve (block 720 ). A kurtosis value can be determined which indicates the size of the distribution's tails.
- the distribution resembles a noise distribution (e.g., by shape or by kurtosis value or by both), then it is judged to be noise data. If the distribution departs from a noise distribution, then it is judged to contain a neuron action potential. The results of the distribution or comparison, or both can be displayed for additional verification from a physician or other expert if desired.
- a noise distribution e.g., by shape or by kurtosis value or by both
- FIG. 8 Illustrated in FIG. 8 is another exemplary methodology 800 used by the above systems for the identification of sensor-motor regions within an anatomical target.
- a sensori-motor region is identified by correlating neuronal activity changes (increases or decreases) temporally correlated with sensory stimulation or movement.
- the system automatically determines whether such a correlation exists and if so, whether the microelectrode is in the sensori-motor regions.
- the signal data analyzer 140 and/or 300 includes or calls a correlation logic to perform the correlation as described below.
- the microelectrode When the microelectrode is at a target position in the brain and neuronal activity is determined by the present system, a physician may wish to determine if that target position corresponds to a particular part of the patient such as the left hand. By stimulating or moving the left hand, or both, the system can record electrical activity at the target position and determine whether the stimulation triggers neuronal activity. The system generates a distribution curve for the recorded signal data as described above and, by analyzing changes in the distribution curve as a stimulus is applied, it can determine if there is a correlation. A more detail discussion follows with reference to FIG. 8.
- microelectrode signals are recorded for a brief epoch, for example 20 msec or other selected time period (block 805 ).
- the signals are statistically analyzed in a manner described above (block 810 ).
- a distribution is generated and the analysis determines whether it resembles noise data or whether a departure exists indicating the presence of neuronal activity (block 815 ).
- the 4th order moment about the mean (4MOM) is determined of the signal data. If it resembles noise, the electrode position is moved (block 820 ) and the process repeats until a location is found that contains neuronal activity.
- neuronal activity is found at a target location (block 825 )
- the physician can attempt to correlate the location with an area of the patient.
- a stimulus is applied and removed to an area, such as an arm or leg, and a plurality of signal data is recorded for a number of epochs. Between each epoch, data from sensory stimulation or movement is obtained.
- a buffer of these data (sensory, movement and the 4MOM) are recorded, for example, for 100 epochs or other selected quantity.
- This buffer contains the time course of neuronal activity (time course of the 4MOM) and sensory and/or movement. The time course of the 4MOM is correlated with the sensory and/or movement data.
- results of the correlation are displayed so that the physician or electrophysiologist can see the correlation found that determines whether the neuronal activity is correlated with sensory and/or motor function and therefore, the microelectrode tip is within the sensori-motor region of the anatomical target.
- a variety of sensory stimulations can be used. These include (but are not limited to) light touch, proprioception (joint capsule receptors) and muscle spindles. Correlation of neuronal activity to specific types of sensory stimulation have implications for localization. For example, neurons of the central portion of the ventro-caudal nucleus of the thalamus are responsive to light touch while neurons of the ventro-intermediate nucleus of the thalamus are responsive to muscle spindle activation.
- a hand held device can have a contact switch that indicates when the device touches the skin (light touch).
- the hand held device can also have a vibrator to stimulate muscle spindles.
- the contact switch indicates the time that the vibration stimuli are applied.
- the contact switch signal then translates to a waveform in the signal analysis logic that is then correlated with the simultaneously accumulated 4MOM indicating neuronal activity.
- Joint capsule stimulation is accomplished by active and passive movement about the joint.
- an accelerometer can be attached to the physician or electrophysiologist's hand, which moves a limb about a joint as an indirect indicator of joint capsule stimulation. Such movements will be identified by small accelerometers attached to the patient's limb about the joints.
- the accelerometer data can be acquired and correlated with neuronal activity as described above.
- a switch foot or hand held can be used to manually indicate stimulation or movement which cannot be directly instrumented such as a mouth opening, tongue protrusion, etc.
- the system simultaneously records signal data as a stimulus is applied and removed.
- An analysis of a distribution curve's tails for each recorded epoch can be graphed as shown in FIG. 9 as graph 900 .
- the graph shows the size of the curve's tails, where points 905 represent larger tails (indicating greater neuronal activity) and points 910 represent smaller tails (indicating little or no neuronal activity).
- FIG. 10 illustrates a graph 1000 of applied movement or stimulus corresponding in time to graph 900 .
- Points 1005 represent when a stimulus is applied to a target and points 1010 represent no stimulus applied.
- the system determines if changes occur in neuronal activity (increase or decrease) based on the corresponding stimulus (block 830 ).
- the two graphs are then correlated to determine if an increase in neuronal activity corresponds to the application of stimulus (block 835 ). they correlate to a sufficient degree (block 840 ), then it is reasonable to conclude that the microelectrode recording tip is within the sensory and/or motor region of the target.
- the microelectrode can be moved to a new position and the process repeats until a match is found (block 820 ). Alternately, the microelectrode can be maintained at its position and a new area of stimulation can be selected to determine if it correlates. It will be noted that movement of the electrode may not be tied to the identification of sensory and/or motor related units, rather it may be tied to the presence or absence of an extracellular action potential being within the signal recorded.
- correlation can be determined using Pearson Product Moment Correlation (also called Pearson's correlation for short). Pearson's correlation reflects a degree of linear relationship between two variables. It ranges from +1 to ⁇ 1. A correlation of +1 means that there is a perfect positive linear relationship between variables while a correlation of ⁇ 1 means that there is a perfect negative linear relationship between variables.
- a correlation graph is generated shown in FIG. 11.
- the system can determine the extent of a correlation by taking the absolute value of the correlation value.
- the microelectrode can be incrementally advanced to determine the dimension of the neuronal area. Signal data is collected at each incremental location and a statistical analysis is performed to determine if it is noise or further contains neuronal activity as described above. Knowing the dimension of the neuron can help better position an implanted electrode in that location.
- Data obtained and/or results found by the system can be processed for communication via the Internet or other network.
- Intra-operative data can be transmitted via the Internet to a central facility for processing which can assist in problem solving and data analysis and interpretation.
Abstract
Electrical signal data from a target location are recorded and collected. A signal analyzer analyzes the signal data and determines whether characteristics of the signal data resemble noise data or whether a departure from noise is present. If the characteristics show a departure from noise, neuronal activity at the target location is indicated.
Description
- This application claims priority to provisional U.S. Application Ser. No.: not yet assigned, filed Apr. 5, 2002.
- The present invention relates to the neuron signal analysis arts. It finds particular application to a system and method for analyzing signal data.
- Deep brain stimulation (DBS) employs high-frequency stimulation to stimulate a targeted region of the brain. It includes a surgical procedure where one or more electrodes are positioned and placed into one of several possible targets in the brain. The electrode is then connected to an impulse generator that is implanted subcutaneously, in a manner similar to that used for a pacemaker. Stimulation parameters are adjusted to maximize therapeutic effects. Deep brain stimulation is, for example, a surgical treatment for Parkinson's disease.
- In this procedure and other similar procedures, the stimulation electrode works effectively only if positioned near neurons that are targeted for stimulation. To properly position the electrode, a recording microelectrode is used to record electrical signals from within the brain or other tissue. From these signals, a surgeon or other expert must identify and isolate extracellular action potentials of individual neurons. If the action potentials are properly identified, the location of the targeted neurons is more than likely determined.
- There are various techniques for isolating neuron cell discharges from electrical signal data. However, the prior techniques depend on the subjective judgment of an expert that attempts to distinguish a nerve cell discharge from a large quantity of noise signals. This is performed, for example, by viewing an oscilloscope and analyzing a tracing of the recorded electrical activity. Alternately, the electrical signal data is made audible and the expert listens for certain characteristics that may represent neuron cell discharges. In either case, experts must be highly trained and sophisticated in order to analyze the electrical signal data. They typically have extensive prior knowledge of what a nerve cell discharge looks like and/or sounds like as opposed to an artifact signal.
- Due to its subjective nature, this is a tedious and error prone process. Furthermore, the limited number of qualified experts hinders the ability to perform procedures that require identification of neurons.
- The present invention provides a new and useful system and method of analyzing electrical signals that addresses one or more of the above problems.
- In accordance with one embodiment of the invention, a system of positioning a microelectrode within a tissue is provided. The system comprises a microelectrode for collecting electrical signals, and a distribution logic that generates a statistical distribution of the electrical signals. An identification logic identifies whether the statistical distribution resembles a noise distribution, and a position controller controls the position of microelectrode. The position controller moves or does not move the electrode based on the identification of the statistical distribution.
- In accordance with another embodiment of the invention, a software product for analyzing electrical signal data collected from tissue is provided. The software includes first computer executable instructions that cause a computer to generate a statistical distribution of the electrical signal data. It further includes second computer executable instructions that cause a computer to analyze the statistical distribution and indicate whether neuronal activity is present in the electrical signal data based on a shape of the statistical distribution.
- In accordance with another embodiment of the invention, a method of determining a nerve discharge from a plurality of electrical signals is provided. At least one characteristic of the plurality of electrical signals is statistically analyzed and a distribution curve is generated from at least one characteristic. A statistical characteristic of the distribution curve is determined. Whether at least one nerve discharge signal occurs within the electrical signal data is then determined based on the statistical characteristic of the distribution curve.
- In the accompanying drawings which are incorporated in and constitute a part of the specification, embodiments of the invention are illustrated which, together with a general description of the invention given above and the detailed description given below, serve to example the principles of this invention.
- FIG. 1 is an exemplary system diagram in accordance with one embodiment of the present invention;
- FIG. 2 is an exemplary methodology of determining neuronal activity in accordance with one embodiment of the present invention;
- FIG. 3 is an another embodiment of the signal data analyzer shown in FIG. 1;
- FIG. 4 is an exemplary tracing of electrical activity;
- FIG. 5 is an exemplary statistical distribution curve of noise data based on voltage amplitudes;
- FIG. 6 is an exemplary statistical distribution curve of noise data that contains neuron discharge signals;
- FIG. 7 is another exemplary methodology of analyzing signal data;
- FIG. 8 is an exemplary methodology of correlating neuronal activity with an applied stimulus in accordance with another embodiment of the invention;
- FIG. 9 is an exemplary graph of measured tail sizes of distributions generated for a plurality of time periods;
- FIG. 10 is an exemplary graph measuring a stimulus or movement as applied or removed from an area over time; and
- FIG. 11 is an exemplary graph showing a correlation of the data from FIGS. 9 and 10 in accordance with another embodiment of the invention.
- The invention may be embodied in various forms. The following includes definitions of exemplary terms used throughout the disclosure. Both singular and plural forms of all terms fall within each meaning:
- “Logic”, as used herein, includes but is not limited to hardware, firmware, software and/or combinations of each to perform a function(s) or an action(s). For example, based on a desired application or needs, logic may include a software controlled microprocessor, discrete logic such as an application specific integrated circuit (ASIC), or other programmed logic device. Logic may also be fully embodied as software.
- “Signal”, as used herein, includes but is not limited to one or more electrical signals, analog or digital signals, one or more computer instructions, a bit or bit stream, or the like.
- “Software”, as used herein, includes but is not limited to one or more computer executable instructions, routines, algorithms, modules or programs including separate applications or code from dynamically linked libraries for performing functions and actions as described herein. Software may also be implemented in various forms such as a stand-alone program, a servlet, an applet, instructions stored in a memory, part of an operating system or other type of executable instructions. It will be appreciated by one of ordinary skill in the art that the form of software is dependent on, for example, requirements of a desired application, the environment it runs on, and/or the desires of a designer/programmer or the like. Articles of manufacture may embody software such as computer readable media including magnetic, digital or optical storage devices, and electronic memory devices and circuits.
- As will be described in greater detail below, the various embodiments of the invention provide for automatically advancing microelectrodes and determining when a neuronal action potential has been encountered as distinct from background electrical noise. Decisions as to whether a neuronal action potential is present does not depend on an operator's subjective judgment based on visual or auditory inspection. Rather, the system can objectively determine the presence of neuron activity within a collected set of signal data based on analyzing statistical characteristics of the signal data. For exemplary purposes, the discussion is based on recording signal data from brain tissue; however, it will readily apply to other types of tissues and signals.
- Illustrated in FIG. 1 is one embodiment of a
system 100 for positioning a microelectrode and analyzing electrical signal data. For exemplary purposes, the system will be described for use with a brain tissue and identification of neurons within the brain tissue. Thesystem 100 is controlled by acomputer 105 that may be a dedicated system, a general purpose computer, multiple computers, a computer connected to a network or other structural configuration as may be desired. Information from thecomputer 105 is displayed on adisplay 110. An operator may input data and/or instructions to thecomputer 105 using aninput device 115 such as a keyboard, mouse, pointer, touch screen, microphone and/or any other known input device. - A
microelectrode 120, once implanted into a subject, records electrical activity therein. Themicroelectrode 120 is implanted near a target position within the brain and records electrical signals for a predetermined time period, for example, {fraction (1/10)} of a second or any other desired time period. An analog-to-digital converter 125 converts the recorded signals into digital signal data.Optional signal processing 130 may be performed such as filtering, amplification and other desired effects. The recorded data signals are collected and stored by adata collector 135 that stores the signal data in one or more data arrays, data bases, files, or other data structures for further processing by thecomputer 105. - With further reference to FIG. 1, the electrical signal data is then analyzed by a
signal data analyzer 140 that determines whether the signal data is noise or whether it contains neuron discharge signals. In this embodiment, theanalyzer 140 is embodied as software. The analysis is based on the observation that electrical noise in the signal data is over-represented compared to the relatively infrequent occurrence of a neuronal action potential. In other words, noise signals dominate the signal data whether or not a neuron discharge is present. So in this embodiment, the analysis focuses on examining thenoise characteristics 145 of the signal data, and logic of thesignal analyzer 140 determines the extent to which the signal data resembles exemplarynoise data characteristics 150. - If the signal data resembles noise, the
analyzer 140 sets a flag, generates an instruction or other type of signal which causes aposition controller 155 to move themicroelectrode 120 to a new selected location. Theposition controller 155 controls the position of themicroelectrode 120 based on the analyzed characteristics of the signal data. Theposition controller 155 may be a hydrolytic drive that advances or retracts the microelectrode. Of course, other types of drive mechanisms can be used. Themicroelectrode 120 then records a new set of signal data and the process repeats until a location that contains neuron discharge signals is found or the process is stopped by an operator. - If the signal characteristics show a statistical departure from exemplary noise data, then the signal data is judged to contain one or more neuron discharge signals. That is because the presence of neuron discharge signals will cause the departure. How much of a departure is needed before triggering an indication of neuron activity can be set by a threshold. When the departure is great enough to pass the threshold, it is determined that neural activity is present. In this manner, an objective analysis is made rather than a subjective determination from an operator.
- Illustrated in FIG. 2 is an
exemplary methodology 200 of the system shown in FIG. 1 for collecting signal data and determining whether neuronal activity is present. The rectangular elements denote “processing blocks” and represent computer software instructions or groups of instructions. The diamond shaped elements denote “decision blocks” and represent computer software instructions or groups of instructions which affect the execution of the computer software instructions represented by the processing blocks. Alternatively, the processing and decision blocks represent steps, functions, and/or actions performed by functionally equivalent circuits such as a digital signal processor circuit, an application specific integrated circuit (ASIC) or microprocessor. The diagram does not depict syntax of any particular programming language. Rather, the diagram illustrates the functional information one skilled in the art requires to fabricate circuits or to generate computer software to perform the processing of the system. - It will be appreciated that electronic and software applications involve dynamic and flexible processes such that the illustrated blocks can be performed in other sequences different than the one shown. It will also be appreciated by one of ordinary skill in the art that elements embodied as software may be implemented using various programming approaches such as machine language, procedural, object oriented or artificial intelligence techniques. It should be noted that many routine program elements, such as initialization of loops and variables and the use of temporary variables are not shown. The above characterization also applies to the other figures showing methodologies, flow charts or processes.
- With reference to FIG. 2, the process begins by collecting signal data (block 205) after a recording device, such as a microelectrode, is inserted at a target location within the brain or other tissue. Signals are recorded for a selected time period to obtain a set of electrical signal data. Characteristics of the signal data are then analyzed to determine whether it resembles noise data (block 210). For example, a statistical analysis of one or more characteristics of the signal data are performed and compared to noise data characteristics. A decision is made as to whether the signal data represents noise (block 215.) If it does, meaning that a neuron action potential has not been found, the microelectrode position is automatically moved to a new position (block 220) and the process repeats. If it does not resemble noise data to a predetermined level, neuronal activity is indicated to be contained in the signal data (block 225). In this manner, the position of microelectrode can be automatically controlled based on the analyzed signal characteristics.
- For example, if a statistical characteristic of the signal data reflects a departure from what is expected from the same statistical characteristic of typical noise data, then neuron discharges are present. One possible statistical characteristic includes comparing a range of voltages from the signals. Other statistical characteristics, as will be described in greater detail below, may include a shape of a signal distribution curve, the size of tails from the distribution curve, a kurtosis value from the distribution curve, other desired characteristics, or a combination of these. Optionally, an amount of neuron discharges can be determined based on the amount of departure determined (block 230). As the departure from noise data increases, then the amount of neuron discharges present in the signal data is indicated to be greater. The statistical analysis and/or the results found can be displayed to an operator (block 235) for additional verification if desired.
- Illustrated in FIG. 3 is another embodiment of the
signal data analyzer 140 shown asanalyzer 300. Theanalyzer 300 is programmed to analyze signal characteristics of the signal data using statistical analysis. It should be noted that although the elements of theanalyzer 300 are shown as separate elements, one or more of them may be embodied together as part of the same software program. The elements can also be embodied such that they are called by theanalyzer 300 when desired. Of course, software can be structured in many ways depending on the preferences of the designer/programmer. - As seen in FIG. 3, a
statistical distribution logic 305 generates astatistical distribution curve 310 from the signal data based on one or more selected characteristics. In this embodiment, voltage amplitude values of each recorded signal are used. FIG. 4 illustrates anexemplary signal data 400 that may be seen on an oscilloscope tracing of electrical activity. FIG. 5 illustrates an exemplarynoise distribution curve 500 of voltage amplitude values, for example, as a histogram showing frequency of occurrences (y-axis) of each voltage amplitude value (x-axis). Since electrical noise is over-represented in signal data, the statistical distribution of signal amplitudes will be normally and narrowly distributed. Thus,distribution curve 500 of noise data is a normal distribution curve generally characterized as bell-shaped with a lesser degree of variance from the mean, in other words with shorter tails. - If the
distribution curve 310 of the current signal data resembles thenoise distribution curve 500, then the signal data is determined to be noise without a neuron action potential. However, even when a neuronal signal is present in the signal data, thedistribution curve 310 may appear normal or bell-shaped because neuron action potentials are relatively rare. But, the variance from the mean will be greater and the tails of the curve will be longer than that of a typicalnoise distribution curve 500, and these characteristics can be used to identify if a neuron action potential is present. To assist in identifying such differences from the noise distribution curve, further processing of thedistribution curve 310 may be performed to exaggerate the distribution values from the mean. For example, logic can be included to determine the 4th order moment about the mean (4MOM) for the signal data. Of course, other orders such as 3rd, 5th, or other order can be used. - A distribution curve that represents noise with neuron discharge signals present may look like
distribution curve 600 shown in FIG. 6. To better illustrate differences from thenoise distribution curve 500, thecurve 600 is shown with exaggerated values in its tail regions which may be obtained, for example, by applying a 4th order moment about the mean. Thecurve 600 shows a greater number ofvoltage occurrences central curve 615 as compared to thenoise distribution curve 500. Thecentral curve 615 represents the greatest concentration of values (e.g. noise signals). Furthermore, the tails are lengthened as compared to the exemplarynoise distribution curve 500 indicating a greater range of voltages in the signal data. Thesignal analyzer 300 will considercurve 600 as a departure from the generally bell-shapednoise curve 500 at least in part due to the longer tails. Thesignal analyzer 300 can determine if a neuron action potential is present by determining if the distribution curve resembles noise data (e.g., noise distribution curve 500) or if it is a departure from noise data (e.g., distribution curve 600), the latter meaning neuron discharge signals are present. It will be noted that a distribution curve generated from signal data containing both noise and neuron discharge signals, likecurve 600, will also resemble a bell-shaped curve. They differ from the “generally bell-shaped”noise curve 500 in their degree of kurtosis or width of distribution as will be described in greater detail below. - With further reference to FIG. 3, an
identification logic 315 analyzes thedistribution curve 310 generated from the current signal data. Thelogic 315 performs acurve analysis 320 to determines what type of curve it most likely is. In particular, it determines whether thecurve 310 resembles a generally bell-shaped curve of noise data (e.g. FIG. 5). There are different ways to perform the curve analysis. For example, the shape of the curve can be compared to the shape of a noise distribution curve. In another embodiment, a central tendency value can be computed and then dispersions from the central tendency are measured. If a pre-selected amount of dispersions exists, then it is determined that neuron discharges are present. - In another embodiment, a kurtosis value is determined for the distribution curve. Kurtosis provides information about a curve's shape and, in particular, is based on the size of a distribution's tails. The larger the tails, the lower the kurtosis value. Thus, a generally normal distribution curve (representing only noise) will have smaller tails and a larger kurtosis value than a distribution curve with neuron discharges which will have larger tails. A threshold kurtosis value can be set such that if the kurtosis value of a distribution curve falls below the threshold, the analysis determines that one or more neuron discharges are present.
- An exemplary equation for determining kurtosis is shown in Equation (1) below. In the equation, x is a current value from the signal data, μ is the mean of the data, N is the number of values in the data, σ is the standard deviation. Of course, the kurtosis can be determined differently and/or with different variations of Equation (1). For example, the subtraction of “3” can be optional.

- With further reference to FIG. 3, a
count logic 325 can be included to determine a relative amount of neuron discharge signals once it is determined that they are present. In one embodiment, thecount logic 325 includes atail analysis logic 330 that analyzes the tails of the distribution curve. Generally, as mentioned previously, larger tails indicate greater neuron activity. A number of occurrences beyond a selected threshold (e.g., beyond the 4th order moment about the mean) can indicate a quantity of neuron activity. Also, the kurtosis value can be used for this analysis. Again, the lower the kurtosis value, the larger the tails are, meaning, a greater amount of neuron discharges are present. - The amount of neuron signal firings can also be found by Equation 2. The number of voltage values recorded is represented by n, (x−μ) is the difference between each voltage point (x) and the average voltage (μ) found in the signal data. This value is raised to the 4th power to exaggerate its distance from the mean.

- With reference to FIG. 7, an
exemplary methodology 700 is shown for thesignal data analyzer 300. The illustrated blocks may also represent an embodiment of the “analyze signal characteristics” block 210 from FIG. 2. After a set of signal data is collected, it is statistically analyzed (block 705). For example, a characteristic is selected, such as voltage amplitude values for each signal, and a distribution is generated using the selected values (block 710). Characteristics from the curve are then analyzed (block 715). For example, the curve's shape is determined and compared to a normal noise distribution curve (block 720). A kurtosis value can be determined which indicates the size of the distribution's tails. If the distribution resembles a noise distribution (e.g., by shape or by kurtosis value or by both), then it is judged to be noise data. If the distribution departs from a noise distribution, then it is judged to contain a neuron action potential. The results of the distribution or comparison, or both can be displayed for additional verification from a physician or other expert if desired. - Illustrated in FIG. 8 is another
exemplary methodology 800 used by the above systems for the identification of sensor-motor regions within an anatomical target. A sensori-motor region is identified by correlating neuronal activity changes (increases or decreases) temporally correlated with sensory stimulation or movement. The system automatically determines whether such a correlation exists and if so, whether the microelectrode is in the sensori-motor regions. In this embodiment, thesignal data analyzer 140 and/or 300 includes or calls a correlation logic to perform the correlation as described below. - When the microelectrode is at a target position in the brain and neuronal activity is determined by the present system, a physician may wish to determine if that target position corresponds to a particular part of the patient such as the left hand. By stimulating or moving the left hand, or both, the system can record electrical activity at the target position and determine whether the stimulation triggers neuronal activity. The system generates a distribution curve for the recorded signal data as described above and, by analyzing changes in the distribution curve as a stimulus is applied, it can determine if there is a correlation. A more detail discussion follows with reference to FIG. 8.
- As seen in FIG. 8, microelectrode signals are recorded for a brief epoch, for example 20 msec or other selected time period (block 805). The signals are statistically analyzed in a manner described above (block 810). A distribution is generated and the analysis determines whether it resembles noise data or whether a departure exists indicating the presence of neuronal activity (block 815). To assist the determination, the 4th order moment about the mean (4MOM) is determined of the signal data. If it resembles noise, the electrode position is moved (block 820) and the process repeats until a location is found that contains neuronal activity.
- When neuronal activity is found at a target location (block 825), the physician can attempt to correlate the location with an area of the patient. A stimulus is applied and removed to an area, such as an arm or leg, and a plurality of signal data is recorded for a number of epochs. Between each epoch, data from sensory stimulation or movement is obtained. A buffer of these data (sensory, movement and the 4MOM) are recorded, for example, for 100 epochs or other selected quantity. This buffer contains the time course of neuronal activity (time course of the 4MOM) and sensory and/or movement. The time course of the 4MOM is correlated with the sensory and/or movement data. The results of the correlation are displayed so that the physician or electrophysiologist can see the correlation found that determines whether the neuronal activity is correlated with sensory and/or motor function and therefore, the microelectrode tip is within the sensori-motor region of the anatomical target.
- A variety of sensory stimulations can be used. These include (but are not limited to) light touch, proprioception (joint capsule receptors) and muscle spindles. Correlation of neuronal activity to specific types of sensory stimulation have implications for localization. For example, neurons of the central portion of the ventro-caudal nucleus of the thalamus are responsive to light touch while neurons of the ventro-intermediate nucleus of the thalamus are responsive to muscle spindle activation.
- Various means for applying these sensory stimulations can be used. For example, a hand held device can have a contact switch that indicates when the device touches the skin (light touch). The hand held device can also have a vibrator to stimulate muscle spindles. In a vibration mode, the contact switch indicates the time that the vibration stimuli are applied. The contact switch signal then translates to a waveform in the signal analysis logic that is then correlated with the simultaneously accumulated 4MOM indicating neuronal activity.
- Joint capsule stimulation is accomplished by active and passive movement about the joint. Alternatively, an accelerometer can be attached to the physician or electrophysiologist's hand, which moves a limb about a joint as an indirect indicator of joint capsule stimulation. Such movements will be identified by small accelerometers attached to the patient's limb about the joints. The accelerometer data can be acquired and correlated with neuronal activity as described above. Optionally, a switch (foot or hand held) can be used to manually indicate stimulation or movement which cannot be directly instrumented such as a mouth opening, tongue protrusion, etc.
- With further reference to FIG. 8, the system simultaneously records signal data as a stimulus is applied and removed. An analysis of a distribution curve's tails for each recorded epoch can be graphed as shown in FIG. 9 as
graph 900. The graph shows the size of the curve's tails, wherepoints 905 represent larger tails (indicating greater neuronal activity) and points 910 represent smaller tails (indicating little or no neuronal activity). - FIG. 10 illustrates a
graph 1000 of applied movement or stimulus corresponding in time to graph 900.Points 1005 represent when a stimulus is applied to a target and points 1010 represent no stimulus applied. With this data, the system determines if changes occur in neuronal activity (increase or decrease) based on the corresponding stimulus (block 830). The two graphs are then correlated to determine if an increase in neuronal activity corresponds to the application of stimulus (block 835). they correlate to a sufficient degree (block 840), then it is reasonable to conclude that the microelectrode recording tip is within the sensory and/or motor region of the target. If it does not correlate, then the microelectrode can be moved to a new position and the process repeats until a match is found (block 820). Alternately, the microelectrode can be maintained at its position and a new area of stimulation can be selected to determine if it correlates. It will be noted that movement of the electrode may not be tied to the identification of sensory and/or motor related units, rather it may be tied to the presence or absence of an extracellular action potential being within the signal recorded. - In one embodiment, correlation can be determined using Pearson Product Moment Correlation (also called Pearson's correlation for short). Pearson's correlation reflects a degree of linear relationship between two variables. It ranges from +1 to −1. A correlation of +1 means that there is a perfect positive linear relationship between variables while a correlation of −1 means that there is a perfect negative linear relationship between variables. By correlating the data from the graphs of FIG. 9 and FIG. 10, a correlation graph is generated shown in FIG. 11. Here, there is a high correlation (positive or negative) represented by
line 1100. This means that the target location of the microelectrode and the neuronal activity therein correlates or is associated with the stimulation applied. It will be appreciated that a negative correlation of sufficient degree may also demonstrate a correlation. Optionally, the system can determine the extent of a correlation by taking the absolute value of the correlation value. By using the above system, a physician can objectively determine if the microelectrode is located in a desired location based on neuronal activity. - Additionally, once a neuron action potential is located, the microelectrode can be incrementally advanced to determine the dimension of the neuronal area. Signal data is collected at each incremental location and a statistical analysis is performed to determine if it is noise or further contains neuronal activity as described above. Knowing the dimension of the neuron can help better position an implanted electrode in that location.
- Data obtained and/or results found by the system can be processed for communication via the Internet or other network. Intra-operative data can be transmitted via the Internet to a central facility for processing which can assist in problem solving and data analysis and interpretation.
- Thus, embodiments of the neuron analysis system and method are disclosed. One skilled in the art will appreciate that the present invention can be practiced with embodiments other than those disclosed. The disclosed embodiments are presented for purposes of illustration and not limitation, and the present invention is limited only by the claims that follow.
Claims (28)
1. A system of positioning a microelectrode within a tissue, the system comprising:
a microelectrode for collecting electrical signals;
distribution logic that generates a statistical distribution of the electrical signals;
identification logic that identifies whether the statistical distribution resembles a noise distribution;
a position controller for controlling the position of microelectrode, the position controller moving or not moving the electrode based on the identification of the statistical distribution.
2. The system as set forth in claim 1 wherein the statistical distribution is based on voltage amplitude values of the electrical signals.
3. The system as set forth in claim 1 wherein the noise distribution is a bell-shaped curve.
4. The system as set forth in claim 1 wherein the identification logic (i) includes logic for determining when the statistical distribution differs from the noise distribution, (ii) and generates a signal indicating possible neuron cell discharges are present in the electrical signals.
5. The system as set forth in claim 4 wherein the position controller moves the microelectrode within the brain until the signal is received.
6. The system as set forth in claim 1 further including count logic for analyzing tails of the statistical distribution and indicating a quantity of neuron cell discharges in the electrical signals.
7. The system as set forth in claim 1 wherein the identification logic includes means for analyzing the statistical distribution.
8. The system as set forth in claim 1 wherein the identification logic includes logic for determining a kurtosis value of the statistical distribution.
9. The system as set forth in claim 1 further including correlation logic that correlates the statistical distribution with an applied stimulus.
10. A software product for analyzing electrical signal data collected from tissue, the software product comprising:
first computer executable instructions that cause a computer to generate a statistical distribution of the electrical signal data where the statistical distribution has a first shape which represents noise signal data or a second shape that represents noise data with neuronal activity; and
second computer executable instructions that cause a computer to analyze the statistical distribution and indicate whether neuronal activity is present in the electrical signal data based on the shape of the statistical distribution.
11. The software product as set forth in claim 10 further including third computer executable instructions that cause a computer to exaggerate the electrical signal data to increase values that depart from a mean value.
12. The software product as set forth in claim 11 wherein the instructions to exaggerate include instructions that apply a fourth order moment about the mean to the electrical signal data.
13. The software product as set forth in claim 10 wherein the first shape is generally a bell shaped curve and the second shape is a curve with a departure from the bell shaped curve.
14. The software product as set forth in claim 10 wherein the statistical distribution is generated from voltage values of the electrical signal data.
15. The software product as set forth in claim 10 further including fourth computer executable instructions that cause a computer to determine an amount of neuron activity based on tails of the statistical distribution.
16. The software product as set forth in claim 10 further including fifth computer executable instructions that cause a computer to determine a kurtosis value from the statistical distribution which is used to indicate the shape of the statistical distribution.
17. The software product as set forth in claim 10 further including computer executable instructions that cause a computer to determine a correlation between neuronal activity and an applied stimulus.
18. A method of determining a nerve discharge from a plurality of electrical signals, the method comprising the steps of:
statistically analyzing at least one characteristic of the plurality of electrical signals and generating a distribution curve from at least one characteristic;
determining a statistical characteristic of the distribution curve; and
determining whether at least one nerve discharge signal occurs within the electrical signal data based on the statistical characteristic of the distribution curve.
19. The method as set forth in claim 18 wherein an electrode is used to collect the plurality of electrical signals, the method further including:
automatically moving the electrode to a different location and collecting another set of electrical signals when the statistical characteristic of the distribution curve represents a noise distribution.
20. The method as set forth in claim 18 wherein the distribution curve is generated from voltage values of each of the plurality of electrical signals.
21. The method as set forth in claim 18 further including collecting the plurality of electrical signals over a predetermined time period.
22. The method as set forth in claim 18 wherein the statistically analyzing step includes generating a generally bell-shaped distribution curve when the plurality of electrical signals represent noise signals, and generating a distribution curve different from the generally bell-shaped distribution curve when the plurality of electrical signals contain neuronal activity.
23. The method as set forth in claim 18 wherein the step of determining a statistical characteristic includes:
determining a central tendency of the plurality of electrical signals; and
measuring an amount of signal dispersion from the central tendency.
24. The method as set forth in claim 18 further including determining an amount of nerve discharge signals within the plurality of electrical signals by a size of a tail of the distribution curve.
25. The method as set forth in claim 18 further including determining whether at least one nerve discharge signal occurs within the electrical signal data simultaneously with an applied stimulation.
26. The method as set forth in claim 18 wherein the step of determining a statistical characteristic of the distribution curve includes determining a kurtosis value from the distribution curve.
27. The method as set forth in claim 18 wherein the step of determining a statistical characteristic of the distribution curve includes determining a size of tails of the distribution curve.
28. The method as set forth in claim 18 wherein the step of determining a statistical characteristic of the distribution curve includes determining a plurality of statistical characteristics.
Priority Applications (8)
| Application Number | Priority Date | Filing Date | Title |
|---|---|---|---|
| US10/138,987 US7136696B2 (en) | 2002-04-05 | 2002-05-03 | Neuron signal analysis system and method |
| EP03721388A EP1492449B1 (en) | 2002-04-05 | 2003-03-17 | Neuron signal analysis system |
| AU2003224705A AU2003224705A1 (en) | 2002-04-05 | 2003-03-17 | Neuron signal analysis system and method |
| DE60313760T DE60313760T2 (en) | 2002-04-05 | 2003-03-17 | NEURONS SIGNAL ANALYSIS SYSTEM |
| PCT/US2003/008283 WO2003086185A1 (en) | 2002-04-05 | 2003-03-17 | Neuron signal analysis system and method |
| CA002459271A CA2459271A1 (en) | 2002-04-05 | 2003-03-17 | Neuron signal analysis system and method |
| DK03721388T DK1492449T3 (en) | 2002-04-05 | 2003-03-17 | Neuro Signal Analysis System |
| AT03721388T ATE361700T1 (en) | 2002-04-05 | 2003-03-17 | NEURON SIGNAL ANALYSIS SYSTEM |
Applications Claiming Priority (2)
| Application Number | Priority Date | Filing Date | Title |
|---|---|---|---|
| US37012302P | 2002-04-05 | 2002-04-05 | |
| US10/138,987 US7136696B2 (en) | 2002-04-05 | 2002-05-03 | Neuron signal analysis system and method |
Publications (2)
| Publication Number | Publication Date |
|---|---|
| US20030191408A1 true US20030191408A1 (en) | 2003-10-09 |
| US7136696B2 US7136696B2 (en) | 2006-11-14 |
Family
ID=28677894
Family Applications (1)
| Application Number | Title | Priority Date | Filing Date |
|---|---|---|---|
| US10/138,987 Expired - Fee Related US7136696B2 (en) | 2002-04-05 | 2002-05-03 | Neuron signal analysis system and method |
Country Status (8)
| Country | Link |
|---|---|
| US (1) | US7136696B2 (en) |
| EP (1) | EP1492449B1 (en) |
| AT (1) | ATE361700T1 (en) |
| AU (1) | AU2003224705A1 (en) |
| CA (1) | CA2459271A1 (en) |
| DE (1) | DE60313760T2 (en) |
| DK (1) | DK1492449T3 (en) |
| WO (1) | WO2003086185A1 (en) |
Cited By (9)
| Publication number | Priority date | Publication date | Assignee | Title |
|---|---|---|---|---|
| US20050256541A1 (en) * | 2004-04-30 | 2005-11-17 | Medtronic, Inc. | Catheter with temporary stimulation electrode |
| US20050261874A1 (en) * | 2002-08-09 | 2005-11-24 | Gustavo Deco | Method and arrangement and computer programme with programme code means and computer programme products for the analysis of neuronal activities in neuronal areas |
| US20080051673A1 (en) * | 2006-08-17 | 2008-02-28 | Xuan Kong | Motor unit number estimation (MUNE) for the assessment of neuromuscular function |
| US20100081914A1 (en) * | 2008-09-26 | 2010-04-01 | Waynik Jeffrey M | Method and apparatus for positioning a guide relative to a base |
| CN101908099A (en) * | 2010-07-22 | 2010-12-08 | 中国人民解放军第三军医大学第三附属医院 | Unit discharge analysis method and system of neuron information |
| US8112292B2 (en) | 2006-04-21 | 2012-02-07 | Medtronic Navigation, Inc. | Method and apparatus for optimizing a therapy |
| WO2012145244A1 (en) * | 2011-04-20 | 2012-10-26 | Medtronic, Inc. | Method and apparatus for assessing neural activation |
| US8660635B2 (en) | 2006-09-29 | 2014-02-25 | Medtronic, Inc. | Method and apparatus for optimizing a computer assisted surgical procedure |
| WO2018191725A1 (en) * | 2017-04-14 | 2018-10-18 | Paradromics, Inc. | Low-area, low-power neural recording circuit, and method of training the same |
Families Citing this family (41)
| Publication number | Priority date | Publication date | Assignee | Title |
|---|---|---|---|---|
| US7346382B2 (en) | 2004-07-07 | 2008-03-18 | The Cleveland Clinic Foundation | Brain stimulation models, systems, devices, and methods |
| US8209027B2 (en) | 2004-07-07 | 2012-06-26 | The Cleveland Clinic Foundation | System and method to design structure for delivering electrical energy to tissue |
| US8180601B2 (en) | 2006-03-09 | 2012-05-15 | The Cleveland Clinic Foundation | Systems and methods for determining volume of activation for deep brain stimulation |
| US20090048530A1 (en) * | 2007-08-15 | 2009-02-19 | The General Electric Company | Monitoring of epileptiform activity |
| US9220889B2 (en) | 2008-02-11 | 2015-12-29 | Intelect Medical, Inc. | Directional electrode devices with locating features |
| US8019440B2 (en) | 2008-02-12 | 2011-09-13 | Intelect Medical, Inc. | Directional lead assembly |
| US9272153B2 (en) | 2008-05-15 | 2016-03-01 | Boston Scientific Neuromodulation Corporation | VOA generation system and method using a fiber specific analysis |
| JP2012510877A (en) | 2008-12-04 | 2012-05-17 | ザ クリーブランド クリニック ファウンデーション | System and method for defining a target volume for brain stimulation |
| CA2772330A1 (en) | 2009-08-27 | 2011-03-03 | The Cleveland Clinic Foundation | System and method to estimate region of tissue activation |
| WO2011068997A1 (en) | 2009-12-02 | 2011-06-09 | The Cleveland Clinic Foundation | Reversing cognitive-motor impairments in patients having a neuro-degenerative disease using a computational modeling approach to deep brain stimulation programming |
| CA2802708A1 (en) | 2010-06-14 | 2011-12-22 | Boston Scientific Neuromodulation Corporation | Programming interface for spinal cord neuromodulation |
| CA2828318A1 (en) | 2011-03-29 | 2012-10-04 | Boston Scientific Neuromodulation Corporation | System and method for image registration |
| US9592389B2 (en) | 2011-05-27 | 2017-03-14 | Boston Scientific Neuromodulation Corporation | Visualization of relevant stimulation leadwire electrodes relative to selected stimulation information |
| WO2013023085A2 (en) | 2011-08-09 | 2013-02-14 | Boston Scientific Neuromodulation Corporation | Systems and methods for stimulation-related volume analysis, creation, and sharing |
| US9604067B2 (en) | 2012-08-04 | 2017-03-28 | Boston Scientific Neuromodulation Corporation | Techniques and methods for storing and transferring registration, atlas, and lead information between medical devices |
| EP2890454B1 (en) | 2012-08-28 | 2017-11-08 | Boston Scientific Neuromodulation Corporation | Point-and-click programming for deep brain stimulation using real-time monopolar review trendlines |
| US9792412B2 (en) | 2012-11-01 | 2017-10-17 | Boston Scientific Neuromodulation Corporation | Systems and methods for VOA model generation and use |
| US9959388B2 (en) | 2014-07-24 | 2018-05-01 | Boston Scientific Neuromodulation Corporation | Systems, devices, and methods for providing electrical stimulation therapy feedback |
| US10272247B2 (en) | 2014-07-30 | 2019-04-30 | Boston Scientific Neuromodulation Corporation | Systems and methods for stimulation-related volume analysis, creation, and sharing with integrated surgical planning and stimulation programming |
| US10265528B2 (en) | 2014-07-30 | 2019-04-23 | Boston Scientific Neuromodulation Corporation | Systems and methods for electrical stimulation-related patient population volume analysis and use |
| US10478616B2 (en) | 2014-08-20 | 2019-11-19 | Greenville Neuromodulation Center | Method and system for physiological target localization from macroelectrode recordings and monitoring spinal cord function |
| US9974959B2 (en) | 2014-10-07 | 2018-05-22 | Boston Scientific Neuromodulation Corporation | Systems, devices, and methods for electrical stimulation using feedback to adjust stimulation parameters |
| US10780283B2 (en) | 2015-05-26 | 2020-09-22 | Boston Scientific Neuromodulation Corporation | Systems and methods for analyzing electrical stimulation and selecting or manipulating volumes of activation |
| AU2016268259B2 (en) | 2015-05-26 | 2019-01-31 | Boston Scientific Neuromodulation Corporation | Systems and methods for analyzing electrical stimulation and selecting or manipulating volumes of activation |
| WO2017003947A1 (en) | 2015-06-29 | 2017-01-05 | Boston Scientific Neuromodulation Corporation | Systems and methods for selecting stimulation parameters by targeting and steering |
| EP3280490B1 (en) | 2015-06-29 | 2021-09-01 | Boston Scientific Neuromodulation Corporation | Systems for selecting stimulation parameters based on stimulation target region, effects, or side effects |
| WO2017062378A1 (en) | 2015-10-09 | 2017-04-13 | Boston Scientific Neuromodulation Corporation | System and methods for clinical effects mapping for directional stimulations leads |
| US10716942B2 (en) | 2016-04-25 | 2020-07-21 | Boston Scientific Neuromodulation Corporation | System and methods for directional steering of electrical stimulation |
| US11471092B2 (en) | 2016-06-20 | 2022-10-18 | Greenville Neuromodulation Center | Microelectrode with hemoglobin or iron sensor and methods of guiding same |
| US10776456B2 (en) | 2016-06-24 | 2020-09-15 | Boston Scientific Neuromodulation Corporation | Systems and methods for visual analytics of clinical effects |
| WO2018044881A1 (en) | 2016-09-02 | 2018-03-08 | Boston Scientific Neuromodulation Corporation | Systems and methods for visualizing and directing stimulation of neural elements |
| US10780282B2 (en) | 2016-09-20 | 2020-09-22 | Boston Scientific Neuromodulation Corporation | Systems and methods for steering electrical stimulation of patient tissue and determining stimulation parameters |
| CN109803719B (en) | 2016-10-14 | 2023-05-26 | 波士顿科学神经调制公司 | System and method for closed loop determination of stimulation parameter settings for an electrical simulation system |
| JP6834005B2 (en) | 2017-01-03 | 2021-02-24 | ボストン サイエンティフィック ニューロモデュレイション コーポレイション | Systems and methods for selecting MRI-matched stimulus parameters |
| EP3519043B1 (en) | 2017-01-10 | 2020-08-12 | Boston Scientific Neuromodulation Corporation | Systems and methods for creating stimulation programs based on user-defined areas or volumes |
| US10625082B2 (en) | 2017-03-15 | 2020-04-21 | Boston Scientific Neuromodulation Corporation | Visualization of deep brain stimulation efficacy |
| WO2018187090A1 (en) | 2017-04-03 | 2018-10-11 | Boston Scientific Neuromodulation Corporation | Systems and methods for estimating a volume of activation using a compressed database of threshold values |
| EP3651849B1 (en) | 2017-07-14 | 2023-05-31 | Boston Scientific Neuromodulation Corporation | Estimating clinical effects of electrical stimulation |
| US10960214B2 (en) | 2017-08-15 | 2021-03-30 | Boston Scientific Neuromodulation Corporation | Systems and methods for controlling electrical stimulation using multiple stimulation fields |
| EP3784331B1 (en) | 2018-04-27 | 2023-01-18 | Boston Scientific Neuromodulation Corporation | Multi-mode electrical stimulation systems and methods of making and using |
| WO2019210214A1 (en) | 2018-04-27 | 2019-10-31 | Boston Scientific Neuromodulation Corporation | Systems for visualizing and programming electrical stimulation |
Citations (10)
| Publication number | Priority date | Publication date | Assignee | Title |
|---|---|---|---|---|
| US3841310A (en) * | 1973-04-04 | 1974-10-15 | Us Health Education & Welfare | Electrode insertion device for neuroelectrical recordings |
| US5143067A (en) * | 1990-06-07 | 1992-09-01 | Medtronic, Inc. | Tool for implantable neural electrode |
| US5165412A (en) * | 1990-03-05 | 1992-11-24 | Kabushiki Kaisha Toshiba | Shock wave medical treatment apparatus with exchangeable imaging ultrasonic wave probe |
| US5743860A (en) * | 1996-03-20 | 1998-04-28 | Lockheed Martin Energy Systems, Inc. | Apparatus and method for epileptic seizure detection using non-linear techniques |
| US6301492B1 (en) * | 2000-01-20 | 2001-10-09 | Electrocore Technologies, Llc | Device for performing microelectrode recordings through the central channel of a deep-brain stimulation electrode |
| US6330466B1 (en) * | 1998-02-23 | 2001-12-11 | California Institute Of Technology | Using a multi-electrode probe in creating an electrophysiological profile during stereotactic neurosurgery |
| US20010053885A1 (en) * | 1998-04-30 | 2001-12-20 | Frans Gielen | Techniques for positioning therapy delivery elements within a spinal cord or a brain |
| US6343226B1 (en) * | 1999-06-25 | 2002-01-29 | Neurokinetic Aps | Multifunction electrode for neural tissue stimulation |
| US20020188330A1 (en) * | 2001-04-27 | 2002-12-12 | Gielen Frans L. H. | Closed loop neuromodulation for suppression of epileptic activity |
| US6507754B2 (en) * | 2000-04-27 | 2003-01-14 | Centre National De La Recherche Scientifique | Device for the medical monitoring in real time of a patient from the analysis of electroencephalograms |
Family Cites Families (38)
| Publication number | Priority date | Publication date | Assignee | Title |
|---|---|---|---|---|
| US3826244A (en) | 1973-07-20 | 1974-07-30 | Us Health Education & Welfare | Thumbtack microelectrode and method of making same |
| CA1065969A (en) | 1977-09-28 | 1979-11-06 | Gratien Bouillon | Self-blocking cerebral catheter |
| US4461304A (en) | 1979-11-05 | 1984-07-24 | Massachusetts Institute Of Technology | Microelectrode and assembly for parallel recording of neurol groups |
| US5458631A (en) | 1989-01-06 | 1995-10-17 | Xavier; Ravi | Implantable catheter with electrical pulse nerve stimulators and drug delivery system |
| US5119832A (en) | 1989-07-11 | 1992-06-09 | Ravi Xavier | Epidural catheter with nerve stimulators |
| US5081990A (en) | 1990-05-11 | 1992-01-21 | New York University | Catheter for spinal epidural injection of drugs and measurement of evoked potentials |
| US5375594A (en) | 1993-03-29 | 1994-12-27 | Cueva; Roberto A. | Removable medical electrode system |
| US5563067A (en) | 1994-06-13 | 1996-10-08 | Matsushita Electric Industrial Co., Ltd. | Cell potential measurement apparatus having a plurality of microelectrodes |
| US5810742A (en) | 1994-10-24 | 1998-09-22 | Transcan Research & Development Co., Ltd. | Tissue characterization based on impedance images and on impedance measurements |
| US6678552B2 (en) | 1994-10-24 | 2004-01-13 | Transscan Medical Ltd. | Tissue characterization based on impedance images and on impedance measurements |
| CA2203405C (en) | 1994-10-24 | 2009-04-28 | Andrew L. Pearlman | Impedance imaging devices and multi-element probe |
| US5701909A (en) | 1994-11-01 | 1997-12-30 | Abratech Corporation | Machine and method for the determination of nervous-system-generator parameters using lead fields |
| WO1997037720A1 (en) | 1996-04-04 | 1997-10-16 | Medtronic, Inc. | Living tissue stimulation and recording techniques |
| US6493576B1 (en) | 1996-06-17 | 2002-12-10 | Erich Jaeger Gmbh | Method and apparatus for measuring stimulus-evoked potentials of the brain |
| CA2258008A1 (en) | 1996-06-20 | 1997-12-24 | Advanced Bionics Corporation | Self-adjusting cochlear implant system and method for fitting same |
| ATE349694T1 (en) | 1997-05-01 | 2007-01-15 | Sophion Bioscience As | DEVICE FOR AUTOMATIC ELECTRODE POSITIONING |
| US5902236A (en) | 1997-09-03 | 1999-05-11 | Pmt Corporation | Tissue electrode for recording and stimulation |
| US20010027336A1 (en) | 1998-01-20 | 2001-10-04 | Medtronic, Inc. | Combined micro-macro brain stimulation system |
| US6011996A (en) | 1998-01-20 | 2000-01-04 | Medtronic, Inc | Dual electrode lead and method for brain target localization in functional stereotactic brain surgery |
| US6529765B1 (en) | 1998-04-21 | 2003-03-04 | Neutar L.L.C. | Instrumented and actuated guidance fixture for sterotactic surgery |
| US6298262B1 (en) | 1998-04-21 | 2001-10-02 | Neutar, Llc | Instrument guidance for stereotactic surgery |
| US6546277B1 (en) | 1998-04-21 | 2003-04-08 | Neutar L.L.C. | Instrument guidance system for spinal and other surgery |
| US6201982B1 (en) | 1998-07-02 | 2001-03-13 | Baltimore Biomedical, Inc. | Quick-placement electroencephalogram (EEG) electrode |
| US6282437B1 (en) | 1998-08-12 | 2001-08-28 | Neutar, Llc | Body-mounted sensing system for stereotactic surgery |
| JP2000262460A (en) | 1999-03-18 | 2000-09-26 | Inst Of Physical & Chemical Res | Method for detecting specified location, method for biological measurement, device for detecting specified location of biological sample, and optical fiber holding device |
| DE69923299T2 (en) | 1999-06-25 | 2006-01-05 | Neurokinetic Aps | Multifunctional electrode for the stimulation of neuronal tissues |
| US6175753B1 (en) | 1999-07-02 | 2001-01-16 | Baltimore Biomedical, Inc. | Methods and mechanisms for quick-placement electroencephalogram (EEG) electrodes |
| FR2803186B1 (en) | 2000-01-05 | 2002-08-09 | Guy Charvin | METHOD AND APPARATUS FOR COLLECTING HEARING MESSAGE POTENTIALS |
| AU761251B2 (en) | 2000-01-05 | 2003-05-29 | Rolf-Dieter Battmer | Device for measuring or collecting auditory evoked potentials |
| US6622035B1 (en) | 2000-01-21 | 2003-09-16 | Instrumentarium Corp. | Electrode for measurement of weak bioelectrical signals |
| DE10010081A1 (en) | 2000-03-02 | 2001-09-13 | Nmi Univ Tuebingen | Apparatus for an electro-physiological study of biological material comprises an array of measurement electrodes on the carrier and a counter electrode within the sample vessel |
| ATE305757T1 (en) | 2000-04-12 | 2005-10-15 | Afx Inc | ABLATION CATHETER WITH A DIRECTED H.F. RADIATION ELEMENT |
| JP3909738B2 (en) | 2000-07-13 | 2007-04-25 | 松下電器産業株式会社 | Integrated composite electrode for extracellular recording |
| US7112319B2 (en) | 2001-04-06 | 2006-09-26 | The Research Foundation Of The City University Of New York | Identification, diagnosis, and treatment of neuropathologies, neurotoxicities, tumors, and brain and spinal cord injuries using microelectrodes with microvoltammetry |
| US7041492B2 (en) | 2001-06-20 | 2006-05-09 | Matsushita Electric Industrial Co., Ltd. | Extracellular recording electrode |
| IL145700A0 (en) | 2001-09-30 | 2002-06-30 | Younis Imad | Electrode system for neural applications |
| US7010356B2 (en) | 2001-10-31 | 2006-03-07 | London Health Sciences Centre Research Inc. | Multichannel electrode and methods of using same |
| US6993392B2 (en) | 2002-03-14 | 2006-01-31 | Duke University | Miniaturized high-density multichannel electrode array for long-term neuronal recordings |
-
2002
- 2002-05-03 US US10/138,987 patent/US7136696B2/en not_active Expired - Fee Related
-
2003
- 2003-03-17 CA CA002459271A patent/CA2459271A1/en not_active Abandoned
- 2003-03-17 DK DK03721388T patent/DK1492449T3/en active
- 2003-03-17 EP EP03721388A patent/EP1492449B1/en not_active Expired - Lifetime
- 2003-03-17 AU AU2003224705A patent/AU2003224705A1/en not_active Abandoned
- 2003-03-17 WO PCT/US2003/008283 patent/WO2003086185A1/en active IP Right Grant
- 2003-03-17 DE DE60313760T patent/DE60313760T2/en not_active Expired - Fee Related
- 2003-03-17 AT AT03721388T patent/ATE361700T1/en not_active IP Right Cessation
Patent Citations (10)
| Publication number | Priority date | Publication date | Assignee | Title |
|---|---|---|---|---|
| US3841310A (en) * | 1973-04-04 | 1974-10-15 | Us Health Education & Welfare | Electrode insertion device for neuroelectrical recordings |
| US5165412A (en) * | 1990-03-05 | 1992-11-24 | Kabushiki Kaisha Toshiba | Shock wave medical treatment apparatus with exchangeable imaging ultrasonic wave probe |
| US5143067A (en) * | 1990-06-07 | 1992-09-01 | Medtronic, Inc. | Tool for implantable neural electrode |
| US5743860A (en) * | 1996-03-20 | 1998-04-28 | Lockheed Martin Energy Systems, Inc. | Apparatus and method for epileptic seizure detection using non-linear techniques |
| US6330466B1 (en) * | 1998-02-23 | 2001-12-11 | California Institute Of Technology | Using a multi-electrode probe in creating an electrophysiological profile during stereotactic neurosurgery |
| US20010053885A1 (en) * | 1998-04-30 | 2001-12-20 | Frans Gielen | Techniques for positioning therapy delivery elements within a spinal cord or a brain |
| US6343226B1 (en) * | 1999-06-25 | 2002-01-29 | Neurokinetic Aps | Multifunction electrode for neural tissue stimulation |
| US6301492B1 (en) * | 2000-01-20 | 2001-10-09 | Electrocore Technologies, Llc | Device for performing microelectrode recordings through the central channel of a deep-brain stimulation electrode |
| US6507754B2 (en) * | 2000-04-27 | 2003-01-14 | Centre National De La Recherche Scientifique | Device for the medical monitoring in real time of a patient from the analysis of electroencephalograms |
| US20020188330A1 (en) * | 2001-04-27 | 2002-12-12 | Gielen Frans L. H. | Closed loop neuromodulation for suppression of epileptic activity |
Cited By (14)
| Publication number | Priority date | Publication date | Assignee | Title |
|---|---|---|---|---|
| US20050261874A1 (en) * | 2002-08-09 | 2005-11-24 | Gustavo Deco | Method and arrangement and computer programme with programme code means and computer programme products for the analysis of neuronal activities in neuronal areas |
| US7398120B2 (en) * | 2002-08-09 | 2008-07-08 | Siemens Aktiengesellschaft | Method and arrangement and computer programme with programme code means and computer programme products for the analysis of neuronal activities in neuronal areas |
| US20050256541A1 (en) * | 2004-04-30 | 2005-11-17 | Medtronic, Inc. | Catheter with temporary stimulation electrode |
| US8112292B2 (en) | 2006-04-21 | 2012-02-07 | Medtronic Navigation, Inc. | Method and apparatus for optimizing a therapy |
| US20080051673A1 (en) * | 2006-08-17 | 2008-02-28 | Xuan Kong | Motor unit number estimation (MUNE) for the assessment of neuromuscular function |
| US7848797B2 (en) * | 2006-08-17 | 2010-12-07 | Neurometrix, Inc. | Motor unit number estimation (MUNE) for the assessment of neuromuscular function |
| US8660635B2 (en) | 2006-09-29 | 2014-02-25 | Medtronic, Inc. | Method and apparatus for optimizing a computer assisted surgical procedure |
| US9597154B2 (en) | 2006-09-29 | 2017-03-21 | Medtronic, Inc. | Method and apparatus for optimizing a computer assisted surgical procedure |
| US20100081914A1 (en) * | 2008-09-26 | 2010-04-01 | Waynik Jeffrey M | Method and apparatus for positioning a guide relative to a base |
| US8165658B2 (en) | 2008-09-26 | 2012-04-24 | Medtronic, Inc. | Method and apparatus for positioning a guide relative to a base |
| CN101908099A (en) * | 2010-07-22 | 2010-12-08 | 中国人民解放军第三军医大学第三附属医院 | Unit discharge analysis method and system of neuron information |
| US8868173B2 (en) | 2011-04-20 | 2014-10-21 | Medtronic, Inc. | Method and apparatus for assessing neural activation |
| WO2012145244A1 (en) * | 2011-04-20 | 2012-10-26 | Medtronic, Inc. | Method and apparatus for assessing neural activation |
| WO2018191725A1 (en) * | 2017-04-14 | 2018-10-18 | Paradromics, Inc. | Low-area, low-power neural recording circuit, and method of training the same |
Also Published As
| Publication number | Publication date |
|---|---|
| DE60313760T2 (en) | 2008-01-24 |
| ATE361700T1 (en) | 2007-06-15 |
| AU2003224705A1 (en) | 2003-10-27 |
| CA2459271A1 (en) | 2003-10-23 |
| EP1492449A1 (en) | 2005-01-05 |
| WO2003086185A1 (en) | 2003-10-23 |
| DE60313760D1 (en) | 2007-06-21 |
| US7136696B2 (en) | 2006-11-14 |
| EP1492449B1 (en) | 2007-05-09 |
| DK1492449T3 (en) | 2007-09-10 |
Similar Documents
| Publication | Publication Date | Title |
|---|---|---|
| US7136696B2 (en) | Neuron signal analysis system and method | |
| US11045129B2 (en) | Method and apparatus for estimating neural recruitment | |
| US20200289815A1 (en) | Method and System For Physiological Target Localization From Macroelectrode Recordings and Monitoring Spinal Cord Function | |
| Sinclair et al. | Deep brain stimulation for Parkinson's disease modulates high-frequency evoked and spontaneous neural activity | |
| JP4926072B2 (en) | Method and apparatus for desynchronizing cranial nerve activity, controller, and method for treating neurological and / or psychiatric disorders | |
| EP4338662A2 (en) | Predictive therapy neurostimulation systems | |
| US20080045853A1 (en) | Methods and Devices for Determining Brain State | |
| JP2022540861A (en) | monitoring the quality of neural recordings | |
| US20230371876A1 (en) | Systems, methods, and devices for detecting the threshold of nerve-muscle response using variable frequency of stimulation | |
| Castaño-Candamil et al. | A pilot study on data-driven adaptive deep brain stimulation in chronically implanted essential tremor patients | |
| Sanchez et al. | Evolving into epilepsy: Multiscale electrophysiological analysis and imaging in an animal model | |
| US11331494B2 (en) | Brain tissue stimulation method, apparatus and computer program | |
| Turner et al. | 12 Conceptual and Technical Approaches to Human Neural Ensemble Recordings | |
| van Dijk | On the number of motor units. | |
| EP4076194B1 (en) | A process and a device for decomposition of compound muscle action potentials | |
| Roh et al. | Correlating Beta Oscillations from Intraoperative Microelectrode and Postoperative Implanted Electrode in Patients Undergoing Subthalamic Nucleus Deep Brain Stimulation for Parkinson Disease; A Feasibility Study | |
| KR20200055431A (en) | Delirium-Induced animal model and its producing method | |
| US20110184306A1 (en) | Device for treating parkinson's disease and methods of use thereof | |
| Heiney | Roles Of Inhibitory Interneurons In Cerebellar Cortical Processing For Oculomotor Control | |
| Castaño-Candamil | A pilot study on data-driven adaptive deep brain stimulation in chronically implanted essential tremor patients world | |
| Sleight | Quantification of Chronic Microelectrode Signal Quality over Time | |
| WO2011094262A1 (en) | Device for treating parkinson's disease |
Legal Events
| Date | Code | Title | Description |
|---|---|---|---|
| AS | Assignment |
Owner name: CLEVELAND CLINIC FOUNDATION, THE, OHIO Free format text: ASSIGNMENT OF ASSIGNORS INTEREST;ASSIGNOR:MONTGOMERY, ERWIN B.;REEL/FRAME:012881/0293 Effective date: 20020430 |
|
| CC | Certificate of correction | ||
| REMI | Maintenance fee reminder mailed | ||
| FPAY | Fee payment |
Year of fee payment: 4 |
|
| SULP | Surcharge for late payment | ||
| REMI | Maintenance fee reminder mailed | ||
| LAPS | Lapse for failure to pay maintenance fees | ||
| STCH | Information on status: patent discontinuation |
Free format text: PATENT EXPIRED DUE TO NONPAYMENT OF MAINTENANCE FEES UNDER 37 CFR 1.362 |
|
| FP | Lapsed due to failure to pay maintenance fee |
Effective date: 20141114 |