US4419690A - Method and apparatus for producing a half-tone reproduction - Google Patents
Method and apparatus for producing a half-tone reproduction Download PDFInfo
- Publication number
- US4419690A US4419690A US06/296,670 US29667081A US4419690A US 4419690 A US4419690 A US 4419690A US 29667081 A US29667081 A US 29667081A US 4419690 A US4419690 A US 4419690A
- Authority
- US
- United States
- Prior art keywords
- scanning beam
- accordance
- dot
- border
- output surface
- Prior art date
- Legal status (The legal status is an assumption and is not a legal conclusion. Google has not performed a legal analysis and makes no representation as to the accuracy of the status listed.)
- Expired - Lifetime
Links
Images


Classifications
-
- H—ELECTRICITY
- H04—ELECTRIC COMMUNICATION TECHNIQUE
- H04N—PICTORIAL COMMUNICATION, e.g. TELEVISION
- H04N1/00—Scanning, transmission or reproduction of documents or the like, e.g. facsimile transmission; Details thereof
- H04N1/40—Picture signal circuits
- H04N1/40081—Soft dot halftoning, i.e. producing halftone dots with gradual edges
-
- H—ELECTRICITY
- H04—ELECTRIC COMMUNICATION TECHNIQUE
- H04N—PICTORIAL COMMUNICATION, e.g. TELEVISION
- H04N1/00—Scanning, transmission or reproduction of documents or the like, e.g. facsimile transmission; Details thereof
- H04N1/40—Picture signal circuits
- H04N1/405—Halftoning, i.e. converting the picture signal of a continuous-tone original into a corresponding signal showing only two levels
- H04N1/4055—Halftoning, i.e. converting the picture signal of a continuous-tone original into a corresponding signal showing only two levels producing a clustered dots or a size modulated halftone pattern
- H04N1/4058—Halftoning, i.e. converting the picture signal of a continuous-tone original into a corresponding signal showing only two levels producing a clustered dots or a size modulated halftone pattern with details for producing a halftone screen at an oblique angle
Definitions
- the invention relates to a method and apparatus for producing a half-tone reproduction of an original image by exposing an output surface to a beam of varying intensity.
- This may be used in the production of colour separations, when a coloured original is scanned by a traversing optoelectronic scanner as the original is rotated on a cylindrical roller, to obtain colour separation signals representing intensities of, for example, yellow, magenta and cyan. The intensities are then corrected in a colour computer to derive picture signals for each colour. The signals are used to determine the size of the dots necessary, for that particular region being scanned, to create the half-tone image produced on the output surface. High tonal densities in the original require for their synthesis large dots in the half-tone dot pattern on the output surface.
- the half-tone dots may be of any shape, and one dot pattern may have dots of more than one shape or orientation.
- a half-tone dot pattern generally consists of repeated rows of dots, the rows making an angle known as the screen angle with the direction of motion of the output surface relative to the recording heads.
- the screen angle in the simplest case is 90° when the rows of dots are aligned with the axis of the cylinder around which is fixed the output surface.
- different colour separations are given different screen angles, to avoid, or at least minimize, the unsightly Moire-type fringe patterns in the final image when all the coloured dot patterns are superimposed.
- Half-tone "hard” dots are created by exposing an output surface to parallel beams which are either on or off, and are controlled by an electronic circuit.
- the output surface is scanned in accordance with the scanning of an original image to be reproduced, and the electronic circuit responds to the brightness of the original image at the point being scanned, and to the position of the scan of the output surface relative to an "electronic screen grid" inclined at a "screen angle" to the output surface.
- the electronic screen grid is not a real screen superimposed on the output surface, as has been used in the past for obtaining half-tone modulation of an exposing beam, but is an imaginary device for computing the modulation of an electronic signal in accordance with a half-tone dot grid at a desired screen angle ( ⁇ ), line spacing and magnification.
- the output surface is a rectangular separation wrapped around a drum which is scanned helically, and it is difficult to obtain a correct value for the position of the scanning beam relative to the rectangular electronic screen grid each time a new vertical scan of the output surface is commenced. This can give rise to unsatisfactory half-tone dot patterns.
- the progress of the scan across the electronic screen is effected by the repeated addition of small, constant increments to coordinates representing the scan position.
- the resolution of the dot pattern is limited by the number of bits of information allocated to defining the position of the scan within one elementary unit of the screen grid, corresponding to one dot area.
- the increments to the position coordinates are constant throughout the scan.
- the method is also made less flexible because the number of bits defining one side of a unit of the screen grid also has to be a power of two, for example thirty-two.
- British Patent No. 1,492,740 discloses a multiple beam half-tone system which is capable of producing a certain kind of "soft dot", but still has many limitations, and in particular cannot produce a dot pattern with uniform etchability. Moreover, recently-produced films require overexposure at the dot centres which exceed that obtainable with this known system.
- the present invention is aimed at providing a method of half-tone reproduction which overcomes all the limitations above, and can also be used to produce "soft dots" with uniform etchability and adequate exposure levels, with the or each scanning beam intensity varying between more than two levels for soft dots.
- a method according to the invention of making a half-tone reproduction of an original image by exposing an output surface to a scanning beam which assumes conditions in accordance with the value of a control signal comprises, for the generation of the control signal, the steps of:
- the scanning beam assumes "on” and “off” conditions in accordance with two possible values of the control signal.
- the method may include, in step (a), the step of deriving from the said position signals a single index signal for the scanning beam;
- step (b) the index signal is then compared with the picture signal.
- step (b) by exposing the output surface to the scanning beam which assumes a level of intensity in accordance with the value of the control signal, in step (b) the said position signals or the said index signal are combined with the picture signal; and in step (c) the results of the said combinations are processed to generate the control signal which causes the scanning beam to record at a level of intensity in accordance with the said processing of the results.
- step (a) includes the generation, when crossing the said border, of a new value for each of the position signals within the new references of the new dot area or other elemental area.
- the said small increments preferably remain unaltered as the beam scans across an elemental area, but are given special border values whenever the beam crosses into a new elemental area.
- the position signals within a half-tone dot area or other elemental area are compared with a signal representing the width of a half-tone dot area after the said addition of the small increments, in order to determine whether the scanning beam has approached the border of the half-tone dot area or elemental area of the screen grid, and, if so, the signals are adjusted to represent the arrival of the scanning beam at the opposite side of the same half-tone dot area or the same elemental area, causing the scanning beam effectively to scan only one such area.
- the scanning beam preferably scans through a succession of equally-spaced, parallel, substantially vertical lines over the output surface, and the step (a) preferably includes the step of recognizing that a vertical scan has finished, and then initialising the position signals for a new vertical scan.
- a plurality of beams for example six beams, scan the output surface in parallel, each beam being controlled independently according to the method described above, with the exception that all the beams are initialized in accordance with their relative positions on the output surface.
- the said picture signal is generally obtained by analysing the original by means of a "read" scanning beam, which scans simultaneously with, and along a line parallel to, the said scanning beam.
- the picture signal may, alternatively, be obtained from a memory storing the result of a previous analysis of the original image.
- Other processes may take place between the "read" scanning of the original and the "write” scanning of the output surface, for example the assembly of images into a page, colour correction, gradation editorial adjustment, detail enhancement, etc.
- position signals are generated for each scanning beam and for each of two or more different colour separations which require different screen angles, the position signals corresponding to the different values of the screen angles being computed either simultaneously, or sequentially according to the rotation of each successive colour separation output surface past a recording head.
- At least two output surfaces, to form two colour separations after exposure are wrapped around a drum so that each passes the same exposing head in each revolution of the drum, and the extraction from a store of picture signals for each successive colour separation is controlled synchronously with the changing of the screen angle to be used in the position signal computation.
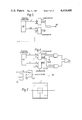
- FIG. 1 is a schematic diagram of a conventional half-tone reproduction system
- FIG. 2 shows how increasing the size of the dots in a half-tone pattern gives a denser image
- FIG. 3 is a sketch showing the idealized output surface on which is superimposed a screen grid at an angle ⁇ according to the invention
- FIG. 4 shows one dot area of the screen grid in FIG. 3
- FIG. 5 shows one embodiment of a screen computer according to the invention, which generates a tilted square dot pattern with an "on/off" recording beam;
- FIG. 6 shows a position computer similar to that shown in FIG. 5 which generates a square dot pattern with the sides of the squares aligned with the screen grid;
- FIG. 7 shows one dot area of the screen grid used in the screen computer of FIG. 6;
- FIG. 8 shows a screen computer for generating a rhombic or lozenge-shaped dot pattern
- FIG. 9 shows a screen computer for generating dots of any shape by incorporating a special look-up table
- FIGS. 10 and 11 show screen computers for generating an index signal
- FIGS. 12 to 15 show dot border computer parts of screen computer systems for generating half-tone dot patterns with any dot shape and dot density profile, by generating a multiple level signal to operate a "multi-level" recording beam;
- FIG. 16 is a diagram showing how six scanning beams interact to produce a "soft dot" profile
- FIG. 17A shows the variation of the scanning beam intensity with distance from the required dot border
- FIG. 17B shows six scanning beams in overlapping relationship
- FIG. 18 is a schematic diagram of one example of a position computer
- FIG. 19A illustrates a position computer in combination with a dot border computer
- FIG. 19B shows a word of data used to represent a position signal
- FIG. 20 is a diagram of another form of position computer
- FIG. 21 shows a position computer which is about twice as fast and as big as that of FIG. 10;
- FIG. 22 shows another example of a position computer
- FIG. 23 shows the position computer and the slower "transverse" MPU which initialises the position computer
- FIG. 24 shows the output section of the system of FIG. 1, embodying the present invention
- FIG. 25 is a sketch of a screen grid for producing photogravure separations.
- FIGS. 26 to 28 show systems for generating gravure separations.
- Apparatus for producing half-tone colour separations from an original image generally comprises at least two rotating coaxial drums as shown in FIG. 1.
- An original 22 is wrapped round one drum 10 and output surfaces 28, 30, 32, 34 which are to be exposed are wrapped round another drum or drums, the drums being in this case driven by a common motor 35.
- the output surfaces for the different colour separations may occupy successive sections (e.g. 28, 30) of the perimeter of one output drum, they may be relatively displaced (as at 30, 32) along the axis of the drum, or they may be arranged on different drums.
- the original image is scanned by an opto-electronic scanning head 24 by rotating its drum 10 past the head 24 and imparting in addition a slow longitudinal movement to the head so that the scanning path on the surface of the cylindrical drum is helical.
- Signals from the scanning head then pass through a colour corrector (signal processing unit) 1, if necessary, in which a fourth signal, black, is also usually generated, and emerge as the "picture signals" Y, M, C, B for that particular colour.
- the output surfaces which are sensitive to light from an exposing head 26 adjacent to the other drums, are scanned by the exposing head in a similar manner, and are exposed progressively to a half-tone pattern made from dots of a size depending on the colour tonal density of the original.
- FIG. 2 Examples of half-tone patterns are shown in FIG. 2, in which the tonal density increases from left to right.
- the signals 4, 5 controlling the modulation of light from a source 27 are obtained from a screen computer 2 fed with the colour component signals Y, M, C and B.
- a frequency division and multiplication unit 3, receiving pulses related to the rotation of the drums, controls the slow longitudinal movement of the heads 24 and 26 and the operation of the screen computer 2.
- Each screen computer is responsive to the picture signal and to timing signals from the rotating drums, and is programmed with any desired screen angle and screen line spacing.
- the dots shown in FIG. 3 by way of example are square dots “tilted” at 45° to the grid, the shaded areas being bounded by the dot borders (DB).
- the pattern of dots shown may be created on the output surface by controlling the scanning beam by an "on/off" signal in accordance with whether the scanning beam lies over a dot ("on") or a space ("off") in the overlying screen grid. At each point marked x, the value of this signal is indicated by "1" or "0". The signal is obtained subsequently for all similar points along the helical path SB of the scan which overlie the output surface.
- screen grid is an artificial device to aid the description of the working of the computer. No real dot screen exists, as in some earlier patents.
- one dot area is shown in dotted lines.
- the diagram has been rotated through the screen angle ⁇ relative to the diagram of FIG. 3.
- a dot bounded by the border DB2 is 50% the maximum dot size.
- a small dot might have a border DB1, but from now on an intermediate dot size will be assumed, the dot having a border DB.
- PS picture signal
- the position x of the "write" scanning beam relative to a dot area (DA) and a dot border (DB) is described by two position signals.
- the next point x of the scanning beam relative to the screen grid is computed by adding increments ⁇ X and ⁇ Y to the previous position signals X and Y.
- ⁇ X and ⁇ Y are determined by the screen angle ⁇ and by the desired line spacing.
- the degree of magnification of the final image can be controlled by the size of the increment.
- ⁇ X and ⁇ Y are added many times during the traversal of one dot area.
- the values of the increments determine the screen angle, and may be changed at the beginning of each new vertical scanning line, i.e. at the edge of the separation.
- Moire fringes can be avided by choosing the memory to be of such a size that the width of the dot areas is suited exactly to the number of scanning beams.
- the width of a dot area is not necessarily a power of 2, as in UK Patent Application No. 2026283, but is usually chosen to be a multiple of the number of beams and depends on the gaps between the beams.
- a position computer 40 generates position signals H1 and H2 representing distances along orthogonal axes at 45° to X, Y, as mentioned above, at each point x. These signals are then each compared with the picture signal PS in a comparator unit, in order to determine whether the control signal 50 should be "on” or "off". If the point x lies within the dot border DB, then both H1 and H2 should be less than PS, and an "on” signal is generated. Otherwise an "off” signal is generated. Suitable position computers are described hereinafter with reference to FIGS. 18 to 22 of the accompanying drawings.
- H1 and H2 cannot represent points outside a dot area, the dot area being the smallest repeatable unit of the dot pattern. Therefore it is necessary for the position computer to detect the crossing of the border by the scanning beam, and to adjust H1 and H2 so that they then represent the arrival of the beam at the opposite edge of the dot area. This is shown also in FIG. 4.
- FIG. 6 shows an alternative system for generating square dots aligned with the screen grid.
- a repeated dot area contains one dot and quarters of four adjacent dots, as shown in FIG. 7.
- Coordinates (X,Y) are taken in line with the dot walls as in FIG. 4.
- the position computer functions exactly as above, except that it generates the (X,Y) and not the 45° (H1, H2) position signals.
- the position computer may be of a type described with reference to FIGS. 18 to 22 of this specification.
- the comparator requires the difference between PS and half the width of the dot area which is given as a complementary picture signal PS.
- a control signal 50 is generated which is "on" whenever the central dot or the corner quarter-dots are scanned, i.e. when X and Y are both less than PS, or both greater than PS.
- PS is obtained from a look-up table (LUT) 61, i.e. read-only memory.
- LUT look-up table
- One suitable such device for example, would be a PROM type TBP28L 22 made by Texas Instruments. PS and PS are then multiplexed in multiplexer 62 and fed to the computer in accordance with the logic state of a signal 63.
- the screen computer of FIG. 5, for example, can be modified to produce dots that are elongated in one or more directions, e.g. to produce diamond-shaped dots instead of square ones.
- FIG. 8 shows such a modified computer, where each of the position signals (X or Y in this example) is adjusted in a position conversion unit 81 or 82 before it enters a comparator unit 83 or 84.
- the unit is preferably an LUT, but may alternatively be logic.
- the position computer may be generally of one of the types described with reference to FIGS. 18 to 22.
- the LUT may again be of the type TBP28L 22 made by Texas Instruments.
- FIG. 9 extends the concept of the screen computer of FIG. 8, to generate not just square or elongate dots, but dots of any shape. This is achieved by a single conversion unit 110.
- the signal output I from the conversion unit or index signal generation unit 110 is referred to as an index signal.
- the index signal is compared with the picture signal PS in a comparator 111.
- the index signal generation unit 110 may consist of logic circuitry, but is preferably an LUT.
- the LUT may, for example, comprise two RAM units of the type HM6116 made by Hitachi, which would give an LUT capacity of 2 12 ⁇ 8.
- the contents of the table depend upon the dot shape. It is the content of the LUT which determines the shape of the dot, and the magnitude of the PS which determines its size.
- the position signals preferably represent lengths measured from the centre of the half-tone dot area along orthogonal axes, but the invention is not limited to this coordinate system.
- the shape of the dot to be generated has a degree of symmetry, it will be appreciated that much of the data in the position conversion LUT is redundant. For example, if each quarter of the dot is the same shape, then an LUT of one quarter of the size only will be needed, together with some means for identifying which orientation to give each quarter of the dot.
- the screen computer of FIG. 9 may be used to generate dots with symmetry in two orthogonal directions, i.e. with four similar quarters.
- LUT 110 there would be another conversion unit, which may comprise an LUT or logic. This unit effectively changes the position coordinates according to the quadrant of the dot area that they represent, so that the changed position signals will index the LUT 110 according to the correct orientation of the quarter-dot pattern. The two units may be combined.
- Symmetrical dots join together at four points simultaneously, on gradually increasing the tonal density. This joining of each dot with its four neighbouring dots is very significant, as it causes a sudden large increase in the apparent density of the half-tone image. It is preferable to choose a dot shape so that the vertices of each dot join neighbouring dots at different tonal densities, so as to make the apparent changes in density smoother.
- the special dots which join at four vertices at different densities are referred to as four-breakpoint dots. It is convenient to have non-symmetrical dots and to have alternate dots in the rows rotated through 180°; if A represents the dot one way up, and B represents the same dot rotated through 180°, then the dot sequence would be ABAB . . . in both rows and columns. The smallest repeatable square unit is then an element containing four dot areas. However, it is only necessary to store data for one dot (A or B) in an index signal generation unit.
- FIG. 10 shows one example of a screen computer for generating four break-point chain dots. It differs from FIG. 9 in the provision of intermediate LUT's (or logic) 121, 122 which process the position signals, X, Y respectively, before the position signals are combined in an index signal generation unit 123 to derive an index signal I.
- LUT's of the type TBP28L 22 made by Texas Instruments would be suitable.
- the index signal I is compared with the picture signal PS in a comparator 127, the result of the comparison determining the control signal 50.
- the most significant bits (MSB) 124, 125 of the position signals (X, Y) or (H1, H2) indicate which dot area is being scanned. i.e. whether it should contain an A or B type dot. This condition is detected by an MSB area detect LUT 126 (or by equivalent logic), and signal conversion LUT's 121, 122 (or logic) correct the position signals according to this condition so that they will correctly index the signal generation LUT 123.
- FIG. 11 shows an an alternative computer to that of FIG. 10 wherein the signal conversion LUT's 121, 122 and signal generation unit 123 are combined into a single unit 130.
- the screen computing system according to the invention lends itself readily to multiple beam control; with multiple beams however, there is the difficulty of taking into account the fact that adjacent beams will sometimes be in adjacent dot areas.
- An example of five parallel "on/off" beams is given in British Pat. No. 1,386,651.
- microprocessor may be a type 6809.
- the position signals at a time n are produced by a position CPU 40, which is initialized by a slow MPU 240.
- Suitable position computers are shown in FIGS. 18 to 22.
- the position CPU is initialized with positions (X o , Y o ).
- the slow MPU generates (X o , Y o ) using the same algorithm as the fast CPU but with different values for the increments ( ⁇ X, ⁇ Y).
- the initializing MPU is known as the "transverse" CPU while the position computer is the "line” or fast CPU. This initialization is indicated as the signal 215 input on FIGS. 20 to 22, which show examples of the fast position CPU.
- FIG. 18 A first example of the position computer or CPU is shown in FIG. 18.
- the position signal X is continually recycled through a summing unit 262 and a latch 260, one cycle for each new position of the scanning point x in the screen grid. Once in each cycle, the position increment ⁇ X is added in summing unit 262 to the position signal X.
- X and ⁇ X, Y and ⁇ Y, are 16 bit signals.
- the corresponding position signal Y is recirculated in summing unit 263 and latch 261 in a similar manner.
- An index signal generation unit 110 provides an index signal I from position signals X and Y.
- the index signal I is then compared with the picture signal PS in a comparator 156 to produce an output signal which is "on" if the picture signal exceeds the value of the index signal, for example.
- the system of FIG. 18 is an example of the simplified system shown in FIG. 9.
- the index signal is represented by 8 bits, and the picture signal is also represented by 8 bits.
- the complete computing system for a single beam is shown in FIG. 19A.
- the increments ⁇ X and ⁇ Y are added to position signals X and Y respectively using the same summing unit 209.
- the increments ⁇ X and ⁇ Y together with special increments ⁇ Xb and ⁇ Yb to be described below, are stored in a random access memory unit 210 controlled by a 2 bit address signal 221 for selecting X or Y.
- the 16 bit increment signals emerging from the RAM 210 are alternately ⁇ X and ⁇ Y, the signals being clocked into the summing unit 209 at twice the frequency of the scanning beam reaching successive scanning points x, so that each position signal (X or Y) receives one increment ( ⁇ X or ⁇ Y) for each scanning point.
- the position signals X and Y are stored as 16 bit numbers in the A register 208 and the B register 207.
- the result is stored in register A, while the position signal Y is transferred from register A to register B.
- the signal Y stored in register B is then combined with the increment ⁇ Y, the result being stored in register A, while the new position of signal X is transferred to register B.
- the most significant 6 bits of the new position signals are then read out from the registers A and B (208 and 207) into the index signal generation unit 110 which produces a signal I.
- the further units for processing the index signal I and picture signal PS, units 156, 153 and 154 produce an output signal 155 in a manner to be described below with reference to FIG. 13.
- the memory 210 selects the special increments instead of the normal increments for the purposes of the next two additions by the summing unit 209.
- the values of the increments applied to the position signals determine the effective screen angle and the screen ruling, i.e. the spacing between successive rows of dots
- the overall screen angle and screen ruling can be determined with a much greater precision by making fine adjustment to the increments at each successive dot border.
- the condition that the half-tone dot area border is approached by the scanning beam is detected by comparing each position signal value with half the length of a dot area side, equality of these two quantities signifiying that the beam is actually on the half-tone dot area border.
- the border value signal 214 may have to be adjusted so that the computer will anticipate the arrival of the beam at the border, to compensate for any delay introduced in the operation of the memory 210, the comparator 205 then providing a positive signal to the memory 210 just before the arrival of the beam at the border.
- the special values of the increments ⁇ Xb and ⁇ Yb are preferably chosen so that the position signals are adjusted at the border to represent the arrival of the scanning beam at the opposite side of the same half-tone dot area (or the same elemental area), causing the scanning beam effectively to scan only one such area.
- FIG. 19B shows the data format for the position signals X and Y, which consist of a 6-bit address for addressing the generation unit 110, together with a 10-bit fractional part.
- FIG. 20 shows an alterative form of the position computer 40.
- the summing unit 209 corresponds to the summing unit of FIG. 16A, as do the registers A and B, 208 and 207. Successive output signals Xn and Yn are stored in an output register 211.
- a register C, 210 corresponds to the RAM memory 210 of FIG. 19A, which is initialized by a microprocessor unit (not shown) which may be a type 6809 and which supplies signals 215 representing values of the increments ⁇ X, ⁇ Y, ⁇ Xb, ⁇ Yb.
- the unit C (210) is accessed under the control of logic or a sequencing unit 206, which controls which of the four increments is chosen.
- the choice of the increment is determined in accordance with the result of a comparison of the current position signal values with a border value in a comparator 205.
- the border value may be provided by a register M, 204, initialised at the start of each vertical scan by a microprocessor supplying a MPU signal 214.
- there is an optional border compare register 203 which selects either an X border value in a register 201, or a Y border value in a register 202, each register 201, 202 being initialised at the start of each vertical scan by signals 212, 213 from the MPU. This alternative to the use of the register M, indicated in dotted lines in FIG.
- a switch in the unit 203 compensates for the sign of the position signal and is switched according to the clocking of Xn or Yn.
- FIG. 21 shows a position computer identical to that of FIG. 20, but split into 2 parallel computers, responsible for Xn and Yn respectively.
- the overall computer is therefore about twice as large and twice as fast.
- the component parts are labelled with the same numerals, appropriately primed.
- Signals are also taken from the logic or sequencing umit 206' and 206", and combined in a gate 218.
- the resulting signal 220 is used as an area counter. This feature is optional, and may be used in subsequent parts of the system to identify which dot area is currently being scanned, where for example there is a repeated pattern of four dot areas with differently-oriented dots in each area.
- the area counter signal 220 might for example be used to alter the polarity of the position signals X and/or Y or the index signal I to provide a dot of the particular orientation or shape which is correct for the currently-scanned dot area.
- FIG. 22 shows a similar position computer, incorporating registers A and B, 221 and 222, a summing unit 209, an output register 211, a comparator 205, a sequencing unit 206 and a border value register 204.
- the position increments ⁇ X, ⁇ Y, ⁇ Xb and ⁇ Yb are fed into the system by means of the signal 215 from a microprocessor unit, instead of being stored in a RAM memory 210.
- the units are clocked so that register A, 221, is responsible for handling Xn or Yn, and register B, 222, is responsible for handling ⁇ X or ⁇ Y.
- either a logic unit or a sequencer unit 210 may be used.
- the former is less flexible, but is preferable to the latter because is introduces no delay.
- the delay has to be compensated for by making the dot area border anticipate the crossing of the border, for example by the amount of time for one horizontal line scan.
- a recording head may emit light of variable intensity, or it may contain several adjacent exposing elements each of which may be on or off, the overall exposure being multi-levelled.
- FIG. 12 shows a dot border computer which is part of a screen computer, as described in this specification.
- the position signals H1 and H2, or X and Y, are subtracted from the picture signal PS, in units 151, 152, instead of simply being compared. This subtraction yields signals which depend on the distance of the scanning point x from the dot border.
- the dot border as defined by the picture signal, is taken to mean a contour of intermediate density in a dot.
- the dot density might vary from a high value in the centre, through intermediate values close to the dot border, to zero near the corners of the dot area square.)
- the subtracted signals are used to index a dot shape LUT 153 (or are applied to equivalent logic circuitry). This is distinct from the index signal generation unit 110 described above with regard to FIG. 9, because it is effective after the position signals have combined with the picture signal.
- a digital-to-analogue converter 154 converts the multi-level output from the LUT into an analogue control signal 155 for the multi-level recording head. This system, as shown in FIG. 12, is provided with each "write" scanning beam.
- the dot shape or dot profile LUT 153 determines the variation of density of the dot with distance from the dot border. It may be accessed using two signals, one representing the distance in the X direction of the scanning point from the dot border as determined by the value of the picture signal, and one representing the corresponding distance in the Y direction.
- FIG. 13 An alternative is shown in FIG. 13, where the screen computer includes an index signal generation unit (not shown), such as is shown in FIG. 9, for generating a position index signal I. This is subtracted from PS in summing unit 156, and the result may, in the simplest case, be used as the control signal 155 after conversion to analogue form.
- a dot profile LUT 153 (or logic).
- LUT 153 may, for example, comprise a 256 ⁇ 8 look-up table composed of two bipolar RAM's of the type 93 L422 made by Fairchild Camera and Instrument Corporation.
- a comparator 157 may be included to reduce the size of the LUT 153.
- the output has levelled off to a constant density value, either high (dot centre) or low (between dots).
- the dot profile LUT need only store a substantial amount of data for positions near the dot border, where the density changes.
- the comparator compares the most significant bits of the adder 156 output with a constant value, to determine the proximity to the dot border and thus to determine whether to index the dot profile LUT for a high/low value or for a variable value near the dot border.
- FIG. 14 A further alternative to the screen computer of FIG. 13 is outlined in FIG. 14, where the comparator 160 lies parallel to the adder unit.
- the adder unit may even be dispensed with altogether, its function being taken over by the dot shape LUT 153 as shown in FIG. 15.
- the intensity profile, provided by six parallel beams, over the edge of a "soft" dot, is illustrated schematically in FIG. 16.
- the individual intensity profile of each beam is triangular in shape, rising to a sharp peak at the centre; this shape is produced in practice by a laser optical system, as is known in the art.
- the beams are arranged across the output surface with an equal spacing in the horizontal direction, so that their intensity profiles overlap, as shown in FIG. 17B.
- FIG. 17B all the beams are modulated to the same level of intensity, but in practice they will be different, as shown in FIG. 16, in regions where the required density is varying, such as over a dot border.
- the index signal I for a given scanning beam may be, for example, the difference between the picture signal PS and a position signal PV, shown as PS-PV in FIG. 17A in which the horizontal axis represents PS-PV in volts.
- PS-PV position signal
- the intensity of the scanning beam is below the film threshold value; in regions inside the dot border, it is above the threshold value.
- the level In the darkest region, e.g. at the centre of a dot, the level preferably exceeds 200% of the film threshold value, and may even reach 300%.
- the variation of the beam intensity is preferably a linear function of the distance of the beam from the dot border, varying between a zero value and a maximum value.
- the vertical axis represents beam intensity
- the horizontal axis PS-PV as in FIG. 17A.
- the dot border 760 is shown at the bottom of the figure.
- a first scanning beam 701 is controlled by a first position computer and dot border computer, such as that shown in FIG. 19A.
- the intensity function 801 requires that for such a large negative value of PS-PV the intensity should be at the maximum value, 901.
- the resulting contribution made by beam 701 to the overall intensity 770 is shown in dotted lines.
- a second beam 702 gives an intermediate level of intensity 902, as determined by the intersection of curve 802 with the vertical axis.
- the remaining four beams, 703 to 706, provide levels of intensity 903 to 906 in accordance with the curves 804 to 806, respectively.
- the slope of the intensity curve 770 defining the profile of the dot is arranged to be sufficiently steep at the point 750 that the film threshold level is exceeded, that the dot border is well defined and does not vary substantially with small regional variations in the film threshold value.
- the slope of the curve 750 should not be so steep that the dot so produced is not etchable, i.e. does not change its size gradually with the application of a chemical etching agent on the resulting film.
- FIG. 24 shows parts of the apparatus of FIG. 1, together with two screen computers of the type shown in FIG. 5.
- the four output surfaces 28, 30, 32 and 34 are for the recording of yellow, cyan, magenta and black colour separations respectively.
- the yellow and cyan surfaces are wrapped around the same section of drum, so the exposing head adjacent to that section scans both surfaces in one revolution of the drum. The same is true of the magenta and black surfaces, their section of the drum being displaced longitudinally.
- the exposing heads are contained in an assembly 26 which is movable longitudinally.
- one position computer 2 is used to control each of the two recording heads
- FIG. 24 shows the computers generating two on/off control signals 4, 5, labelled "c, y" and "m, b".
- a frequency division and multiplication unit 3 is used to clock the position computer 2.
- the heads are scanning y and b colour separations, as shown in the figure, the corresponding y and b picture signals (PS) must be selected from the reading scanner (not shown in FIG. 24, but labelled 24 in FIG. 1).
- Each colour separation usually requires a different screen angle ⁇ , so the appropriate data e.g. ( ⁇ X, ⁇ Y) must simultaneously be selected in a " ⁇ select" unit.
- Position signals X, Y for each colour are produced, as described above in conjunction with FIG. 6.
- This screen computer generates square dot patterns, but computers using any of the methods and apparatus described above may incorporated in the apparatus of FIGS. 1 and 24.
- any number of parallel beams may be controlled by the same position computer, or by parallel position computers.
- the recording heads may be of the multiple level type, and multi-level control signals may be generated by the screen computers.
- FIGS. 26 to 28 show the possibility of generating gravure separations using a screen computer embodying the invention.
- the gravure screen usually has a fixed dot pattern, as sketched for example in FIG. 25.
- the output signal from the screen computer is required to assume a value equal to the picture signal PS within the square dot, and zero in the intervening spaces representing the gravure cell walls on the final printing surface.
- the output 146 is switched between Ov and the picture signal (PS) according to whether the scanning beam lies within dots whose size is defined by a value V (FIG. 25) and is stored in a register 140 initialised by a signal 141.
- V has a fixed value which means the cell walls have a predetermined thickness.
- V may be equal to PS, producing variable cell wall thicknesses.
- the tonal density of the dot i.e. the depth of the photogravure cell, is also proportional to the picture signal (PS), and this generally varies over the separation and even over a single cell.
- the invention is thus adaptable to the generation of so-called "hard dot" gravure separations, in which both the square dot size (of the general form of FIG. 25) and the output level (or tonal density) within the dot vary with the picture signal, or with some function of the picture signal derived from optional calibration LUT 148.
- the picture signal is fed into a register 140 via the optional calibration unit in order to supply the value V as a variable.
- FIG. 28 shows an improved version in that the cell walls can be calibrated against the picture signal PS.
Abstract
Description
Claims (24)
Applications Claiming Priority (2)
| Application Number | Priority Date | Filing Date | Title |
|---|---|---|---|
| GB8028176 | 1980-09-01 | ||
| GB8028176 | 1980-09-01 |
Publications (1)
| Publication Number | Publication Date |
|---|---|
| US4419690A true US4419690A (en) | 1983-12-06 |
Family
ID=10515767
Family Applications (1)
| Application Number | Title | Priority Date | Filing Date |
|---|---|---|---|
| US06/296,670 Expired - Lifetime US4419690A (en) | 1980-09-01 | 1981-08-27 | Method and apparatus for producing a half-tone reproduction |
Country Status (4)
| Country | Link |
|---|---|
| US (1) | US4419690A (en) |
| EP (1) | EP0047145B1 (en) |
| JP (1) | JPS5787279A (en) |
| DE (1) | DE3176685D1 (en) |
Cited By (28)
| Publication number | Priority date | Publication date | Assignee | Title |
|---|---|---|---|---|
| US4533941A (en) * | 1983-01-14 | 1985-08-06 | Coulter Systems Corporation | Method and apparatus for half-tone reproduction of a varying tone original image |
| US4626901A (en) * | 1982-10-27 | 1986-12-02 | Canon Kabushiki Kaisha | Image processing apparatus using multiple dither matrices |
| US4651287A (en) * | 1984-06-14 | 1987-03-17 | Tsao Sherman H | Digital image processing algorithm for output devices with discrete halftone gray scale capability |
| US4758886A (en) * | 1986-07-24 | 1988-07-19 | Minnesota Mining And Manufacturing Company | Optimal color half-tone patterns for raster-scan images |
| US4864326A (en) * | 1985-03-18 | 1989-09-05 | Canon Kabushiki Kaisha | Dual beam recorder |
| US4887225A (en) * | 1985-05-24 | 1989-12-12 | Danippon Screen Mfg. Co., Ltd. | Method and device for controlling exposure beams |
| US4916545A (en) * | 1988-11-16 | 1990-04-10 | Eastman Kodak Company | Electronic graphic arts screener that suppresses Moire patterns using pseudo-random font selection |
| US4918622A (en) * | 1988-11-16 | 1990-04-17 | Eastman Kodak Company | Electronic graphic arts screener |
| US4977458A (en) * | 1988-11-16 | 1990-12-11 | Eastman Kodak Company | Apparatus for addressing a font to suppress Moire patterns occurring thereby and a method for use therein |
| US4985779A (en) * | 1989-09-19 | 1991-01-15 | Intergraph Corporation | Improved method and apparatus for generating halftone images |
| US5187594A (en) * | 1990-02-09 | 1993-02-16 | Graphic Edge, Inc. | Method of creating and applying half tone screen patterns |
| US5227895A (en) * | 1990-08-03 | 1993-07-13 | Scitex Corporation Ltd. | Method and apparatus for image reproduction |
| US5253084A (en) * | 1990-09-14 | 1993-10-12 | Minnesota Mining And Manufacturing Company | General kernel function for electronic halftone generation |
| US5258832A (en) * | 1990-09-14 | 1993-11-02 | Minnesota Mining And Manufacturing Company | Non-perpendicular, unequal frequency non-conventional screen patterns for electronic halftone generation |
| US5264926A (en) * | 1990-09-14 | 1993-11-23 | Minnesota Mining And Manufacturing Company | Perpendicular, equal frequency non-conventional screen patterns for electronic halftone generation |
| EP0571010A1 (en) | 1992-05-22 | 1993-11-24 | Agfa-Gevaert N.V. | An improved frequency modulation halftoning method |
| US5274473A (en) * | 1989-08-04 | 1993-12-28 | Intergraph Corporation | Rapid variable angle digital screening |
| US5303342A (en) * | 1990-07-13 | 1994-04-12 | Minnesota Mining And Manufacturing Company | Method and apparatus for assembling a composite image from a plurality of data types |
| US5323245A (en) * | 1990-09-14 | 1994-06-21 | Minnesota Mining And Manufacturing Company | Perpendicular, unequal frequency non-conventional screen patterns for electronic halftone generation |
| EP0691784A2 (en) | 1994-07-06 | 1996-01-10 | Agfa-Gevaert N.V. | Lossy and lossless compression in raster image processor |
| US5546197A (en) * | 1993-03-26 | 1996-08-13 | Dainippon Screen Mfg. Co., Ltd. | Method and apparatus for generating halftone images with adjusted screen angles |
| US5553161A (en) * | 1993-06-29 | 1996-09-03 | Schablonentechnik Kufstein Aktiengesellschaft | Copy reproduction apparatus for screen printing with color correction |
| US5583660A (en) * | 1990-09-14 | 1996-12-10 | Minnesota Mining And Manufacturing Company | Non-perpendicular, equal frequency non-conventional screen patterns for electronic halftone generation |
| US5666444A (en) * | 1982-04-06 | 1997-09-09 | Canon Kabushiki Kaisha | Image processing apparatus |
| EP0840496A2 (en) * | 1996-11-01 | 1998-05-06 | Xerox Corporation | Method and apparatus for halftoning image data |
| EP0929186A2 (en) * | 1998-01-12 | 1999-07-14 | Scitex Corporation Ltd. | Method and apparatus for generating a screened reproduction of an image |
| US6072590A (en) * | 1996-05-27 | 2000-06-06 | Dainippon Screen Mfg. Co., Ltd. | Method and apparatus for forming halftone dots |
| US20060175824A1 (en) * | 2003-02-13 | 2006-08-10 | Fausto Giori | Method for printing a security element and security element |
Families Citing this family (10)
| Publication number | Priority date | Publication date | Assignee | Title |
|---|---|---|---|---|
| JPS57120937A (en) * | 1981-01-21 | 1982-07-28 | Dainippon Screen Mfg Co Ltd | Formation of halftone plate image |
| JPS5978353A (en) * | 1982-10-28 | 1984-05-07 | Dainippon Screen Mfg Co Ltd | Dot forming method of mesh plate picture recording device |
| GB8613223D0 (en) * | 1986-05-30 | 1986-07-02 | Crosfield Electronics Ltd | Half-tone reproduction |
| JP2525794B2 (en) * | 1987-02-27 | 1996-08-21 | 大日本スクリ−ン製造株式会社 | Halftone image recorder |
| GB8811568D0 (en) * | 1988-05-16 | 1988-06-22 | Crosfield Electronics Ltd | Producing half-tone images |
| US5016191A (en) * | 1988-09-02 | 1991-05-14 | Tektronix, Inc. | Half toning pixel processor |
| US5150225A (en) * | 1990-05-18 | 1992-09-22 | Scitex Corporation Ltd. | Apparatus for generating a screened reproduction of an image |
| US5140431A (en) * | 1990-12-31 | 1992-08-18 | E. I. Du Pont De Nemours And Company | Digital electronic system for halftone printing |
| US5285291A (en) * | 1991-02-08 | 1994-02-08 | Adobe Systems Incorporated | Methods of assigning pixels to cells of a halftone grid |
| GB9122154D0 (en) * | 1991-10-18 | 1991-11-27 | Crosfield Electronics Ltd | Improvements relating to image screening |
Citations (4)
| Publication number | Priority date | Publication date | Assignee | Title |
|---|---|---|---|---|
| US4084183A (en) * | 1970-03-18 | 1978-04-11 | Dr. Ing. Rudolf Hell Gmbh. | Method for the electro-optical reproduction of half-tone pictures |
| US4293873A (en) * | 1978-10-04 | 1981-10-06 | Stork Brabant B.V. | Method and a device for producing separation images having the effect of being orthogonally screened |
| US4302770A (en) * | 1980-04-30 | 1981-11-24 | United Technologies Corporation | Color raster scanner for recording cartographic data |
| US4319268A (en) * | 1979-07-02 | 1982-03-09 | Dainippon Screen Seizo Kabushiki Kaisha | Reproduction picture sharpness emphasizing method |
Family Cites Families (5)
| Publication number | Priority date | Publication date | Assignee | Title |
|---|---|---|---|---|
| GB1204542A (en) * | 1967-02-20 | 1970-09-09 | Rca Corp | Improved printing process |
| DE2311678C3 (en) * | 1973-03-09 | 1985-05-09 | Dainippon Screen Seizo K.K., Kyoto | Device for creating color separations from a colored original image |
| GB1482522A (en) * | 1973-10-02 | 1977-08-10 | Crosfield Electronics Ltd | Exposing scanners for image reproduction |
| GB1492740A (en) * | 1973-12-17 | 1977-11-23 | Crosfield Electronics Ltd | Preparation of half-tone images |
| DE2827596C2 (en) * | 1978-06-23 | 1984-11-22 | Dr.-Ing. Rudolf Hell Gmbh, 2300 Kiel | Method and arrangement for the production of screened printing forms |
-
1981
- 1981-08-27 DE DE8181303937T patent/DE3176685D1/en not_active Expired
- 1981-08-27 EP EP81303937A patent/EP0047145B1/en not_active Expired
- 1981-08-27 US US06/296,670 patent/US4419690A/en not_active Expired - Lifetime
- 1981-09-01 JP JP56136220A patent/JPS5787279A/en active Granted
Patent Citations (4)
| Publication number | Priority date | Publication date | Assignee | Title |
|---|---|---|---|---|
| US4084183A (en) * | 1970-03-18 | 1978-04-11 | Dr. Ing. Rudolf Hell Gmbh. | Method for the electro-optical reproduction of half-tone pictures |
| US4293873A (en) * | 1978-10-04 | 1981-10-06 | Stork Brabant B.V. | Method and a device for producing separation images having the effect of being orthogonally screened |
| US4319268A (en) * | 1979-07-02 | 1982-03-09 | Dainippon Screen Seizo Kabushiki Kaisha | Reproduction picture sharpness emphasizing method |
| US4302770A (en) * | 1980-04-30 | 1981-11-24 | United Technologies Corporation | Color raster scanner for recording cartographic data |
Cited By (32)
| Publication number | Priority date | Publication date | Assignee | Title |
|---|---|---|---|---|
| US5666444A (en) * | 1982-04-06 | 1997-09-09 | Canon Kabushiki Kaisha | Image processing apparatus |
| US4626901A (en) * | 1982-10-27 | 1986-12-02 | Canon Kabushiki Kaisha | Image processing apparatus using multiple dither matrices |
| US4533941A (en) * | 1983-01-14 | 1985-08-06 | Coulter Systems Corporation | Method and apparatus for half-tone reproduction of a varying tone original image |
| US4651287A (en) * | 1984-06-14 | 1987-03-17 | Tsao Sherman H | Digital image processing algorithm for output devices with discrete halftone gray scale capability |
| US4864326A (en) * | 1985-03-18 | 1989-09-05 | Canon Kabushiki Kaisha | Dual beam recorder |
| US4887225A (en) * | 1985-05-24 | 1989-12-12 | Danippon Screen Mfg. Co., Ltd. | Method and device for controlling exposure beams |
| US4758886A (en) * | 1986-07-24 | 1988-07-19 | Minnesota Mining And Manufacturing Company | Optimal color half-tone patterns for raster-scan images |
| US4916545A (en) * | 1988-11-16 | 1990-04-10 | Eastman Kodak Company | Electronic graphic arts screener that suppresses Moire patterns using pseudo-random font selection |
| US4918622A (en) * | 1988-11-16 | 1990-04-17 | Eastman Kodak Company | Electronic graphic arts screener |
| US4977458A (en) * | 1988-11-16 | 1990-12-11 | Eastman Kodak Company | Apparatus for addressing a font to suppress Moire patterns occurring thereby and a method for use therein |
| US5274473A (en) * | 1989-08-04 | 1993-12-28 | Intergraph Corporation | Rapid variable angle digital screening |
| US4985779A (en) * | 1989-09-19 | 1991-01-15 | Intergraph Corporation | Improved method and apparatus for generating halftone images |
| US5187594A (en) * | 1990-02-09 | 1993-02-16 | Graphic Edge, Inc. | Method of creating and applying half tone screen patterns |
| US5303342A (en) * | 1990-07-13 | 1994-04-12 | Minnesota Mining And Manufacturing Company | Method and apparatus for assembling a composite image from a plurality of data types |
| US5227895A (en) * | 1990-08-03 | 1993-07-13 | Scitex Corporation Ltd. | Method and apparatus for image reproduction |
| US5253084A (en) * | 1990-09-14 | 1993-10-12 | Minnesota Mining And Manufacturing Company | General kernel function for electronic halftone generation |
| US5258832A (en) * | 1990-09-14 | 1993-11-02 | Minnesota Mining And Manufacturing Company | Non-perpendicular, unequal frequency non-conventional screen patterns for electronic halftone generation |
| US5264926A (en) * | 1990-09-14 | 1993-11-23 | Minnesota Mining And Manufacturing Company | Perpendicular, equal frequency non-conventional screen patterns for electronic halftone generation |
| US5323245A (en) * | 1990-09-14 | 1994-06-21 | Minnesota Mining And Manufacturing Company | Perpendicular, unequal frequency non-conventional screen patterns for electronic halftone generation |
| US5583660A (en) * | 1990-09-14 | 1996-12-10 | Minnesota Mining And Manufacturing Company | Non-perpendicular, equal frequency non-conventional screen patterns for electronic halftone generation |
| EP0571010A1 (en) | 1992-05-22 | 1993-11-24 | Agfa-Gevaert N.V. | An improved frequency modulation halftoning method |
| US5778091A (en) * | 1993-03-26 | 1998-07-07 | Dainippon Screen Mfg. Co., Ltd | Method and apparatus for generating halftone images with adjusted screen angles |
| US5546197A (en) * | 1993-03-26 | 1996-08-13 | Dainippon Screen Mfg. Co., Ltd. | Method and apparatus for generating halftone images with adjusted screen angles |
| US5553161A (en) * | 1993-06-29 | 1996-09-03 | Schablonentechnik Kufstein Aktiengesellschaft | Copy reproduction apparatus for screen printing with color correction |
| EP0691784A2 (en) | 1994-07-06 | 1996-01-10 | Agfa-Gevaert N.V. | Lossy and lossless compression in raster image processor |
| US6072590A (en) * | 1996-05-27 | 2000-06-06 | Dainippon Screen Mfg. Co., Ltd. | Method and apparatus for forming halftone dots |
| EP0840496A2 (en) * | 1996-11-01 | 1998-05-06 | Xerox Corporation | Method and apparatus for halftoning image data |
| EP0840496A3 (en) * | 1996-11-01 | 2003-09-03 | Xerox Corporation | Method and apparatus for halftoning image data |
| EP0929186A2 (en) * | 1998-01-12 | 1999-07-14 | Scitex Corporation Ltd. | Method and apparatus for generating a screened reproduction of an image |
| EP0929186A3 (en) * | 1998-01-12 | 2001-07-11 | CreoScitex Corporation Ltd. | Method and apparatus for generating a screened reproduction of an image |
| US6456396B1 (en) | 1998-01-12 | 2002-09-24 | Creoscitex Corporation Ltd. | Method and apparatus for generating a screened reproduction of an image |
| US20060175824A1 (en) * | 2003-02-13 | 2006-08-10 | Fausto Giori | Method for printing a security element and security element |
Also Published As
| Publication number | Publication date |
|---|---|
| EP0047145A3 (en) | 1984-12-19 |
| DE3176685D1 (en) | 1988-04-21 |
| JPH0249590B2 (en) | 1990-10-30 |
| EP0047145A2 (en) | 1982-03-10 |
| EP0047145B1 (en) | 1988-03-16 |
| JPS5787279A (en) | 1982-05-31 |
Similar Documents
| Publication | Publication Date | Title |
|---|---|---|
| US4419690A (en) | Method and apparatus for producing a half-tone reproduction | |
| JP3534263B2 (en) | Image registration system | |
| US4918622A (en) | Electronic graphic arts screener | |
| US5305118A (en) | Methods of controlling dot size in digital halftoning with multi-cell threshold arrays | |
| CA2147298C (en) | Rotating non-rotationally symmetrical halftone dots for encoding embedded data in a hyperacuity printer | |
| CA2128859C (en) | Halftoning in a hyperacuity printer | |
| EP0444093B1 (en) | An electronic graphic arts screener that suppresses moire patterns using pseudo-random font selection | |
| US4977458A (en) | Apparatus for addressing a font to suppress Moire patterns occurring thereby and a method for use therein | |
| US4864326A (en) | Dual beam recorder | |
| JPH07236059A (en) | Supersensitive printing system | |
| US4556918A (en) | Method and apparatus for generating screened halftone images | |
| US4825298A (en) | Halftone dot-generator and generating method | |
| JPH08227147A (en) | Dot forming method and device therefor | |
| CA2128858A1 (en) | Two dimensional linear interpolation with slope output for a hyperacuity printer | |
| US5315406A (en) | Screen generation for halftone screening of images using arbitrary distribution of transformed screen coordinates | |
| US4768101A (en) | Half-tone reproduction method employing overlapping scan lines | |
| US5638107A (en) | Interlace formatting in a hyperacuity printer | |
| US5691828A (en) | Apparatus and technique for generating a screen reproduction of an image | |
| US5638110A (en) | Two dimensional slope thresholding in a hyperacuity printer | |
| US5742325A (en) | Micro segmentation in a hyperacuity printer | |
| US4623972A (en) | Half-tone dot imaging | |
| US5040080A (en) | Electronic screening | |
| US5742743A (en) | Apparatus and method for generating a screen reproduction of a color image including dot shape rotation | |
| JPH07195746A (en) | Extra-high sensitivity printing system | |
| Curry | Analytic clustered halftone dots |
Legal Events
| Date | Code | Title | Description |
|---|---|---|---|
| AS | Assignment |
Owner name: CROSFIELD ELECTRONICS LIMITED, 766 HOLLOWAY RD., L Free format text: ASSIGNMENT OF ASSIGNORS INTEREST.;ASSIGNOR:HAMMES, PHILIPPE;REEL/FRAME:003917/0485 Effective date: 19810807 |
|
| STCF | Information on status: patent grant |
Free format text: PATENTED CASE |
|
| FEPP | Fee payment procedure |
Free format text: PAYOR NUMBER ASSIGNED (ORIGINAL EVENT CODE: ASPN); ENTITY STATUS OF PATENT OWNER: LARGE ENTITY |
|
| MAFP | Maintenance fee payment |
Free format text: PAYMENT OF MAINTENANCE FEE, 4TH YEAR, PL 96-517 (ORIGINAL EVENT CODE: M170); ENTITY STATUS OF PATENT OWNER: LARGE ENTITY Year of fee payment: 4 |
|
| MAFP | Maintenance fee payment |
Free format text: PAYMENT OF MAINTENANCE FEE, 8TH YEAR, PL 96-517 (ORIGINAL EVENT CODE: M171); ENTITY STATUS OF PATENT OWNER: LARGE ENTITY Year of fee payment: 8 |
|
| MAFP | Maintenance fee payment |
Free format text: PAYMENT OF MAINTENANCE FEE, 12TH YEAR, LARGE ENTITY (ORIGINAL EVENT CODE: M185); ENTITY STATUS OF PATENT OWNER: LARGE ENTITY Year of fee payment: 12 |
|
| AS | Assignment |
Owner name: FUJIFILM ELECTRONIC IMAGING LIMITED, ENGLAND Free format text: ASSIGNMENT OF ASSIGNORS INTEREST;ASSIGNOR:CROSFIELD ELECTRONICS LIMITED;REEL/FRAME:009138/0216 Effective date: 19980226 |