US5201318A - Contour mapping of spectral diagnostics - Google Patents
Contour mapping of spectral diagnostics Download PDFInfo
- Publication number
- US5201318A US5201318A US07/772,620 US77262091A US5201318A US 5201318 A US5201318 A US 5201318A US 77262091 A US77262091 A US 77262091A US 5201318 A US5201318 A US 5201318A
- Authority
- US
- United States
- Prior art keywords
- tissue
- radiation
- fluorescence
- intensity
- spectral
- Prior art date
- Legal status (The legal status is an assumption and is not a legal conclusion. Google has not performed a legal analysis and makes no representation as to the accuracy of the status listed.)
- Expired - Lifetime
Links
- 230000003595 spectral effect Effects 0.000 title claims abstract description 29
- 238000013507 mapping Methods 0.000 title description 3
- 230000005284 excitation Effects 0.000 claims abstract description 51
- 238000000034 method Methods 0.000 claims abstract description 41
- 238000012545 processing Methods 0.000 claims abstract description 12
- 210000001519 tissue Anatomy 0.000 claims description 146
- 238000001228 spectrum Methods 0.000 claims description 37
- 230000005855 radiation Effects 0.000 claims description 28
- 239000011159 matrix material Substances 0.000 claims description 24
- 210000001072 colon Anatomy 0.000 claims description 11
- 210000005068 bladder tissue Anatomy 0.000 claims description 9
- 230000002159 abnormal effect Effects 0.000 claims description 6
- 210000001367 artery Anatomy 0.000 claims description 6
- 239000013307 optical fiber Substances 0.000 claims description 5
- 230000003143 atherosclerotic effect Effects 0.000 claims description 3
- 230000002792 vascular Effects 0.000 claims 4
- 238000012935 Averaging Methods 0.000 claims 3
- 230000001939 inductive effect Effects 0.000 claims 3
- 230000008878 coupling Effects 0.000 claims 2
- 238000010168 coupling process Methods 0.000 claims 2
- 238000005859 coupling reaction Methods 0.000 claims 2
- 230000001678 irradiating effect Effects 0.000 claims 2
- 239000000463 material Substances 0.000 claims 2
- 238000003745 diagnosis Methods 0.000 abstract description 5
- 238000001499 laser induced fluorescence spectroscopy Methods 0.000 abstract description 4
- 230000009102 absorption Effects 0.000 description 22
- 238000010521 absorption reaction Methods 0.000 description 22
- 210000000709 aorta Anatomy 0.000 description 17
- 108010054147 Hemoglobins Proteins 0.000 description 16
- 102000001554 Hemoglobins Human genes 0.000 description 16
- 102000008186 Collagen Human genes 0.000 description 13
- 108010035532 Collagen Proteins 0.000 description 13
- QIVBCDIJIAJPQS-VIFPVBQESA-N L-tryptophane Chemical compound C1=CC=C2C(C[C@H](N)C(O)=O)=CNC2=C1 QIVBCDIJIAJPQS-VIFPVBQESA-N 0.000 description 13
- QIVBCDIJIAJPQS-UHFFFAOYSA-N Tryptophan Natural products C1=CC=C2C(CC(N)C(O)=O)=CNC2=C1 QIVBCDIJIAJPQS-UHFFFAOYSA-N 0.000 description 13
- 229920001436 collagen Polymers 0.000 description 13
- 230000001575 pathological effect Effects 0.000 description 11
- 239000000523 sample Substances 0.000 description 11
- 230000000694 effects Effects 0.000 description 9
- 150000003278 haem Chemical class 0.000 description 8
- 230000009103 reabsorption Effects 0.000 description 8
- 230000001419 dependent effect Effects 0.000 description 7
- 102000016942 Elastin Human genes 0.000 description 5
- 108010014258 Elastin Proteins 0.000 description 5
- 206010028980 Neoplasm Diseases 0.000 description 5
- 229920002549 elastin Polymers 0.000 description 5
- 238000000295 emission spectrum Methods 0.000 description 5
- 238000000338 in vitro Methods 0.000 description 5
- AUNGANRZJHBGPY-SCRDCRAPSA-N Riboflavin Chemical compound OC[C@@H](O)[C@@H](O)[C@@H](O)CN1C=2C=C(C)C(C)=CC=2N=C2C1=NC(=O)NC2=O AUNGANRZJHBGPY-SCRDCRAPSA-N 0.000 description 4
- 208000007097 Urinary Bladder Neoplasms Diseases 0.000 description 4
- 239000006096 absorbing agent Substances 0.000 description 4
- 238000012774 diagnostic algorithm Methods 0.000 description 4
- 238000002189 fluorescence spectrum Methods 0.000 description 4
- 238000002791 soaking Methods 0.000 description 4
- 238000000862 absorption spectrum Methods 0.000 description 3
- 230000008859 change Effects 0.000 description 3
- 238000012512 characterization method Methods 0.000 description 3
- 238000002405 diagnostic procedure Methods 0.000 description 3
- 238000010606 normalization Methods 0.000 description 3
- 210000003932 urinary bladder Anatomy 0.000 description 3
- HXACOUQIXZGNBF-UHFFFAOYSA-N 4-pyridoxic acid Chemical compound CC1=NC=C(CO)C(C(O)=O)=C1O HXACOUQIXZGNBF-UHFFFAOYSA-N 0.000 description 2
- 241000283690 Bos taurus Species 0.000 description 2
- 102000012422 Collagen Type I Human genes 0.000 description 2
- 108010022452 Collagen Type I Proteins 0.000 description 2
- 108010064719 Oxyhemoglobins Proteins 0.000 description 2
- FAPWRFPIFSIZLT-UHFFFAOYSA-M Sodium chloride Chemical compound [Na+].[Cl-] FAPWRFPIFSIZLT-UHFFFAOYSA-M 0.000 description 2
- 238000004458 analytical method Methods 0.000 description 2
- 239000003795 chemical substances by application Substances 0.000 description 2
- 239000000470 constituent Substances 0.000 description 2
- 238000007405 data analysis Methods 0.000 description 2
- SYKQOFCBFHMCJV-UHFFFAOYSA-N ethyl 2-cyano-3-phenylpropanoate Chemical compound CCOC(=O)C(C#N)CC1=CC=CC=C1 SYKQOFCBFHMCJV-UHFFFAOYSA-N 0.000 description 2
- 230000002496 gastric effect Effects 0.000 description 2
- 238000001727 in vivo Methods 0.000 description 2
- 150000002596 lactones Chemical class 0.000 description 2
- 230000003287 optical effect Effects 0.000 description 2
- 230000008569 process Effects 0.000 description 2
- 239000011780 sodium chloride Substances 0.000 description 2
- 208000004804 Adenomatous Polyps Diseases 0.000 description 1
- 108010057573 Flavoproteins Proteins 0.000 description 1
- 102000003983 Flavoproteins Human genes 0.000 description 1
- 101000878457 Macrocallista nimbosa FMRFamide Proteins 0.000 description 1
- LCYXYLLJXMAEMT-SAXRGWBVSA-N Pyridinoline Chemical compound OC(=O)[C@@H](N)CCC1=C[N+](C[C@H](O)CC[C@H](N)C([O-])=O)=CC(O)=C1C[C@H](N)C(O)=O LCYXYLLJXMAEMT-SAXRGWBVSA-N 0.000 description 1
- 210000000577 adipose tissue Anatomy 0.000 description 1
- 238000013459 approach Methods 0.000 description 1
- 230000000052 comparative effect Effects 0.000 description 1
- 150000001875 compounds Chemical class 0.000 description 1
- 238000010276 construction Methods 0.000 description 1
- 230000002596 correlated effect Effects 0.000 description 1
- 230000000875 corresponding effect Effects 0.000 description 1
- 238000010586 diagram Methods 0.000 description 1
- 230000003292 diminished effect Effects 0.000 description 1
- 239000000975 dye Substances 0.000 description 1
- 230000002708 enhancing effect Effects 0.000 description 1
- 210000003743 erythrocyte Anatomy 0.000 description 1
- 238000000695 excitation spectrum Methods 0.000 description 1
- 230000001747 exhibiting effect Effects 0.000 description 1
- 239000000835 fiber Substances 0.000 description 1
- 230000010354 integration Effects 0.000 description 1
- 238000002386 leaching Methods 0.000 description 1
- 238000005259 measurement Methods 0.000 description 1
- 230000000877 morphologic effect Effects 0.000 description 1
- 230000001338 necrotic effect Effects 0.000 description 1
- 230000035515 penetration Effects 0.000 description 1
- 238000006862 quantum yield reaction Methods 0.000 description 1
- 238000010791 quenching Methods 0.000 description 1
- 230000000171 quenching effect Effects 0.000 description 1
- 230000009467 reduction Effects 0.000 description 1
- 230000004044 response Effects 0.000 description 1
- PYWVYCXTNDRMGF-UHFFFAOYSA-N rhodamine B Chemical compound [Cl-].C=12C=CC(=[N+](CC)CC)C=C2OC2=CC(N(CC)CC)=CC=C2C=1C1=CC=CC=C1C(O)=O PYWVYCXTNDRMGF-UHFFFAOYSA-N 0.000 description 1
- 239000002356 single layer Substances 0.000 description 1
- 239000000126 substance Substances 0.000 description 1
- 238000012360 testing method Methods 0.000 description 1
- 238000012546 transfer Methods 0.000 description 1
- 229910052724 xenon Inorganic materials 0.000 description 1
- FHNFHKCVQCLJFQ-UHFFFAOYSA-N xenon atom Chemical compound [Xe] FHNFHKCVQCLJFQ-UHFFFAOYSA-N 0.000 description 1
Images


Classifications
-
- G—PHYSICS
- G01—MEASURING; TESTING
- G01J—MEASUREMENT OF INTENSITY, VELOCITY, SPECTRAL CONTENT, POLARISATION, PHASE OR PULSE CHARACTERISTICS OF INFRARED, VISIBLE OR ULTRAVIOLET LIGHT; COLORIMETRY; RADIATION PYROMETRY
- G01J3/00—Spectrometry; Spectrophotometry; Monochromators; Measuring colours
- G01J3/28—Investigating the spectrum
- G01J3/44—Raman spectrometry; Scattering spectrometry ; Fluorescence spectrometry
- G01J3/4406—Fluorescence spectrometry
-
- A—HUMAN NECESSITIES
- A61—MEDICAL OR VETERINARY SCIENCE; HYGIENE
- A61B—DIAGNOSIS; SURGERY; IDENTIFICATION
- A61B5/00—Measuring for diagnostic purposes; Identification of persons
- A61B5/0059—Measuring for diagnostic purposes; Identification of persons using light, e.g. diagnosis by transillumination, diascopy, fluorescence
-
- G—PHYSICS
- G01—MEASURING; TESTING
- G01N—INVESTIGATING OR ANALYSING MATERIALS BY DETERMINING THEIR CHEMICAL OR PHYSICAL PROPERTIES
- G01N21/00—Investigating or analysing materials by the use of optical means, i.e. using sub-millimetre waves, infrared, visible or ultraviolet light
- G01N21/62—Systems in which the material investigated is excited whereby it emits light or causes a change in wavelength of the incident light
- G01N21/63—Systems in which the material investigated is excited whereby it emits light or causes a change in wavelength of the incident light optically excited
- G01N21/64—Fluorescence; Phosphorescence
- G01N21/645—Specially adapted constructive features of fluorimeters
- G01N21/6456—Spatial resolved fluorescence measurements; Imaging
-
- G—PHYSICS
- G01—MEASURING; TESTING
- G01N—INVESTIGATING OR ANALYSING MATERIALS BY DETERMINING THEIR CHEMICAL OR PHYSICAL PROPERTIES
- G01N21/00—Investigating or analysing materials by the use of optical means, i.e. using sub-millimetre waves, infrared, visible or ultraviolet light
- G01N21/62—Systems in which the material investigated is excited whereby it emits light or causes a change in wavelength of the incident light
- G01N21/63—Systems in which the material investigated is excited whereby it emits light or causes a change in wavelength of the incident light optically excited
- G01N21/64—Fluorescence; Phosphorescence
- G01N2021/6417—Spectrofluorimetric devices
- G01N2021/6419—Excitation at two or more wavelengths
-
- G—PHYSICS
- G01—MEASURING; TESTING
- G01N—INVESTIGATING OR ANALYSING MATERIALS BY DETERMINING THEIR CHEMICAL OR PHYSICAL PROPERTIES
- G01N21/00—Investigating or analysing materials by the use of optical means, i.e. using sub-millimetre waves, infrared, visible or ultraviolet light
- G01N21/62—Systems in which the material investigated is excited whereby it emits light or causes a change in wavelength of the incident light
- G01N21/63—Systems in which the material investigated is excited whereby it emits light or causes a change in wavelength of the incident light optically excited
- G01N21/64—Fluorescence; Phosphorescence
- G01N21/645—Specially adapted constructive features of fluorimeters
- G01N2021/6484—Optical fibres
Definitions
- the present invention relates to a system and method for processing spectral information used to aid in the diagnosis of diseased tissue. More particularly, it relates to a method for collecting and displaying the excitation and emission spectra resulting from the laser-induced-fluorescence of tissue.
- LIF laser-induced-fluorescence
- Laser catheter systems have also been developed, often in conjunction with known techniques for using fluorescence to aid in diagnosis, for the purpose of inserting a light transmitting device into the human body where laser radiation can be directed onto tissue adjacent the distal end of the catheter to induce fluorescence.
- the light emitted by the tissue is transmitted along the catheter and analyzed at the proximal end thereof to produce an emission spectrum of the irradiated tissue.
- the present invention relates to a system for characterizing tissue fluorescence in the ultraviolet and throughout the visible for the purpose of generating diagnostically useful information.
- the present system provides the ability to look at fluorescence over a wide range of excitation and emission wavelengths. Such a broad survey is important in fully characterizing the spectroscopic differences between tissue types as well as in aiding in the identification of tissue fluorophores whose presence is correlated with known normal and abnormal states of tissue.
- the intensity of fluorescence depends on three parameters: the radiative properties of the fluorophores within the tissue; the wavelength of the exciting light; and the wavelength of the emitted fluorescence.
- Two types of scans are typically used when recording fluorescence intensity: emission scans (spectra), in which the excitation wavelength is held constant and the emission wavelength is varied, and excitation scans (spectra), in which the emission wavelength is constant and the excitation is varied.
- emission scans spectra
- excitation scans spectra
- Either type of scan alone contains useful information about the tissue constituents; however, both excitation and emission profiles are needed for a full characterization of fluorescence.
- a complete fluorescence characterization involves recording the fluorescence intensity for each possible pair of excitation and emission wavelengths.
- emission (or excitation) scans are presented as two dimensional plots with emission (or excitation) wavelengths running along one axis and fluorescence intensity running along the other axis.
- a 3-dimensional plot of intensity vs. excitation and emission is one alternative for displaying the information for analysis.
- contour maps are employed to display the data as they provide for viewing many of the important features on one plot.
- This method is employed in conjunction with laser catheter systems used to induce fluorescence in bodily tissue both in vitro and in vivo without the use of fluorescence enhancing agents, also referred to herein as "autofluorescence".
- the procedure is illustrated using data collected on excised tissue samples, including artery wall, gastrointestinal tissue and bladder tissue, but are usefully applied to all types of tissue and the abnormal or diseased conditions which can be differentiated by optical characteristics.
- fluorophores present in the tissue under study whose concentration varies with the condition of the tissue, have been associated with specific features of the contour spectra. This correlation between the contour spectra and the chemical constituents of the tissue is useful in the construction of diagnostic methods which can systematically differentiate tissue type and condition.
- FIG. 1 is a schematic diagram of an apparatus used in conjunction with the present invention.
- FIG. 2 illustrates a contour map of morphologically normal aorta.
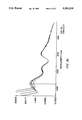
- FIG. 3a presents four emission scans from the region about line A-B of FIG. 2.
- FIG. 3b presents emission scans from line A-C in FIG. 2.
- FIGS. 4a and 4b present a contour map and a perspective view of an excitation emission matrix of fluorescence intensity of normal aorta.
- FIGS. 5a and 5b show a contour map and a perspective view, respectively, of an averaged excitation-emission matrix of fibrous aortic tissue.
- FIGS. 6a and 6b show a contour map and a perspective view, respectively, of an averaged excitation-emission matrix of calcified aortic tissue.
- FIGS. 7a and 7b show a contour map and a perspective view, respectively, of an excitation-emission matrix of fatty aortic tissue.
- FIGS. 8a and 8b show an absorption spectrum and a contour map, respectively, of hemoglobin.
- FIGS. 9a and 9b show contour maps of bulk aorta before and after the sample is soaked in saline.
- FIG. 10 shows a contour map of the attenuation matrix of hemoglobin.
- FIGS. 11a and 11b show contour maps of aortic tissue after soaking to remove hemoglobin, and after the addition of the effects of hemoglobin using the hemoglobin absorption matrix.
- FIG. 12 illustrates a contour 12 of powdered type 1 bovine collagen.
- FIGS. 13a and 13b show average fluorescence contour maps of normal human colon tissue.
- FIGS. 14a and 14b show average fluorescence contour maps for adenomatous human colon tissue.
- FIG. 15 shows the ratio of an average contour map for adenomatous polyp to an average contour map for normal gastrointestinal tissue.
- FIG. 16 shows the map of FIG. 15 where the contour line density is increased by a factor of two to show more detail.
- FIG. 17 illustrates a diagnostic algorithm for differentiating adenomatous from normal colon tissue based upon a ratio of maps at an excitation wavelength of 330 nanometers and an emission wavelength of 385 nanometers.
- FIG. 18 illustrates a diagnostic algorithm based upon an excitation wavelength of 440 nanometers and an emission wavelength of 480 nanometers.
- FIG. 19 illustrates a binary type diagnostic algorithm
- FIGS. 20a and 20b show average contour maps on different scales of normal bladder tissue.
- FIGS. 21a and 21b show average contour maps on two different scales of bladder tumor.
- FIG. 22 shows a ratio of contour maps for bladder tumor and normal bladder tissue.
- FIG. 23 shows the map of FIG. 22 with a greater contour line density.
- FIG. 24 shows a binary diagnostic algorithm to differentiate bladder tumor from normal bladder tissue.
- FIG. 1 illustrates a preferred embodiment of the system that is used in generating and processing matrices of fluorescence intensity obtained as a function of both excitation and emission wavelengths.
- Light source 10 can be a broadband source such as a Xenon arc lamp. However, a tunable laser can also be employed to provide excitation radiation of variable wavelength.
- a double monochromator 12 subject to scan control 14 directs radiation of selected wavelength through optical fiber 16 onto the tissue sample 22. Collection fibers 18 collect the fluorescent radiation emitted by the sample 22 and direct it through collection optics 20 and into a second double monochromator 24.
- Photomultiplier 26 then detects the radiation and generates a signal that is forwarded to computer 28 for processing and display.
- Computer 28, via line 30, can be used to control the scanning parameters of the two monochromators 12 and 24.
- the optical probe or catheter 32 can also be used in vivo within the human body to perform diagnostic scans on living tissue.
- the methods of the present invention may be used in conjunction with the laser catheter systems disclosed in U.S. Pat. No. 4,718,417, incorporated herein by reference.
- Fluorescence intensity from normal aorta was recorded over a range of from 250 to 700 nm every 5 nm for both excitation and emission.
- the system used for this type of measurement is easily tuned over a large range of excitations.
- the system can use a rhodamine solution as a reference, so that differences in intensity of the exciting light at different wavelengths are automatically removed from the spectra. This makes it possible to obtain fluorescence intensities over a large range of excitations and emissions on a single sample of tissue in a reasonable amount of time.
- Gratings blazed at 250 nm have been used so that emission spectra can be taken from 250 to 700 nm.
- emission scans were taken with excitations of 250 to 500 nm every 5 nm.
- the emission ranges ran from the excitation +12.5 nm to 697.5 nm every 5 nm.
- the FIGURES described below are generated by sequential acquisition of emission scans; however, excitation scans could be used as well to display the relationship between excitation and emission.
- the FWHM (full width-half maximum) of the excitation source was 2 nm, and the emission FWHM was 3 nm.
- An integration time of 1 second at each point yielded a reasonable signal to noise ratio for all scans.
- FIG. 2 shows the contour map that was generated from a sample of morphologically normal aorta.
- the map shows five distinct peaks (labeled A-E in FIG. 2). Each peak potentially represents a distinct fluorophore; however, it is known that fluorescence reabsorption in the tissue can create artificial peaks in emission spectra. On the contour map, such reabsorption valleys should appear as depressions at constant emission wavelength, since the wavelength of reabsorption does not depend on excitation.
- the three dashed vertical lines in FIG. 2 are examples of such reabsorption.
- the two lines near 570 nm emission represent absorption due to oxy-hemoglobin, while the line near 415 nm is the Soret band of heme.
- the two peaks D and E are due to a single fluorophore which is known to be elastin/collagen.
- the peaks B and C may also be due to a single fluorophore, although the fact that they are slightly shifted in excitation from one another supports the notion that the peaks are due to two distinct fluorophores.
- Horizontal lines that is, lines of constant excitation, on the map represent emission scans.
- Four emission scans from the region designated by line A-B in FIG. 2 are shown in FIG. 3a. These scans are very similar to those with 476 nm excitation.
- the two peaks at 560 and 600 nm are artificial in that they are created by the reabsorption valleys at 540 and 580 nm, as was surmised from the contour map.
- Emission scans from line A-C are shown in FIG. 3b.
- the intensity of fluorophore A emitting at 340 nm, is strongly dependent on excitation wavelength near 300 nm. This is vident from the very close spacing of the contour lines in this region. This fluorophore has been identified as tryptophan.
- the Soret valley at 415 nm is also seen in these emission scans, as is the emergence of another peak (B) at 390 nm, as excitation wavelength is made longer.
- peak C (at 450 nm emission) was assumed to be artificially created by the Soret valley, so that peaks B and C were assigned to a single fluorophore.
- peaks B and C were assigned to a single fluorophore.
- these peaks occur at slightly different excitations, and it is possible that two distinct fluorophores are being observed.
- This system has been used to determine optimal excitation and emission wavelengths for differentiating normal and atherosclerotic aorta. Also, contour maps of fibrous, fatty and calcified plaques have been constructed. By normalizing these maps and then subtracting them from, or ratioing them, to a normalized map of normal aorta, excitation and emission wavelengths at which fluorescence lineshapes of normal and diseased tissue are most different can be easily identified.
- FIGS. 4-7 present data collected as excitation-emission matrices (EEM's) of bulk samples of normal and pathological human aorta tissue. This data, which is presented in the form of contour maps as well as perspective drawings is used to determine an optimum wavelength for distinguishing between normal and pathological tissue.
- EEM's excitation-emission matrices
- Tissue samples are classified as either normal, fibrous, fatty, or calcified. In all, there were nine normal samples run from five different patients six calcified samples which were all from the same patient, eight fibrous samples taken from four different patients, and two samples of fatty tissue from the same patient.
- the main features of the EEM's of the normal samples of FIGS. 4a and 4b are the dominant tryptophan peak in the uv and the absorption valleys at 415 nm, which are believed to be caused by the presence of hemoglobin in the tissue. There is also weaker fluorescence in the visible range, which is primarily due to chromophores within the collagen and elastin. The most noticeable difference between the EEM's of the normal and fibrous tissue (at FIGS. 5a and 5b) is that there is greater fluorescence at the longer wavelengths in normal compared to fibrous.
- Hemoglobin plays an important role in in vitro aorta EEM's.
- the large Soret absorption band at 416 nm is responsible for the deep valleys seen in the contour map both at excitations and emissions around 416 nm.
- Oxyhemoglobin also produces the minor valleys near 540 and 580 nm. Note that heme is one of the chromophores found in hemoglobin. Heme has an absorption region centered around 560 nm. This conclusion is supported by the following observations:
- a Hb ( ⁇ x , ⁇ m) ⁇ Hb ( ⁇ x ) + ⁇ Hb ( ⁇ m ), where A Hb represents the attenuation spectrum of Hb (and similarly for SP, where SP refers to fixed tissue absorbers).
- a Hb ( ⁇ x , ⁇ m) can be thought of as the normalized attenuation matrix of Hb, with x Hb representing its concentration; it can be generated from the Hb absorption spectrum if effects of scattering are neglected.
- Hb absorption effects can also be produced in an ex vivo aorta sample.
- the EEM of the ex vivo sample which has presumably not been exposed to free Hb, is quite similar to that of the soaked aorta.
- This method of correcting for the presence of absorbers within the tissue being examined can be applied to other absorbing components.
- the removal of the effects of absorption can assist in providing a clearer spectrum in which all of the disibile information regarding tissue fluorescence can be recovered.
- the system also assists in identifying the chromophores which contribute to arterial tissue fluorescence spectra.
- Contour maps provide very useful insight about the number and nature of tissue chromophores.
- maps can be obtained from thin tissue sections, which contain a limited number of chromophores (e.g. ceroid in necrotic core) and are free of reabsorption effects.
- maps of pure compounds, which are suspected tissue chromophores can be constructed for comparison with tissue maps.
- FIG. 12 contains a map of powdered type 1 bovine collagen.
- Other components studied include chromophores or structures containing chromophores such as elastin, tryptophan, hemoglobin and flavoprotein.
- type 1 collagen has emission in the same region as does normal aorta, there are several important differences. Some of these are due to reabsorption of hemoglobin; the collagen map does not show valleys at 420, 540 and 580 nm. However, other differences are not related to reabsorption, and indicate that tissue fluorescence in this region contains contributions from chromophores other than those present in type 1 collagen.
- the methods of the present invention have been used to differentiate normal and pathologic tissues in human colon and urinary bladder with excitation wavelengths ranging from 250-500 nm, utilizing fluorescence contour maps.
- This contour mapping serves to identify optimal excitation wavelengths for differentiating normal and pathologic tissue fluorescence spectra and to identify tissue chromophores contributing to the fluorescence of normal and pathologic tissues.
- Fluorescence contour maps were collected from 18 colon specimens and 15 urinary bladder specimens. Fluorescence contour maps were constructed from a series of fluorescence emission spectra recorded using a spectrofluorimeter. Excitation wavelengths were varied in 10 nm steps from 250 to 500 nm. Fluorescence was collected at 5 nm intervals from ⁇ exc+10 nm to 2 ⁇ exc-10 nm. Incident beam size was ⁇ 2 ⁇ 3 mm, smaller than the surface area of all tissue samples, thus absolute intensity information has been preserved in the analysis of this data. To correct for day to day variations in the spectrofluorimeter alignment, all data has been divided by a fluorescence intensity standard which is run each day. Emission gratings were blazed at 250 nm. All data presented here has been corrected for the non-uniform spectral response of the collection system.
- a contour at 1.0 indicates regions in which the fluorescence emission from normal and pathologic tissues is the same, while contours at values greater (less) than 1.0 indicate regions where the emission from pathologic tissue is greater (less) than that from normal tissues Regions of greatest difference in the fluorescence spectra of normal and pathologic tissues were assessed from this average ratio map. This information was used in defining a process for determination of tissue type.
- FIGS. 13 and 14 show average fluorescence contour maps of normal and adenomatous human colon tissue.
- normal tissue fluorescence contour map several major fluorescence and absorption bands can be recognized, as summarized in Table 1.
- Table 2 lists the major absorption and fluorescence bands found in the adenomatous fluorescence contour map.
- FIG. 15 shows the ratio of the two average contour maps, with contours drawn linearly from 2.0 to 0.2. Greater detail is shown in FIG. 16, with contours drawn from 1.0 to 0.1. Again contours at 1.0 indicate regions where normal and adenomatous tissues exhibit equal fluorescence intensities, while contours greater (less) than 1.0 indicate regions where adenomatous tissue fluorescence is greater (less) than normal tissue fluorescence. In the region of tryptophan fluorescence, a contour with a value of 1.0 is shown, indicating the similarity of tryptophan fluorescence in normal and adenomatous tissues. A valley is present at (335,385) with a contour level of 0.3 indicating the additional fluorescence band present in normal tissue at this location. A valley is present at (390,430) with a contour of 0.8. Additional valleys are present at (400,495), (440,480), (430,600) and (430,670). These are summarized in Table 3.
- the values of the individual ratio maps at these locations of ( ⁇ x , ⁇ m), can be divided by the intensity of the ratio map at (290,340). Two of these values, at (330,385) and (440,480), independently provided useful diagnostics for differentiating normal and adenomatous tissues (FIGS. 17 and 18). In addition, a binary scheme utilizing information at (390,430) and (330,385) provided an accurate diagnostic process (FIG. 19).
- FIGS. 20 and 21 show average fluorescence contour maps of normal bladder wall and tumor.
- Major fluorescence and absorption bands are summaried in Tables 4 and 5.
- tryptophan fluorescence both normal and tumor tissues have similar emission.
- both tissues show a fluorescence band at (325,385), it is 3 ⁇ stronger in normal tissue.
- Both tissues show fluorescence peaks at (350,470) with normal tissues exhibiting 2 ⁇ as much fluorescence intensity.
- the fluorescence of normal tissue is 2 ⁇ as high as that of tumor tissue.
- the average tumor map exhibits a unique peak at (315,430).
- FIGS. 22 and 23 show the ratio contour map of tumor and normal bladder tissue for two sets of contours (2.0-0.2, 1.0-0.1).
- Table 6 summarizes the valleys present in this ratio map. Valleys are present at (330,385), (370,435), (400,495), (450,485), (420,640), and (390,670). Values of the individual ratio maps at these locations can be divided by the value of the tryptophan peak (290,340).
- FIG. 24 shows an example of a diagnostic procedure which can be defined from this data.
- the model begins with the reasonable assumption that tissue contains a few relatively strongly fluorescing chromophores, a background of weaker ones, and absorbers which are probably non-fluorescent.
- the strong chromophores with relatively high quantum yields or concentrations (or both), will generate "peaks" on the contour plot.
- these chromophores generally have a broad base which tends toward shorter wavelengths for excitation; and due to the general anharmonicity of higher vibrational levels, it tends toward longer wavelengths for emission. Combining with the weaker chromophores, this forms an average elevation of signal background from which the peaks arise.
- the absorbers cut vertically and horizontally across the spectral terrain. The percent decrease along the line should be approximately constant to the extent that the penetration depth is constant. This is distinguishable from a "pass" between two spectral peaks, which is just lesser fluorescence, not absorption. Thin sections will be quite helpful in identifying absorption features by their absence.
- Distinguishing diseased vs. healthy tissue is essentially distinguishing one set of chromophore signals from another. If two tissues have different amounts of one chromophore, then the corresponding absolute signals might be measured; however, this is dependent on collection geometry. Comparisons, or ratios, are less geometry dependent, but appropriate positions on the 2-D surface need to be selected. The data is normalized so as to again avoid geometry-dependent ratios.
- the spectral landscape model has three regions: 1) fluorescent peaks, 2) an average elevation, or plateau, and 3) absorption valleys. Of these, region 1 is the most appealing as a discriminant for tissue type, as it would show a characteristic chromophore. Region 3 is susceptible to variability or leaching as has been shown for the case of heme, and region 2, being comprised of fluorescence from several chromophores, is likely to have the least variation overall. Signal change due to a change in one of the chromophores would be diminished by the fraction of the total signal contributed by that chromophore. In other words, instead of comparing absolute peak heights, they should first be normalized relative to the average elevation.
- normalization would be relative to selected regions thought to be "average”; a practical compromise is the average height from the total integrated signal of the entire plot. Peaks then have signals >1, and valleys generally ⁇ 1.
- the comparison signal R ⁇ for each set of excitation and emission wavelengths equals the diseased signal D ⁇ , divided by the normal tissue signal, N ⁇ .
- N is in the denominator, since it is desirable to determine the deviation of the diseased tissue from normal.
- the "peak" value When the "peak" value is selected, it should be integrated over the top 10%-20% of the peak, thereby incorporating a substantial volume of the fluorescence signal; otherwise, data is discarded, and the noise level is increased.
- a weighting factor may be introduced: Assuming that the signal to noise ratio varies as the square root of the signal, the ratio signal should be multiplied by the square root of N ⁇ to yield W ⁇ , the weighted normalized ratio contour plot comparing the two tissue types.
Abstract
Description
              TABLE 1
______________________________________
Average Normal Colon Tissue
            Fluorescence
(λx, λm)
            Intensity    Chromophore
______________________________________
(285, 340)  50.0         Tryptophan
(330, 385)  5.0          Chromophore
                         Within Collagen
(315, 430)  2.5          4-Pyridoxic Acid
(345, 465)  5.0          NAD(P)H
(460, 520)  4.5          Flavin
(λ, 420) (420, λ)
                         Hemoglobin (Heme)
(λ, 540) (λ, 580)
______________________________________
              TABLE 2
______________________________________
Average Adenomatous Colon Tissue
            Fluorescence
(λx, λm)
            Intensity    Chromophore
______________________________________
(285, 340)  50.0         Tryptophan
(340, 470)  2.5          NAD(P)H
(460, 520)  2.5          Flavin
(λ,420) (420, λ)
                         Hemoglobin (Heme)
(λ, 540) (λ, 580)
______________________________________
              TABLE 3
______________________________________
Average Ratio Map, Colon Tissue
(λx, λm)
          .sup.R AVG.sup.(λ x, .sup.λ m.sup.)
                         Chromophore
______________________________________
(330, 385)
          0.3            Chromophore
                         Within Collagen
(390, 430)
          0.8            Pyridoxic Acid
                         Lactone
(400, 495)
          0.4            ?
(440, 480)
          0.4            ?
(430, 600)
          0.7            ?
(430, 670)
          0.8            ?
______________________________________
              TABLE 4
______________________________________
Average Normal Bladder Tissue
            Fluorescence
(λx, λm)
            Intensity    Chromophore
______________________________________
(285, 340)  50.0         Tryptophan
(325, 385)  15.0         Chromophore
                         Within Collagen
(350, 470)  10.0         NAD(P)H
(470, 520)  10.0         Flavin
(λ, 420) (420, λ)
                         Hemoglobin (Heme)
(λ, 540) (λ, 580)
______________________________________
              TABLE 5
______________________________________
Average Bladder Tumor
            Fluorescence
(λx, λm)
            Intensity    Chromophore
______________________________________
(285, 340)  50.0         Tryptophan
(330, 385)  5.0          Chromophore
                         Within Collagen
(315, 430)  3.0          4-Pyridoxic Acid
(350, 470)  5.0          NAD(P)H
(460, 515)  5.0          Flavin
(λ, 420) (420, λ)
                         Hemoglobin (Heme)
(λ, 540) (λ, 580)
______________________________________
              TABLE 6
______________________________________
Average Ratio Map, Bladder Tissue
(λx, λm)
          .sup.R AVG.sup.(λ x, .sup.λ m.sup.)
                         Chromophore
______________________________________
(330, 385)
          0.4            Chromophore
                         Within Collagen
(370, 435)
          0.8            Pyridoxic Acid
                         Lactone
(400, 495)
          0.5            ?
(450, 485)
          0.4            ?
(420, 640)
          0.9            ?
(390, 670)
          0.6            ?
______________________________________
Rλ=Dλ/Nλ
Sλ=ΔDλ/Nλ,
Wλ=NλRλ.
Claims (20)
Priority Applications (2)
| Application Number | Priority Date | Filing Date | Title |
|---|---|---|---|
| US07/772,620 US5201318A (en) | 1989-04-24 | 1991-10-04 | Contour mapping of spectral diagnostics |
| US08/024,674 US5345941A (en) | 1989-04-24 | 1993-03-01 | Contour mapping of spectral diagnostics |
Applications Claiming Priority (2)
| Application Number | Priority Date | Filing Date | Title |
|---|---|---|---|
| US34231189A | 1989-04-24 | 1989-04-24 | |
| US07/772,620 US5201318A (en) | 1989-04-24 | 1991-10-04 | Contour mapping of spectral diagnostics |
Related Parent Applications (1)
| Application Number | Title | Priority Date | Filing Date |
|---|---|---|---|
| US34231189A Continuation | 1989-04-24 | 1989-04-24 |
Related Child Applications (1)
| Application Number | Title | Priority Date | Filing Date |
|---|---|---|---|
| US08/024,674 Division US5345941A (en) | 1989-04-24 | 1993-03-01 | Contour mapping of spectral diagnostics |
Publications (1)
| Publication Number | Publication Date |
|---|---|
| US5201318A true US5201318A (en) | 1993-04-13 |
Family
ID=26992944
Family Applications (2)
| Application Number | Title | Priority Date | Filing Date |
|---|---|---|---|
| US07/772,620 Expired - Lifetime US5201318A (en) | 1989-04-24 | 1991-10-04 | Contour mapping of spectral diagnostics |
| US08/024,674 Expired - Lifetime US5345941A (en) | 1989-04-24 | 1993-03-01 | Contour mapping of spectral diagnostics |
Family Applications After (1)
| Application Number | Title | Priority Date | Filing Date |
|---|---|---|---|
| US08/024,674 Expired - Lifetime US5345941A (en) | 1989-04-24 | 1993-03-01 | Contour mapping of spectral diagnostics |
Country Status (1)
| Country | Link |
|---|---|
| US (2) | US5201318A (en) |
Cited By (92)
| Publication number | Priority date | Publication date | Assignee | Title |
|---|---|---|---|---|
| US5345941A (en) * | 1989-04-24 | 1994-09-13 | Massachusetts Institute Of Technology | Contour mapping of spectral diagnostics |
| US5363855A (en) * | 1990-03-27 | 1994-11-15 | Rutgers University | Pressure waveform monitor |
| US5421337A (en) * | 1989-04-14 | 1995-06-06 | Massachusetts Institute Of Technology | Spectral diagnosis of diseased tissue |
| US5421339A (en) * | 1993-05-12 | 1995-06-06 | Board Of Regents, The University Of Texas System | Diagnosis of dysplasia using laser induced fluoroescence |
| FR2737845A1 (en) * | 1995-08-16 | 1997-02-21 | Centre Nat Rech Scient | ENDOSCOPIC IMAGING DEVICE FOR THE EARLY DETECTION OF CANCERIOUS OR PRECANCEROUS SURFACE LESIONS |
| US5612540A (en) * | 1995-03-31 | 1997-03-18 | Board Of Regents, The University Of Texas Systems | Optical method for the detection of cervical neoplasias using fluorescence spectroscopy |
| US5640957A (en) * | 1993-09-29 | 1997-06-24 | Instruments Sa, Inc. | Ultraviolet radiation protection evaluator |
| US5697373A (en) * | 1995-03-14 | 1997-12-16 | Board Of Regents, The University Of Texas System | Optical method and apparatus for the diagnosis of cervical precancers using raman and fluorescence spectroscopies |
| US5699795A (en) * | 1995-03-31 | 1997-12-23 | Board Of Regents, The University Of Texas System | Optical probe for the detection of cervical neoplasia using fluorescence spectroscopy and apparatus incorporating same |
| US5713364A (en) * | 1995-08-01 | 1998-02-03 | Medispectra, Inc. | Spectral volume microprobe analysis of materials |
| US5813987A (en) * | 1995-08-01 | 1998-09-29 | Medispectra, Inc. | Spectral volume microprobe for analysis of materials |
| US5842995A (en) * | 1996-06-28 | 1998-12-01 | Board Of Regents, The Univerisity Of Texas System | Spectroscopic probe for in vivo measurement of raman signals |
| WO1999013764A1 (en) * | 1997-09-12 | 1999-03-25 | Communaute Europeenne | Detecting and mapping inflamed zones in a living tissue |
| US5984861A (en) * | 1997-09-29 | 1999-11-16 | Boston Scientific Corporation | Endofluorescence imaging module for an endoscope |
| US5991653A (en) * | 1995-03-14 | 1999-11-23 | Board Of Regents, The University Of Texas System | Near-infrared raman spectroscopy for in vitro and in vivo detection of cervical precancers |
| US6055451A (en) * | 1997-12-12 | 2000-04-25 | Spectrx, Inc. | Apparatus and method for determining tissue characteristics |
| US6096065A (en) * | 1997-09-29 | 2000-08-01 | Boston Scientific Corporation | Sheath for tissue spectroscopy |
| US6104945A (en) * | 1995-08-01 | 2000-08-15 | Medispectra, Inc. | Spectral volume microprobe arrays |
| US6119031A (en) * | 1996-11-21 | 2000-09-12 | Boston Scientific Corporation | Miniature spectrometer |
| US6135965A (en) * | 1996-12-02 | 2000-10-24 | Board Of Regents, The University Of Texas System | Spectroscopic detection of cervical pre-cancer using radial basis function networks |
| US6174291B1 (en) | 1998-03-09 | 2001-01-16 | Spectrascience, Inc. | Optical biopsy system and methods for tissue diagnosis |
| US6185443B1 (en) | 1997-09-29 | 2001-02-06 | Boston Scientific Corporation | Visible display for an interventional device |
| WO2001008552A1 (en) * | 1999-08-03 | 2001-02-08 | Biophysica, Llc | Spectroscopic systems and methods for detecting tissue properties |
| US6241672B1 (en) * | 1990-08-10 | 2001-06-05 | University Of Washington | Method and apparatus for optically imaging solid tumor tissue |
| US6289229B1 (en) | 1998-01-20 | 2001-09-11 | Scimed Life Systems, Inc. | Readable probe array for in vivo use |
| US6324418B1 (en) | 1997-09-29 | 2001-11-27 | Boston Scientific Corporation | Portable tissue spectroscopy apparatus and method |
| US6385484B2 (en) | 1998-12-23 | 2002-05-07 | Medispectra, Inc. | Spectroscopic system employing a plurality of data types |
| US6405073B1 (en) | 1997-07-22 | 2002-06-11 | Scimed Life Systems, Inc. | Miniature spectrometer system and method |
| WO2002024048A3 (en) * | 2000-09-25 | 2002-07-18 | Vital Medical Ltd | Apparatus and method for monitoring tissue vitality parameters |
| US20020102213A1 (en) * | 2001-01-30 | 2002-08-01 | Yamato Scientific Co., Ltd. | Tissue mapping method and tissue map analyzer |
| US20020127735A1 (en) * | 1999-12-15 | 2002-09-12 | Howard Kaufman | Methods of monitoring effects of chemical agents on a sample |
| US20020177777A1 (en) * | 1998-12-23 | 2002-11-28 | Medispectra, Inc. | Optical methods and systems for rapid screening of the cervix |
| US20030095721A1 (en) * | 1999-12-15 | 2003-05-22 | Thomas Clune | Methods and systems for correcting image misalignment |
| US20030135122A1 (en) * | 1997-12-12 | 2003-07-17 | Spectrx, Inc. | Multi-modal optical tissue diagnostic system |
| US20030144585A1 (en) * | 1999-12-15 | 2003-07-31 | Howard Kaufman | Image processing using measures of similarity |
| US6671540B1 (en) * | 1990-08-10 | 2003-12-30 | Daryl W. Hochman | Methods and systems for detecting abnormal tissue using spectroscopic techniques |
| US20040007674A1 (en) * | 2002-07-09 | 2004-01-15 | Schomacker Kevin T. | Method and apparatus for identifying spectral artifacts |
| US20040010375A1 (en) * | 2002-07-09 | 2004-01-15 | Medispectra, Inc. | Methods and apparatus for processing spectral data for use in tissue characterization |
| US20040023406A1 (en) * | 2002-07-09 | 2004-02-05 | Schomacker Kevin T. | Optimal windows for obtaining optical data for characterization of tissue samples |
| US6697666B1 (en) | 1999-06-22 | 2004-02-24 | Board Of Regents, The University Of Texas System | Apparatus for the characterization of tissue of epithelial lined viscus |
| US6697652B2 (en) | 2001-01-19 | 2004-02-24 | Massachusetts Institute Of Technology | Fluorescence, reflectance and light scattering spectroscopy for measuring tissue |
| US20040064053A1 (en) * | 2002-09-30 | 2004-04-01 | Chang Sung K. | Diagnostic fluorescence and reflectance |
| US6768918B2 (en) | 2002-07-10 | 2004-07-27 | Medispectra, Inc. | Fluorescent fiberoptic probe for tissue health discrimination and method of use thereof |
| US20040147843A1 (en) * | 1999-11-05 | 2004-07-29 | Shabbir Bambot | System and method for determining tissue characteristics |
| US20040186382A1 (en) * | 1997-01-13 | 2004-09-23 | Medispectra, Inc. | Spectral volume microprobe arrays |
| US20040208390A1 (en) * | 2003-04-18 | 2004-10-21 | Medispectra, Inc. | Methods and apparatus for processing image data for use in tissue characterization |
| US20040206882A1 (en) * | 2003-04-18 | 2004-10-21 | Medispectra, Inc. | Methods and apparatus for evaluating image focus |
| US20040207625A1 (en) * | 2003-04-18 | 2004-10-21 | Medispectra, Inc. | Methods and apparatus for displaying diagnostic data |
| US20040208385A1 (en) * | 2003-04-18 | 2004-10-21 | Medispectra, Inc. | Methods and apparatus for visually enhancing images |
| US20040209237A1 (en) * | 2003-04-18 | 2004-10-21 | Medispectra, Inc. | Methods and apparatus for characterization of tissue samples |
| US6839661B2 (en) | 2000-12-15 | 2005-01-04 | Medispectra, Inc. | System for normalizing spectra |
| US6847490B1 (en) | 1997-01-13 | 2005-01-25 | Medispectra, Inc. | Optical probe accessory device for use in vivo diagnostic procedures |
| US20050234315A1 (en) * | 2002-03-20 | 2005-10-20 | Avraham Mayevsky | Diagnosis of body metabolic emergency state |
| US20050267103A1 (en) * | 1998-12-23 | 2005-12-01 | Cytoscan Sciences Llc | Methods and compositions for the treatment of neuropathic pain and neuropsychiatric disorders |
| US20060089556A1 (en) * | 1998-09-11 | 2006-04-27 | Spectrx, Inc. | Multi-modal optical tissue diagnostic system |
| US20060089350A1 (en) * | 1998-12-23 | 2006-04-27 | Neurotherapeutics Pharma Llc | Methods and compositions for the treatment of neuropsychiatric disorders |
| US20060161055A1 (en) * | 2002-03-20 | 2006-07-20 | Critisense, Ltd. | Probe design |
| US20060195022A1 (en) * | 1998-04-06 | 2006-08-31 | Pierre Trepagnier | Non-invasive tissue glucose level monitoring |
| US7103401B2 (en) | 2002-07-10 | 2006-09-05 | Medispectra, Inc. | Colonic polyp discrimination by tissue fluorescence and fiberoptic probe |
| US20070038120A1 (en) * | 2005-07-05 | 2007-02-15 | The Board Of Regents Of The University Of Texas | Depth-Resolved Spectroscopy Method and Apparatus |
| US20070149526A1 (en) * | 2005-10-17 | 2007-06-28 | Neurotherapeutics Pharma, L.L.C. | Diuretic and diuretic-like compound analogs |
| US20070167835A1 (en) * | 2005-07-25 | 2007-07-19 | Massachusetts Institute Of Technology | Tri modal spectroscopic imaging |
| US20070173736A1 (en) * | 2005-10-07 | 2007-07-26 | Femspec Llc | Apparatus and methods for endometrial biopsies |
| US7307774B1 (en) | 2005-01-24 | 2007-12-11 | The Board Of Trustees Of The Leland Standford Junior University | Micro-optical analysis system and approach therefor |
| US7309867B2 (en) | 2003-04-18 | 2007-12-18 | Medispectra, Inc. | Methods and apparatus for characterization of tissue samples |
| EP1877945A2 (en) * | 2005-04-25 | 2008-01-16 | Horiba Jobin Yvon Inc | Method for classification of carbon nanotues and other materials |
| US20080225289A1 (en) * | 2000-12-29 | 2008-09-18 | Chromagen, Inc. | Scanning spectrophotometer for high throughput fluorescence detection and fluorescence polarization |
| US7459696B2 (en) | 2003-04-18 | 2008-12-02 | Schomacker Kevin T | Methods and apparatus for calibrating spectral data |
| US20080309933A1 (en) * | 1999-04-21 | 2008-12-18 | Aries Associates, Inc. | Scanning spectrophotometer for high throughput fluorescence detection |
| US20090157054A1 (en) * | 2007-12-18 | 2009-06-18 | Searete Llc, A Limited Liability Corporation Of The State Of Delaware | Treatment indications informed by a priori implant information |
| US20090258844A1 (en) * | 1998-12-23 | 2009-10-15 | Neurotherapeutics Pharma, Inc. | Compositions and methods for the treatment of disorders of the central and peripheral nervous systems |
| US20090281412A1 (en) * | 2007-12-18 | 2009-11-12 | Searete Llc, A Limited Liability Corporation Of The State Of Delaware | System, devices, and methods for detecting occlusions in a biological subject |
| US20090281413A1 (en) * | 2007-12-18 | 2009-11-12 | Searete Llc, A Limited Liability Corporation Of The State Of Delaware | Systems, devices, and methods for detecting occlusions in a biological subject |
| US20090284378A1 (en) * | 2008-05-13 | 2009-11-19 | Searete Llc, A Limited Liability Corporation Of The State Of Delaware | Circulatory monitoring systems and methods |
| US20090287093A1 (en) * | 2008-05-15 | 2009-11-19 | Searete Llc, A Limited Liability Corporation Of The State Of Delaware | Circulatory monitoring systems and methods |
| US20090287137A1 (en) * | 1996-11-21 | 2009-11-19 | Boston Scientific Corporation | Mucosal ablation |
| US20090287076A1 (en) * | 2007-12-18 | 2009-11-19 | Boyden Edward S | System, devices, and methods for detecting occlusions in a biological subject |
| US20090287110A1 (en) * | 2008-05-14 | 2009-11-19 | Searete Llc | Circulatory monitoring systems and methods |
| US20090292195A1 (en) * | 2007-12-18 | 2009-11-26 | Searete Llc, A Limited Liability Corporation Of The State Of Delaware | System, devices, and methods for detecting occlusions in a biological subject including spectral learning |
| US20090292213A1 (en) * | 2008-05-21 | 2009-11-26 | Searete Llc, A Limited Liability Corporation Of The State Of Delaware | Circulatory monitoring systems and methods |
| US20090292222A1 (en) * | 2008-05-14 | 2009-11-26 | Searete Llc | Circulatory monitoring systems and methods |
| US20090318802A1 (en) * | 2007-12-18 | 2009-12-24 | Searete Llc, A Limited Liability Corporation Of The State Of Delaware | System, devices, and methods for detecting occlusions in a biological subject |
| US20100036269A1 (en) * | 2008-08-07 | 2010-02-11 | Searete Llc, A Limited Liability Corporation Of The State Of Delaware | Circulatory monitoring systems and methods |
| US20100036268A1 (en) * | 2008-08-07 | 2010-02-11 | Searete Llc, A Limited Liability Corporation Of The State Of Delaware | Circulatory monitoring systems and methods |
| US20100036209A1 (en) * | 2008-08-07 | 2010-02-11 | Searete Llc, A Limited Liability Corporation Of The State Of Delaware | Circulatory monitoring systems and methods |
| US20100249607A1 (en) * | 2008-09-26 | 2010-09-30 | Massachusetts Institute Of Technology | Quantitative spectroscopic imaging |
| US20120179010A1 (en) * | 2002-04-04 | 2012-07-12 | Maynard John D | Determination of a Measure of a Glycation End-Product or Disease State Using Tissue Fluorescence of Various Sites |
| US8317776B2 (en) | 2007-12-18 | 2012-11-27 | The Invention Science Fund I, Llc | Circulatory monitoring systems and methods |
| US8346346B1 (en) | 2005-01-24 | 2013-01-01 | The Board Of Trustees Of The Leland Stanford Junior University | Optical analysis system and approach therefor |
| US8788021B1 (en) | 2005-01-24 | 2014-07-22 | The Board Of Trustees Of The Leland Stanford Junior Univerity | Live being optical analysis system and approach |
| US20140303504A1 (en) * | 2011-10-28 | 2014-10-09 | Massachusetts Eye & Ear Infirmary | Tissue and cellular imaging |
| US20160313244A1 (en) * | 2015-04-27 | 2016-10-27 | Panasonic Intellectual Property Management Co., Ltd. | Optical sensing apparatus provided with light source and light detector |
Families Citing this family (18)
| Publication number | Priority date | Publication date | Assignee | Title |
|---|---|---|---|---|
| US5987346A (en) * | 1993-02-26 | 1999-11-16 | Benaron; David A. | Device and method for classification of tissue |
| US5456260A (en) * | 1994-04-05 | 1995-10-10 | The General Hospital Corporation | Fluorescence detection of cell proliferation |
| US6258576B1 (en) | 1996-06-19 | 2001-07-10 | Board Of Regents, The University Of Texas System | Diagnostic method and apparatus for cervical squamous intraepithelial lesions in vitro and in vivo using fluorescence spectroscopy |
| US6201989B1 (en) | 1997-03-13 | 2001-03-13 | Biomax Technologies Inc. | Methods and apparatus for detecting the rejection of transplanted tissue |
| AU752829B2 (en) | 1998-01-26 | 2002-10-03 | Brigham And Women's Hospital | Fluorescence imaging endoscope |
| WO1999057683A1 (en) | 1998-05-04 | 1999-11-11 | The Johns Hopkins University | Method and apparatus for segmenting small structures in images |
| CA2400305A1 (en) * | 2000-02-18 | 2001-08-23 | Argose,Inc. | Generation of spatially-averaged excitation-emission map in heterogeneous tissue |
| WO2002028273A2 (en) | 2000-10-06 | 2002-04-11 | Yang Victor X D | Multi-spectral fluorescence imaging and spectroscopy device |
| JP2004248721A (en) * | 2003-02-18 | 2004-09-09 | Pentax Corp | Device for diagnostic aid |
| US7181219B2 (en) | 2003-05-22 | 2007-02-20 | Lucent Technologies Inc. | Wireless handover using anchor termination |
| US7640046B2 (en) * | 2004-06-18 | 2009-12-29 | Cardiac Pacemakers, Inc. | Methods and apparatuses for localizing myocardial infarction during catheterization |
| WO2006032997A1 (en) * | 2004-09-24 | 2006-03-30 | Art, Advanced Research Technologies Inc. | Optical imaging method for tissue characterization |
| CA2662893A1 (en) * | 2006-09-06 | 2008-03-13 | University Health Network | Fluorescence quantification and image acquisition in highly turbid media |
| CA2620949C (en) * | 2006-12-22 | 2015-08-04 | New Art Advanced Research Technologies Inc. | Method and apparatus for optical image reconstruction using contour determination |
| WO2013109978A1 (en) | 2012-01-20 | 2013-07-25 | University Of Washington Through Its Center For Commercialization | Dental demineralization detection, methods and systems |
| US10080484B2 (en) | 2014-01-31 | 2018-09-25 | University Of Washington | Multispectral wide-field endoscopic imaging of fluorescence |
| US11883132B2 (en) | 2016-10-28 | 2024-01-30 | University Of Washington | System and method for ranking bacterial activity leading to tooth and gum disease |
| WO2023153279A1 (en) * | 2022-02-08 | 2023-08-17 | コニカミノルタ株式会社 | Analysis system and analysis method |
Citations (15)
| Publication number | Priority date | Publication date | Assignee | Title |
|---|---|---|---|---|
| US4178917A (en) * | 1979-01-03 | 1979-12-18 | Shapiro Howard M | Method and system for non-invasive detection of zinc protoporphyrin in erythrocytes |
| US4449535A (en) * | 1981-03-25 | 1984-05-22 | Compagnie Industrielle Des Lasers Cilas Alcatel | Apparatus for measuring in situ the state of oxidation-reduction of a living organ |
| US4479499A (en) * | 1982-01-29 | 1984-10-30 | Alfano Robert R | Method and apparatus for detecting the presence of caries in teeth using visible light |
| US4556057A (en) * | 1982-08-31 | 1985-12-03 | Hamamatsu Tv Co., Ltd. | Cancer diagnosis device utilizing laser beam pulses |
| US4648892A (en) * | 1985-03-22 | 1987-03-10 | Massachusetts Institute Of Technology | Method for making optical shield for a laser catheter |
| US4768516A (en) * | 1983-10-14 | 1988-09-06 | Somanetics Corporation | Method and apparatus for in vivo evaluation of tissue composition |
| US4785806A (en) * | 1987-01-08 | 1988-11-22 | Yale University | Laser ablation process and apparatus |
| US4786813A (en) * | 1984-10-22 | 1988-11-22 | Hightech Network Sci Ab | Fluorescence imaging system |
| US4894547A (en) * | 1987-09-28 | 1990-01-16 | Yale University | Optical method and apparatus for detecting and measuring aging, photoaging, dermal disease and pigmentation in skin |
| US4930516A (en) * | 1985-11-13 | 1990-06-05 | Alfano Robert R | Method for detecting cancerous tissue using visible native luminescence |
| US4957114A (en) * | 1985-04-01 | 1990-09-18 | Kun Zeng | Diagnostic apparatus for intrinsic fluorescence of malignant tumor |
| US5003977A (en) * | 1988-03-31 | 1991-04-02 | Agency Of Industrial Science And Technology | Device for analyzing fluorescent light signals |
| US5042494A (en) * | 1985-11-13 | 1991-08-27 | Alfano Robert R | Method and apparatus for detecting cancerous tissue using luminescence excitation spectra |
| US5046501A (en) * | 1989-01-18 | 1991-09-10 | Wayne State University | Atherosclerotic identification |
| US5062431A (en) * | 1988-11-08 | 1991-11-05 | Health Research, Inc. | In vivo fluorescence photometer |
Family Cites Families (2)
| Publication number | Priority date | Publication date | Assignee | Title |
|---|---|---|---|---|
| US5201318A (en) * | 1989-04-24 | 1993-04-13 | Rava Richard P | Contour mapping of spectral diagnostics |
| US5046502A (en) * | 1990-01-22 | 1991-09-10 | Kunig Horst E | Method and apparatus for measuring cardiac efficiency |
-
1991
- 1991-10-04 US US07/772,620 patent/US5201318A/en not_active Expired - Lifetime
-
1993
- 1993-03-01 US US08/024,674 patent/US5345941A/en not_active Expired - Lifetime
Patent Citations (16)
| Publication number | Priority date | Publication date | Assignee | Title |
|---|---|---|---|---|
| US4178917A (en) * | 1979-01-03 | 1979-12-18 | Shapiro Howard M | Method and system for non-invasive detection of zinc protoporphyrin in erythrocytes |
| US4449535A (en) * | 1981-03-25 | 1984-05-22 | Compagnie Industrielle Des Lasers Cilas Alcatel | Apparatus for measuring in situ the state of oxidation-reduction of a living organ |
| US4479499A (en) * | 1982-01-29 | 1984-10-30 | Alfano Robert R | Method and apparatus for detecting the presence of caries in teeth using visible light |
| US4556057A (en) * | 1982-08-31 | 1985-12-03 | Hamamatsu Tv Co., Ltd. | Cancer diagnosis device utilizing laser beam pulses |
| US4768516A (en) * | 1983-10-14 | 1988-09-06 | Somanetics Corporation | Method and apparatus for in vivo evaluation of tissue composition |
| US4786813A (en) * | 1984-10-22 | 1988-11-22 | Hightech Network Sci Ab | Fluorescence imaging system |
| US4648892A (en) * | 1985-03-22 | 1987-03-10 | Massachusetts Institute Of Technology | Method for making optical shield for a laser catheter |
| US4957114A (en) * | 1985-04-01 | 1990-09-18 | Kun Zeng | Diagnostic apparatus for intrinsic fluorescence of malignant tumor |
| US5042494A (en) * | 1985-11-13 | 1991-08-27 | Alfano Robert R | Method and apparatus for detecting cancerous tissue using luminescence excitation spectra |
| US4930516A (en) * | 1985-11-13 | 1990-06-05 | Alfano Robert R | Method for detecting cancerous tissue using visible native luminescence |
| US4930516B1 (en) * | 1985-11-13 | 1998-08-04 | Laser Diagnostic Instr Inc | Method for detecting cancerous tissue using visible native luminescence |
| US4785806A (en) * | 1987-01-08 | 1988-11-22 | Yale University | Laser ablation process and apparatus |
| US4894547A (en) * | 1987-09-28 | 1990-01-16 | Yale University | Optical method and apparatus for detecting and measuring aging, photoaging, dermal disease and pigmentation in skin |
| US5003977A (en) * | 1988-03-31 | 1991-04-02 | Agency Of Industrial Science And Technology | Device for analyzing fluorescent light signals |
| US5062431A (en) * | 1988-11-08 | 1991-11-05 | Health Research, Inc. | In vivo fluorescence photometer |
| US5046501A (en) * | 1989-01-18 | 1991-09-10 | Wayne State University | Atherosclerotic identification |
Non-Patent Citations (4)
| Title |
|---|
| Pottier et al., Photochemistry & Photobiology, vol. 44, No. 5, pp. 679 687 (1986). * |
| Pottier et al., Photochemistry & Photobiology, vol. 44, No. 5, pp. 679-687 (1986). |
| Publication, "Tumour Localization by Means of Laser-Induced Fluorescence in Hematoporphyrin Derivative (HPD) Bearing Tissue". |
| Publication, Tumour Localization by Means of Laser Induced Fluorescence in Hematoporphyrin Derivative (HPD) Bearing Tissue . * |
Cited By (156)
| Publication number | Priority date | Publication date | Assignee | Title |
|---|---|---|---|---|
| US5421337A (en) * | 1989-04-14 | 1995-06-06 | Massachusetts Institute Of Technology | Spectral diagnosis of diseased tissue |
| US5345941A (en) * | 1989-04-24 | 1994-09-13 | Massachusetts Institute Of Technology | Contour mapping of spectral diagnostics |
| US5363855A (en) * | 1990-03-27 | 1994-11-15 | Rutgers University | Pressure waveform monitor |
| US6241672B1 (en) * | 1990-08-10 | 2001-06-05 | University Of Washington | Method and apparatus for optically imaging solid tumor tissue |
| US6671540B1 (en) * | 1990-08-10 | 2003-12-30 | Daryl W. Hochman | Methods and systems for detecting abnormal tissue using spectroscopic techniques |
| US5421339A (en) * | 1993-05-12 | 1995-06-06 | Board Of Regents, The University Of Texas System | Diagnosis of dysplasia using laser induced fluoroescence |
| US5640957A (en) * | 1993-09-29 | 1997-06-24 | Instruments Sa, Inc. | Ultraviolet radiation protection evaluator |
| US5697373A (en) * | 1995-03-14 | 1997-12-16 | Board Of Regents, The University Of Texas System | Optical method and apparatus for the diagnosis of cervical precancers using raman and fluorescence spectroscopies |
| US5991653A (en) * | 1995-03-14 | 1999-11-23 | Board Of Regents, The University Of Texas System | Near-infrared raman spectroscopy for in vitro and in vivo detection of cervical precancers |
| US6095982A (en) * | 1995-03-14 | 2000-08-01 | Board Of Regents, The University Of Texas System | Spectroscopic method and apparatus for optically detecting abnormal mammalian epithelial tissue |
| US5699795A (en) * | 1995-03-31 | 1997-12-23 | Board Of Regents, The University Of Texas System | Optical probe for the detection of cervical neoplasia using fluorescence spectroscopy and apparatus incorporating same |
| US5612540A (en) * | 1995-03-31 | 1997-03-18 | Board Of Regents, The University Of Texas Systems | Optical method for the detection of cervical neoplasias using fluorescence spectroscopy |
| US6104945A (en) * | 1995-08-01 | 2000-08-15 | Medispectra, Inc. | Spectral volume microprobe arrays |
| US5713364A (en) * | 1995-08-01 | 1998-02-03 | Medispectra, Inc. | Spectral volume microprobe analysis of materials |
| US5813987A (en) * | 1995-08-01 | 1998-09-29 | Medispectra, Inc. | Spectral volume microprobe for analysis of materials |
| FR2737845A1 (en) * | 1995-08-16 | 1997-02-21 | Centre Nat Rech Scient | ENDOSCOPIC IMAGING DEVICE FOR THE EARLY DETECTION OF CANCERIOUS OR PRECANCEROUS SURFACE LESIONS |
| WO1997006724A1 (en) * | 1995-08-16 | 1997-02-27 | Centre National De La Recherche Scientifique (Cnrs) | Endoscopic imaging for the detection of cancer lesions |
| US5842995A (en) * | 1996-06-28 | 1998-12-01 | Board Of Regents, The Univerisity Of Texas System | Spectroscopic probe for in vivo measurement of raman signals |
| US8126531B2 (en) | 1996-11-21 | 2012-02-28 | Boston Scientific Scimed, Inc. | Miniature spectrometer |
| US6343227B1 (en) | 1996-11-21 | 2002-01-29 | Boston Scientific Corporation | Miniature spectrometer |
| US6119031A (en) * | 1996-11-21 | 2000-09-12 | Boston Scientific Corporation | Miniature spectrometer |
| US20020115918A1 (en) * | 1996-11-21 | 2002-08-22 | Crowley Robert J. | Miniature spectrometer |
| US8660637B2 (en) | 1996-11-21 | 2014-02-25 | Boston Scientific Scimed, Inc. | Miniature spectrometer |
| US20090287137A1 (en) * | 1996-11-21 | 2009-11-19 | Boston Scientific Corporation | Mucosal ablation |
| US6135965A (en) * | 1996-12-02 | 2000-10-24 | Board Of Regents, The University Of Texas System | Spectroscopic detection of cervical pre-cancer using radial basis function networks |
| US20040186382A1 (en) * | 1997-01-13 | 2004-09-23 | Medispectra, Inc. | Spectral volume microprobe arrays |
| US20050159646A1 (en) * | 1997-01-13 | 2005-07-21 | Medispectra, Inc. | Optical probe accessory device for use in in vivo diagnostic procedures |
| US6847490B1 (en) | 1997-01-13 | 2005-01-25 | Medispectra, Inc. | Optical probe accessory device for use in vivo diagnostic procedures |
| US6826422B1 (en) | 1997-01-13 | 2004-11-30 | Medispectra, Inc. | Spectral volume microprobe arrays |
| US6405073B1 (en) | 1997-07-22 | 2002-06-11 | Scimed Life Systems, Inc. | Miniature spectrometer system and method |
| US6393315B1 (en) | 1997-09-12 | 2002-05-21 | Communaute Europeenne | Detecting and mapping of inflamed zones in a living tissue |
| WO1999013764A1 (en) * | 1997-09-12 | 1999-03-25 | Communaute Europeenne | Detecting and mapping inflamed zones in a living tissue |
| US6383209B1 (en) | 1997-09-29 | 2002-05-07 | Boston Scientific Corporation | Sheath for tissue spectroscopy |
| US6324418B1 (en) | 1997-09-29 | 2001-11-27 | Boston Scientific Corporation | Portable tissue spectroscopy apparatus and method |
| US6882875B1 (en) | 1997-09-29 | 2005-04-19 | Boston Scientific Corporation | Visible display for an interventional device |
| US6185443B1 (en) | 1997-09-29 | 2001-02-06 | Boston Scientific Corporation | Visible display for an interventional device |
| US5984861A (en) * | 1997-09-29 | 1999-11-16 | Boston Scientific Corporation | Endofluorescence imaging module for an endoscope |
| US6364831B1 (en) | 1997-09-29 | 2002-04-02 | Boston Scientific Corporation | Endofluorescence imaging module for an endoscope |
| US6096065A (en) * | 1997-09-29 | 2000-08-01 | Boston Scientific Corporation | Sheath for tissue spectroscopy |
| US6055451A (en) * | 1997-12-12 | 2000-04-25 | Spectrx, Inc. | Apparatus and method for determining tissue characteristics |
| US20030135122A1 (en) * | 1997-12-12 | 2003-07-17 | Spectrx, Inc. | Multi-modal optical tissue diagnostic system |
| US8140148B2 (en) | 1998-01-20 | 2012-03-20 | Boston Scientific Scimed Ltd. | Readable probe array for in vivo use |
| US7302289B2 (en) | 1998-01-20 | 2007-11-27 | Scimed Life Systems, Inc. | Readable probe array for in-vivo use |
| US6289229B1 (en) | 1998-01-20 | 2001-09-11 | Scimed Life Systems, Inc. | Readable probe array for in vivo use |
| US6174291B1 (en) | 1998-03-09 | 2001-01-16 | Spectrascience, Inc. | Optical biopsy system and methods for tissue diagnosis |
| US20060195022A1 (en) * | 1998-04-06 | 2006-08-31 | Pierre Trepagnier | Non-invasive tissue glucose level monitoring |
| US7899518B2 (en) * | 1998-04-06 | 2011-03-01 | Masimo Laboratories, Inc. | Non-invasive tissue glucose level monitoring |
| US20060089556A1 (en) * | 1998-09-11 | 2006-04-27 | Spectrx, Inc. | Multi-modal optical tissue diagnostic system |
| US20020177777A1 (en) * | 1998-12-23 | 2002-11-28 | Medispectra, Inc. | Optical methods and systems for rapid screening of the cervix |
| US8722668B2 (en) | 1998-12-23 | 2014-05-13 | Daryl W. Hochman | Methods and compositions for the treatment of neuropathic pain and neuropsychiatric disorders |
| US20050033186A1 (en) * | 1998-12-23 | 2005-02-10 | Medispectra, Inc. | Substantially monostatic, substantially confocal optical systems for examination of samples |
| US7127282B2 (en) | 1998-12-23 | 2006-10-24 | Medispectra, Inc. | Optical methods and systems for rapid screening of the cervix |
| US20050267103A1 (en) * | 1998-12-23 | 2005-12-01 | Cytoscan Sciences Llc | Methods and compositions for the treatment of neuropathic pain and neuropsychiatric disorders |
| US20090215754A1 (en) * | 1998-12-23 | 2009-08-27 | Hochman Daryl W | Methods and compositions for the treatment of neuropsychiatric and addictive disorders |
| US6385484B2 (en) | 1998-12-23 | 2002-05-07 | Medispectra, Inc. | Spectroscopic system employing a plurality of data types |
| US6760613B2 (en) | 1998-12-23 | 2004-07-06 | Medispectra, Inc. | Substantially monostatic, substantially confocal optical systems for examination of samples |
| US20020133073A1 (en) * | 1998-12-23 | 2002-09-19 | Nordstrom Robert J. | Spectroscopic system employing a plurality of data types |
| US20090258844A1 (en) * | 1998-12-23 | 2009-10-15 | Neurotherapeutics Pharma, Inc. | Compositions and methods for the treatment of disorders of the central and peripheral nervous systems |
| US20060089350A1 (en) * | 1998-12-23 | 2006-04-27 | Neurotherapeutics Pharma Llc | Methods and compositions for the treatment of neuropsychiatric disorders |
| US8008283B2 (en) | 1998-12-23 | 2011-08-30 | Neurotherapeutics Pharma, Inc. | Methods and compositions for the treatment of neuropsychiatric disorders |
| US6411838B1 (en) | 1998-12-23 | 2002-06-25 | Medispectra, Inc. | Systems and methods for optical examination of samples |
| US20080309933A1 (en) * | 1999-04-21 | 2008-12-18 | Aries Associates, Inc. | Scanning spectrophotometer for high throughput fluorescence detection |
| US20080309934A1 (en) * | 1999-04-21 | 2008-12-18 | Aries Associates, Inc. | Scanning spectrophotometer for high throughput fluorescence detection |
| US6697666B1 (en) | 1999-06-22 | 2004-02-24 | Board Of Regents, The University Of Texas System | Apparatus for the characterization of tissue of epithelial lined viscus |
| WO2001008552A1 (en) * | 1999-08-03 | 2001-02-08 | Biophysica, Llc | Spectroscopic systems and methods for detecting tissue properties |
| US20030236458A1 (en) * | 1999-08-03 | 2003-12-25 | Biophysica Llc | Spectroscopic systems and methods for detecting tissue properties |
| US20040147843A1 (en) * | 1999-11-05 | 2004-07-29 | Shabbir Bambot | System and method for determining tissue characteristics |
| US6902935B2 (en) | 1999-12-15 | 2005-06-07 | Medispectra, Inc. | Methods of monitoring effects of chemical agents on a sample |
| US7260248B2 (en) | 1999-12-15 | 2007-08-21 | Medispectra, Inc. | Image processing using measures of similarity |
| US20020127735A1 (en) * | 1999-12-15 | 2002-09-12 | Howard Kaufman | Methods of monitoring effects of chemical agents on a sample |
| US20020197728A1 (en) * | 1999-12-15 | 2002-12-26 | Howard Kaufman | Methods of monitoring effects of chemical agents on a sample |
| US20030095721A1 (en) * | 1999-12-15 | 2003-05-22 | Thomas Clune | Methods and systems for correcting image misalignment |
| US20050064602A1 (en) * | 1999-12-15 | 2005-03-24 | Medispectra, Inc. | Methods of monitoring effects of chemical agents on a sample |
| US20030144585A1 (en) * | 1999-12-15 | 2003-07-31 | Howard Kaufman | Image processing using measures of similarity |
| US7187810B2 (en) | 1999-12-15 | 2007-03-06 | Medispectra, Inc. | Methods and systems for correcting image misalignment |
| US20030207250A1 (en) * | 1999-12-15 | 2003-11-06 | Medispectra, Inc. | Methods of diagnosing disease |
| WO2002024048A3 (en) * | 2000-09-25 | 2002-07-18 | Vital Medical Ltd | Apparatus and method for monitoring tissue vitality parameters |
| US20070179366A1 (en) * | 2000-09-25 | 2007-08-02 | Critisense Ltd. | Apparatus and Method for Monitoring Tissue Vitality Parameters |
| US20040054270A1 (en) * | 2000-09-25 | 2004-03-18 | Eliahu Pewzner | Apparatus and method for monitoring tissue vitality parameters |
| US7130672B2 (en) | 2000-09-25 | 2006-10-31 | Critisense Ltd. | Apparatus and method for monitoring tissue vitality parameters |
| US20050043929A1 (en) * | 2000-12-15 | 2005-02-24 | Medispectra, Inc. | System for normalizing spectra |
| US6839661B2 (en) | 2000-12-15 | 2005-01-04 | Medispectra, Inc. | System for normalizing spectra |
| US20080225289A1 (en) * | 2000-12-29 | 2008-09-18 | Chromagen, Inc. | Scanning spectrophotometer for high throughput fluorescence detection and fluorescence polarization |
| US6912412B2 (en) | 2001-01-19 | 2005-06-28 | Massachusetts Institute Of Technology | System and methods of fluorescence, reflectance and light scattering spectroscopy for measuring tissue characteristics |
| US6697652B2 (en) | 2001-01-19 | 2004-02-24 | Massachusetts Institute Of Technology | Fluorescence, reflectance and light scattering spectroscopy for measuring tissue |
| US20050288593A1 (en) * | 2001-01-19 | 2005-12-29 | Massachusetts Institute Of Technology | System and methods of fluorescence, reflectance and light scattering spectroscopy for measuring tissue characteristics |
| US8380268B2 (en) | 2001-01-19 | 2013-02-19 | Massachusetts Institute Of Technology | System and methods of fluorescence, reflectance and light scattering spectroscopy for measuring tissue characteristics |
| US20020102213A1 (en) * | 2001-01-30 | 2002-08-01 | Yamato Scientific Co., Ltd. | Tissue mapping method and tissue map analyzer |
| US20050234315A1 (en) * | 2002-03-20 | 2005-10-20 | Avraham Mayevsky | Diagnosis of body metabolic emergency state |
| US20060161055A1 (en) * | 2002-03-20 | 2006-07-20 | Critisense, Ltd. | Probe design |
| US7313424B2 (en) | 2002-03-20 | 2007-12-25 | Critisense Ltd. | Diagnosis of body metabolic emergency state |
| US20120179010A1 (en) * | 2002-04-04 | 2012-07-12 | Maynard John D | Determination of a Measure of a Glycation End-Product or Disease State Using Tissue Fluorescence of Various Sites |
| US20040010375A1 (en) * | 2002-07-09 | 2004-01-15 | Medispectra, Inc. | Methods and apparatus for processing spectral data for use in tissue characterization |
| US6818903B2 (en) | 2002-07-09 | 2004-11-16 | Medispectra, Inc. | Method and apparatus for identifying spectral artifacts |
| US20040214156A1 (en) * | 2002-07-09 | 2004-10-28 | Medispectra, Inc. | Method and apparatus for identifying spectral artifacts |
| US20040007674A1 (en) * | 2002-07-09 | 2004-01-15 | Schomacker Kevin T. | Method and apparatus for identifying spectral artifacts |
| US7282723B2 (en) | 2002-07-09 | 2007-10-16 | Medispectra, Inc. | Methods and apparatus for processing spectral data for use in tissue characterization |
| US6933154B2 (en) | 2002-07-09 | 2005-08-23 | Medispectra, Inc. | Optimal windows for obtaining optical data for characterization of tissue samples |
| US20040023406A1 (en) * | 2002-07-09 | 2004-02-05 | Schomacker Kevin T. | Optimal windows for obtaining optical data for characterization of tissue samples |
| US6768918B2 (en) | 2002-07-10 | 2004-07-27 | Medispectra, Inc. | Fluorescent fiberoptic probe for tissue health discrimination and method of use thereof |
| US7310547B2 (en) | 2002-07-10 | 2007-12-18 | Medispectra, Inc. | Fluorescent fiberoptic probe for tissue health discrimination |
| US8005527B2 (en) | 2002-07-10 | 2011-08-23 | Luma Imaging Corporation | Method of determining a condition of a tissue |
| US20080091110A1 (en) * | 2002-07-10 | 2008-04-17 | Zelenchuk Alex R | Fluorescent Fiberoptic Probe for Tissue Health Discrimination and Method of Use Thereof |
| US20050043635A1 (en) * | 2002-07-10 | 2005-02-24 | Medispectra, Inc. | Fluorescent fiberoptic probe for tissue health discrimination and method of use thereof |
| US7103401B2 (en) | 2002-07-10 | 2006-09-05 | Medispectra, Inc. | Colonic polyp discrimination by tissue fluorescence and fiberoptic probe |
| US20040064053A1 (en) * | 2002-09-30 | 2004-04-01 | Chang Sung K. | Diagnostic fluorescence and reflectance |
| US7309867B2 (en) | 2003-04-18 | 2007-12-18 | Medispectra, Inc. | Methods and apparatus for characterization of tissue samples |
| US20040206882A1 (en) * | 2003-04-18 | 2004-10-21 | Medispectra, Inc. | Methods and apparatus for evaluating image focus |
| US7469160B2 (en) | 2003-04-18 | 2008-12-23 | Banks Perry S | Methods and apparatus for evaluating image focus |
| US20110110567A1 (en) * | 2003-04-18 | 2011-05-12 | Chunsheng Jiang | Methods and Apparatus for Visually Enhancing Images |
| US7136518B2 (en) | 2003-04-18 | 2006-11-14 | Medispectra, Inc. | Methods and apparatus for displaying diagnostic data |
| US20040208390A1 (en) * | 2003-04-18 | 2004-10-21 | Medispectra, Inc. | Methods and apparatus for processing image data for use in tissue characterization |
| US20040209237A1 (en) * | 2003-04-18 | 2004-10-21 | Medispectra, Inc. | Methods and apparatus for characterization of tissue samples |
| US20040208385A1 (en) * | 2003-04-18 | 2004-10-21 | Medispectra, Inc. | Methods and apparatus for visually enhancing images |
| US20040207625A1 (en) * | 2003-04-18 | 2004-10-21 | Medispectra, Inc. | Methods and apparatus for displaying diagnostic data |
| US7459696B2 (en) | 2003-04-18 | 2008-12-02 | Schomacker Kevin T | Methods and apparatus for calibrating spectral data |
| US9636020B2 (en) | 2005-01-24 | 2017-05-02 | The Board Of Trustees Of The Leland Stanford Junior University | Live being optical analysis system and approach |
| US8788021B1 (en) | 2005-01-24 | 2014-07-22 | The Board Of Trustees Of The Leland Stanford Junior Univerity | Live being optical analysis system and approach |
| US9161694B2 (en) | 2005-01-24 | 2015-10-20 | The Board Of Trustees Of The Leland Stanford Junior University | Optical analysis system and approach therefor |
| US7307774B1 (en) | 2005-01-24 | 2007-12-11 | The Board Of Trustees Of The Leland Standford Junior University | Micro-optical analysis system and approach therefor |
| US8346346B1 (en) | 2005-01-24 | 2013-01-01 | The Board Of Trustees Of The Leland Stanford Junior University | Optical analysis system and approach therefor |
| US9839361B2 (en) | 2005-01-24 | 2017-12-12 | The Board Of Trustees Of The Leland Stanford Junior University | Optical analysis system and approach therefor |
| EP1877945A4 (en) * | 2005-04-25 | 2012-11-21 | Horiba Jobin Yvon Inc | Method for classification of carbon nanotues and other materials |
| EP1877945A2 (en) * | 2005-04-25 | 2008-01-16 | Horiba Jobin Yvon Inc | Method for classification of carbon nanotues and other materials |
| US20070038120A1 (en) * | 2005-07-05 | 2007-02-15 | The Board Of Regents Of The University Of Texas | Depth-Resolved Spectroscopy Method and Apparatus |
| US7499161B2 (en) | 2005-07-05 | 2009-03-03 | The Board Of Regents Of The University Of Texas System | Depth-resolved spectroscopy method and apparatus |
| US20070167835A1 (en) * | 2005-07-25 | 2007-07-19 | Massachusetts Institute Of Technology | Tri modal spectroscopic imaging |
| US20070173736A1 (en) * | 2005-10-07 | 2007-07-26 | Femspec Llc | Apparatus and methods for endometrial biopsies |
| US20070149526A1 (en) * | 2005-10-17 | 2007-06-28 | Neurotherapeutics Pharma, L.L.C. | Diuretic and diuretic-like compound analogs |
| US8280484B2 (en) | 2007-12-18 | 2012-10-02 | The Invention Science Fund I, Llc | System, devices, and methods for detecting occlusions in a biological subject |
| US8870813B2 (en) | 2007-12-18 | 2014-10-28 | The Invention Science Fund I, Llc | Circulatory monitoring systems and methods |
| US20090157054A1 (en) * | 2007-12-18 | 2009-06-18 | Searete Llc, A Limited Liability Corporation Of The State Of Delaware | Treatment indications informed by a priori implant information |
| US9717896B2 (en) | 2007-12-18 | 2017-08-01 | Gearbox, Llc | Treatment indications informed by a priori implant information |
| US9672471B2 (en) | 2007-12-18 | 2017-06-06 | Gearbox Llc | Systems, devices, and methods for detecting occlusions in a biological subject including spectral learning |
| US20090318802A1 (en) * | 2007-12-18 | 2009-12-24 | Searete Llc, A Limited Liability Corporation Of The State Of Delaware | System, devices, and methods for detecting occlusions in a biological subject |
| US20090157055A1 (en) * | 2007-12-18 | 2009-06-18 | Searete Llc, A Lomited Liability Corporation Of The State Of Delaware | Treatment indications informed by a priori implant information |
| US20090281412A1 (en) * | 2007-12-18 | 2009-11-12 | Searete Llc, A Limited Liability Corporation Of The State Of Delaware | System, devices, and methods for detecting occlusions in a biological subject |
| US20090292195A1 (en) * | 2007-12-18 | 2009-11-26 | Searete Llc, A Limited Liability Corporation Of The State Of Delaware | System, devices, and methods for detecting occlusions in a biological subject including spectral learning |
| US8317776B2 (en) | 2007-12-18 | 2012-11-27 | The Invention Science Fund I, Llc | Circulatory monitoring systems and methods |
| US20090281413A1 (en) * | 2007-12-18 | 2009-11-12 | Searete Llc, A Limited Liability Corporation Of The State Of Delaware | Systems, devices, and methods for detecting occlusions in a biological subject |
| US20090287076A1 (en) * | 2007-12-18 | 2009-11-19 | Boyden Edward S | System, devices, and methods for detecting occlusions in a biological subject |
| US8403881B2 (en) | 2007-12-18 | 2013-03-26 | The Invention Science Fund I, Llc | Circulatory monitoring systems and methods |
| US8409132B2 (en) | 2007-12-18 | 2013-04-02 | The Invention Science Fund I, Llc | Treatment indications informed by a priori implant information |
| US8636670B2 (en) | 2008-05-13 | 2014-01-28 | The Invention Science Fund I, Llc | Circulatory monitoring systems and methods |
| US20090284378A1 (en) * | 2008-05-13 | 2009-11-19 | Searete Llc, A Limited Liability Corporation Of The State Of Delaware | Circulatory monitoring systems and methods |
| US20090287110A1 (en) * | 2008-05-14 | 2009-11-19 | Searete Llc | Circulatory monitoring systems and methods |
| US20090292222A1 (en) * | 2008-05-14 | 2009-11-26 | Searete Llc | Circulatory monitoring systems and methods |
| US20090287093A1 (en) * | 2008-05-15 | 2009-11-19 | Searete Llc, A Limited Liability Corporation Of The State Of Delaware | Circulatory monitoring systems and methods |
| US20090292213A1 (en) * | 2008-05-21 | 2009-11-26 | Searete Llc, A Limited Liability Corporation Of The State Of Delaware | Circulatory monitoring systems and methods |
| US20100036269A1 (en) * | 2008-08-07 | 2010-02-11 | Searete Llc, A Limited Liability Corporation Of The State Of Delaware | Circulatory monitoring systems and methods |
| US20100036268A1 (en) * | 2008-08-07 | 2010-02-11 | Searete Llc, A Limited Liability Corporation Of The State Of Delaware | Circulatory monitoring systems and methods |
| US20100036209A1 (en) * | 2008-08-07 | 2010-02-11 | Searete Llc, A Limited Liability Corporation Of The State Of Delaware | Circulatory monitoring systems and methods |
| US20100249607A1 (en) * | 2008-09-26 | 2010-09-30 | Massachusetts Institute Of Technology | Quantitative spectroscopic imaging |
| US20140303504A1 (en) * | 2011-10-28 | 2014-10-09 | Massachusetts Eye & Ear Infirmary | Tissue and cellular imaging |
| US10022042B2 (en) * | 2011-10-28 | 2018-07-17 | Massachusetts Eye & Ear Infirmary | Tissue and cellular imaging |
| US20160313244A1 (en) * | 2015-04-27 | 2016-10-27 | Panasonic Intellectual Property Management Co., Ltd. | Optical sensing apparatus provided with light source and light detector |
Also Published As
| Publication number | Publication date |
|---|---|
| US5345941A (en) | 1994-09-13 |
Similar Documents
| Publication | Publication Date | Title |
|---|---|---|
| US5201318A (en) | Contour mapping of spectral diagnostics | |
| US5419323A (en) | Method for laser induced fluorescence of tissue | |
| US11717166B2 (en) | Method and apparatus for the non-invasive measurement of tissue function and metabolism by determination of steady-state fluorescence anisotropy | |
| US5042494A (en) | Method and apparatus for detecting cancerous tissue using luminescence excitation spectra | |
| US6697665B1 (en) | Systems and methods of molecular spectroscopy to provide for the diagnosis of tissue | |
| US6377841B1 (en) | Tumor demarcation using optical spectroscopy | |
| CA2658811C (en) | Multi modal spectroscopy | |
| CN100533127C (en) | Use of high wavenumber raman spectroscopy for measuring tissue | |
| US4930516A (en) | Method for detecting cancerous tissue using visible native luminescence | |
| Loschenov et al. | Photodynamic therapy and fluorescence diagnostics | |
| US6208887B1 (en) | Catheter-delivered low resolution Raman scattering analyzing system for detecting lesions | |
| EP2725967B1 (en) | An apparatus for optical analysis of an associated tissue sample | |
| EP2325623A2 (en) | Systems and methods for spectroscopy of biological tissue | |
| US6665556B1 (en) | Method and apparatus for examining a tissue using the spectral wing emission therefrom induced by visible to infrared photoexcitation | |
| US20040044287A1 (en) | Identification of human tissue using optical spectroscopy | |
| van de Poll et al. | Raman spectroscopy of atherosclerosis | |
| Devoisselle et al. | Measurement of in vivo tumorous/normal tissue pH by localized spectroscopy using a fluorescent marker | |
| WO2012127378A1 (en) | An apparatus for optical analysis of an associated tissue sample | |
| Borisova et al. | Multispectral autofluorescence diagnosis of non-melanoma cutaneous tumors | |
| Khristoforova et al. | The study of ex vivo and in vivo skin neoplasms using near-infrared fluorescence spectroscopy | |
| Van de Poll et al. | Prospects of laser spectroscopy to detect vulnerable plaque | |
| Feld | SURVEY OF THE UVAND VISIBLE SPECTROSCOPIC PROPERTIES OF NORMAL AND ATHEROSCLEROTIC HUMAN ARTERY USING FLUORESCENCE EEMS | |
| Kim | Development of a real time trimodal spectroscopy diagnostic tool for Barrett's esophagus | |
| Gavryushin et al. | The role of neopterin in the fluorescence investigations of biotissue pathology | |
| Yova et al. | Interpretation of diagnostic implications of fluorescence parameters for atherosclerosis in fibrous, calcified and normal arteries |
Legal Events
| Date | Code | Title | Description |
|---|---|---|---|
| AS | Assignment |
Owner name: MASSACHUSETTS INSTITUTE OF TECHNOLOGY, MASSACHUSET Free format text: ASSIGNMENT OF ASSIGNORS INTEREST.;ASSIGNOR:RICHARDS-KORTUM, REBECCA;REEL/FRAME:006423/0327 Effective date: 19930202 Owner name: MASSACHUSETTS INSTITUTE OF TECHNOLOGY, MASSACHUSET Free format text: ASSIGNMENT OF ASSIGNORS INTEREST.;ASSIGNOR:RAVA, RICHARD;REEL/FRAME:006419/0087 Effective date: 19930104 |
|
| STCF | Information on status: patent grant |
Free format text: PATENTED CASE |
|
| AS | Assignment |
Owner name: MASSACHUSETTS INSTITUTE OF TECHNOLOGY, MASSACHUSET Free format text: ASSIGNMENT OF ASSIGNORS INTEREST.;ASSIGNOR:BARAGA, JOSEPH;REEL/FRAME:006490/0491 Effective date: 19930323 |
|
| FEPP | Fee payment procedure |
Free format text: PAYOR NUMBER ASSIGNED (ORIGINAL EVENT CODE: ASPN); ENTITY STATUS OF PATENT OWNER: SMALL ENTITY |
|
| FEPP | Fee payment procedure |
Free format text: PAT HOLDER CLAIMS SMALL ENTITY STATUS - SMALL BUSINESS (ORIGINAL EVENT CODE: SM02); ENTITY STATUS OF PATENT OWNER: SMALL ENTITY |
|
| FPAY | Fee payment |
Year of fee payment: 4 |
|
| REMI | Maintenance fee reminder mailed | ||
| FPAY | Fee payment |
Year of fee payment: 8 |
|
| SULP | Surcharge for late payment |
Year of fee payment: 7 |
|
| FPAY | Fee payment |
Year of fee payment: 12 |
|
| FEPP | Fee payment procedure |
Free format text: PAYER NUMBER DE-ASSIGNED (ORIGINAL EVENT CODE: RMPN); ENTITY STATUS OF PATENT OWNER: SMALL ENTITY Free format text: PAYOR NUMBER ASSIGNED (ORIGINAL EVENT CODE: ASPN); ENTITY STATUS OF PATENT OWNER: SMALL ENTITY |