US5991752A - Method and apparatus for deriving association rules from data and for segmenting rectilinear regions - Google Patents
Method and apparatus for deriving association rules from data and for segmenting rectilinear regions Download PDFInfo
- Publication number
- US5991752A US5991752A US09/025,536 US2553698A US5991752A US 5991752 A US5991752 A US 5991752A US 2553698 A US2553698 A US 2553698A US 5991752 A US5991752 A US 5991752A
- Authority
- US
- United States
- Prior art keywords
- column
- rectilinear
- section
- region
- regions
- Prior art date
- Legal status (The legal status is an assumption and is not a legal conclusion. Google has not performed a legal analysis and makes no representation as to the accuracy of the status listed.)
- Expired - Lifetime
Links
Images

Classifications
-
- G—PHYSICS
- G06—COMPUTING; CALCULATING OR COUNTING
- G06Q—INFORMATION AND COMMUNICATION TECHNOLOGY [ICT] SPECIALLY ADAPTED FOR ADMINISTRATIVE, COMMERCIAL, FINANCIAL, MANAGERIAL OR SUPERVISORY PURPOSES; SYSTEMS OR METHODS SPECIALLY ADAPTED FOR ADMINISTRATIVE, COMMERCIAL, FINANCIAL, MANAGERIAL OR SUPERVISORY PURPOSES, NOT OTHERWISE PROVIDED FOR
- G06Q40/00—Finance; Insurance; Tax strategies; Processing of corporate or income taxes
- G06Q40/02—Banking, e.g. interest calculation or account maintenance
-
- G—PHYSICS
- G06—COMPUTING; CALCULATING OR COUNTING
- G06F—ELECTRIC DIGITAL DATA PROCESSING
- G06F16/00—Information retrieval; Database structures therefor; File system structures therefor
- G06F16/20—Information retrieval; Database structures therefor; File system structures therefor of structured data, e.g. relational data
- G06F16/28—Databases characterised by their database models, e.g. relational or object models
- G06F16/289—Object oriented databases
-
- Y—GENERAL TAGGING OF NEW TECHNOLOGICAL DEVELOPMENTS; GENERAL TAGGING OF CROSS-SECTIONAL TECHNOLOGIES SPANNING OVER SEVERAL SECTIONS OF THE IPC; TECHNICAL SUBJECTS COVERED BY FORMER USPC CROSS-REFERENCE ART COLLECTIONS [XRACs] AND DIGESTS
- Y10—TECHNICAL SUBJECTS COVERED BY FORMER USPC
- Y10S—TECHNICAL SUBJECTS COVERED BY FORMER USPC CROSS-REFERENCE ART COLLECTIONS [XRACs] AND DIGESTS
- Y10S707/00—Data processing: database and file management or data structures
- Y10S707/99931—Database or file accessing
- Y10S707/99933—Query processing, i.e. searching
- Y10S707/99936—Pattern matching access
Definitions
- the present invention relates generally to analysis of data correlation in a database (referred to as data mining), and more particularly to a method and apparatus for finding a correlation between data items having two terms of numeric attributes and one term of true-false attribute (a true-false condition or 0-1 attribute).
- the floating deposit balance and age are integers which are continuous numeric values, while the time deposit balance of two million yen or more is a classification of not less than two million yen or less than two million yen.
- the time deposit balance therefore has a true-false attribute.
- a true-false attribute may represent, for instance, a question such as "Does the customer have a credit card?” or "is the customer male?" If such a query can be solved, the bank can easily find out, for instance, who it should send a new product advertisement to in order to efficiently conduct its business.
- association rule a rule to represent a correlation between true-false attributes
- Techniques of searching for a straight line in a plane that optimally approximates a set of points to find a strong linear correlation include, for example, least squares methods, recurrent center methods, etc.
- a drawback of these methods is that only a linear correlation can be found. Also, their accuracy is low if each data is predicated using the linear correlation and the absolute value of the correlation coefficient is 0.5 or less. Their usefulness is therefore limited.
- a subject to be analyzed has many numeric attributes. By selecting two numeric attributes from them, and performing the following steps for the two numerical attributes and a true-false attribute, the above objects are attained.
- a plane is constructed by two numeric attributes. This plane is divided into pixels, and the number of data in each pixel and the number of data in each pixel, whose true-false attribute is true, are counted. Such plane may be grasped as a plane image having a plurality of pixels, in which the number of data corresponds to gradation, and the number of data whose true-false attribute is true corresponds to chroma.
- a rectilinear region which is a region convex to the two axes of the plane, is segmented to find an association rule between data.
- the rectilinear region satisfies the condition such as the above-mentioned support maximization rule, the rectilinear region is presented to the user. Further, the necessary attributes of the data contained in the rectilinear region are extracted from a database as needed.
- segmented rectilinear region may be directly presented to the user, or if a plurality of rectilinear regions are segmented, they may be visualized as motion pictures to help find a desired association rule.
- the chroma is averaged for the segmented rectilinear region to find other association rules, and the segmentation step is again executed.
- an axis of floating deposit balance and an axis of age are provided, and their plane is divided into an appropriate mesh. Then, for a pixel which is each element of the mesh, the number of corresponding customers and the number of customers having a time deposit balance not less than two million yen are counted. And, for instance, by segmenting a region which is a rectilinear region in which 20% of the total customers is included and the proportion of customers having a time deposit balance not less than two million yen is maximum, the confidence maximization rule can be obtained.
- the support maximization rule can be obtained.
- a database having data including at least two kinds of numeric attributes and at least one kind of true-false attribute first, correspondingly to each pixel (i-th row, j-th column) of a plane having two axes corresponding to the two kinds of numeric attributes and divided into N ⁇ M pixels, the number u(i, j) of data belonging to a pixel (i-th row, j-th column) and the number v(i, j) of data in the pixel, whose true-false attribute is true, are stored (plane forming step). Then, a predetermined condition ⁇ is input.
- a rectilinear region S of pixels maximizing ##EQU2## is segmented (region segmentation step).
- region segmentation step The segmentation of a region of a rectilinear shape in this way allows a person to grasp an association rule more easily. Further, the dependency from the above plane forming step can be reduced. Finally, the data included in the segmented rectilinear region S is output. Thus, data matching the rule can be obtained.
- a second condition ⁇ 2 different from the input condition ⁇ is input, a second rectilinear region S 2 of pixels maximizing ##EQU3## is segmented, and with ##EQU4## (it is assumed that V(S 2 ) is the number of data included in the rectilinear region S 2 , whose true-false attribute is true, V(S) is the number of data included in the rectilinear region S, whose true-false attribute is true, U(S 2 ) is the number of data included in the rectilinear region S 2 , and U(S) is the number of data included in the rectilinear region S) as a third condition, a third region S 3 maximizing ##EQU5## is segmented from the plane.
- Such process is useful if a desired target rule cannot be derived with the first condition ⁇ .
- the described process is performed with the condition ⁇ being appropriately changed.
- v(i, j) is changed so as to equalize v(i, j)/u(i, j) of each pixel in the segmented rectilinear region S to the proportion of the number of data in the whole plane, whose true-false attribute is true, to the number of data s in the whole plane, and using the changed v(i, j), a fourth region S 4 of pixels maximizing ##EQU6## is segmented according to the input condition ⁇ 4 .
- a secondary correlation rule can be derived.
- the region segmentation step is a primary portion of the present invention.
- a rectilinear region in which the section [s, t] in the m-th column is the rightmost column is classified into any of the four types: (1) widen, (2) up, (3) down, and (4) narrow, as compared with the section [x, y] in the (m-1)-th column, when moving from the (m-1)-th column to the m-th column.
- the rectilinear region of the four types which has the maximum value of Equation (1), is the desired region. Accordingly, to determine a region having the maximum value of Equation (1) for each type, the following steps are executed.
- a section [x,y] in the (m-1)-th column of a rectilinear region S w m (s,t) whose value of Equation (1) is maximum among first rectilinear regions and second rectilinear regions or information representing that the m-th column is the leftmost column is stored into a storage H W so as to correspond to m and [s,t].
- the section [s,t] in the m-th column of the first rectilinear regions is the rightmost column and the section [x,y] in the (m-1)-th column of the first rectilinear regions is included in the section [s,t].
- the second rectilinear regions consist of the section [s,t] in the m-th column.
- Equation (1) of the rectilinear region S w m (s,t) is stored.
- the section [s,t] in the m-th column of the first rectilinear regions is the rightmost column, and the section [x,y] in the (m-1)-th column of the first rectilinear regions satisfies s ⁇ x and t ⁇ y.
- the second rectilinear regions consist of the section [s,t] in the m-th column, and a value of Equation (1) of the rectilinear region S U m (s,t) is stored.
- the section [s,t] in the m-th column of the first rectilinear regions is the rightmost column.
- the section [x,y] in the (m-1)-th column of the first rectilinear regions satisfies s ⁇ x and t ⁇ y.
- the second rectilinear regions consist of the section [s,t] in the m-th column, and a value of Equation (1) of the rectilinear region S D m (s,t) is stored.
- the section [x,y] in the (m-1)-th column of the first rectilinear regions satisfies s ⁇ x and t ⁇ y.
- the second rectilinear regions consist of the section [s,t] in the m-th column.
- a value of Equation (1) of said rectilinear region S N m (s,t) is stored.
- Each step is formed in consideration of the nature of rectilinear.
- the first to fourth storing steps is performed for all m and [s, t], and by using m and [s, t] of the rectilinear region S having the maximum value of Equation (1), and the value in the corresponding storage H W , H U , H D , or H N , the rectilinear region S from the plane is segmented.
- the section [a,b] in the (m-2)-th column of the first rectilinear regions satisfies a ⁇ x and b ⁇ y or a ⁇ x and b ⁇ y.
- the section [s,t] in the m-th column of the second rectilinear regions is the rightmost column.
- the section [x,y] in the (m-1)-th column of the second rectilinear region satisfies s ⁇ x and s ⁇ y ⁇ t-1.
- the section [a,b] in the (m-2)-th column of the second rectilinear regions satisfies a ⁇ x and b ⁇ y or a ⁇ x and b ⁇ y.
- the third rectilinear regions consist of the section [s,t] in the m-th column.
- the value of Equation (1) of the rectilinear region S m U (s,t) are then stored.
- the section [a,b] in the (m-2)-th column of the first rectilinear regions satisfies a ⁇ x and b ⁇ y or a ⁇ x and b ⁇ y.
- the section [s,t] in the m-th column of the second rectilinear regions is the rightmost column and the section [x,y] in the (m-1)-th column of the second rectilinear region satisfies s+1 ⁇ x ⁇ t and y ⁇ t.
- the section [a,b] in the (m-2)-th column of the second rectilinear regions satisfies a ⁇ x and b ⁇ y or a ⁇ x and b ⁇ y.
- the third rectilinear regions consist of the section [s,t] in the m-th column.
- the value of Equation (1) of the rectilinear region S m D (s,t) is then stored.
- the setion [x,y] in the (m-1)-th column of the first regions is the same as the section [s,t] and the section [s,t] in the m-th column of the second rectiliinear regions is the rightmost column,
- the section [x,y] in the (m-1)-th column of the second rectilinear region satisfies x ⁇ s and y ⁇ t+1 or x ⁇ s-1 and y ⁇ t.
- the third rectilinear regions consist of the section [s,t] in the m-th column, and the value of Equation (1) of the rectilinear region S m D (s,t) is stored.
- the segementation step comprises the steps of: executing the first to fourth storing steps for all m and [s, t]; and by using m and [s, t] of the rectilinear region S having the largest value of Equation (1), and the corresponding storage H W , H U , H D , or H N , reading out the section [x, y] in the (m-1)-th column and the relation between the (m-1)-th column and (m-2)-th column (the first reading step).
- the segmentation step comprises the steps of: by using the relation between the (m-1)-th column and (m-2)-th column, selecting the corresponding storage from the storages H W , H U , H D , and H N (the selection step); by using the section [x, y] in the (m-1)-th column, reading out the section [a, b] in the (m-2)-th column, and the relation between the (m-2)-th column and the m-3-th column, from the selected storage (the second reading step). Finally, the selection and second reading steps are repeated until the relation with the preceding column becomes information representing the leftmost column.
- the invention may also be implemented as an apparatus for carrying out the above methods, or a program for causing a computer to execute such methods.
- a program may be stored in a storage medium or storage device readable by the computer.
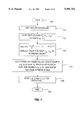
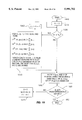
- FIG. 1 is a diagram showing the flow of the plane forming step
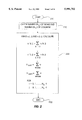
- FIG. 2 is a diagram showing the flow of the preparation for the region segmentation step
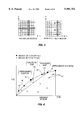
- FIG. 3 shows a rectilinear region as compared to a non-rectilinear region
- FIG. 4 is a graph illustrating the U(S-)V(S) plane
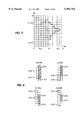
- FIG. 5 is a diagram illustrating the notation in the region segmentation step
- FIG. 6 is a diagram showing the change tendency from the (m-1)-th column to the m-th column;
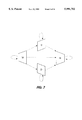
- FIG. 7 is a diagram representing the state transition of each column of a rectilinear region
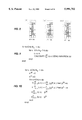
- FIG. 8 is a diagram showing the relationship between the m-th column and the (m-1)-th column in the W-Type, in reference to parts (2), (3), and (4) of Equation(15);
- FIG. 9 illustrates a typical calculation sequence for f m W (s, t).
- FIG. 10 illustrates typical pseudo-code for calculating the U-Type
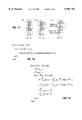
- FIG. 11 illustrates the relationship between the m-th column and the (m-1)-th column in the U-Type, in reference to parts (2), (3), and (4) of Equation(18);
- FIG. 12 shows a typical calculation sequence for f m U (s, t);
- FIG. 13 represents typical pseudo-code for calculating the D-Type
- FIG. 14 shows the relationship between the m-th column and the (m-1)-th column in the D-Type,
- FIG. 15 shows a calculation sequence for f m D (s, t);
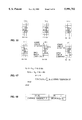
- FIG. 16 shows the relationship between the m-th column and the (m-1)-th column in the N-Type, in reference to parts (1), and (3-7) of Equation(22);
- FIG. 17 shows a typical calculation sequence for f m N (s, t);
- FIG. 18 shows a data structure for H X (m, [s, t]);
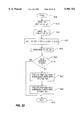
- FIG. 19 represents the flow of a typical implementation of the region-segmentation step
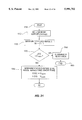
- FIG. 20 represents the flow of a typical process for finding a plurality of focused images
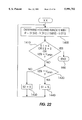
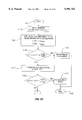
- FIG. 21 represents part of the flow of a typical process for deriving a confidence maximization rule
- FIG. 22 represents part of the flow of a typical process for deriving a confidence maximization rule
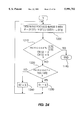
- FIG. 23 represents part of the flow of a typical process for deriving a support maximization rule
- FIG. 24 represents part of the flow of a typical process for deriving a support maximization rule
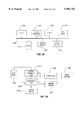
- FIG. 25 shows an example of the device configuration in the implementation of the present invention using a conventional computer system
- FIG. 26 is a block diagram of a typical implementation of the present invention by a special apparatus.
- FIG. 1 the flow of the plane forming phase is shown.
- This phase starts at step 100, where data is first randomly sampled from a data set P (step 110).
- the found value is the boundary value of the pixels of each axis.
- the number u(i, j) of data p k belonging to a pixel (i, j) and the number v(i, j) of data p k whose true-false attribute is true are counted (step 140). It is noted that, since u(i, j) and v(i, j) represent the data of a pixel existing at row i and column j on the plane, they represent a pixel at a place advancing by j in the x-axis direction and by i in the y-axis direction. Finally, the counted u(i, j) and v(i, j) are stored for each pixel (step 150). In this way, two N ⁇ N matrices, u(i, j) and v(i, j), are generated.
- the above random sampling is made because the sorting of all data usually requires much time. However, the sorting of all data may be feasible sometimes. Further, the number of data taken out by the random sampling is preferably about 30N to 50N. Although both axes have been divided into the same number N in the example shown above, they may be divided into different numbers. In the typical example, N is ir the order of 20 to 1000.
- a predetermined value may be used for the boundary value of each pixel. Further, it may be uniformly divided for the data value, or may be logarithmically divided.
- This phase segments a rectilinear region from the previously created plane.
- An example of the rectilinear region is shown in FIG. 3 as compared to a non-rectilinear region.
- the rectilinear region means a region in which (1) the intersections with lines parallel with the y-axis are always continuous or empty, and (2) the intersections with lines parallel with the x-axis are always continuous or empty.
- the left region of FIG. 3 is a rectilinear region, because the intersections with any line parallel with the y-axis are continuous or empty and the intersections with any line parallel with the x-axis are continuous or empty.
- the intersections with lines parallel with the x-axis are always continuous or empty, but the intersections with lines parallel with the y-axis include those which are not continuous. Accordingly, this region is not a rectilinear region.
- a region satisfying only the condition (1) of rectilinear region shown above is called an x-monotone region, and a region satisfying only (2) is called a y-monotone region.
- An x-monotone region is segmented in the background art shown above, but, if the background art is actually applied to data mining as in the present invention, a complex region which drastically varies in the vertical direction is often segmented, producing a shape which is difficult for a person to understand. Further, if the segmentation is attempted in any desired shape, the problem becomes NP hard. Thus, in the present invention, a rectilinear region is segmented.
- a rectilinear region which maximizes the gain represented by the Equation (8) including a parameter value ⁇ (real number not less than 0 and not greater than 1) for the whole region is segmented.
- the parameter ⁇ is now described. As shown in FIG. 4, a plane is assumed in which the abscissa represents the number of data U(S) included in a region S to be segmented, and the ordinate represents the number of data V(S) which is included in the region S to be segmented and whose true-false attribute is true.
- a curve 48 is formed by connecting points forming the convex hull, and a straight line having a gradient ⁇ with respect to the curve is downwardly lowered from the top to obtain the first point at which it contacts with the curve, and the region obtained is output.
- Points on the convex hull are represented by black circles 43 in FIG. 4.
- points on the convex hull are referred to as focused images, and a technique of lowering a straight line is referred to as hand probe.
- the present invention employs a method for using the gradient ⁇ as a parameter.
- Equation (12) the nature of a rectilinear region is represented by the relation among pixels in the region.
- S is assumed to be a rectilinear region in a pixel plane.
- m 1 and m r are assumed to be the column numbers of the left end and the right end of S, respectively.
- the pixel numbers of the lower end and the upper end of the m-th column (m 1 ⁇ m ⁇ m r ) of S are assumed to be s(m) and t(m), respectively.
- These positional relationships are shown in FIG. 5.
- the tendency of change of the section [s(m), t(m)] in the m-th column is defined as follows by comparison with the section in the (m-1)-th column.
- W-Type Widen type (upper-left of FIG. 6) for s(m-1) ⁇ s(m), t(m-1) ⁇ t(m)
- N-Type Narrow type (lower-right of FIG. 6) for s(m-1) ⁇ s(m), t(m-1) ⁇ t(m)
- the change tendency of the left adjacent column of a column having a certain change tendency satisfies the following conditions. That is,
- N-Type W-Type or U-Type, or D-Type, or N-Type.
- regions satisfying such conditions are rectilinear regions.
- FIG. 7 shows a state transition diagram.
- W, U, D, and N in the figure are W-Type, U-Type, D-Type, and N-Type, respectively, and each tracing of an arrow means transition to the state of one right adjacent column.
- All rectilinear regions can be classified into the above shown four types by the change tendency of the rightmost column of the region.
- the four types are generically called X-type (X.di-elect cons. ⁇ W, U, D, N ⁇ ).
- X-type X.di-elect cons. ⁇ W, U, D, N ⁇ .
- the type of a region may belong to a plurality of types at the same time.
- the maximum value of the gains of rectilinear regions of the X-type whose right end is the section [s, t] in the m-th column is represented as f m X (s, t).
- the largest gain of the four types' regions is represented as f m (s, t). That is, it is
- f 0 x (s, t) of the first column is calculated. In this case, it is the same for all types. This is obtained by
- Expression (1) of Equation (15) represents the gain of a region (vertical rectangle of a width 1) consisting only of the section [s, t] of the m-th column.
- expression (2) represents the largest gain of the regions in which the (m-1)-th column is W-Type, its section is [s, t], and the m-th column is the right end at the section [s, t]. This corresponds to the shape shown in part (a) of FIG. 8.
- the m-th column is W-type, it is determined that the (m-1)-th column is W-Type.
- expression (3) represents the largest gain of the regions in which the (m-1)-th column is W-Type, its section [s(m-1), t(m-1)] satisfies s(m-1) ⁇ s, t(m-1) ⁇ t-1, and the section [s, t] of the m-th column is the right end.
- This corresponds to the shape shown in part (b) of FIG. 8.
- the upper end of the (m-1)-th column is not greater than t-1, and the lower end is not smaller than s.
- the expression (4) represents the largest gain of the regions in which the (m-1)-th column is W-Type, its section [s(m-1), t(m-1)] satisfies s(m-1) ⁇ s+1, t(m-1) ⁇ t, and the section [s, t] of the m-th column is the right end. This corresponds to the shape shown in part (c) of FIG. 8.
- the upper end of the (m-1)-th column is not greater than t, and the lower end is not smaller than S+1.
- the expressions (2) to (4) take into consideration that the left column adjacent to W-Type cannot be any other type than W-Type.
- the expression (1) of the Equation(18) represents the gain of a region (vertical rectangle of a width 1) consisting only of the section [s, t] of the m-th column.
- the upper limit of the lower end of the (m-1)-th column is s.
- the m-th column is the right end at the section [s, t]. This corresponds to the shape shown in part (b) of FIG. 11.
- the upper end of the lower end of the (m-1)-th column is s.
- the expression (4) represents the largest gain of the regions in which the (m-1)-th column is W-Type or U-Type, its section [s(m-1), t(m-1)] satisfies s(m-1) ⁇ s, s ⁇ t(m-1) ⁇ t-1, and the m-th column is the right end at the section [s, t]. This corresponds to the shape shown in part (c) of FIG. 11.
- the upper limit of the lower end of the (m-1)-th column is s, and the range of the upper end is not smaller than s and not greater than t-1.
- the expressions (2) to (4) take into consideration that the left adjacent column to U-Type cannot be any other type than W-Type or U-Type.
- the maximum value f m D (s, t) of the gains of the rectilinear regions in which the section [s, t] of the m-th column is the rightmost end and the m-th column is D-Type is determined from the following expression. ##EQU14##
- the expression (1) of the Equation (21) represents the gain of a region (vertical rectangle of a width 1) consisting only of the section [s, t] of the m-th column.
- the lower limit of the upper end of the (m-1)-th column is t.
- the expression (4) represents the largest gain of the regions in which the (m-1)-th column is W-Type or D-Type, its section [s(m-1), t(m-1)] satisfies s+1 ⁇ s(m-1) ⁇ t and t(m-1) ⁇ t, and the m-th column is the right end at the section [s, t]. This is for the shape shown in part (c) of FIG. 14.
- the lower limit of the upper end of the (m-1)-th column is t, and the range of the lower end is not smaller than s+1 and not greater than t.
- the expressions (2)-(4) in Equation(21) take into consideration that the left adjacent column to D-Type cannot be any other type than W-Type or D-Type.
- each expression is used only if the condition at the end of the expression is satisfied. That is, the expression (6) in Equation(22) is compared only when t>N y -1 is satisfied, and the expression (7) is used for comparison only if s>0 is satisfied.
- the expression (1) of the Equation (22) represents the gain of a region (vertical rectangle of a width 1) consisting only of the section [s, t] of the m-th column.
- the expression (2) represents the largest gain of the regions in which the (m-1)-th column is W-Type, its section is [s, t], and the m-th column is the right end at the section [s, t]. This is for the shape shown in part (a) of FIG. 16.
- the expression (3) represents the largest gain of the regions in which the section [s, t] of the (m-1)-th column is U-Type and the m-th column is the right end at the section [s, t]. This is for the shape shown in part (b) of FIG. 16.
- the expression (4) represents the largest gain of the regions in which the section [s, t] of the (m-1)-th column is D-Type, and the m-th column is the right end at the section [s, t]. This is for the shape shown in part (c) of FIG. 16.
- the expression (5) represents the largest gain of the regions in which the section [s, t] of the (m-1)-th column is N-Type, its section is [s, t], and the m-th column is the right end at the section [s, t]. This is for the shape shown in part (d) of FIG. 16.
- Equation (6) in Equation(22) represents the largest gain of the regions in which the (m-1)-th column is W-Type, U-Type, D-Type, or N-Type. Its section [s(m-1), t(m-1)] satisfies s(m-1) ⁇ s and t(m-1) ⁇ t+1, and the m-th column is the right end at the section [s, t]. This is for the shape shown in part (e) of FIG. 16. The lower limit of the upper end of the (m-1)-th column is t+1, and the upper limit of the lower end is s.
- the expression (7) represents the largest gain of the regions in which the (m-1)-th column is W-Type, U-Type, D-Type, or N-Type, its section [s(m-1), t(m-1)] satisfies s(m-1) ⁇ s-1 and t(m-1) ⁇ t, and the m-th column is the right end at the section [s, t].
- This is for the shape shown in part (f) of FIG. 16.
- the lower limit of the upper end of the (m-1)-th column is t, and the upper limit of the lower end is s-1.
- the one which was found first is treated as the solution. Further, the regions are expressed as [s(m 1 ), t(m 1 )], . . . [s(m r ), t(m r )], which shows that vertical sections are laterally arranged. Since one column includes N y rows, the total number of sections [s, t] (s ⁇ t) is N y (N y +1)/2. Each section [s, t] is made to correspond to one integer p in a one-to-one relationship.
- H X (m, [s, t]) the section [x, y] in the (m-1)-th column of a region whose gain is f m X (s, t), and a numeric value representing the change tendency Y of the (m-1)-th column from the (m-2)-th column are stored.
- H X (m, [s, t]) Y:[x, y].
- this H X (m, [s, t]) is expressed by 32 bits of integer type, and the portion of Y is expressed by two upper bits, and the remaining lower bits are used to represent [x, y] (refer to FIG. 18).
- a value representing the left end of the region is stored in the lower bits to show that the m-th column does not connect with the (m-1)-th column. For instance, in an example in which a section is expressed by the above Equation(25), a value equal to or greater than N y (N y +1)/2 is placed in the lower bits, or the 29-th bit is used as a flag representing the left end of the region.
- H W (m, [s, t]) and f m W (s, t) can be provided by carrying out the calculation of the previously shown Equation(15). Accordingly, H W (m, [s, t]) becomes a value representing the left end of the region if the expression (1) of the Equation (15) is maximum, W:[s, t] if the expression (2) is maximum, H W (m, [s, t-1]) if the expression (3) is maximum, and H W (m, [s+1, t]) if the expression (4) is maximum.
- the preceding (m-1)-th column is always W-Type, and thus it is not necessary to store the change tendency of the (m-1)-th column from the (m-2)-th column.
- H U (m, [s, t]) and f m U (s, t) can be provided by carrying out the calculation of the previously shown Equation (18). Accordingly, in H U (m, [s, t]), a value representing the left end of the region is stored if the expression (1) of the Equation (18) is maximum, W:[ ⁇ m-1 W (s, t), t] if the expression (2) is maximum, U:[ ⁇ M-1 U (s, t), t] if the expression (3) is maximum, and H U (m, [s, t-1]) if the expression (4) is maximum.
- H D (m, [s, t]) and f m D (s, t) can be provided by carrying out the calculation of the previously shown Equation (21). Accordingly, in H D (m, [s, t]), a value representing the left end of the region is stored if the expression (1) of the Equation (21) is maximum, W:[S, T m-1 W (s, t)] if the expression (2) is maximum, D:[S, T m-1 D (s, t)] if the expression (3) is maximum, and H D (m, [s+1, t]) if the expression (4) is maximum.
- H N (m, [s, t]) and f m N (s, t) can be provided by carrying out the calculation of the previously shown Equation (22). Accordingly, in H N (m, [s, t]) a value representing the left end of the region is stored if the expression (1) of the Equation (22) is maximum, W:[s, t] if the expression (2) is maximum, U:[s, t] if the expression (3) is maximum, and D:[s, t] if the expression (4) is maximum, N:[s, t] if the expression (5) is maximum, H N (m, [s, t+1]) if the expression (6) is maximum, and H N (m, [s-1, t]) if the expression (7) is maximum.
- i is not necessary to store all f m X (s, t).
- the calculation of the m-th column is carried out, only the calculation results of the m-th column and the (m-1)-th column are used. Accordingly, only a storage capacity for two columns is required for each of the W, U, D, and N-Types.
- all f m X (s, t) may be stored if there is a sufficient storage.
- step 1630 of FIG. 19 ends, m is incremented by one (step 1640), and the process returns to step 1620. Then, this process is executed for all the columns. If executed for all the columns, from m, [s, t], and X regarding the region having the largest gain value for all the columns, H X (m, [s, t]) is referenced and its value Y:[x, y] is taken out (step 1650). Up to this point, the m-th column that is the rightmost column, the section [s, t] of that column, and the (m-1)-th column and its section [x, y] have been found.
- step 1660 it is determined whether [x, y] is a value representing the left end (step 1660). If it is the left end, the process terminates at this point (step 1680). If it is not the left end, Y is substituted into X, [x, y] into [s, t], and (m-1) into m(step 1670), and then the process returns to step 1650. By repeating this process until [x, y] becomes a value representing the left end, the section of each column of the rectilinear region having the largest gain value can be obtained.
- the data belonging to the region S is taken out.
- each data has not only a true-false attribute and numeric attributes, but also other attributes.
- attributes such as address and name are taken out. Since the data to be taken out has been identified up to this point and i is merely a usual database retrieval, a more detailed description is not provided.
- the rectilinear region may be presented to the user after it is once put in a form which enables its outer shape to be clearly seen.
- one of the association rules between data for a certain condition ⁇ can be determined.
- a related issue is how to set this condition ⁇ .
- the following shows how to derive the previously described four general rules and other rules by using each step above, particularly the region segmentation step, as an engine.
- step 800 finds a focused image S1 by the above described process upon the input ⁇ 1 (step 810). Further, it prompts the user to input ⁇ 2 for similarly finding a focused image S2 (step 820).
- step 830 uses the numbers U(S1) and U(S2) of data included in the respective ones and the numbers V(S1) and V(S2) of data whose true-false attribute is true, a new gradient ⁇ 3 at the middle of them is calculated (step 830).
- a focused image S3 corresponding to this ⁇ 3 can further be determined (step 840). If the calculated S3 is already determined at this point, no additional focused image exists on the convex hull (FIG. 4) in a section ( ⁇ 1, ⁇ 2). Accordingly, the process terminates (step 880). However, if not already found, using ⁇ 3 instead of ⁇ 2, step 830 and subsequent steps are executed (step 860). That is, the focused images existing in a section ( ⁇ 1, ⁇ 3) are found. It is also possible to calculate intermediate values one by one. Further, the calculation may be stopped when a certain number of focused images are found.
- step 830 and the subsequent steps are executed for ⁇ 3 and ⁇ 2 (step 870). Also in this case, all the focused images existing in this section may be found, or the process may be terminated when a predetermined number of focused images are found.
- one or more of focused images can be found. It is also possible that a plurality of focused images so obtained can be continuously presented to the user.
- a minimum support minsup (the proportion of data included in a region to the number of whole data) is input (step 910).
- the process starts at point XX, and a new condition ⁇ is obtained, for which a focused image S is calculated (step 1400). This ⁇ is calculated by
- a solution By repeating the process starting from step 1400, a solution can be found. Referring to FIG. 4, region 40 above the minimum support is where a solution exists. Each circle point 42 in the convex hull is a strict solution, but, in the present invention, an approximate solution obtained by a hand probe is output. The detected solution may be presented to the user, or the necessary attributes of data belonging to that focused image may be output.
- the minimum confidence minconf (the proportion of data whose true-false attribute is true to the number of data included in a rectilinear region) is input (step 1110).
- a line 44 designated as minimum confidence and drawn from the origin, corresponds to the minimum confidence.
- minconf ⁇ V(S2)/U(S2) is valid (step 1130). If this condition is valid, S2 is determined to be a solution (step 1160), and the process is terminated (step 1190).
- the support maximization rule is obtained.
- a solution in region 46 above line 44 (designated as the minimum confidence).
- Each circle point 42 in the convex hull is a strict solution. Since much calculation is required to find the points in the convex hull, an approximate solution maximizing the support is output using a point on the convex hull.
- the detected approximate solution or strict solution may be presented to the user, or the necessary attribute values of data included in the focused image may be output.
- the optimized entropy rule is a rule that maximizes the increase in the information amount after the division as compared with the information amount before the division when the division of a region between the inside and outside thereof is considered. Accordingly, it is only needed to find a region where the gain (the following expression) of the entropy of the segmented region and the whole plane becomes maximum. ##EQU18##
- the optimized interclass variance rule is a rule to maximize the square sum of the "deviations from the average of the standardized proportions of true and false" of the inside and outside of a region is considered. Accordingly, it is only needed to find a region where the interclass variance (the following expression) of the segmented region and the whole plane becomes maximum. ##EQU19##
- Such process steps may be implemented and executed by a computer program.
- it may be a program which can be executed in the conventional computer system as shown in FIG. 25.
- the processing program is stored in a hard disk 1050, loaded into a main memory 1020 when executed, and processed by a CPU 1010. Further, the disk 1050 also includes a database, which is accessed by the processing program.
- the plane to be processed and focused image are presented to the user by a display device 1060.
- the user inputs instructions of focused image selection and data output by means of an input device 1070.
- the input device may be a keyboard, mouse, pointing device, or a digitizer.
- the output result may be stored in the floppy disk of a floppy disk drive 1030 which is a sub-storage device, and new data may be input from the drive 1030.
- a CD-ROM drive 1040 can also be used to input data.
- the computer program implementing the process of the present invention can be stored in a storage medium such as a floppy disk or CD-ROM which can be carried.
- a storage medium such as a floppy disk or CD-ROM which can be carried.
- the data extraction portion of a common database retrieval program or a program performing only the process for displaying on the display device 1060 may be already stored on the disk 1050. Accordingly, the distribution of other portions by such storage medium as described above is a matter which is commonly performed.
- a communication apparatus not shown, is connected to a bus 1080, a processing may be performed using a database at a remote site, or a result of the processing may be sent to a remote site.
- a plane forming unit 1310 is connected to a database 1300 and a segmenting unit 1320, and accepts instructions from a controller 1340. Further, the segmenting unit 1320 is connected to an output device 1330 and a display device 1350, and accepts instructions from the controller 1340. The segmenting unit 1320 is also connected to the database. The controller 1340 is connected to an input device 1360, and controls the plane forming unit 1310 and the segmenting unit 1320 according to the type of the processing instructed by the input device 1360.
- the plane forming unit 1310 is part of the apparatus for carrying out the above plane-forming step. It uses data stored in the database to form the previously shown plane, and outputs it to the segmenting unit 1320.
- the segmenting unit 1320 sets ⁇ , a parameter for segmentation, according to the instruction from the controller 1340. According to the set ⁇ , the segmenting unit 1320 executes the above-mentioned segmentation step to segment a focused image. It outputs the focused image to the display device 1140, and if instructed by the user, takes out data belonging to the segmented focused image from the database 1300, and passes it to the output device 1330.
- the output device 1330 outputs the data desired by the user in a proper form.
- the user gives an instruction to solve the confidence maximization rule from the input device 1360, and inputs a minimum support.
- the controller 1340 sets a condition ⁇ to perform the process described in part B (above) and outputs it to the segmenting unit 1320.
- a process such as changing the condition ⁇ is performed to solve a region which matches the instructed confidence maximization rule.
- the controller 1340 performs a processing for passing to the segmenting unit 1320 a condition ⁇ which is suitable for the above described support maximization rule process (part C above), optimized entropy rule process (part D), and optimized interclass variance rule process (part E), and the processing for segmenting a region on the convex hull (part F).
- the user inputs the type of a processing and a condition such as described above (not only ⁇ , but minconf and minsup) from the input device 1360. Further, the controller 1340 instructs the plane forming unit 1310 to perform a processing such as for removing V(i, j) of the segmented focused image to perform the process described in part G.
- the output of the segmenting unit 1320 may be provided to the output device 1160 and the display device 1140 through an output controller.
- the database may be referenced from the output controller to take out data.
Abstract
Description
g(i,j)=v(i,j)-θu(i,j) (8)
f.sub.m (s,t)=max{f.sub.m.sup.W (s,t),f.sub.m.sup.U (s,t),f.sub.m.sup.D (s,t),f.sub.m.sup.N (s,t)} (13)
f.sub.0.sup.x (s,t)=Γ.sub.0 (s,t)
=∀x.di-elect cons.{W, U, D, N}
=∀(s≦t) (14)
θ=(V(S2)-V(S1)/(U(S2)-U(S1)) (26)
Claims (20)
Applications Claiming Priority (2)
| Application Number | Priority Date | Filing Date | Title |
|---|---|---|---|
| JP9-034605 | 1997-02-19 | ||
| JP3460597A JP3193658B2 (en) | 1997-02-19 | 1997-02-19 | Method and apparatus for deriving inter-data coupling rule, and method and apparatus for extracting orthogonal convex region |
Publications (1)
| Publication Number | Publication Date |
|---|---|
| US5991752A true US5991752A (en) | 1999-11-23 |
Family
ID=12419001
Family Applications (1)
| Application Number | Title | Priority Date | Filing Date |
|---|---|---|---|
| US09/025,536 Expired - Lifetime US5991752A (en) | 1997-02-19 | 1998-02-18 | Method and apparatus for deriving association rules from data and for segmenting rectilinear regions |
Country Status (4)
| Country | Link |
|---|---|
| US (1) | US5991752A (en) |
| JP (1) | JP3193658B2 (en) |
| KR (1) | KR100309666B1 (en) |
| TW (1) | TW360825B (en) |
Cited By (14)
| Publication number | Priority date | Publication date | Assignee | Title |
|---|---|---|---|---|
| US6182070B1 (en) * | 1998-08-21 | 2001-01-30 | International Business Machines Corporation | System and method for discovering predictive association rules |
| US6272478B1 (en) * | 1997-06-24 | 2001-08-07 | Mitsubishi Denki Kabushiki Kaisha | Data mining apparatus for discovering association rules existing between attributes of data |
| US6278997B1 (en) * | 1999-02-05 | 2001-08-21 | International Business Machines Corporation | System and method for constraint-based rule mining in large, dense data-sets |
| US6385608B1 (en) * | 1997-11-11 | 2002-05-07 | Mitsubishi Denki Kabushiki Kaisha | Method and apparatus for discovering association rules |
| US20030225743A1 (en) * | 2001-05-23 | 2003-12-04 | Akihiro Inokuchi | Graph structured data processing method and system, and program therefor |
| US6711577B1 (en) | 2000-10-09 | 2004-03-23 | Battelle Memorial Institute | Data mining and visualization techniques |
| US20040205064A1 (en) * | 2003-04-11 | 2004-10-14 | Nianjun Zhou | Adaptive search employing entropy based quantitative information measurement |
| US20040222991A1 (en) * | 2001-08-30 | 2004-11-11 | Slavin Keith R. | Graphics resampling system and method for use thereof |
| US20070033158A1 (en) * | 2005-08-03 | 2007-02-08 | Suresh Gopalan | Methods and systems for high confidence utilization of datasets |
| US7539677B1 (en) | 2000-10-09 | 2009-05-26 | Battelle Memorial Institute | Sequential pattern data mining and visualization |
| US20140035924A1 (en) * | 2012-08-01 | 2014-02-06 | Apollo Group, Inc. | Trend highlighting |
| US8819078B2 (en) * | 2012-07-13 | 2014-08-26 | Hewlett-Packard Development Company, L. P. | Event processing for graph-structured data |
| US9519697B2 (en) | 2011-09-30 | 2016-12-13 | Fujitsu Limited | Observation information processing apparatus, non-transitory computer-readable recording medium, and observation information processing method |
| US9600894B2 (en) * | 2015-04-07 | 2017-03-21 | Toshiba Tec Kabushiki Kaisha | Image processing apparatus and computer-readable storage medium |
Families Citing this family (5)
| Publication number | Priority date | Publication date | Assignee | Title |
|---|---|---|---|---|
| JP3629514B2 (en) | 2000-05-24 | 2005-03-16 | インターナショナル・ビジネス・マシーンズ・コーポレーション | Region calculation method, spatial data mining device, map information display device, spatial data mining system, and storage medium |
| JP2002183432A (en) * | 2000-12-14 | 2002-06-28 | Ibm Japan Ltd | Data extracting method, data operating method, credit information extracting method, database system, credit commercializing device, storage medium, and computer program |
| JPWO2006090638A1 (en) * | 2005-02-22 | 2008-07-24 | 銀座ステファニー化粧品株式会社 | A golf club that estimates the hit position on the club face |
| JP5704249B2 (en) * | 2011-09-30 | 2015-04-22 | 富士通株式会社 | Observation information processing apparatus, observation information processing program, and observation information processing method |
| CN111504963B (en) * | 2020-04-10 | 2023-07-07 | 上海蓝长自动化科技有限公司 | Data space-time fusion method applied to chlorophyll and blue-green algae fluorescence detection |
Citations (3)
| Publication number | Priority date | Publication date | Assignee | Title |
|---|---|---|---|---|
| US5724573A (en) * | 1995-12-22 | 1998-03-03 | International Business Machines Corporation | Method and system for mining quantitative association rules in large relational tables |
| US5812997A (en) * | 1995-10-26 | 1998-09-22 | International Business Machines Incorporated | Method and apparatus for deriving an association rule between data |
| US5870748A (en) * | 1995-11-01 | 1999-02-09 | International Business Machines Corporation | Method and apparatus for deriving an optimized confidence rule |
-
1997
- 1997-02-19 JP JP3460597A patent/JP3193658B2/en not_active Expired - Fee Related
- 1997-11-18 KR KR1019970060883A patent/KR100309666B1/en not_active IP Right Cessation
- 1997-11-19 TW TW086117282A patent/TW360825B/en active
-
1998
- 1998-02-18 US US09/025,536 patent/US5991752A/en not_active Expired - Lifetime
Patent Citations (3)
| Publication number | Priority date | Publication date | Assignee | Title |
|---|---|---|---|---|
| US5812997A (en) * | 1995-10-26 | 1998-09-22 | International Business Machines Incorporated | Method and apparatus for deriving an association rule between data |
| US5870748A (en) * | 1995-11-01 | 1999-02-09 | International Business Machines Corporation | Method and apparatus for deriving an optimized confidence rule |
| US5724573A (en) * | 1995-12-22 | 1998-03-03 | International Business Machines Corporation | Method and system for mining quantitative association rules in large relational tables |
Cited By (25)
| Publication number | Priority date | Publication date | Assignee | Title |
|---|---|---|---|---|
| US6272478B1 (en) * | 1997-06-24 | 2001-08-07 | Mitsubishi Denki Kabushiki Kaisha | Data mining apparatus for discovering association rules existing between attributes of data |
| US6385608B1 (en) * | 1997-11-11 | 2002-05-07 | Mitsubishi Denki Kabushiki Kaisha | Method and apparatus for discovering association rules |
| US6182070B1 (en) * | 1998-08-21 | 2001-01-30 | International Business Machines Corporation | System and method for discovering predictive association rules |
| US6278997B1 (en) * | 1999-02-05 | 2001-08-21 | International Business Machines Corporation | System and method for constraint-based rule mining in large, dense data-sets |
| US7539677B1 (en) | 2000-10-09 | 2009-05-26 | Battelle Memorial Institute | Sequential pattern data mining and visualization |
| US6711577B1 (en) | 2000-10-09 | 2004-03-23 | Battelle Memorial Institute | Data mining and visualization techniques |
| US6985890B2 (en) * | 2001-05-23 | 2006-01-10 | Akihiro Inokuchi | Graph structured data processing method and system, and program therefor |
| US20030225743A1 (en) * | 2001-05-23 | 2003-12-04 | Akihiro Inokuchi | Graph structured data processing method and system, and program therefor |
| US20040222991A1 (en) * | 2001-08-30 | 2004-11-11 | Slavin Keith R. | Graphics resampling system and method for use thereof |
| US6970170B2 (en) * | 2001-08-30 | 2005-11-29 | Micron Technology, Inc. | Graphics resampling system and method for use thereof |
| US7492376B2 (en) | 2001-08-30 | 2009-02-17 | Micron Technology, Inc. | Graphics resampling system and method for use thereof |
| US20060007247A1 (en) * | 2001-08-30 | 2006-01-12 | Slavin Keith R | Graphics resampling system and method for use thereof |
| US20040205064A1 (en) * | 2003-04-11 | 2004-10-14 | Nianjun Zhou | Adaptive search employing entropy based quantitative information measurement |
| WO2007019182A3 (en) * | 2005-08-03 | 2007-05-31 | Gopalan Suresh | Methods and systems for high confidence utilization of datasets |
| US7480593B2 (en) | 2005-08-03 | 2009-01-20 | Suresh Gopalan | Methods and systems for high confidence utilization of datasets |
| US20070033158A1 (en) * | 2005-08-03 | 2007-02-08 | Suresh Gopalan | Methods and systems for high confidence utilization of datasets |
| US20090177408A1 (en) * | 2005-08-03 | 2009-07-09 | Suresh Gopalan | Methods and systems for high confidence utilization of datasets |
| US8069014B2 (en) | 2005-08-03 | 2011-11-29 | Suresh Gopalan | Methods and systems for high confidence utilization of datasets |
| US20120095695A1 (en) * | 2005-08-03 | 2012-04-19 | Suresh Gopalan | Methods and systems for high confidence utilization of datasets |
| US8483994B2 (en) | 2005-08-03 | 2013-07-09 | Resurfx, Inc. | Methods and systems for high confidence utilization of datasets |
| US8532959B2 (en) * | 2005-08-03 | 2013-09-10 | Resurfx, Inc. | Methods and systems for high confidence utilization of datasets |
| US9519697B2 (en) | 2011-09-30 | 2016-12-13 | Fujitsu Limited | Observation information processing apparatus, non-transitory computer-readable recording medium, and observation information processing method |
| US8819078B2 (en) * | 2012-07-13 | 2014-08-26 | Hewlett-Packard Development Company, L. P. | Event processing for graph-structured data |
| US20140035924A1 (en) * | 2012-08-01 | 2014-02-06 | Apollo Group, Inc. | Trend highlighting |
| US9600894B2 (en) * | 2015-04-07 | 2017-03-21 | Toshiba Tec Kabushiki Kaisha | Image processing apparatus and computer-readable storage medium |
Also Published As
| Publication number | Publication date |
|---|---|
| TW360825B (en) | 1999-06-11 |
| KR19980070101A (en) | 1998-10-26 |
| JP3193658B2 (en) | 2001-07-30 |
| KR100309666B1 (en) | 2001-11-17 |
| JPH10240747A (en) | 1998-09-11 |
Similar Documents
| Publication | Publication Date | Title |
|---|---|---|
| US5991752A (en) | Method and apparatus for deriving association rules from data and for segmenting rectilinear regions | |
| US5812997A (en) | Method and apparatus for deriving an association rule between data | |
| US6449612B1 (en) | Varying cluster number in a scalable clustering system for use with large databases | |
| Strasters et al. | Three-dimensional image segmentation using a split, merge and group approach | |
| Lee et al. | Information embedding based on user's relevance feedback for image retrieval | |
| KR100385528B1 (en) | Multidimensional data clustering and dimension reduction for indexing and searching | |
| US5724573A (en) | Method and system for mining quantitative association rules in large relational tables | |
| US7555496B1 (en) | Three-dimensional display of document set | |
| US6012069A (en) | Method and apparatus for retrieving a desired image from an image database using keywords | |
| US20030009467A1 (en) | System and method for organizing, compressing and structuring data for data mining readiness | |
| US20030145014A1 (en) | Method and apparatus for ordering electronic data | |
| AU6346100A (en) | Method and system for organizing data | |
| JP2001202523A (en) | Method and device for image processing | |
| US6785684B2 (en) | Apparatus and method for determining clustering factor in a database using block level sampling | |
| US20020123987A1 (en) | Nearest neighbor data method and system | |
| JP3143532B2 (en) | Image retrieval apparatus and method | |
| WO2005008519A1 (en) | Combined search method for content-based image retrieval | |
| US6286012B1 (en) | Information filtering apparatus and information filtering method | |
| Böhm et al. | Supporting KDD applications by the k-nearest neighbor join | |
| US5870748A (en) | Method and apparatus for deriving an optimized confidence rule | |
| Petrakis et al. | A Generalized Approach to Image Indexing and Retrieval Based on 2D Strings | |
| JP3155033B2 (en) | Similar scale composition processing method | |
| Digout et al. | High-dimensional similarity searches using a metric pseudo-grid | |
| Wilhelm | Data and knowledge mining | |
| Aksoy et al. | Content-based image database retrieval based on line-angle-ratio statistics |
Legal Events
| Date | Code | Title | Description |
|---|---|---|---|
| AS | Assignment |
Owner name: INTERNATIONAL BUSINESS MACHINES CORPORATION, NEW Y Free format text: ASSIGNMENT OF ASSIGNORS INTEREST;ASSIGNORS:FUKUDA, TAKESHI;YODA, KUNIKAZU;TOKUYAMA, TAKESHI;AND OTHERS;REEL/FRAME:009288/0983;SIGNING DATES FROM 19980611 TO 19980616 |
|
| STCF | Information on status: patent grant |
Free format text: PATENTED CASE |
|
| FPAY | Fee payment |
Year of fee payment: 4 |
|
| FPAY | Fee payment |
Year of fee payment: 8 |
|
| REMI | Maintenance fee reminder mailed | ||
| AS | Assignment |
Owner name: GOOGLE INC., CALIFORNIA Free format text: ASSIGNMENT OF ASSIGNORS INTEREST;ASSIGNOR:INTERNATIONAL BUSINESS MACHINES CORPORATION;REEL/FRAME:026894/0001 Effective date: 20110817 |
|
| FPAY | Fee payment |
Year of fee payment: 12 |
|
| SULP | Surcharge for late payment |
Year of fee payment: 11 |
|
| AS | Assignment |
Owner name: GOOGLE LLC, CALIFORNIA Free format text: CHANGE OF NAME;ASSIGNOR:GOOGLE INC.;REEL/FRAME:044127/0735 Effective date: 20170929 |