US6539323B2 - Methods and apparatus for correcting spectral color measurements - Google Patents
Methods and apparatus for correcting spectral color measurements Download PDFInfo
- Publication number
- US6539323B2 US6539323B2 US09/849,282 US84928201A US6539323B2 US 6539323 B2 US6539323 B2 US 6539323B2 US 84928201 A US84928201 A US 84928201A US 6539323 B2 US6539323 B2 US 6539323B2
- Authority
- US
- United States
- Prior art keywords
- spectra
- spectral
- values
- basis
- accordance
- Prior art date
- Legal status (The legal status is an assumption and is not a legal conclusion. Google has not performed a legal analysis and makes no representation as to the accuracy of the status listed.)
- Expired - Lifetime, expires
Links
- 238000005259 measurement Methods 0.000 title claims abstract description 111
- 230000003595 spectral effect Effects 0.000 title claims abstract description 96
- 238000000034 method Methods 0.000 title claims abstract description 35
- 238000001228 spectrum Methods 0.000 claims abstract description 197
- 239000013598 vector Substances 0.000 claims abstract description 86
- 239000011159 matrix material Substances 0.000 claims abstract description 78
- 230000006870 function Effects 0.000 claims description 81
- 238000000985 reflectance spectrum Methods 0.000 claims description 21
- 238000005284 basis set Methods 0.000 claims description 7
- 238000013507 mapping Methods 0.000 claims description 6
- 238000004088 simulation Methods 0.000 claims description 4
- 238000012937 correction Methods 0.000 abstract description 39
- 238000012549 training Methods 0.000 description 11
- 230000015572 biosynthetic process Effects 0.000 description 8
- 238000010586 diagram Methods 0.000 description 7
- 238000011109 contamination Methods 0.000 description 6
- 239000003086 colorant Substances 0.000 description 5
- 230000000875 corresponding effect Effects 0.000 description 4
- 230000000694 effects Effects 0.000 description 4
- 238000004364 calculation method Methods 0.000 description 3
- 238000013461 design Methods 0.000 description 3
- 230000002596 correlated effect Effects 0.000 description 2
- 238000005286 illumination Methods 0.000 description 2
- 238000010915 one-step procedure Methods 0.000 description 2
- 238000012545 processing Methods 0.000 description 2
- 230000001131 transforming effect Effects 0.000 description 2
- 238000001429 visible spectrum Methods 0.000 description 2
- 238000012935 Averaging Methods 0.000 description 1
- 230000006978 adaptation Effects 0.000 description 1
- 238000003491 array Methods 0.000 description 1
- 230000009286 beneficial effect Effects 0.000 description 1
- 238000006243 chemical reaction Methods 0.000 description 1
- 230000007812 deficiency Effects 0.000 description 1
- 238000001514 detection method Methods 0.000 description 1
- 239000000463 material Substances 0.000 description 1
- 238000012986 modification Methods 0.000 description 1
- 230000004048 modification Effects 0.000 description 1
- 230000008447 perception Effects 0.000 description 1
- 239000000049 pigment Substances 0.000 description 1
- 230000004044 response Effects 0.000 description 1
- 238000005070 sampling Methods 0.000 description 1
- 230000035945 sensitivity Effects 0.000 description 1
- 230000007704 transition Effects 0.000 description 1
- 230000000007 visual effect Effects 0.000 description 1
Images


Classifications
-
- G—PHYSICS
- G01—MEASURING; TESTING
- G01N—INVESTIGATING OR ANALYSING MATERIALS BY DETERMINING THEIR CHEMICAL OR PHYSICAL PROPERTIES
- G01N21/00—Investigating or analysing materials by the use of optical means, i.e. using sub-millimetre waves, infrared, visible or ultraviolet light
- G01N21/17—Systems in which incident light is modified in accordance with the properties of the material investigated
- G01N21/25—Colour; Spectral properties, i.e. comparison of effect of material on the light at two or more different wavelengths or wavelength bands
- G01N21/31—Investigating relative effect of material at wavelengths characteristic of specific elements or molecules, e.g. atomic absorption spectrometry
-
- G—PHYSICS
- G01—MEASURING; TESTING
- G01J—MEASUREMENT OF INTENSITY, VELOCITY, SPECTRAL CONTENT, POLARISATION, PHASE OR PULSE CHARACTERISTICS OF INFRARED, VISIBLE OR ULTRAVIOLET LIGHT; COLORIMETRY; RADIATION PYROMETRY
- G01J3/00—Spectrometry; Spectrophotometry; Monochromators; Measuring colours
- G01J3/46—Measurement of colour; Colour measuring devices, e.g. colorimeters
- G01J3/462—Computing operations in or between colour spaces; Colour management systems
-
- G—PHYSICS
- G01—MEASURING; TESTING
- G01J—MEASUREMENT OF INTENSITY, VELOCITY, SPECTRAL CONTENT, POLARISATION, PHASE OR PULSE CHARACTERISTICS OF INFRARED, VISIBLE OR ULTRAVIOLET LIGHT; COLORIMETRY; RADIATION PYROMETRY
- G01J3/00—Spectrometry; Spectrophotometry; Monochromators; Measuring colours
- G01J3/46—Measurement of colour; Colour measuring devices, e.g. colorimeters
- G01J3/52—Measurement of colour; Colour measuring devices, e.g. colorimeters using colour charts
- G01J3/524—Calibration of colorimeters
-
- G—PHYSICS
- G01—MEASURING; TESTING
- G01N—INVESTIGATING OR ANALYSING MATERIALS BY DETERMINING THEIR CHEMICAL OR PHYSICAL PROPERTIES
- G01N21/00—Investigating or analysing materials by the use of optical means, i.e. using sub-millimetre waves, infrared, visible or ultraviolet light
- G01N21/17—Systems in which incident light is modified in accordance with the properties of the material investigated
- G01N21/25—Colour; Spectral properties, i.e. comparison of effect of material on the light at two or more different wavelengths or wavelength bands
- G01N21/27—Colour; Spectral properties, i.e. comparison of effect of material on the light at two or more different wavelengths or wavelength bands using photo-electric detection ; circuits for computing concentration
- G01N21/274—Calibration, base line adjustment, drift correction
-
- G—PHYSICS
- G01—MEASURING; TESTING
- G01J—MEASUREMENT OF INTENSITY, VELOCITY, SPECTRAL CONTENT, POLARISATION, PHASE OR PULSE CHARACTERISTICS OF INFRARED, VISIBLE OR ULTRAVIOLET LIGHT; COLORIMETRY; RADIATION PYROMETRY
- G01J3/00—Spectrometry; Spectrophotometry; Monochromators; Measuring colours
- G01J3/28—Investigating the spectrum
- G01J2003/2866—Markers; Calibrating of scan
-
- G—PHYSICS
- G01—MEASURING; TESTING
- G01J—MEASUREMENT OF INTENSITY, VELOCITY, SPECTRAL CONTENT, POLARISATION, PHASE OR PULSE CHARACTERISTICS OF INFRARED, VISIBLE OR ULTRAVIOLET LIGHT; COLORIMETRY; RADIATION PYROMETRY
- G01J3/00—Spectrometry; Spectrophotometry; Monochromators; Measuring colours
- G01J3/46—Measurement of colour; Colour measuring devices, e.g. colorimeters
- G01J2003/466—Coded colour; Recognition of predetermined colour; Determining proximity to predetermined colour
Definitions
- the present invention relates generally to the measurement of color, and more particularly to the correction of spectral measurements, such as are obtained by a spectrophotometer for measuring color.
- a plot of light energy versus wavelength is called a spectrum.
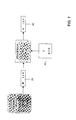
- a spectrum for the color Magenta is shown in FIG. 1 .
- the various possible shapes of the spectrum plot gives rise to the perception of different colors.
- spectra which have larger energy amplitudes in the short wavelengths near 400 nm are perceived as being “blue” while spectral plots that show larger amplitudes in the longer wavelengths near 700 nm are perceived as being “red”.
- the set of all possible shapes for a spectral energy plot gives rise to the enormous number of colors that humans can see (nearly 10 million).
- each spectral band of color may be as small as 2 nm wide spanning the range from 400 nm to 700 nm.
- a wide variety of instruments are used to make quantitative measurements of color. In general, these instruments can be classified as making either “three-band”, or “full spectrum” measurements.
- the three-band instruments measure the light energy reflected from a sample at three positions within the spectrum. They are not able to detect the entire spectrum of a color, but having a 3-channel estimate of it is very useful for many printing and color control applications, and the expense of making this kind of measurement is low.
- Full spectrum instruments are able to obtain the spectral energy distribution of a color across the entire visible spectrum, and thereby gain a more accurate representation of the color characteristics of a sample. For example, such a measurement can be used to predict a sample's color appearance even when the lighting on the sample changes.
- the amplitude at one position (one wavelength) along the spectrum is influenced by the amplitudes at other wavelengths. This is called “cross-spectrum contamination” or “crosstalk”. If the amplitude measured at some position in the spectrum is distorted by crosstalk, the spectrum will misrepresent the color of the sample.
- FIG. 2 illustrates an example of this effect.
- FIG. 2 shows a spectrum of a blue sample.
- the plot of actual spectra 10 shows that the reflected energy from the sample is highest in the short wavelength region and the spectrum makes a transition to a low level for the rest of the wavelengths.
- a plot of a spectrum that might be measured by an instrument suffering from spectral crosstalk is shown at 12 .
- Plot 12 shows a rise in energy at the long wavelength end that does not really exist, it is a false measurement of the blue energy showing up as an apparent amount of red.
- plot 12 shows energy from the blue end of the spectrum being falsely detected as energy from the red end of the spectrum.
- the color represented by the measurement will have a reddish tint compared to the actual color.
- the contamination could be any of the wavelengths in the blue region, it could be a little contamination from all of the wavelengths, the contamination could be from just a portion of the wavelengths, or from a gradual increase of contamination toward one specific wavelength.
- the number of measurements that must be made is equal to the number of wavelength positions along the spectrum that are used in the spectral plot. It is common to have at least 30 such positions, but more accurate instruments using higher resolution obtain over 100 individual amplitudes for a spectral plot. It becomes difficult to solve for the crosstalk characteristics for such a large system.
- the nature of the light source used to illuminate a color specimen can have considerable effect on the spectrum that is detected.
- the angle of illumination, the texture and gloss of the sample, and the amount of ultraviolet energy in the light and fluorescent material in the sample all influence the spectrum that is obtained.
- the methods and apparatus of the present invention provide the aforesaid and other advantages.
- the present invention provides methods and apparatus for correcting spectral measurements, such as are obtained by a spectrophotometer for measuring color.
- a single matrix operates on a raw measurement vector (spectrum) to obtain a corrected spectrum.
- the matrix may embody a transform that minimizes the difference between the corrected spectra and a set of reference spectra.
- the difference may be characterized by a set of basis function weighting vectors which are then used to build the correction matrix.
- the method allows the correction of high resolution spectra (very long measurement vectors) without requiring the large number of measurements that would normally be required.
- the reference spectra can be calibration data, or measurements made by another instrument which is desired to be simulated.
- This invention provides a way to solve for the crosstalk components without making hundreds of measurements for a high resolution full spectrum color instrument. Instead, a few tens of measurements can be made.
- the (uncalibrated) color instrument to be characterized is used to obtain spectral measurements of, for example, 24 uniquely colored sample patches.
- Another instrument, a reference instrument, which is known to be calibrated accurately, also makes measurements and obtains spectra of these same 24 color patches.
- the spectra from the reference instrument are collected and compared to the set of spectra from the uncalibrated instrument. One spectrum is subtracted from the other to obtain a spectral difference plot or error spectrum for each of the 24 colors.
- the difference spectra can be represented by 24 or fewer components (the number of color patch measurements made)
- a unique correlation between the measurement error and the original measured spectrum can be solved for by using standard algebraic methods (also described below). This correlation describes the relationship between the original measurement and any crosstalk error that it might contain. Since this relationship can now be calculated, the error can be computed and subtracted from the original measurement to obtain a new spectrum that no longer contains this crosstalk error.
- a simple correction method is to multiply the spectrum by a scale factor or to subtract an offset.
- Slightly more sophisticated is to scale the spectrum by a different factor at each wavelength, or to subtract a different offset from the amplitude at each wavelength. All of these operations can be accomplished using matrices, vectors, and a matrix multiply operator.
- a vector is used to represent the sequence of amplitudes for each wavelength along a spectrum. It is shown as a long rectangle, either horizontally oriented (a row vector), or vertically oriented (a column vector).
- a matrix is a collection of vectors and forms a larger rectangle.
- the correction matrix used in the present invention has the same number of rows as columns and may be shown as a square. These elements are combined by the matrix multiplication operation.
- the multiple steps of calculating an error spectrum and then subtracting it from the measurement can be combined into a single matrix multiplication operation.
- the matrix that is used for this one-step procedure is the combination of a crosstalk correlation matrix with an Identity matrix resulting in a correction matrix.
- the identity matrix serves to represent the original spectrum. Such a technique is possible because of the properties of linear systems.
- the correction matrix contains the information that correlates the crosstalk error with the spectral measurement.
- the actual crosstalk correction amplitudes are obtained by multiplying the spectrum by the matrix. Once the crosstalk correction is obtained, it is added to the spectrum. This is a very general and powerful technique for correcting signals and a number of useful variations are commonly used. The effectiveness of this technique depends critically on the contents of the matrix. The calculation of the correction matrix elements is described in detail below.
- spectral measurements of a color sensing device may be corrected.
- a set of spectral measurements may be obtained by the color sensing device.
- Each of the spectral measurements represents an amplitude of detected light in a spectral band from a plurality of respective N spectral bands, such that the set of spectral measurements may be represented by a 1 ⁇ N spectral measurement vector.
- a set of basis function weighting vectors is calculated based on the difference between measured spectra values for a plurality of color samples and a set of reference spectra values for the same color samples. The calculation of basis function weighting vectors is described in detail below.
- An N ⁇ N transform matrix is formed based on these basis weighting vectors and the measured spectra values.
- the N ⁇ N transform matrix provides mapping between the spectral measurements and corrected spectra.
- the 1 ⁇ N spectral measurement vector may be multiplied by the N ⁇ N transform matrix to generate a corrected spectrum.
- a processor may be provided for multiplying the 1 ⁇ N spectral measurement vector by the N ⁇ N transform matrix to generate the corrected spectrum.
- the N ⁇ N transform matrix may be obtained by measuring spectra values of a training set of K color samples. Each sample has a known reference reflectance spectra. Once the measured spectra are obtained, the basis function weighting vectors (a representation of the difference between the measured and the reference reflectance spectra) can be solved for using a set of D basis functions.
- the number of basis functions (D) may be less than or equal to the lesser of K or N.
- the basis functions may be represented by the D columns in an N ⁇ D array, or in any suitable manner.
- the solution for the basis function weighting vectors may be represented as an array of D ⁇ N amplitudes.
- the N ⁇ N matrix can then be formed by adding an identity matrix I to the product of the N ⁇ D basis set and the D ⁇ N amplitude array.
- Basis functions may comprise simple trigonometric functions that are well known and can be specified with a few parameters. Alternately, the basis functions may depend upon characteristics of the differences between the measured spectra values and the reference spectra values. Weightings of the basis functions may be stored in the color sensing device when the basis functions are known and fixed (e.g., when they are a set of simple trigonometric functions). When the basis functions are variable, both the basis functions and associated basis function weightings may be stored in the color sensing device (e.g., when the basis functions are principal components obtained from the measured data).
- the known reference reflectance spectra values may be either calibration spectra values or simulation spectra values.
- the known reference reflectance spectra values may be obtained from a reference instrument.
- FIG. 1 is an example of a measured spectrum
- FIG. 2 is an example of an actual spectrum compared with a measured spectrum
- FIG. 3 shows a block diagram of a simplified embodiment of the invention
- FIG. 5 shows a block diagram representation of the formation of the corrected spectrum for a measured spectrum utilizing the crosstalk correlation factors
- FIG. 6 shows a further block diagram representation of the formation of the corrected spectrum utilizing the crosstalk correlation factors
- FIG. 7 is a block diagram of an exemplary embodiment of the invention.
- FIG. 8 is a block diagram example of the formation of a set of error vectors for use in forming a set of basis function weighting vectors.
- FIG. 9 is a block diagram example of the formation of the correction matrix.
- the present invention provides methods and apparatus for calibrating or correcting a spectral color measurement.
- the calibration may be made with respect to an absolute standard, or may be made with respect to a reference standard.
- the present invention provides methods and apparatus for matching a spectral measurement made by a first color sensing device to a spectral measurement made by a second color sensing device (e.g., a reference instrument) without regard to absolute accuracy.
- the invention corrects for various deficiencies in one instrument or the other such as spectral crosstalk, bandwidth limitations, offsets, and non-uniformities in illumination.
- This invention provides a way to solve for the crosstalk components without making hundreds of measurements for a high resolution full spectrum color instrument. Instead, a few tens of measurements can be made.
- a simplified embodiment is shown in FIG. 3 .
- the (uncalibrated) color instrument 10 that is to be characterized is used to obtain spectral measurements of a training set of color samples, for example, 24 uniquely colored sample patches 70 .
- Another instrument, a reference instrument 75 which is known to be calibrated accurately, also makes measurements and obtains spectra of these same 24 color patches 70 .
- the set of reference spectra 65 from the reference instrument 75 are collected and compare to the set of measured spectra 80 from the uncalibrated instrument 10 .
- One spectrum is subtracted from the other ( 85 ) to obtain a spectral difference plot or error spectrum 60 for each of the 24 colors.
- each difference spectrum 60 be represented as the sum of a number of (no more than 24 in this example) possible components. These components can be selected so that there is a minimum of residual error in this representation of the difference spectra 60 .
- Well-established methods of linear algebra are used to find the components for this approximation and are described in detail below.
- FIG. 4 shows the formation of crosstalk correlation factors 103 from a set of reference spectra 65 .
- Reference spectra 65 represents known values for a set of color measurements taken from a set of color patches (e.g., 24 color patches for purposes of this example). The same color samples are measured by a color sensing device which is desired to be corrected or calibrated.
- the measured spectra 80 obtained by the color sensing device is referred to as a “training set”.
- the difference between the measured spectra 80 and the reference spectra 65 is represented by a difference spectra 60 .
- difference spectra 60 can be represented by 24 or fewer (the number of color patch measurements made in this example) components 96 , then a unique correlation 102 between the measurement error 60 and the original measured spectra 80 can be solved for by using standard algebraic methods (also described in detail below).
- Components 96 represent a weighted sum of basis components 95 and provides an approximated difference spectra (correction vectors) 61 .
- This correlation 102 describes the relationship between the original measurement and any crosstalk error that it might contain based on the correction vectors 61 . This correlation can be used to generate crosstalk correlation factors 103 .
- the crosstalk correlation factors 103 can then be used to correct a color measurement of an unknown color sample made by the color sensing device.
- the measured spectrum 81 of the unknown color sample can be corrected by multiplying it by the crosstalk correlation factors 103 to provide correction vector 63 for the measured spectrum 81 .
- the correction vector 63 can be added to the original measured spectrum 81 to obtain a new corrected spectrum 40 that no longer contains this crosstalk error.
- FIG. 6 shows that the multiple steps of calculating an error spectrum (i.e. correction vector 63 of FIG. 5) and then adding it to the measurement as discussed in connection with FIG. 5 can be combined into a single matrix multiply operation.
- the matrix that is used for this one-step procedure is the combination of the crosstalk correlation matrix 103 with an Identity matrix 115 .
- the resulting correction matrix 30 contains the information that correlates the crosstalk error with the spectral measurement 81 which is to be corrected.
- the actual crosstalk correction amplitudes are obtained by multiplying the measured spectrum 81 by the crosstalk correlation factors 103 .
- the correction vector e.g., correction vector 63 of FIG. 5
- it is added to the measured spectrum 81 .
- Multiplying the measured spectrum 81 by the correction matrix 30 generates, in a single step, a corrected spectrum 40 .
- This is a very general and powerful technique for correcting signals and a number of useful variations are commonly used. Its effectiveness depends critically on the contents of the matrix. The calculation of the matrix elements is described in detail below.
- spectral measurements provided by color sensing device 10 may be corrected.
- Spectral measurements 20 may be obtained by color sensing device 10 .
- Each of spectral measurements 20 represents an amplitude of detected light in a spectral band from a plurality of respective spectral bands (designated herein as N respective spectral bands).
- Spectral measurements 20 may be represented by a 1 ⁇ N spectral measurement vector M, where N refers to the number of measured spectral bands.
- N ⁇ N transform matrix 30 also referred to herein as correction matrix C
- correction matrix C provides mapping between the spectral measurements 20 and corrected spectra.
- Processor 50 (comprising, for example, a conventional microprocessor with suitable software) may be provided for multiplying 1 ⁇ N spectral measurement vector M by N ⁇ N transform matrix C ( 30 ) to generate the corrected spectrum R.
- N ⁇ N transform matrix C ( 30 ) may be obtained by calculating a set of basis function weighting vectors based on the difference between measured spectra values for a plurality of color samples and a set of reference spectra values for said color samples.
- FIG. 8 shows the formation of the spectral difference vectors E ( 60 ).
- Reference spectra values 65 may be obtained from a reference instrument 75 .
- the reference spectra values can be represented by a K ⁇ N array of vectors R.
- Color sensing instrument 10 obtains measurements of a training set of K color samples 70 , which measurements are represented by a K ⁇ N array of vectors M comprised of K measurement vectors ( 80 ).
- Spectral difference vectors E are obtained by subtracting measured spectra values M from known reference spectra values R ( 85 ).
- the same procedure can alternately be used to obtain the spectral difference vector E where calibration values ( 90 ) for the K color samples are known. In this instance, measured spectra values M are subtracted from calibration values 90 to obtain the spectral difference vector 60 .
- FIG. 9 shows an example of the formation of the N ⁇ N transform (correction) matrix 30 .
- each sample K from the training set 70 has a known reference reflectance spectra value.
- the number of K color samples in the training set ( 70 of FIG. 8) is less than N.
- the spectral difference vectors E ( 60 ) are obtained as described in connection with FIG. 8 .
- a representation of the difference between the measured spectra values 80 and the reference reflectance spectra values is solved for using a set of D basis functions 95 .
- the number of basis functions (D) may be less than or equal to the lesser of K or N and the basis functions 95 may be represented by the D columns in an N ⁇ D array.
- the solution obtained from the solving step ( 100 ) may be designated by an array of D ⁇ N amplitudes (basis function weighting vectors 110 ).
- the N ⁇ N matrix 30 (correction matrix) can then be formed by adding an identity matrix I ( 115 ) to the product of the N ⁇ D basis set and the D ⁇ N amplitude array ( 120 ) (referred to above as “crosstalk correlation factors”).
- the correction matrix 30 can then be used as discussed in connection with FIG. 7 to provide correction for color measurements of an unknown sample made by the color sensing device.
- Basis functions 95 may be stored in color sensing device 10 when basis functions 95 are known and fixed. When basis functions 95 are variable, both basis functions 95 and associated basis function weightings may be stored in color sensing device 10 .
- Basis functions 95 may depend upon characteristics of the differences between the measured spectra values and reference spectra values ( 60 ). For example, FIG. 9 shows basis functions 95 as being extracted ( 62 ) from the set of error vectors E ( 60 ).
- basis functions 95 may comprise principal components of the difference between the measured spectra values and the reference spectra values (e.g., principal components of spectral difference vector E ( 60 )).
- the principal components may be stored in color sensing device 10 .
- the principal components of a system are the functions that represent the highest variances found.
- the principal components may be selected by forming a covariance matrix of the difference between measured spectra values and reference reflectance spectra values ( 60 of FIG. 8 ).
- the covariance matrix may then be decomposed into a set of orthogonal eigenvectors.
- the row vectors of the eigenvectors are then normalized to form basis vectors. These basis vectors are then sorted by the magnitude of the corresponding eigenvector. Selecting the first D of the largest vectors from the basis vectors provides the principal components.
- the known reference reflectance spectra values may be either calibration spectra values 90 or simulation spectra values 65 .
- the known reference reflectance spectra values may be obtained from reference instrument 75 .
- the present invention provides methods and apparatus for transforming, with minimum error, a spectral color measurement obtained by a target instrument, to the spectrum which would have been obtained by another, reference, instrument. This is accomplished via a linear algebra implementation, using vectors and matrices.
- a spectrum is represented by a row vector of N spectral samples, each representing the energy in its corresponding spectral band.
- N is the same for both the target and the reference instrument.
- This invention does not pertain to changing the number of bands in a spectrum, but when there is a difference between spectra from different instruments, it is common to convert between them using well-established methods of interpolation or averaging.
- correction The conversion from a target measurement to a reference spectrum is called correction.
- the correction is accomplished by the vector equation:
- R is the 1 ⁇ N reference spectrum
- M is the 1 ⁇ N measured spectrum
- C is the N ⁇ N spectral correction matrix.
- the content of C embodies the (linear) transform between the two instruments (target instrument and reference instrument).
- C may obtained by processing a set of reference spectra and measured spectra of a number of color specimens having varied spectral characteristics.
- N is large, as in the case of high resolution spectra, this becomes impractical.
- the dimensionality of the system is less than the number of samples used to represent a spectrum. When this occurs, solving for C will become difficult or impossible. Even when a solution can be found, it will be unduly sensitive to noise in the measurements, and artifacts in the corrected spectrum will result.
- E, R, and M are 1 ⁇ N row vectors representing the error, reference, and measured spectra respectively.
- E can be represented in terms of the measured spectrum, M by some combination of its N elements:
- T is some (to be determined) N ⁇ N matrix.
- T represents the mapping from a measurement vector M to its difference from the reference vector R.
- the columns of T can be represented by a superposition of basis functions.
- the number and choice of functions for this purpose will depend on the nature of the difference spectra and the accuracy to which they will be approximated. Trigonometric functions are often used as bases, and the well-known Fourier series results. Other functions are also suitable and may better approximate the underlying physical causes for the differences between the target and reference instruments.
- a method for obtaining principal components to be used as basis functions is one aspect of this invention.
- the basis functions can be evaluated at each of the N spectral bands.
- Each basis function forms a column in an N ⁇ D array, B, where D is the number of basis functions used. These columns, added together with appropriate weighting factors, A, generate the columns of T. Because T is formed from D basis functions, it has dimensionality no larger than D, which can be significantly smaller than N. Further, the basis functions can be selected for properties such as smoothness, which will maintain continuous smooth behavior in the resulting spectrum. Therefore:
- I is the N ⁇ N identity matrix.
- E, R, and M are arrays of K row vectors representing the error, reference, and measured spectra respectively.
- the K color specimens regarded as the training (reference) set, should be selected with some care. They should be selected to represent a large range of possible spectra that will be encountered.
- the color specimens in the training set should be spectrally independent of each other, i.e. there should not be duplicate hues, and they should not all be made from combinations of only a few pigments or colorants.
- K be > 2D. This reduces the chance that the weights in A are “tuned” to a small set of spectra.
- K>2D the approximation error for the training set is increased slightly, but the error for all spectra outside of the training set is significantly reduced.
- the weights determined for A depend on the choice of basis functions. While trigonometric bases, and collections of Gaussian waveforms are effective at representing the difference spectra, their exact specification are empirically determined, and may not be optimal in representing the entire variety of spectral differences in E. As discussed above, the basis functions may comprise principal components, which are very efficient for this purpose. The vector equations for obtaining the principal components of the difference between the measured spectra values and the reference spectra values are described below. The covariance matrix of E is formed:
- the covariance matrix can, by linear algebra methods, be decomposed into a set of orthogonal eigenvectors, U:
- A is a diagonal matrix of eigenvalues.
- the row vectors of U, U i can be normalized to form suitable basis functions for the system:
- basis vectors can be sorted by the magnitude of their corresponding eigenvector.
- the vector corresponding to the largest eigenvalue represents the largest component of the difference vectors found in E.
- the present invention provides advantageous methods and apparatus for transforming, with minimum error, a spectral color measurement obtained by a target instrument, to the spectrum which would have been obtained by another, reference, instrument.
Abstract
Description
Claims (22)
Priority Applications (3)
| Application Number | Priority Date | Filing Date | Title |
|---|---|---|---|
| US09/849,282 US6539323B2 (en) | 2001-05-04 | 2001-05-04 | Methods and apparatus for correcting spectral color measurements |
| EP02769284A EP1384050A2 (en) | 2001-05-04 | 2002-04-24 | Methods and apparatus for correcting spectral color measurements |
| PCT/US2002/012954 WO2002091755A2 (en) | 2001-05-04 | 2002-04-24 | Methods and apparatus for correcting spectral color measurements |
Applications Claiming Priority (1)
| Application Number | Priority Date | Filing Date | Title |
|---|---|---|---|
| US09/849,282 US6539323B2 (en) | 2001-05-04 | 2001-05-04 | Methods and apparatus for correcting spectral color measurements |
Publications (2)
| Publication Number | Publication Date |
|---|---|
| US20020165684A1 US20020165684A1 (en) | 2002-11-07 |
| US6539323B2 true US6539323B2 (en) | 2003-03-25 |
Family
ID=25305475
Family Applications (1)
| Application Number | Title | Priority Date | Filing Date |
|---|---|---|---|
| US09/849,282 Expired - Lifetime US6539323B2 (en) | 2001-05-04 | 2001-05-04 | Methods and apparatus for correcting spectral color measurements |
Country Status (3)
| Country | Link |
|---|---|
| US (1) | US6539323B2 (en) |
| EP (1) | EP1384050A2 (en) |
| WO (1) | WO2002091755A2 (en) |
Cited By (10)
| Publication number | Priority date | Publication date | Assignee | Title |
|---|---|---|---|---|
| WO2006015251A2 (en) * | 2004-07-29 | 2006-02-09 | The Research Foundation Of State University Of New York | System and method for cross-talk cancellation in a multilane fluorescence detector |
| WO2006052556A2 (en) * | 2004-11-05 | 2006-05-18 | E.I. Dupont De Nemours And Company | Computer-implemented color adjustment method and program using stored color values |
| US20060221337A1 (en) * | 2005-03-29 | 2006-10-05 | Xerox Corporation | Method for corrected spectrophotometer output for measurements on multiple substrates |
| US20080094940A1 (en) * | 1998-08-04 | 2008-04-24 | Teledyne Rd Instruments, Inc. | System and method for measuring wave directional spectrum and wave height |
| US20080308343A1 (en) * | 2007-06-18 | 2008-12-18 | Teledyne Rd Instruments, Inc. | System and method of acoustic doppler beamforming |
| US20100142324A1 (en) * | 2008-12-08 | 2010-06-10 | Teledyne Rd Instruments, Inc. | Multi-state beamforming array |
| US20100246805A1 (en) * | 2001-07-31 | 2010-09-30 | Robert Hausman | Crosstalk identification for spectrum management in broadband telecommunications systems |
| US20100302908A1 (en) * | 2009-05-27 | 2010-12-02 | Strong Brandon S | System and method for determining wave characteristics from a moving platform |
| US8988682B2 (en) | 2012-10-23 | 2015-03-24 | Apple Inc. | High accuracy imaging colorimeter by special designed pattern closed-loop calibration assisted by spectrograph |
| US20220228913A1 (en) * | 2019-06-18 | 2022-07-21 | ams Sensors Germany GmbH | Spectral reconstruction of detector sensitivity |
Families Citing this family (19)
| Publication number | Priority date | Publication date | Assignee | Title |
|---|---|---|---|---|
| US7555396B2 (en) * | 2005-03-22 | 2009-06-30 | Xerox Corporation | Method and system to personalize sensor characterizing reference database in multiple LED spectrophotometers |
| US8345252B2 (en) * | 2005-04-25 | 2013-01-01 | X-Rite, Inc. | Method and system for enhanced formulation and visualization rendering |
| DE102005062388A1 (en) * | 2005-12-23 | 2007-06-28 | Endress + Hauser Conducta Gesellschaft für Mess- und Regeltechnik mbH + Co. KG | Measuring device e.g. turbidity measuring device, for laboratory reference process, involves updating instruction based on actual calibration and reference measuring values, where earlier values pair is considered for updating instructions |
| US7986829B2 (en) * | 2007-11-29 | 2011-07-26 | Canon Kabushiki Kaisha | Generating a transformed interim connection space for spectral data |
| US7916341B2 (en) * | 2007-11-29 | 2011-03-29 | Canon Kabushiki Kaisha | Generating an Interim Connection Space for spectral data |
| US7940423B2 (en) * | 2007-11-30 | 2011-05-10 | Canon Kabushiki Kaisha | Generating a device independent interim connection space for spectral data |
| US8009906B2 (en) * | 2007-12-11 | 2011-08-30 | Canon Kabushiki Kaisha | Spectral gamut mapping based on a colorimetric gamut mapping |
| US8098400B2 (en) * | 2008-01-23 | 2012-01-17 | Canon Kabushiki Kaisha | Gamut mapping in spectral space based on an objective function |
| US8340937B2 (en) * | 2010-05-11 | 2012-12-25 | Xerox Corporation | Characterization of a model-based spectral reflectance sensing device |
| DE102010030488A1 (en) * | 2010-06-24 | 2011-12-29 | Endress + Hauser Conducta Gesellschaft für Mess- und Regeltechnik mbH + Co. KG | Method for adjusting a measuring device in process analysis technology |
| US8705121B2 (en) * | 2010-09-30 | 2014-04-22 | Ricoh Production Print Solutions | Testing printer calibration |
| JP5937780B2 (en) * | 2010-11-11 | 2016-06-22 | ソニー株式会社 | Fluorescence spectrum correction method and fluorescence spectrum measuring apparatus |
| JP5938911B2 (en) * | 2012-01-12 | 2016-06-22 | セイコーエプソン株式会社 | Spectral measurement method, spectroscopic instrument, and conversion matrix generation method |
| JP5834938B2 (en) * | 2012-01-17 | 2015-12-24 | 株式会社リコー | Spectral characteristic acquisition apparatus, image evaluation apparatus, image forming apparatus, and spectral characteristic acquisition method |
| US8928901B2 (en) * | 2012-01-17 | 2015-01-06 | Xerox Corporation | Generating an image profile LUT for a N-color marking device via multi-objective cost minimization |
| CN102749290B (en) * | 2012-07-02 | 2014-12-03 | 浙江大学 | Method for detecting growth state of branches of crown canopy of cherry tree |
| US10753860B2 (en) * | 2015-07-10 | 2020-08-25 | Sony Corporation | Inspection apparatus, inspection method, and program |
| FR3094791B1 (en) * | 2019-04-04 | 2021-07-02 | Greentropism | Method for configuring a spectrometry device |
| CN111678878B (en) * | 2020-08-11 | 2020-11-17 | 民康医疗科技(天津)有限公司 | Method for calibrating and testing optical in-vitro detection instrument |
Citations (7)
| Publication number | Priority date | Publication date | Assignee | Title |
|---|---|---|---|---|
| US5272518A (en) | 1990-12-17 | 1993-12-21 | Hewlett-Packard Company | Colorimeter and calibration system |
| US5673336A (en) * | 1993-12-23 | 1997-09-30 | International Business Machines Corporation | Automatic cross color elimination |
| US5880738A (en) | 1994-08-11 | 1999-03-09 | Canon Information Systems Research Australia Pty Ltd. | Color mapping system utilizing weighted distance error measure |
| US5963333A (en) | 1996-09-12 | 1999-10-05 | Color Savvy Systems Limited | Color sensor |
| US6052334A (en) * | 1998-08-04 | 2000-04-18 | Rowe-Deines Instruments | System and method for measuring wave directional spectrum and wave height |
| US6058357A (en) | 1995-02-24 | 2000-05-02 | Light Source Acquisition Company | Color measurement system including a digital color sensor and a host computer in communication with the color sensor |
| US6088117A (en) | 1997-08-28 | 2000-07-11 | Minolta Co., Ltd. | Reflection characteristic measuring apparatus |
Family Cites Families (2)
| Publication number | Priority date | Publication date | Assignee | Title |
|---|---|---|---|---|
| DE1797591A1 (en) * | 1967-10-02 | 1974-07-04 | Minolta Camera Kk | ARRANGEMENT OF A MULTIPLE PHOTO CONVERTERS FOR USE IN A COLOR ANALYZER |
| DE4434168B4 (en) * | 1994-09-24 | 2004-12-30 | Byk-Gardner Gmbh | Device and method for measuring and evaluating spectral radiation and in particular for measuring and evaluating color properties |
-
2001
- 2001-05-04 US US09/849,282 patent/US6539323B2/en not_active Expired - Lifetime
-
2002
- 2002-04-24 WO PCT/US2002/012954 patent/WO2002091755A2/en not_active Application Discontinuation
- 2002-04-24 EP EP02769284A patent/EP1384050A2/en not_active Withdrawn
Patent Citations (8)
| Publication number | Priority date | Publication date | Assignee | Title |
|---|---|---|---|---|
| US5272518A (en) | 1990-12-17 | 1993-12-21 | Hewlett-Packard Company | Colorimeter and calibration system |
| US5673336A (en) * | 1993-12-23 | 1997-09-30 | International Business Machines Corporation | Automatic cross color elimination |
| US5880738A (en) | 1994-08-11 | 1999-03-09 | Canon Information Systems Research Australia Pty Ltd. | Color mapping system utilizing weighted distance error measure |
| US6058357A (en) | 1995-02-24 | 2000-05-02 | Light Source Acquisition Company | Color measurement system including a digital color sensor and a host computer in communication with the color sensor |
| US5963333A (en) | 1996-09-12 | 1999-10-05 | Color Savvy Systems Limited | Color sensor |
| US6020583A (en) | 1996-09-12 | 2000-02-01 | Color Savvy Systems Limited | Color sensor |
| US6088117A (en) | 1997-08-28 | 2000-07-11 | Minolta Co., Ltd. | Reflection characteristic measuring apparatus |
| US6052334A (en) * | 1998-08-04 | 2000-04-18 | Rowe-Deines Instruments | System and method for measuring wave directional spectrum and wave height |
Cited By (23)
| Publication number | Priority date | Publication date | Assignee | Title |
|---|---|---|---|---|
| US7545705B2 (en) * | 1998-08-04 | 2009-06-09 | Teledyne Rd Instruments, Inc. | System and method for measuring wave directional spectrum and wave height |
| US20080094940A1 (en) * | 1998-08-04 | 2008-04-24 | Teledyne Rd Instruments, Inc. | System and method for measuring wave directional spectrum and wave height |
| US8477590B2 (en) * | 2001-07-31 | 2013-07-02 | Intellectual Ventures Ii Llc | Crosstalk identification for spectrum management in broadband telecommunications systems |
| US20100246805A1 (en) * | 2001-07-31 | 2010-09-30 | Robert Hausman | Crosstalk identification for spectrum management in broadband telecommunications systems |
| US20070194249A1 (en) * | 2004-07-29 | 2007-08-23 | Gavrilov Dmitri N | System And Method For Cross-Talk Cancellation In A Multilane Fluorescence Detector |
| WO2006015251A2 (en) * | 2004-07-29 | 2006-02-09 | The Research Foundation Of State University Of New York | System and method for cross-talk cancellation in a multilane fluorescence detector |
| US7402817B2 (en) | 2004-07-29 | 2008-07-22 | The Research Foundation Of State University Of New York | System and method for cross-talk cancellation in a multilane fluorescence detector |
| WO2006015251A3 (en) * | 2004-07-29 | 2009-05-14 | Univ New York State Res Found | System and method for cross-talk cancellation in a multilane fluorescence detector |
| WO2006052556A2 (en) * | 2004-11-05 | 2006-05-18 | E.I. Dupont De Nemours And Company | Computer-implemented color adjustment method and program using stored color values |
| WO2006052556A3 (en) * | 2004-11-05 | 2007-02-15 | Du Pont | Computer-implemented color adjustment method and program using stored color values |
| US7307720B2 (en) * | 2005-03-29 | 2007-12-11 | Xerox Corporation | Method for corrected spectrophotometer output for measurements on multiple substrates |
| US20060221337A1 (en) * | 2005-03-29 | 2006-10-05 | Xerox Corporation | Method for corrected spectrophotometer output for measurements on multiple substrates |
| US20080308343A1 (en) * | 2007-06-18 | 2008-12-18 | Teledyne Rd Instruments, Inc. | System and method of acoustic doppler beamforming |
| US7847925B2 (en) | 2007-06-18 | 2010-12-07 | Teledyne Rd Instruments, Inc. | System and method of acoustic doppler beamforming |
| USRE45823E1 (en) | 2007-06-18 | 2015-12-22 | Teledyne Rd Instruments, Inc. | System and method of acoustic doppler beamforming |
| US20100142324A1 (en) * | 2008-12-08 | 2010-06-10 | Teledyne Rd Instruments, Inc. | Multi-state beamforming array |
| US8254208B2 (en) | 2008-12-08 | 2012-08-28 | Teledyne Rd Instruments, Inc. | Multi-state beamforming array |
| US8514659B2 (en) | 2008-12-08 | 2013-08-20 | Teledyne Rd Instruments, Inc. | Multi-state beamforming array |
| US20100302908A1 (en) * | 2009-05-27 | 2010-12-02 | Strong Brandon S | System and method for determining wave characteristics from a moving platform |
| US8654607B2 (en) | 2009-05-27 | 2014-02-18 | Teledyne Rd Instruments, Inc. | System and method for determining wave characteristics from a moving platform |
| US9739882B2 (en) | 2009-05-27 | 2017-08-22 | Teledyne Instruments, Inc. | System and method for determining wave characteristics from a moving platform |
| US8988682B2 (en) | 2012-10-23 | 2015-03-24 | Apple Inc. | High accuracy imaging colorimeter by special designed pattern closed-loop calibration assisted by spectrograph |
| US20220228913A1 (en) * | 2019-06-18 | 2022-07-21 | ams Sensors Germany GmbH | Spectral reconstruction of detector sensitivity |
Also Published As
| Publication number | Publication date |
|---|---|
| WO2002091755A2 (en) | 2002-11-14 |
| WO2002091755A3 (en) | 2003-05-22 |
| US20020165684A1 (en) | 2002-11-07 |
| EP1384050A2 (en) | 2004-01-28 |
Similar Documents
| Publication | Publication Date | Title |
|---|---|---|
| US6539323B2 (en) | Methods and apparatus for correcting spectral color measurements | |
| US7864320B2 (en) | Method to minimize instrument differences in color management functions | |
| US6768814B1 (en) | Methods applying color measurement by means of an electronic imaging device | |
| Pike | Using digital cameras to investigate animal colouration: estimating sensor sensitivity functions | |
| US6587793B2 (en) | Systems and methods for determining spectra using fuzzy inference algorithms with measurements from LED color sensor | |
| JP4074715B2 (en) | Determining the optimal color space direction for selecting color modulation | |
| CA2276750C (en) | Calibration system for spectrographic analyzing instruments | |
| JPH01313724A (en) | Coloring method by triaxes plane vector color space | |
| Gökmen et al. | A non-contact computer vision based analysis of color in foods | |
| KR102012219B1 (en) | Apparatus and method for measuring skin color | |
| CN110926609B (en) | Spectrum reconstruction method based on sample feature matching | |
| CN111492198B (en) | Object shape measuring apparatus and method, and program | |
| CN102652254A (en) | Method for generating calibrated color data | |
| US10408681B2 (en) | Spectrocolorimetric device and spectral reflectance calculating method | |
| US6115492A (en) | Multiple purpose composite target for digital imaging test and calibration | |
| US20010048765A1 (en) | Color characterization for inspection of a product having nonuniform color characteristics | |
| US7555396B2 (en) | Method and system to personalize sensor characterizing reference database in multiple LED spectrophotometers | |
| AU2002307530A1 (en) | Methods and apparatus for correcting spectral color measurements | |
| CN110926608B (en) | Spectrum reconstruction method based on light source screening | |
| CN113795748A (en) | Method for configuring a spectrometric device | |
| US10514300B2 (en) | Spectrocolorimetric device and conversation rule setting method | |
| Hwang et al. | Surface color measurement uncertainties | |
| Cassatella et al. | On the Wilson-Bappu relationship in the MgII k line | |
| Vrhel | LED-based spectrophotometric instrument | |
| JP2011002287A (en) | Method for obtaining color value from spectral data and colorimeter |
Legal Events
| Date | Code | Title | Description |
|---|---|---|---|
| AS | Assignment |
Owner name: ELECTRONICS FOR IMAGING, INC., A DELAWARE CORPORAT Free format text: ASSIGNMENT OF ASSIGNORS INTEREST;ASSIGNOR:OLSON, THOR A.;REEL/FRAME:011785/0330 Effective date: 20010502 |
|
| FEPP | Fee payment procedure |
Free format text: PAYOR NUMBER ASSIGNED (ORIGINAL EVENT CODE: ASPN); ENTITY STATUS OF PATENT OWNER: LARGE ENTITY |
|
| STCF | Information on status: patent grant |
Free format text: PATENTED CASE |
|
| FPAY | Fee payment |
Year of fee payment: 4 |
|
| FPAY | Fee payment |
Year of fee payment: 8 |
|
| FPAY | Fee payment |
Year of fee payment: 12 |
|
| AS | Assignment |
Owner name: CITIBANK, N.A., AS ADMINISTRATIVE AGENT, TEXAS Free format text: GRANT OF SECURITY INTEREST IN PATENTS;ASSIGNOR:ELECTRONICS FOR IMAGING, INC.;REEL/FRAME:048002/0135 Effective date: 20190102 |
|
| AS | Assignment |
Owner name: ROYAL BANK OF CANADA, CANADA Free format text: SECURITY INTEREST;ASSIGNOR:ELECTRONICS FOR IMAGING, INC.;REEL/FRAME:049840/0799 Effective date: 20190723 Owner name: ELECTRONICS FOR IMAGING, INC., CALIFORNIA Free format text: RELEASE OF SECURITY INTEREST IN PATENTS;ASSIGNOR:CITIBANK, N.A., AS ADMINISTRATIVE AGENT;REEL/FRAME:049840/0316 Effective date: 20190723 Owner name: DEUTSCHE BANK TRUST COMPANY AMERICAS, NEW YORK Free format text: SECOND LIEN SECURITY INTEREST IN PATENT RIGHTS;ASSIGNOR:ELECTRONICS FOR IMAGING, INC.;REEL/FRAME:049841/0115 Effective date: 20190723 |
|
| AS | Assignment |
Owner name: ELECTRONICS FOR IMAGING, INC., NEW HAMPSHIRE Free format text: RELEASE BY SECURED PARTY;ASSIGNOR:DEUTSCHE BANK TRUST COMPANY AMERICAS, AS AGENT;REEL/FRAME:066793/0001 Effective date: 20240307 |
|
| AS | Assignment |
Owner name: CERBERUS BUSINESS FINANCE AGENCY, LLC, NEW YORK Free format text: SECURITY INTEREST;ASSIGNORS:ELECTRONICS FOR IMAGING, INC.;FIERY, LLC;REEL/FRAME:066794/0315 Effective date: 20240312 |