US6661223B2 - Method of testing for response abnormalities in a magnetic sensor - Google Patents
Method of testing for response abnormalities in a magnetic sensor Download PDFInfo
- Publication number
- US6661223B2 US6661223B2 US10/041,282 US4128202A US6661223B2 US 6661223 B2 US6661223 B2 US 6661223B2 US 4128202 A US4128202 A US 4128202A US 6661223 B2 US6661223 B2 US 6661223B2
- Authority
- US
- United States
- Prior art keywords
- sensor
- field
- value
- magnetic field
- applied magnetic
- Prior art date
- Legal status (The legal status is an assumption and is not a legal conclusion. Google has not performed a legal analysis and makes no representation as to the accuracy of the status listed.)
- Expired - Fee Related
Links
Images


Classifications
-
- G—PHYSICS
- G01—MEASURING; TESTING
- G01R—MEASURING ELECTRIC VARIABLES; MEASURING MAGNETIC VARIABLES
- G01R33/00—Arrangements or instruments for measuring magnetic variables
- G01R33/02—Measuring direction or magnitude of magnetic fields or magnetic flux
-
- B—PERFORMING OPERATIONS; TRANSPORTING
- B82—NANOTECHNOLOGY
- B82Y—SPECIFIC USES OR APPLICATIONS OF NANOSTRUCTURES; MEASUREMENT OR ANALYSIS OF NANOSTRUCTURES; MANUFACTURE OR TREATMENT OF NANOSTRUCTURES
- B82Y10/00—Nanotechnology for information processing, storage or transmission, e.g. quantum computing or single electron logic
-
- B—PERFORMING OPERATIONS; TRANSPORTING
- B82—NANOTECHNOLOGY
- B82Y—SPECIFIC USES OR APPLICATIONS OF NANOSTRUCTURES; MEASUREMENT OR ANALYSIS OF NANOSTRUCTURES; MANUFACTURE OR TREATMENT OF NANOSTRUCTURES
- B82Y25/00—Nanomagnetism, e.g. magnetoimpedance, anisotropic magnetoresistance, giant magnetoresistance or tunneling magnetoresistance
-
- G—PHYSICS
- G11—INFORMATION STORAGE
- G11B—INFORMATION STORAGE BASED ON RELATIVE MOVEMENT BETWEEN RECORD CARRIER AND TRANSDUCER
- G11B5/00—Recording by magnetisation or demagnetisation of a record carrier; Reproducing by magnetic means; Record carriers therefor
- G11B5/127—Structure or manufacture of heads, e.g. inductive
- G11B5/33—Structure or manufacture of flux-sensitive heads, i.e. for reproduction only; Combination of such heads with means for recording or erasing only
- G11B5/39—Structure or manufacture of flux-sensitive heads, i.e. for reproduction only; Combination of such heads with means for recording or erasing only using magneto-resistive devices or effects
- G11B2005/3996—Structure or manufacture of flux-sensitive heads, i.e. for reproduction only; Combination of such heads with means for recording or erasing only using magneto-resistive devices or effects large or giant magnetoresistive effects [GMR], e.g. as generated in spin-valve [SV] devices
-
- G—PHYSICS
- G11—INFORMATION STORAGE
- G11B—INFORMATION STORAGE BASED ON RELATIVE MOVEMENT BETWEEN RECORD CARRIER AND TRANSDUCER
- G11B5/00—Recording by magnetisation or demagnetisation of a record carrier; Reproducing by magnetic means; Record carriers therefor
- G11B5/455—Arrangements for functional testing of heads; Measuring arrangements for heads
Definitions
- the present invention relates generally to magnetic sensors used in hard disk drives incorporated in computer systems; and more specifically to a method of testing for magnetic sensor response abnormalities.
- Magnetic sensors used to read the recorded information previously written on a disk in a disk drive are expected to meet several performance criteria.
- One of the most important criterion is that the response of the sensor be predictable and free from nonlinear response abnormalities. It is desirable to be able to evaluate the sensors for these abnormalities.
- the method used for evaluation must be fast, inexpensive, and above all reliable in identifying those sensors which have response abnormalities.
- MR magnetoresistive
- GMR giant magnetoresistive
- Tunnel junction sensors are also being developed for use in disk drives. All of these sensors are constructed by forming multiple layers of thin films. The sensor output changes in response to the magnitude of an external magnetic field. Within the disk drive the external magnetic field comes from the written transitions on the disk. When testing sensors outside of a disk drive, the external magnetic field is provided by a coil or other means.
- the response of the sensor must be reasonably linear with respect to changes in the applied field.
- Some of the thin films in the sensor are magnetic and therefore are subject to anomalous magnetic behavior.
- the sensor may exhibit Barkhausen abrupt domain movement in the magnetic films within the sensor.
- a transfer curve also called a transfer function, is a plot of sensor output, either voltage or resistance, vs. applied field magnitude.
- a Barkhausen domain movement can be identified by observing a discontinuity, also called a jump, in a transfer curve.
- a kink is similar to a jump but is observed as a more gradual discontinuity in the transfer curve.
- Another type of undesirable sensor behavior is observed as an open loop in the transfer curve. Open loops occur when the films within the sensor are magnetically switched through a hysteresis loop.
- Nonlinear response abnormalities can cause errors when detecting magnetic transitions on a disk.
- the ability of removing the sensors which have response abnormalities from the general population of sensors results in an improvement in the overall quality of the group of sensors which is subsequently placed in disk drives.
- the invention provides for a testing method which is efficient in detecting sensor response abnormalities. Furthermore one embodiment of the invention is capable of detecting the presence of abnormalities which are not well defined.
- the value of the applied magnetic field is incrementally changed and the direction of the applied magnetic field is alternated at each magnetic field value.
- the detectability of any response abnormality is substantially improved when using an alternating field to excite the sensor.
- Another embodiment of the present invention provides an improved method for the efficient detection of subtle and ill-defined response abnormalities by examining the departure of the transfer curve of the sensor from an ideal linear transfer curve.
- multiple values of the sensor voltage or resistance values are measured at each field value and the range of sensor values are examined to indicate abnormalities.
- FIG. 1 shows the placement of a magnetic sensor in a magnetic field
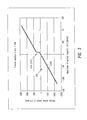
- FIG. 2 shows a transfer curve with no response abnormalities
- FIG. 3 shows a transfer curve having a kink
- FIG. 4 shows a transfer curve having an open loop
- FIG. 5 shows a transfer curve having a gradual kink
- FIG. 6 shows an example of a sequence of applied magnetic field values
- FIG. 7 shows the residual after subtracting a fitted line from a transfer curve indicating a kink
- FIG. 8 shows a transfer curve having a kink and the corresponding point by point slope values.
- FIG. 9 shows a transfer curve having two kinks and the corresponding plot of range values.
- FIG. 10 shows a flowchart of a first method of testing a sensor for the presence of response abnormalities.
- FIG. 11 shows a flowchart of a second method of testing a sensor for the presence of response abnormalities.
- the method of testing for response abnormalities in magnetic sensors involves alternating the polarity of the applied field and using an improved method to examine the data for the abnormalities.
- the present method is more effective in identifying sensors with response abnormalities than the prior art process of using a monotonically increasing applied field and simply inspecting the data for a large change in sensor output.
- FIG. 1 shows a diagram of the sensor 102 in an applied magnetic field 104 .
- the bias current 106 is also shown.
- the resistance of the sensor 102 is typically measured by passing a constant bias current 106 through the sensor 102 and measuring the voltage 108 across the sensor 102 .
- the output of the sensor can be reported as voltage or equivalently as resistance of the sensor.
- the magnetic field 104 can be generated by several known techniques such as using a Helmholz coil or using a coil wrapped around a ferromagnetic material such as iron. Prior to testing the sensor is typically lapped to the correct stripe height. The measurements may be conducted on sensors which are incorporated in rows of lapped sliders, individual sliders containing a single sensor, a finished head-gimbal assembly having a sensor, or an assembly of head-gimbals.
- FIG. 2 shows a plot of a transfer curve 200 for a typical sensor which does not show any magnetic response abnormality.
- the output was measured as voltage with a constant current of 4 mA passed through the sensor.
- the output of the sensor is linear with respect to the magnitude of the applied field.
- the field magnitude originating from a written transition is about 70 to 100 Oersteds.
- the maximum applied field used in the measurement of the transfer curve typically about 120 Oersteds, is chosen to be somewhat higher than the field from the disk.
- FIG. 3 shows an example of a typical transfer curve 300 of a sensor which shows a kink 302 .
- Kinks can range from being steps or jumps in the transfer curve to more slowly varying changes. If the sensor is relatively large a kink in the transfer curve typically occurs over a small change in the magnitude of the applied field. Accordingly the slope of the region of the transfer curve 300 where the kink 302 occurs is large compared with the average slope 304 of the transfer curve.
- FIG. 4 shows an example of a typical transfer curve 400 of a sensor which shows an open loop 402 .
- a kink may be observed at a certain field value as the applied field is increased from a minimum to a maximum value.
- the transfer curve is made as the external field is reduced from a maximum to a minimum value, the kink may not be observed at the same field magnitude. Accordingly there is hysteretic behavior and an open loop is observed in the transfer curve.
- Both kinks 302 and loops 402 are related phenomenon and are known generally as sensor response abnormalities. Sensor response abnormalities are generally caused by magnetic instabilities in the films comprising the sensor. These response abnormalities cause signal distortions which can generate errors when reading back data in a disk drive.
- FIG. 5 shows a transfer curve 500 for a relatively small sensor which displays a kink 502 .
- the transfer curve 500 There is also a small amount of open loop behavior in the transfer curve 500 .
- the sensor is small, the kink 502 is broader with respect to the applied field and the slope of the curve in the vicinity of the kink is not as large as in the case for the larger sensor illustrated in FIG. 3 .
- the physical size of sensors must decrease as the required density of stored data on the disk increases. Since sensors in general are getting smaller with each new disk drive product and the kinks and other response abnormalities are becoming less well defined and more difficult to identify, it is highly desirable to improve the efficiency of detecting these response abnormalities.
- one aspect of the present invention is to alternate the applied magnetic field direction during the transfer curve measurements.
- One example of the sequence of applied magnetic field magnitudes and directions is illustrated in FIG. 6 .
- the initial value of the applied field is about zero. It is also possible to choose an initial value of the field which is some other value such as close to the maximum value.
- the values of the intervals of the field values are approximately the same. This is convenient but not necessary; the values of each interval may be chosen independently.
- FIG. 10 is a flow chart illustrating a first method of detecting sensor abnormalities using the alternating field method.
- a sensor is placed in a region where an external field is to be applied.
- the initial value is essentially zero.
- This method of alternating the field improves the detectability of the sensor abnormalities and is particularly useful for relatively small sensors.
- the specific example of field values shown in FIG. 6 shows a step size of 10 Oersteds. This is a convenient value, however the step size can be as small or large as desired to obtain the optimum tradeoff between speed of measurement and resolution of response abnormality.
- the incrementally changing step sizes of the magnetic field can also be varied during a measurement.
- One method of inspecting the transfer curve for response abnormalities is to fit a mathematical function to the experimental transfer curve.
- the mathematical function can be as simple as a straight line.
- FIG. 7 shows the result of fitting a straight line to the data in FIG. 5 and subtracting that line from the data to form the residual.
- the signal ranged from nearly ⁇ 1000 ⁇ V to almost +1000 ⁇ V
- the residual only ranges from about ⁇ 150 ⁇ V to about +100 ⁇ V.
- the step 702 which occurs at an applied field magnitude of approximately ⁇ 15 Oersteds is much more visible.
- a simple program can be written to make this inspection automatic.
- FIG. 8 An alternative method of examining the transfer curve for the presence of kinks is to calculate the slope of the transfer curve at every interval of field value. This technique is illustrated in FIG. 8 .
- the transfer curve is plotted as a dotted line 802 .
- a gradual kink 804 can be seen in the transfer curve at an applied field of approximately 40 Oersteds.
- the slope of the transfer curve is plotted as a solid line 806 .
- the magnitude of the slope increases substantially at approximately 40 Oersteds indicating the presence of a kink 804 .
- This particular kink 804 would be easily detected with using an predetermined slope clip level of approximately 12 microvolts/Oe.
- FIG. 11 is a flowchart illustrating this method of testing a sensor for response abnormalities.
- a sensor is placed in a region where an external field is applied.
- the initial value is essentially zero.
- Steps 3 and 4 above are repeated without increasing the magnitude of the applied field until a preset number of measurements are made at that specific field magnitude.
- the field increment is 10 Oersteds, however any convenient field increment can be used.
- FIG. 9 An example of this method of testing for response abnormalities is shown in FIG. 9 .
- the transfer curve 902 is plotted.
- Two kinks 904 , 906 can be observed in the transfer curve 902 .
- the range 908 of the resistance measurements is plotted as a function of applied field magnitude.
- two areas 910 , 912 are shown which have exceptionally high values.
- the location of the peaks 910 , 912 in the range plot correspond to the location of the kinks 904 , 906 .
- the instabilities which are responsible for the sensor response abnormalities are associated with exceptional variability in the resistance measurements.
- the range plot of the voltage measurements is constructed.
- the number of measurements to be collected at each applied field magnitude can be chosen as a compromise between testing time and statistical significance.
- sixteen measurements were taken at each field value. Then a clip level for the range is chosen. Again using the data from FIG. 9 a range of greater than about 60 ⁇ V would have been effective in identifying both kinks in the transfer curve.
Abstract
Description
Claims (7)
Priority Applications (1)
| Application Number | Priority Date | Filing Date | Title |
|---|---|---|---|
| US10/041,282 US6661223B2 (en) | 2002-01-07 | 2002-01-07 | Method of testing for response abnormalities in a magnetic sensor |
Applications Claiming Priority (1)
| Application Number | Priority Date | Filing Date | Title |
|---|---|---|---|
| US10/041,282 US6661223B2 (en) | 2002-01-07 | 2002-01-07 | Method of testing for response abnormalities in a magnetic sensor |
Publications (2)
| Publication Number | Publication Date |
|---|---|
| US20030128025A1 US20030128025A1 (en) | 2003-07-10 |
| US6661223B2 true US6661223B2 (en) | 2003-12-09 |
Family
ID=21915732
Family Applications (1)
| Application Number | Title | Priority Date | Filing Date |
|---|---|---|---|
| US10/041,282 Expired - Fee Related US6661223B2 (en) | 2002-01-07 | 2002-01-07 | Method of testing for response abnormalities in a magnetic sensor |
Country Status (1)
| Country | Link |
|---|---|
| US (1) | US6661223B2 (en) |
Cited By (1)
| Publication number | Priority date | Publication date | Assignee | Title |
|---|---|---|---|---|
| US7154267B2 (en) | 2005-01-07 | 2006-12-26 | Honeywell International, Inc. | Method and system for electronic compass calibration and verification |
Families Citing this family (1)
| Publication number | Priority date | Publication date | Assignee | Title |
|---|---|---|---|---|
| GB201118994D0 (en) * | 2010-11-18 | 2011-12-14 | Xyratex Tech Ltd | A method and device for mapping the magnetic field or magnetic field sensitivity of a recording head |
Citations (13)
| Publication number | Priority date | Publication date | Assignee | Title |
|---|---|---|---|---|
| SU834750A1 (en) | 1979-07-02 | 1981-05-30 | Московский Институт Радиотехники,Электроники И Автоматики | Method of measuring magnetic record carrier coercive force |
| SU1663589A1 (en) | 1989-07-13 | 1991-07-15 | Научно-исследовательский институт вычислительной техники | Magnetic disk magnetic parameter measuring device |
| JPH0684148A (en) | 1992-09-01 | 1994-03-25 | Tdk Corp | Method and apparatus for inspecting magnetoresistance head |
| US5514953A (en) | 1994-02-24 | 1996-05-07 | Seagate Technology, Inc. | Wafer level test structure for detecting multiple domains and magnetic instability in a permanent magnet stabilized MR head |
| US5559431A (en) | 1993-10-08 | 1996-09-24 | Micro-Epsilon Messtechnik Gmbh & Co. Kg | Method of calibrating a sensor |
| US5617278A (en) | 1995-03-20 | 1997-04-01 | Read-Rite Corporation | Magnetic head structure with reduction of magnetic domain instability |
| US5644225A (en) | 1996-04-16 | 1997-07-01 | Honeywell Inc. | Method for calibrating an angular position sensor |
| US5668470A (en) | 1995-03-16 | 1997-09-16 | Phase Metrics | Automatic testing system for magnetoresistive heads |
| US5917321A (en) | 1995-05-19 | 1999-06-29 | International Business Machines Corporation | Process and device for determining the magnetic characteristics of thin magnetic layers |
| US6014282A (en) | 1997-02-27 | 2000-01-11 | Kabushiki Kaisha Toshiba | Magnetic disk apparatus and method of detecting head fault |
| US6275028B1 (en) | 1997-12-25 | 2001-08-14 | International Business Machines Corporation | Methods for initializing and/or resetting GMR heads by applying oppositely directed magnetic fields |
| US6304081B1 (en) | 1997-12-11 | 2001-10-16 | Seagate Technology Llc | System and method for non-destructive measurement of dynamic coercivity effects |
| US6479988B2 (en) | 2000-06-06 | 2002-11-12 | Tdk Corporation | Method and apparatus for testing thin-film magnetic head |
-
2002
- 2002-01-07 US US10/041,282 patent/US6661223B2/en not_active Expired - Fee Related
Patent Citations (13)
| Publication number | Priority date | Publication date | Assignee | Title |
|---|---|---|---|---|
| SU834750A1 (en) | 1979-07-02 | 1981-05-30 | Московский Институт Радиотехники,Электроники И Автоматики | Method of measuring magnetic record carrier coercive force |
| SU1663589A1 (en) | 1989-07-13 | 1991-07-15 | Научно-исследовательский институт вычислительной техники | Magnetic disk magnetic parameter measuring device |
| JPH0684148A (en) | 1992-09-01 | 1994-03-25 | Tdk Corp | Method and apparatus for inspecting magnetoresistance head |
| US5559431A (en) | 1993-10-08 | 1996-09-24 | Micro-Epsilon Messtechnik Gmbh & Co. Kg | Method of calibrating a sensor |
| US5514953A (en) | 1994-02-24 | 1996-05-07 | Seagate Technology, Inc. | Wafer level test structure for detecting multiple domains and magnetic instability in a permanent magnet stabilized MR head |
| US5668470A (en) | 1995-03-16 | 1997-09-16 | Phase Metrics | Automatic testing system for magnetoresistive heads |
| US5617278A (en) | 1995-03-20 | 1997-04-01 | Read-Rite Corporation | Magnetic head structure with reduction of magnetic domain instability |
| US5917321A (en) | 1995-05-19 | 1999-06-29 | International Business Machines Corporation | Process and device for determining the magnetic characteristics of thin magnetic layers |
| US5644225A (en) | 1996-04-16 | 1997-07-01 | Honeywell Inc. | Method for calibrating an angular position sensor |
| US6014282A (en) | 1997-02-27 | 2000-01-11 | Kabushiki Kaisha Toshiba | Magnetic disk apparatus and method of detecting head fault |
| US6304081B1 (en) | 1997-12-11 | 2001-10-16 | Seagate Technology Llc | System and method for non-destructive measurement of dynamic coercivity effects |
| US6275028B1 (en) | 1997-12-25 | 2001-08-14 | International Business Machines Corporation | Methods for initializing and/or resetting GMR heads by applying oppositely directed magnetic fields |
| US6479988B2 (en) | 2000-06-06 | 2002-11-12 | Tdk Corporation | Method and apparatus for testing thin-film magnetic head |
Non-Patent Citations (1)
| Title |
|---|
| IBM Technical Disclosure Bulletin Feb. 1994, vol. 37, Issue 2A, pp. 55-56. |
Cited By (1)
| Publication number | Priority date | Publication date | Assignee | Title |
|---|---|---|---|---|
| US7154267B2 (en) | 2005-01-07 | 2006-12-26 | Honeywell International, Inc. | Method and system for electronic compass calibration and verification |
Also Published As
| Publication number | Publication date |
|---|---|
| US20030128025A1 (en) | 2003-07-10 |
Similar Documents
| Publication | Publication Date | Title |
|---|---|---|
| US5514953A (en) | Wafer level test structure for detecting multiple domains and magnetic instability in a permanent magnet stabilized MR head | |
| US6680609B1 (en) | Method and apparatus for determining the magnetic track width of a magnetic head | |
| US5901001A (en) | Detection of asperities in recording surface of storage medium | |
| US6538430B2 (en) | Screening test for transverse magnetic-field excited noise in giant magnetoresistive heads | |
| US7633694B2 (en) | Method and apparatus for quantifying stress and damage in magnetic heads | |
| US9548083B2 (en) | Read sensor testing using thermal magnetic fluctuation noise spectra | |
| US6265885B1 (en) | Method, apparatus and computer program product for identifying electrostatic discharge damage to a thin film device | |
| JP2785839B2 (en) | Soft magnetic film bias type magnetoresistive sensor | |
| JP3334552B2 (en) | Method and apparatus for inspecting magnetic head having spin-valve magnetoresistive element | |
| US6147488A (en) | Measurement method of time dependent magnetic remanence in a recording medium | |
| US6256177B1 (en) | Giant magnetoresistive sensing element having longitudinally biased free layer with easy axis thereof parallel with signal field | |
| US6294911B1 (en) | Measurement method of magnetization direction of magnetoresistive effect devices and measurement apparatus based on the method of TDK corporation | |
| US6166536A (en) | System and method for measuring erase band widths on magnetic media | |
| US6476602B1 (en) | Temperature compensated hall sensor for testing magnetic recording heads | |
| US6661223B2 (en) | Method of testing for response abnormalities in a magnetic sensor | |
| US6433540B1 (en) | Method and apparatus for testing composite type magnetic head having a magnetoresistive element and an inductive element | |
| US6556006B1 (en) | Method for magneto-resistive head electrostatic popping detection | |
| JPH10124828A (en) | Method and device for inspecting magnetoresistive head | |
| JP2000099932A (en) | Method and device to evaluate spin valve magneto- resistance effect type element | |
| JP3717628B2 (en) | Method and apparatus for evaluating magnetoresistive head | |
| US7138797B2 (en) | Reverse magnetic reset to screen for weakly pinned heads | |
| JP2009223987A (en) | Method for evaluating magnetoresistive element | |
| JP2002133621A (en) | Method and device for inspecting magnetic head with magnetoresistance effect element | |
| JP2988438B2 (en) | Method and apparatus for measuring amplitude symmetry fluctuation of magnetoresistive head | |
| JP3868684B2 (en) | Evaluation method of magnetic head for magnetic storage device |
Legal Events
| Date | Code | Title | Description |
|---|---|---|---|
| AS | Assignment |
Owner name: INTERNATIONAL BUSINESS MACHINES CORPORATION, NEW Y Free format text: ASSIGNMENT OF ASSIGNORS INTEREST;ASSIGNORS:FANG, PETER CHENG-I;KENNER, CHRISTOPHER DANA;MACKAY, KENNETH DONALD;AND OTHERS;REEL/FRAME:012482/0471;SIGNING DATES FROM 20010927 TO 20011129 |
|
| FEPP | Fee payment procedure |
Free format text: PAYOR NUMBER ASSIGNED (ORIGINAL EVENT CODE: ASPN); ENTITY STATUS OF PATENT OWNER: LARGE ENTITY |
|
| AS | Assignment |
Owner name: HITACHI GLOBAL STORAGE TECHNOLOGIES NETHERLANDS B. Free format text: CHANGE OF NAME;ASSIGNOR:MARIANA HDD B.V.;REEL/FRAME:015348/0191 Effective date: 20021231 Owner name: MARIANA HDD B.V., NETHERLANDS Free format text: ASSIGNMENT OF ASSIGNORS INTEREST;ASSIGNOR:INTERNATIONAL BUSINESS MACHINES CORPORATION;REEL/FRAME:015370/0450 Effective date: 20021231 |
|
| FEPP | Fee payment procedure |
Free format text: PAYOR NUMBER ASSIGNED (ORIGINAL EVENT CODE: ASPN); ENTITY STATUS OF PATENT OWNER: LARGE ENTITY Free format text: PAYER NUMBER DE-ASSIGNED (ORIGINAL EVENT CODE: RMPN); ENTITY STATUS OF PATENT OWNER: LARGE ENTITY |
|
| FPAY | Fee payment |
Year of fee payment: 4 |
|
| REMI | Maintenance fee reminder mailed | ||
| LAPS | Lapse for failure to pay maintenance fees | ||
| STCH | Information on status: patent discontinuation |
Free format text: PATENT EXPIRED DUE TO NONPAYMENT OF MAINTENANCE FEES UNDER 37 CFR 1.362 |
|
| FP | Lapsed due to failure to pay maintenance fee |
Effective date: 20111209 |