US7257563B2 - Probabilistic boolean networks - Google Patents
Probabilistic boolean networks Download PDFInfo
- Publication number
- US7257563B2 US7257563B2 US10/354,907 US35490703A US7257563B2 US 7257563 B2 US7257563 B2 US 7257563B2 US 35490703 A US35490703 A US 35490703A US 7257563 B2 US7257563 B2 US 7257563B2
- Authority
- US
- United States
- Prior art keywords
- network
- gene
- state
- node
- nodes
- Prior art date
- Legal status (The legal status is an assumption and is not a legal conclusion. Google has not performed a legal analysis and makes no representation as to the accuracy of the status listed.)
- Expired - Fee Related, expires
Links
Images


Classifications
-
- G—PHYSICS
- G16—INFORMATION AND COMMUNICATION TECHNOLOGY [ICT] SPECIALLY ADAPTED FOR SPECIFIC APPLICATION FIELDS
- G16B—BIOINFORMATICS, i.e. INFORMATION AND COMMUNICATION TECHNOLOGY [ICT] SPECIALLY ADAPTED FOR GENETIC OR PROTEIN-RELATED DATA PROCESSING IN COMPUTATIONAL MOLECULAR BIOLOGY
- G16B5/00—ICT specially adapted for modelling or simulations in systems biology, e.g. gene-regulatory networks, protein interaction networks or metabolic networks
-
- G—PHYSICS
- G06—COMPUTING; CALCULATING OR COUNTING
- G06N—COMPUTING ARRANGEMENTS BASED ON SPECIFIC COMPUTATIONAL MODELS
- G06N3/00—Computing arrangements based on biological models
- G06N3/02—Neural networks
- G06N3/04—Architecture, e.g. interconnection topology
- G06N3/047—Probabilistic or stochastic networks
-
- G—PHYSICS
- G16—INFORMATION AND COMMUNICATION TECHNOLOGY [ICT] SPECIALLY ADAPTED FOR SPECIFIC APPLICATION FIELDS
- G16B—BIOINFORMATICS, i.e. INFORMATION AND COMMUNICATION TECHNOLOGY [ICT] SPECIALLY ADAPTED FOR GENETIC OR PROTEIN-RELATED DATA PROCESSING IN COMPUTATIONAL MOLECULAR BIOLOGY
- G16B20/00—ICT specially adapted for functional genomics or proteomics, e.g. genotype-phenotype associations
-
- G—PHYSICS
- G16—INFORMATION AND COMMUNICATION TECHNOLOGY [ICT] SPECIALLY ADAPTED FOR SPECIFIC APPLICATION FIELDS
- G16B—BIOINFORMATICS, i.e. INFORMATION AND COMMUNICATION TECHNOLOGY [ICT] SPECIALLY ADAPTED FOR GENETIC OR PROTEIN-RELATED DATA PROCESSING IN COMPUTATIONAL MOLECULAR BIOLOGY
- G16B5/00—ICT specially adapted for modelling or simulations in systems biology, e.g. gene-regulatory networks, protein interaction networks or metabolic networks
- G16B5/10—Boolean models
-
- G—PHYSICS
- G16—INFORMATION AND COMMUNICATION TECHNOLOGY [ICT] SPECIALLY ADAPTED FOR SPECIFIC APPLICATION FIELDS
- G16B—BIOINFORMATICS, i.e. INFORMATION AND COMMUNICATION TECHNOLOGY [ICT] SPECIALLY ADAPTED FOR GENETIC OR PROTEIN-RELATED DATA PROCESSING IN COMPUTATIONAL MOLECULAR BIOLOGY
- G16B5/00—ICT specially adapted for modelling or simulations in systems biology, e.g. gene-regulatory networks, protein interaction networks or metabolic networks
- G16B5/20—Probabilistic models
Definitions
- the present invention relates generally to methods of establishing and modeling a regulatory relationship between nodes of a network, and more particularly to establishing and modeling a regulatory relationship between nodes of a biological network using Probabilistic Boolean Networks.
- Certain embodiments of the invention include methods based on a new class of models called Probabilistic Boolean Networks (PBNs), which are probabilistic generalizations of a standard Boolean network that offer a flexible and powerful modeling framework.
- PBNs share the appealing properties of Boolean networks in that they incorporate rule-based dependencies between nodes of a network and allow systematic study of global network dynamics. However, because of their probabilistic nature, they are able to cope with uncertainty, which is intrinsic to complex systems.
- PBNs typically provide a natural way to quantify the relative influence and sensitivity of network nodes (e.g., factors that influence gene expression/activity, protein activity, etc.) in their interactions with other network nodes.
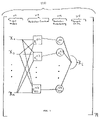
- FIG. 1 illustrates a building block (cluster) 110 of an exemplary network.
- a network may consist of one or more building blocks 110 , as illustrated in FIG. 1 by a subscript n outside the outermost brackets.
- sub-clusters may be further organized into higher order or multilevel networks, e.g., meta-clusters.
- Sub-clusters is a sub-population of with demonstrable or close interaction.
- the building block 110 comprises input nodes 111 (e.g., factors that influence the system) that are typically supplied to predictor functions 113 , which may be inferred from network data.
- Input nodes 111 may be values supplied by a) measurement of various factors that influence the value a node(s) in the network, b) an output of another building block of the PBN (e.g., other nodes that may be the target node of another building block), or c) combinations thereof.
- Predictor functions 113 may be inferred from input nodes 111 , for example, predictor functions 113 may be derived from a) the relationship between nodes with a particular cumulative measures of association (e.g., coefficient of determination (COD) between one or more combination(s) of network nodes), b) predetermined associations of network nodes, or c) combinations thereof.
- a PBN may accommodate more than one predictor function 113 .
- a predictor function 113 may incorporate binary, ternary, or other multivariate logic.
- the predictor function incorporates binary logic.
- the predictor function may incorporate ternary logic.
- the predictor function may incorporate other multivariate logic.
- predictor functions may incorporate one of a variety of logic combinations.
- predictor probabilities 114 are the probabilities that an associated predictor will be used in the determination a target node 115 .
- predictor probability can be found herein.
- a number of predictor functions 113 may share common input nodes 111 while their outputs are synthesized, in this case by random selection of a predictor function 113 , into an output or target node 115 .
- a wiring diagram for the entire PBN would consist of n such building blocks.
- Boolean model incorporates only a partial description of a physical system. This means that a Boolean function giving the next state of a variable is likely to be only partially accurate. There will be occasions when different Boolean functions may actually describe the transition, but these are outside the scope of the conventional Boolean model. If, consequently, an uncertainty exist as to which transition rule should be used, then a PBN involving a set of possible Boolean functions for each variable may be more suitable than a network in which there is only a single function for each variable.
- One embodiment of the invention constructs a PBN representing regulatory networks, such that the model class: (a) incorporates rule-based dependencies between nodes; (b) allows the systematic study of global network dynamics; (c) is able to cope with uncertainty, both in the data and the model selection; and (d) permits the quantification of the relative influence and sensitivity of nodes in their interactions with other nodes.
- Certain embodiments include methods for searching a representative network having a plurality of nodes; listing a cumulative measure of association of a node with at least one other node; repeating the search process for each node of the network; listing a cumulative measure of association for each node of the network; saving the list of cumulative measure of association; selecting a predetermined number of node combinations in the system, (e.g., selecting the top 5 combinations with the highest cumulative measure(s) of association for at least one target node); constructing predictor functions for at least one of the combinations selected, and transforming the cumulative measure of association (e.g., coefficient of determination) associated with selected combination into a probability, a predictor probability.
- a predetermined number of node combinations in the system e.g., selecting the top 5 combinations with the highest cumulative measure(s) of association for at least one target node
- predictor functions for at least one of the combinations selected, and transforming the cumulative measure of association (e.g., coefficient of determination) associated with selected combination into a probability, a predictor
- Network nodes may be representative of factors that may influence a system of interest.
- Nodes of a network for a biological system for example, may represent gene expression, protein-protein interactions, protein phosphorylation, protein levels, protein activity, protein modifications, carbohydrate levels, lipid levels, stress, radiation, and other conditions or measurements that may influence a biologic system.
- Biologic systems that may be analyzed include, but is not limited to eukaryotes, prokaryotes, viruses, bacteria, plants, animals, cultivated plants, mammals, humans, farm animals and the like. In one embodiment methods may be used to model a disease state to identify a therapeutic target or to diagnose a particular condition.
- the addition of a node(s) to a network may also be analyzed to determine an effect on a network as a result of the introduction of a new node(s), for example in analyzing an effect of additional influence on a biologic system, such as the physiology of a crop plant or farm animal, resulting from a) introduction of a transgene, b) alteration in growth environment, c) alteration in diet, d) exposure to hormones, small molecules, proteins, genes, lipids, carbohydrates and other substances that may affect the system in which they are introduced.
- a biologic system such as the physiology of a crop plant or farm animal
- the maximum number of functions used to predict a target node may be increased or decreased depending on the amount of training data available.
- a target node e.g., gene expression, protein activity, etc.
- a PBN with two Boolean functions of three variables each. This would make the model non-deterministic and allow the effects of up to six variables on the target gene.
- the greater flexibility of the PBN, and therefore its ability to model richer systems by fitting richer data sets, can be balanced with increased design complexity relative to both the number of predictor functions per gene and the number of input nodes upon which those predictor functions operate.
- the PBN can be constructed so as to involve many simple but good predictors rather than one complex but poor one, thus, rather than fitting one overly complex model to the data, one can fit many simple models and use them in a concerted manner.
- functions other than Boolean functions may be used as predictor functions.
- the system comprises a means for providing data for a plurality of nodes; a means for pre-processing (e.g., normalizing or transforming data) data for input; a means for searching and comparing data representative of nodes for each of a plurality of nodes; a means for assigning a cumulative measure of association to each node; a means for repeating searching, comparing, assigning a cumulative measure of association for at least one other network node; a means for selecting a plurality of input node combinations for synthesis of an output node; a means for constructing a set of predictor functions for each combination and/or sub-combinations of input nodes; a means for transforming a cumulative measure of association related to a combinations or sub-combinations of input nodes into a predictor probability; a means for constructing a PBN; and a means for transforming a result of a process for delivery to a
- methods described herein may be used to identify therapeutic targets, such as proteins, enzymes, genes, and other drug targets in a cell, organ, organism, or biologic system.
- a therapeutic target may be directly or indirectly effect the properties or state of another node(s) of the modeled biologic system.
- An exemplary therapeutic target identification method includes constructing a probabilistic network (e.g., a Probabilistic Boolean Network), having a plurality of nodes, representing a biological network; inputting a value for at least one node of the probabilistic network; evaluating the probabilistic network to identify at least one node of the biological network as a target for therapeutic intervention.
- a probabilistic network e.g., a Probabilistic Boolean Network
- methods may be used to identify a target for manipulation that affects the state of biological or other complex system that may include constructing a probabilistic network (e.g., a PBN), having at least one node representing a biological network or other complex system; receiving input values for at least one node in the probabilistic network; evaluating a state of the probabilistic network at a plurality of time points; and identifying a node of the biological network or other complex system for manipulation to achieve a desired state of the biologic network.
- a probabilistic network e.g., a PBN
- a method may be used to identify or diagnose a particular state of a biological system, such as cancer, autoimmune diseases, hormone imbalances, nutritional state and the like.
- Methods may include constructing a probabilistic network having at least one node, for a biological network; receiving input values for at least one node of the probabilistic network; and diagnosing or determining a state of a biological network by analysis of the probabilistic network.
- FIG. 2 illustrates an exemplary embodiment of a method of the present invention.
- values for a plurality of network nodes are first input or received (block 210 ).
- a combination of network nodes associated with a state of at least one other network node is selected (block 212 ).
- Associations may then be identified by computing a cumulative measure of association, such as a coefficient of determination.
- a cumulative measure of association between the combination of network nodes and at least one other network node is then determined (block 214 ) and network node data may then be utilized in constructing a plurality of predictor functions for a value of at least one other network node given the combination of network nodes (block 216 ).
- Predictor probabilities are next determined by transforming the cumulative measure of association between the combination of network nodes and at least one other network node into a predictor function probability (block 218 ).
- Predictor functions and predictor probabilities may thereafter be used in constructing a network representative of a complex system utilizing the plurality of predictor functions and the predictor function probabilities (block 220 ).
- the measure of association between nodes or groups of nodes may use CODs for the determination of predictor probability.
- the combinations of predictor functions, predictor probabilities, and a node(s) of interest are typically used to construct a plurality of PBN building blocks that may be associated and/or interconnected with a number of other building blocks to form a PBN.
- a method of inference based on the coefficient of determination typically produces a number of good candidate predictors for each node (e.g., target gene or target protein). Since the COD itself is estimated from the data, there is little reason to rely on one good predictor function. Thus, the general approach is to probabilistically synthesize good predictor functions such that each predictor function's contribution is proportional to its determinative potential. For small sample sizes, the complexity of each predictor function can be limited. As new data make themselves available, the model class naturally allows one to narrow down as needed, effectively reducing the uncertainty for predicting each node (e.g., target gene).
- Inference algorithms may be applied to a set of data (e.g., gene expression, protein interaction data, etc.). Because of the limited number of samples and the relative simplicity of the potential predictor functions, in one embodiment a full search for each optimal predictor is performed, rather than relying on a heuristic, sub-optimal solution the error of which cannot be reliably estimated. Consequently, the combinatorial nature of the search space and the relative simplicity of individual predictors is naturally well suited for distributed computing. For example, for any three genes, there are only 256 Boolean functions to search through to obtain the optimal estimate while there are many three-gene combinations. Implementation of such a prediction algorithm on a massively parallel supercomputer has been described.
- a framework of PBNs may retain the appealing properties of Boolean networks, such as rule-based dependencies between nodes as well as the amenability to global analysis of dynamics.
- the rich and mature theory of Markov chains provides many useful tools for the latter.
- Another advantage of PBNs is that they naturally allow one to incorporate prior knowledge, if necessary.
- the class of the functions for the nodes in question can be constrained such that they reflect this prior knowledge. For instance, if it is known that for a certain collection of genes, the activation of genes cannot cause inhibitory effects on the target gene, then we can restrict our attention to the class of monotone Boolean functions, effectively reducing the search space.
- canalizing functions functions that have at least one input that can by itself determine the activity of the regulated element
- this constraint can be easily introduced into the inference algorithm.
- methods for constructing a network representative of a complex system includes (a) receiving values for a plurality of network nodes; (b) selecting a combination of network nodes associated with a state of at least one other network node; (c) determining a cumulative measure of association between the combination of network nodes and at least one other network node; (d) constructing a plurality of predictor functions for a value of at least one other network node given the combination of network nodes; (e) transforming the cumulative measure of association between the combination of network nodes and at least one other network node into a predictor function probability; and (f) constructing a network representative of a complex system utilizing the plurality of predictor functions and the predictor function probabilities.
- the network is representative of a biological system, in particular a gene regulatory network.
- methods for constructing a gene network representative of a complex gene regulatory system comprise (a) receiving values for a plurality of gene network nodes; (b) selecting a combination of gene network nodes associated with a state of at least one other gene network node; (c) determining a cumulative measure of association between the combination of gene network nodes and at least one other gene network node; (d) constructing a plurality of predictor functions for a value of at least one other gene network node given the combination of network nodes; (e) transforming the cumulative measure of association between the combination of gene network nodes and at least one other gene network node into a predictor function probability; and (f) constructing a network representative of a complex system utilizing the plurality of predictor functions and the predictor function probabilities.
- an apparatus may comprise a machine readable medium containing instructions which, when executed by a machine, cause the machine to perform operations comprising (a) receiving values for a plurality of network nodes; (b) selecting a combination of network nodes associated with a state of at least one other network node; (c) determining a cumulative measure of association between the combination of network nodes and at least one other network node; (d) constructing a plurality of predictor functions for a value of at least one other network node given the combination of network nodes; (e) transforming the cumulative measure of association between the combination of network nodes and at least one other network node into a predictor function probability; and (f) constructing a network representative of a complex system utilizing the plurality predictor functions and the predictor function probabilities.
- a method can comprise (a) identifying a plurality of network nodes related to a state of at least one other network node within a network, wherein each network node of the network includes a network node value which influences a gene expression state; (b) constructing a plurality of predictor functions from a combination of network nodes utilizing at least one of the network node values for at least one target node; (c) determining a cumulative measure of association for combinations of network nodes; (d) transforming the cumulative measure of association into a probability that any one of a plurality of predictor functions is utilized to determine a state of at least one other node of a network; and (e) connecting a plurality of network node combinations to construct a probabilistic Boolean network.
- methods may include therapeutic target identification comprising (a) constructing a Probabilistic Boolean Network, having a plurality of nodes, wherein the PBN is representative of a gene network; (b) inputting a value for at least one node of the Probabilistic Boolean Network; and (c) evaluating the Probabilistic Boolean Network to identify at least one node of the Probabilistic Boolean Network as a target for therapeutic intervention.
- a method comprising (a) constructing a probabilistic Boolean network, having at least one node, for a biologic network; (b) inputting a value for at least one node in the probabilistic Boolean network; (c) evaluating a state of the probabilistic Boolean network at a plurality of time points; and (d) identifying a node of the biologic network for manipulation to achieve a desired state of the biologic network is contemplated.
- a diagnostic method comprising (a) constructing a probabilistic network having at least one node, for a biological network; (b) inputting values for at least one node of the probabilistic network; and (c) diagnosing a particular state of the biological network by analysis of the probabilistic network is contemplated.
- the means for receiving network node data, the means for normalizing or transforming network node data, the means for searching data representative of network nodes for associations between nodes, the means for listing the cumulative measures of association between nodes, the means for saving the listings, the means for selecting a number of node combinations based on the cumulative measure of association, the means for constructing a set of predictors for each combination of nodes selected, the means for transforming a measure of association into a predictor probability, the means for constructing a PBN that establishes the regulatory relationship between network nodes and the means for transforming the output of a PBN for end-user use may involve a programmed computer with the respective functionalities described herein, implemented in hardware, software, and/or firmware, or a combination thereof; a logic circuit or other component of a programmed computer that performs the operations specifically identified herein, dictated by a computer program; or a computer memory encoded with computer-executable instructions representing a computer program that can cause a computer to perform functions, processes, and/or methods
- FIG. 3 illustrates an example of a general-purpose computer system that may be used to provide and/or execute the methods, systems, and software embodiments of the present invention.
- FIG. 3 shows a computer system 300 comprising a monitor 310 having a screen 320 , a system unit 330 , a keyboard 340 , and a mouse 350 .
- System unit 330 may house other computer components (e.g., a processor, a memory, etc. further described herein).
- Various embodiments of the present invention include memories, processing elements, Application Specific Integrated Circuits (ASICs), and/or programmable logic devices (PLDs).
- ASICs Application Specific Integrated Circuits
- PLDs programmable logic devices
- Such memories may comprise a machine-readable medium on which may be stored a set of instructions (i.e., software) embodying any one, or all, of the functions, processes, or methods described herein.
- Such instructions may reside, completely or partially, within an illustrated memory as well as within alternative machine-readable media such as a processing element, ASIC, PLD, or mass-storage device further described herein.
- FIG. 4 and the following discussion is intended to provide a brief, general description of a suitable computing environment for the computer programs described above.
- the method for analyzing biologic systems by applying a probabilistic network is typically implemented in computer-executable instructions organized in program modules.
- Program modules may include various routines, programs, objects, components, and/or data structures utilized to perform the functions, processes, and methods and implement the data types described herein.
- FIG. 4 illustrates an exemplary block diagram including a computer system suitable for execution of the system software embodiments of the invention (e.g., computer system 300 of FIG. 3 ).
- the method, system, and software embodiments of the present invention may be implemented in other data processing systems, including multiprocessor systems, microprocessor-based and/or programmable consumer electronics, minicomputers, mainframe computers, and the like.
- the invention may also be used in distributed computing environments where tasks are performed utilizing remote data processing systems or devices that are linked via a communications network.
- program modules may be located in both local and remote machine or computer-readable media.
- the system shown in FIG. 4 includes a server computer system 420 , including a processing unit 421 (e.g., one or more processing devices), a system memory 422 , and a system bus 423 which interconnects various system components including system memory 422 to processing unit 421 .
- the system bus 423 may comprise any of several types of bus structures including a memory bus, a memory controller, a hub, a local bus implementing a bus architecture such as peripheral component interconnect (PCI), Video Electronics Standards Association (VESA), or Microchannel (MCA), and/or a peripheral or input/output (I/O) bus, e.g., an Industry Standard Architecture (ISA), Extended Industry Standard Architecture (EISA), Universal Serial (USB), or IEEE 1394 “Firewire” bus.
- PCI peripheral component interconnect
- VESA Video Electronics Standards Association
- MCA Microchannel
- I/O peripheral or input/output
- System memory 422 may include read only memory (ROM) 424 and/or random access memory (RAM) 425 as illustrated.
- ROM read only memory
- RAM random access memory
- Server computer system 420 further may include one or more mass storage devices such as a hard disk drive 427 , a floppy disk drive 428 , e.g., to read from or write to a removable “floppy” disk 429 , and/or an optical disk drive 430 , e.g., for reading from or writing to a CD-ROM disk 431 or other optical media.
- Hard disk drive 427 , floppy disk drive 428 , and optical disk drive 430 may be connected to the system bus 423 by a hard disk drive interface 432 , a floppy disk drive interface 433 , and an optical disk drive interface 434 , respectively.
- the drives and their associated computer-readable media provide nonvolatile storage of data, data structures, computer-executable instructions (program code such as dynamic link libraries, and executable files), etc. for server computer system 420 .
- program code such as dynamic link libraries, and executable files
- server computer system 420 Although the description of computer-readable media above refers to a hard disk, a removable magnetic disk and a CD, it may also include other types of media that are readable by a computer, such as magnetic cassettes, flash memory, digital video disks, Bernoulli cartridges, and the like.
- a number of program modules may be stored in mass storage devices, e.g., 427 , 428 , and 430 , and system memory 422 including an operating system 435 , one or more application programs 436 , other program modules 437 , and program data 438 .
- a user may enter commands and information into the personal computer 420 through a keyboard 440 and pointing device, such as a mouse 442 .
- Other input devices may include a trackball, graphics tablet, light pen, microphone, joystick, game pad, satellite dish, scanner, or the like.
- serial port interface 446 that is coupled to the system bus 423 , but may be connected via other interfaces, such as a parallel port interface, game port interface, a USB controller, or the like.
- a monitor 447 or other type of display device is also connected to the system bus 423 via an interface, such as a display controller or video adapter 448 .
- a computer system may further include other peripheral output devices (not shown), such as speakers and printers.
- server computer system 420 may operate in a networked environment via connections to one or more remote computers, such as client computer system 449 .
- a remote computer may comprise a server computer system, a router, a gateway, a hub, a peer device, or other common network node, typically including many or all of the elements described relative to the server computer system 420 .
- Connections depicted in FIG. 4 include a local area network (LAN) 451 and a wide area network (WAN) 452 .
- LAN local area network
- WAN wide area network
- Such networking environments are commonplace in offices, enterprise-wide computer networks, extranets, intranets, and the Internet/World Wide Web (WWW).
- server computer system 420 When used in a LAN networking environment, server computer system 420 is depicted in the illustrated embodiment as being connected to local network 451 through a network interface or adapter 453 .
- server computer system 420 may include a modem 454 or other conventional means for establishing communications over the wide area network 452 (e.g., the Internet).
- the modem 454 which may be internal or external, may be connect to the system bus 423 via the serial port interface 446 as shown or via a variety of other components utilizing well-known techniques.
- program modules depicted relative to server computer system 420 may be stored in the remote memory storage device, e.g., a memory storage device within client computer system 449 (not shown).
- the network connections shown are merely examples and other means of establishing a communications link between the computers may be used.
- client computer system 449 of FIG. 4 may, in alternative embodiments of the invention, comprise a workstation, personal computer, “thin client” (i.e. network computer or NetPC), Internet appliance, terminal, palmtop computing device, robust cellular or Personal Communications Services (PCS) telephone, or the like.
- server computer system 420 of FIG. 4 may comprise a wide variety of data processing systems.
- server computer system 420 may comprise a personal computer system, a dedicated or “thin server”, a mainframe, a super computer, a parallel computer, or the like.
- one or more protocols from the Internet Suite of protocols are used so a communications network includes an intranet, internet or the like. Such a communications network may communicate with other public or private networks using protocols from the Internet Suite.
- the Internet Suite of protocols includes such protocols as the Internet Protocol (“IP”), Transmission Control Protocol (“TCP”), User Datagram Protocol (“UDP”), Hypertext Transfer Protocol (“HTTP”), Hypertext Markup Language (“HTML”), extensible Markup Language (“XML”) and others.
- One or more private databases, and one or more public databases may be multi-user, multi-view databases that store experimental data as well as results of the methods described.
- the databases may use relational database, object-oriented database, or object-relational database tools and structures.
- the data stored within the one or more internal proprietary databases may not be available to the public.
- Databases are typically made available to the public through a publicly accessible database server using selected security features (e.g., login, password, encryption, firewall, etc.).
- a public database(s) may include experimental data and other information in the public domain and are also multi-user, multi-view databases.
- a public database(s) include such well known public databases such as those provided by Medline, GenBank, SwissProt, and other known public databases.
- a machine-readable medium includes read only memory (ROM); random access memory (RAM); magnetic disk storage media; optical storage media; flash memory devices; electrical, optical, acoustical or other form of propagated signals (e.g., carrier waves, infrared signals, digital signals, etc.); etc. While specific illustrative embodiments are described the invention may be implemented with any known data processing and communication network and are not limited to any specific architecture or configuration.
- FIG. 1 illustrates an exemplary building block of a PBN.
- FIG. 2 illustrates an exemplary embodiment of methods.
- FIG. 3 illustrates an example of a computer system that may be used to execute the methods and software embodiments of the present invention.
- FIG. 4 illustrates an exemplary block diagram of a computer system suitable for execution of the system software embodiments of the invention.
- FIG. 5 illustrates an exemplary state transition diagram
- FIG. 6 illustrates an exemplary steady-state distribution.
- FIG. 8 illustrates an example plots of H Ko (x (i) , y).
- FIG. 9 illustrates an example of the effects of cdk7/cyclin H, cdk2/cyclin E, and p21/WAFI on Rb.
- FIG. 10 illustrates an example of a logic circuit diagram of the activity of Rb (on or off) as a Boolean function.
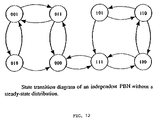
- FIG. 12 illustrates an exemplary Markov diagram corresponding to steady state distributions of independent PBN of example 2.
- FIG. 13 illustrates an exemplary Markov diagram corresponding to steady state distributions of dependent PBN of example 3.
- multiscale modeling has been fundamental in the development of many fields, such as computing, material science, and image processing (Melnik et al., 2001; Dougherty et al., 2001), its use in genetic network analysis could prove to be invaluable.
- One of the basic principles in multiscale modeling is that meaningful and useful information about a system or object exists on several different “levels” simultaneously. In the context of genetic networks, this would imply that genes form small groups (or clusters) within each of which genes have close interactions; then, some of these clusters form larger “meta-clusters” and these meta-clusters have interactions as well.
- This process may continue on several different “scales.” This type of clustering effect has been observed in many other types of networks, such as social networks (Newman et al., 2002), the power grid of the western United States, and neural networks (Watts and Strogatz, 1998). Interestingly, dynamical systems that have this property exhibit enhanced signal-propagation speed and computational power.
- One of the various embodiments of the invention includes methods to identify relatively small sub-networks, out of a large network, that function more or less independently of the rest of the network. Such a small sub-network would require little or sometimes even no information from the “outside.”
- the inventors will proceed by starting with a “seed” consisting of one or more genes that are believed to participate in such a sub-network. Then, iteratively adjoin new genes to this sub-network such that the “autonomy” of the sub-network is maintained as much as possible.
- An example of such a sub-network, generated using glioma gene-expression data produced in the inventors laboratory, is described in Example 6 below. Work in this direction has focused on the theoretical framework for performing such operations as adjoining new genes such that the network structure and parameters remain consistent with the data.
- COD coefficient of determination
- an open system may be modeled, rather than a closed system.
- the system may transition differently than it would in the absence of that condition.
- Such effects have been considered in the framework of using the coefficient of determination in the presence of external stresses. Under the assumption that the external stimuli occur asynchronously, it is prudent to allow uncertainty among the transition rules and weight their likelihood accordingly. It may be that the probability of applying a Boolean function corresponding to an unlikely condition is low; however, system behavior might be seriously misunderstood if the possibility of such a transition is ignored.
- a PBN may accommodate more than one possible function (predictor) for each node.
- each ⁇ j (i) is a possible function determining the value of node x i
- l(i) is the number of possible functions for node x i .
- the functions ⁇ j (i) may be called predictors, since the process of inferring these functions from measurements or equivalently, of producing a minimum-error estimate of the value of a node at the next time point, is known as prediction in estimation theory.
- the vector function f k ⁇ 0,1 ⁇ n ⁇ 0,1 ⁇ n acts as a transition function (mapping) representing a possible realization of the entire PBN.
- f ( ⁇ (1) , . . . , ⁇ (n) ) be a random vector taking values in F 1 x . . . xF n . That is, f can take on all possible realizations of the PBN. Then, the probability that predictor ⁇ j (i) is used to predict node i(1 ⁇ j ⁇ l(i)) is equal to
- a PBN is said to be independent if the random variables ⁇ (1) , ⁇ (2) , . . . , ⁇ (n) are independent.
- product expansions such as the one given in the preceding equation, as well as ones involving more functions, require conditional probabilities. Henceforth, unless otherwise mentioned, independent PBNs will be assumed.
- the dynamics of the PBN are similar to the dynamics of Boolean networks, but at any given point in time, the value of each node is determined by one of the possible predictors (predictor functions), chosen according to its corresponding probability (predictor probability). This can be interpreted by saying that at any point in time, we have one out of N possible networks. To calculate the probability that a particular network is selected. Let us define the matrix
- K [ 1 1 ⁇ 1 1 1 1 ⁇ 1 2 ⁇ ⁇ ⁇ ⁇ ⁇ 1 1 ⁇ 1 l ⁇ ( n ) 1 1 ⁇ 2 1 1 1 ⁇ 2 2 ⁇ ⁇ ⁇ ⁇ ⁇ 1 1 ⁇ 2 l ⁇ ( n ) ⁇ ⁇ ⁇ ⁇ ⁇ l ⁇ ( 1 ) l ⁇ ( 2 ) ⁇ l ⁇ ( n - 1 ) l ⁇ ( n ) ] containing lexicographically ordered rows, each one corresponding to a possible network configuration. That is, row m corresponds to network m and the entry j in the ith column specifies that predictor f j (i) should be used for gene x i .
- K is an N ⁇ n matrix. Using this matrix, the probability that network i is selected may be represented by
- state space of the PBN also consisting of 2 n states.
- the interest is in establishing the state transition matrix A.
- the network may transition from a state to a number of other possible states, hence defining a random process.
- the probability of transitioning from state (x 1 , . . . , x n ) to state (x′ 1 , . . . , x′ n ) can be obtained as
- a ⁇ ⁇ j 1 2 n ⁇ ⁇
- a set of predictors may be selected for a given node (e.g., gene, etc.) by employing a Coefficient Of Determination (COD).
- COD measures the degree to which the levels of an observed node set (e.g., transcriptional levels of a gene set) can be used to improve the prediction of the level of a target node (e.g., gene transcription) relative to the best possible prediction in the absence of observations.
- the node is a gene.
- X l(i) (i) be sets of genes: and ⁇ 1 (i) , ⁇ 2 (i) , . . . , ⁇ l(i) (i) be function rules such that ⁇ 1 (i) (X 1 (i) ), . . . , ⁇ l(i) (i) (X l(i) (i) ) are optimal predictors of X i relative to some probabilistic error measure ⁇ (X 1 , ⁇ k (i) , (X k (i) )), keeping in mind that X i and ⁇ k (i) (X k (i) ) are random variables, for which we use upper case letters. For each k, the COD for X i relative to the conditioning set X k (i) is defined by
- ⁇ k i ⁇ i - ⁇ ⁇ ( X i , f k ( i ) ⁇ ( X k ( i ) ) ) ⁇ i , where ⁇ i is the error of the best (constant) estimate of X i in the absence of any conditional variables.
- the COD is between 0 and 1 and measures the relative decrease in error from estimating X i via ⁇ k (i) (X k (i) ) rather than by just the best constant estimate.
- ⁇ i is the error of the mean of X i , which is the best constant estimate
- the COD must be estimated from training data with designed approximations being used in place of ⁇ 1 (i) , ⁇ 2 (i) , . . . , ⁇ l(i) (i) .
- the complexity of the functions ⁇ 1 (i) , ⁇ 2 (i) , . . . , ⁇ l(i) (i) and the amount of training data become an issue.
- the number of genes in each predictor was kept to a maximum of three.
- the framework afforded by the PBN may be well suited for dealing with design imprecision due to limited sample size, where the domain of each predictor may need to be constrained due to lack of training data, but several predictors, with possibly different domains, may be collectively, employed.
- CODs are the estimates formed from the training data. According to the above expression, those functions corresponding to the highest CODs will be selected more often in the probabilistic network.
- the number of chosen predictors, l(i) can be a user-selectable parameter and determines the amount of uncertainty that the model can handle.
- the dynamic behavior of PBNs can be represented as a Markov chain where the state transition matrix A is completely specified by all of the possible Boolean functions and their probabilities.
- a key property in the characterization of long-run behavior is periodicity. Since periodicity is a class property, an irreducible Markov chain can be considered to be or not to be aperiodic.
- the probability of being in state i at time r is equal to ⁇ i for all r and the Markov chain is a strictly stationary random process.
- the probability that the chain is in state i may be determined without depending on the initial state.
- the states are divided into two classes, C 1 and C 2 .
- Such a question need not be answerable if there does not exist a steady state (if the chain is not aperiodic).
- An illustrative example is presented in Example 3 below.
- the cell cycle regulator gene p21/WAF1/cipI can be transcriptionally activated by a series of genes p53, smad4, AP2, BRCAI, etc. Among those genes, p53 has the most potent effect.
- ⁇ f ⁇ ( x ) ⁇ x j f ⁇ ( x ( j , 0 ) ) ⁇ f ⁇ ( x ( j , 1 ) )
- the second definition inherently indicates that the partial derivative is itself a Boolean function.
- the physical meaning behind the partial derivative of a Boolean function with respect to the ith variable is that, defined on the n ⁇ 1 dimensional projection of the n-cube, it acts as an indicator of whether or not the function differs along the ith dimension.
- the partial derivative is 0 if toggling the value of variable x j does not change the value of the function, and it is 1 otherwise.
- the last expression gives the influence as the probability that a toggle of the jth variable changes the value of the function.
- ⁇ f i ⁇ ( x ) ⁇ ( x j ) ⁇ is ⁇ ⁇ used ⁇ ⁇ as ⁇ ⁇ a ⁇ ⁇ predictor ⁇ ( 8 )
- the notation I j (x i ) represents the influence of gene x j on gene x i , given ⁇ i as the predictor (cf. 10).
- One step further is the consideration of PBNs.
- F i be the set of predictors for gene x i with corresponding probabilities c 1 (i) , . . . , c l(i) (i) .
- I k ( ⁇ j (i) ) be the influence of variable x k on the predictor ⁇ j (i) . Since many possible predictors can be used for gene x i , we would like to determine the overall influence of gene x k on gene x i .
- equation (21) see example 5 below
- any gene out of n possible genes can get mutated with probability p, independently of other genes.
- this is represented by a flip of value from 1 to 0 or vice versa and directly corresponds to the bit-flipping mutation operator in NK Landscapes, as well as in genetic algorithms and evolutionary computing.
- random gene perturbations can be implemented with the popular DDLab software. This type of “randomization”, namely allowing genes to randomly mutate, is biologically meaningful. Since the genome is not a closed system, but rather has inputs from the outside, it is known that genes may become either activated or inhibited due to external stimuli, such as mutagens, heat stress, etc.
- x ′ ⁇ x ⁇ ⁇ , with ⁇ ⁇ probability ⁇ ⁇ 1 - ( 1 - p ) n f k ⁇ ( x 1 , ... ⁇ , x n ) , with ⁇ ⁇ probability ⁇ ⁇ ( 1 - p ) n ( 10 )
- ⁇ is component-wise addition modulo 2
- equation (10) states that if no genes are mutated, the standard network transition function will be used, whereas if at least one mutation does occur, then the next state will be determined according to the genes that are mutated.
- An important observation to make here is that for p>0, any state of the network becomes accessible from any other state, due to the possibility of any combination of random gene mutations.
- a practical benefit of the randomization afforded by gene mutation is that it empirically simplifies various computations involving PBNs. For example, consider the computation of influence I k ( ⁇ j (i) ) of gene x k on the predictor function ⁇ j (i) , as given in equation (7).
- the computation of influence of a gene on the predictor entails computing the joint distribution D(x) of all the genes used by that predictor, in order to compute the expectation of the partial derivatives of the predictors. This distribution, however, should be consistent with the model itself. For example, if we wish to quantify “long-term” influence, we need to obtain the stationary distribution of the Markov chain corresponding to the PBN.
- PBNs One of the various goals of developing models such as PBNs is the identification of potential drug targets in cancer therapy.
- a random gene perturbation may cause the real regulatory network to transition into an undesirable cellular state, which itself will be stable under most subsequent gene perturbations.
- One of the challenges is determining which genes would be good potential candidates for intervention in order to reverse the effects or force the regulatory network to transition to another desirable stable state.
- it is important not only to study the effects of gene perturbation, especially on long run network behavior, but also to develop tools for discovering intervention targets. While distinguish between random gene perturbation and intentional gene intervention in the discussion this far, the PBN model class allows us to take a unified viewpoint.
- the telomerase gene is the most well-known tumor suppressor gene, encoding a protein that regulates the expression of several genes such as Bax and Fas/APO1 that function to promote apoptosis and p21/WAF1 that functions to inhibit cell growth.
- the telomerase gene encodes telomerase, which maintains the integrity of the end of chromosomes (telomeres) in our germ cells, which are responsible for propagating our complete genetic material to the following generation, as well as progenitor cells, which are responsible for replenishing our cells during the normal cell turnover (homeostasis).
- telomere shortening In somatic cells, the telomerase gene is turned off, resulting in telomere shortening each tune the cell divides—a key reason for the limited life span of our normal cells.
- telomerase In the majority of tumor cells, telomerase is activated, which is believed to contribute to the prolonged life-span of the tumor cells and worsened prognosis for the cancer patients.
- Extensive experimental results indicate that when p53 is activated in the cells, for example, in response to radiation, the cells undergo rapid growth inhibition and apoptosis in as short as a few hours.
- inhibition of the telomerase gene also leads to cell growth inhibition, differentiation, and cell death, but only after cells go through a number of cell divisions (allowing telomere shortening), which takes a longer time to occur than via p53.
- the best candidate gene for intervention will typically be the one that results in the smallest mean first passage time to the destination state.
- FIG. 8 shows the 5 plots of H Ko (x (i) , y), each one corresponding to an intervention with one of the genes.
- the two approaches discussed above differ for small values of K 0 .
- gene x 1 is more likely to drive the network to the desired state.
- F k ⁇ ( X , Y ) ⁇ x ⁇ X ⁇ ⁇ y ⁇ Y ⁇ F k ⁇ ( x , y ) ⁇ ⁇ x ⁇ x ⁇ X ⁇ ⁇ x ( 16 ) to be the first passage probability from a set X to a set Y.
- transient intervention or mutation the type of intervention and mutation that we have considered could be termed transient intervention or mutation. That is, the effect on a gene, whether by random perturbation or forced intervention, is applied at only one time point and the network itself is responsible for determining the values of that gene thereafter. It could be said that the effect has the potential to be reversed by the network itself. For example, in FIG. 5 , if we are in state (111) and the second gene changes value, resulting in (101), at the next time step, regardless of where the network transitions, (110) or (111), the second gene will always get changed back to 1 again.
- a gene changes value and remains at that value forever.
- permanent intervention is achieved through removing a gene or transplanting a gene, as done in gene therapy.
- the permanent intervention (or mutation) of a gene may reduce the state space by half, since all the states in which that gene is not equal to the fixed value cannot appear.
- the rest of the genes are predicted as usual, via the Boolean functions and their selection probabilities c j (i) remain unaltered.
- the Boolean function corresponding to the fixed gene is the identity function (0 or 1) with selection probability 1.
- SV40 Simian Virus 40
- SV40 virus was discovered in the 1950s during the development of vaccine for poliovirus. It was found that SV40 could transform monkey kidney cells and develop tumors when injected into rodents. SV40 was not believed to cause tumor in human cells, however, SV40 DNA was found in some human brain tumors in recent years suggesting that SV40 may have a tumorigenic effect in humans too, although with a long latent period.
- T-antigen a protein that influences the expression of SV40 .
- T-antigen a protein that influences the expression of SV40 T-antigen.
- p53 retinoblastoma
- SV40 T-antigen also interacts with other molecules such as retinoblastoma (Rb)—an important protein the activation of which inhibits DNA synthesis.
- Rb retinoblastoma
- the permanent mutation caused by SV40 T-antigen may permanently alter the dynamics of the network, causing it to shift into a set of states associated with tumorigenesis.
- T-antigen itself is sufficient to cause this effect
- T-antigen was transplanted into the mouse brain using a tissue-specific transgenic mouse model (second scenario, man-made event).
- second scenario man-made event.
- brain tumors were found in many of the transgenic mice. Since SV40 DNA was detected in some human brain tumors, one cannot help but to speculate that SV40 may be causing human brain tumors too.
- p53 is one such gene. This is clearly demonstrated by the fact that p53 gene deletion or mutation (permanent mutation) is one of the most frequent genetic changes in cancers. Removing p53 genes from mouse through embryonic stem cell gene knock-out technology, researchers generated the p53 null mice. The mouse can be born normally and develop into adult normally, but develop cancers in most of the mice at 4.5 months. So p53 may be an important lever gene for regulation of homeostasis—a delicate balance between cell growth and cell death. Thus, it may not be surprising that p53 is often selected as a therapeutic target for permanent intervention. In cultured cells, the introduction of p53 back to p53-null cells leads to cell growth inhibition or cell death.
- p53 gene is also being used in gene therapy, where the target gene (p53 in this case) is cloned into a viral vector (adenovirus vector is a common one).
- the modified virus serves as a vehicle to transport p53 gene into the tumor cells to generate a permanent intervention.
- Boolean network modeling is to study generic coarse-grained properties of large genetic networks and the logical interactions of genes, without knowing specific quantitative details.
- the biological basis for the development of Boolean networks as models of genetic regulatory networks lies in the fact that during regulation of functional states, the cell exhibits switch-like behavior, which is important for cells to move from one state to another in a normal cell growth process or in situations when cells need to respond to external signals, many of which are detrimental.
- Cdk2/cyclin E is regulated by two switches: the positive switch complex called Cdk Activating Kinase (CAK) and the negative switch p21/WAF1.
- the CAK complex can be composed of two gene products: cyclin H and cdk7. When cyclin H and cdk7 are present, the complex can activate cdk2/cyclin E.
- a negative regulator of cdk2/cyclin E is p21/WAF1, which in turn can be activated by p53.
- p21/WAFI binds to cdk2/cyclin E, the kinase complex is turned off.
- p53 can inhibit cyclin H, a positive regulator of cyclin E/cdk2.
- This negative regulation is an important defensive system in the cells. For example, when cells are exposed to mutagen, DNA damage occurs. It is to the benefit of cells to repair the damage before DNA replication so that the damaged genetic materials do not pass onto the next generation. An extensive amount of work has demonstrated that DNA damage triggers switches that turn on p53, which then turns on p21/WAF1.
- p2I/WAFI then inhibits cdk2/cyclin E, thus Rb becomes activated and DNA synthesis stops.
- p53 also inhibits cyclin H, thus turning off the switch that turns on cdk2/cyclin E.
- Such delicate genetic switch networks in the cells is the basis for cellular homeostasis.
- FIG. 9 For purposes of illustration, let us consider a simplified diagram, shown in FIG. 9 , illustrating the effects of cdk7/cyclin H, cdk2/cyclin E, and p21/WAFI on Rb. Thus, p53 and other known regulatory factors are not considered.
- FIG. 10 illustrates an example of a logic circuit diagram of the activity of Rb (on or off) as a Boolean function of four input variables: cdk7, cyclin H, cyclin E, and p21/WAF1.
- cdk2 is shown to be completely determined by the values of cdk7 and cyclin H using the AND operation and thus, cdk2 is not an independent input variable.
- p21/WAF1 is shown to have an inhibitive effect on the cdk2/cyclin E complex, which in turn regulates Rb, while in FIG. 10 , we see that from a logic-based perspective, the value of p21/WAF1 works together with cdk2 and cyclin E to determine the value of Rb.
- a Boolean function ⁇ i (x i 1 , . . . , x i k ) with k specified input nodes is assigned to node x i .
- k could be varying as a function of i, but without loss of generality, we may define it to be a constant equal to n and allowing the unnecessary variables (nodes) in each function to be fictitious.
- a variable that is not fictitious is called essential.
- the list of Boolean functions F represents the rules of regulatory interactions between genes. That is, any given gene transforms its inputs (e.g., regulatory factors that bind to it) into an output, which is the state or expression of the gene itself. All genes (nodes) are updated synchronously in accordance with the functions assigned to them and this process is then repeated. The artificial synchrony simplifies computation while preserving the qualitative, generic properties of global network dynamics.
- x n corresponds to the states of the genes at time t (INPUT) and the pattern (x′ 1 , . . . , x′ n ) corresponds to the states of the genes at time t+1 (OUTPUT).
- GAP Gene Activity Profile
- Boolean networks are completely deterministic, so are their dynamics. The only randomness that may exist lies entirely in the selection of the initial starting state of the network. This can be captured by considering the joint probability distribution of all the genes. In order for us to have a useful probabilistic description of the dynamics of such systems, it is necessary to consider joint probabilities of all Boolean functions corresponding to all the nodes because even after one step of the network, the nodes become dependent, regardless of assumptions on the initial distribution.
- n ⁇ can be used in place of D(x) to compute the joint distribution at the next time point.
- D t+1 ⁇ ( D t ) (18) where the mapping ⁇ :[0,1] 2n ⁇ [0,1] 2n is implicitly defined by (17).
- ⁇ is an affine mapping.
- D t and D t+1 be represented by 1 ⁇ 2 n vectors containing the joint probabilities and let the matrix A be a 2 n ⁇ 2 n binary matrix defined as
- Bayesian networks are graphical models that explicitly represent probabilistic relationships between variables.
- the model structure embeds conditional dependencies and independencies and efficiently specifies the joint probability distribution of all the variables.
- Bayesian network models have been used to analyze gene expression data.
- the variables in a Bayesian network typically represent expression levels of genes, but can also describe experimental conditions or unobserved variables, such as protein concentrations.
- the relationships between these variables are represented by a directed graph in which vertices correspond to variables and directed edges between vertices represent their dependencies.
- One attractive property of Bayesian networks is that they naturally allow one to select a model, from a set of competing models, that best explains the observed expression data.
- Boolean models encode rules of genetic regulation, are inherently dynamic, and lend themselves to tractable inference.
- the proposed PBN models retain these appealing properties, while furnishing the means to handle uncertainty. Let us take a closer look at the basic building blocks of PBNs and Bayesian networks, illustrating their relationships (see example 5).
- K [ 1 1 1 1 1 2 2 1 1 2 1 2 ]
- the second row of K containing (1, 1, 2) means that the predictors ( ⁇ 1 (1) , ⁇ 1 (2) , ⁇ 3 (3) ) will be used.
- this transition probability is equal to P 2 +P 4 .
- All other entries in A are computed similarly.
- the state transition diagram corresponding to this matrix is shown in FIG. 5 .
- the 7th row of matrix A corresponds to (1, 1, 0) and it can be seen that the only possible transitions are to (1, 0, 0) or (1, 0, 1), corresponding to columns 5 and 6, respectively.
- the previous example considered an independent PBN.
- the steady-state requirement can be even more constraining for dependent PBNs.
- ⁇ [ 0.1 0.75 0.375 0.6 0.75 0.375 0.6 0.75 0.375 ] It is not surprising that ⁇ is not symmetric, since the influence of variable x i on variable x j may be stronger than the influence of variable x i on variable x i or vice versa.
- Another useful measure is the average sensitivity of a function. For example, consider the sensitivity of ⁇ at vector x:
- the sensitivity of a gene represents the stability or, in some sense, the autonomy of a gene. If the sensitivity of a gene is low, this implies that other genes have little effect on it.
- the so-called house-keeping genes that encode structural protein in the cells fall into this category. In this example, gene x 2 is the most sensitive.
- a gene with a high influence factor has a high collective impact on the other genes. It is precisely these genes that have the potential to regulate the dynamics of the network, as their perturbation can lead to significant downstream effects, possibly forcing the system to transition to a different basin of attraction. Many transcriptional factor genes fall into this category. In this example, genes x 2 and x 3 are equally more important than gene x 1 .
- conditional probability of a random variable X i given all its predecessors in the graph is equal to the conditional probability of X i given only the Markovian parents of X i , denoted by Pa(X i ).
- x 1 , . . . , x i ⁇ 1 ⁇ Pr ⁇ x i
- chain rule of probability we can express the joint probability as a product of conditional probabilities as
- equation (20) can also be interpreted as the conditional expectation of X i given the predictor ⁇ j (i)
- equation (20) can be computed as a vector multiplication of the joint distribution and the truth table of the predictor.
- Pr ⁇ X i 1 ⁇ .
- c j (i) Pr ⁇ j (i) is used ⁇ .
- Equation (11) provides the expression of the probability of the target gene X i in terms of the probabilities of the predictors and the joint distribution of the target's parent genes.
- the inventors have analyzed the joint steady-state probabilities of several combinations of two genes: Tie-2 and NF ⁇ B; Tie-2 and TGFB3; and TGFB3 and NF ⁇ B.
- the transition probabilities ⁇ and ⁇ were both approximately equal to 0.03.
- the perturbation probability p was set to 0.001.
- the network was ran for another 38,268 steps, the recomputed values of m 0 and N were 91 and 50,782, respectively. Running the network for another 3,000 iterations was sufficient for the given accuracy and the steady-state probabilities of these two genes could be determined.
- the steady-state probabilities for all pairs of considered genes are shown in Table 1 as percentages.
- Tie-2 is a receptor tyrosine kinase expressed on the endothelial cells. Its two ligands, angiopoietin 1 and 2 bind Tie-2 and regulate vasculogenesis (Sato et al., 1993), an important process in embryonic development and tumor development. Other related regulators for vasculogenesis are VEGF and VERF receptors, which are often overexpressed in the advanced stage of gliomas (Cheng et al., 1997).
- . Let: M(x, y) ⁇ k kF k (x, y) denote the mean first passage time from state x to state y in the chain corresponding to A. Then, the relative change in the limiting probability for state y is
- the perturbation matrix E from Theorem 3 can be expressed directly from Theorem 2 as follows. Let E (x,x′) be the entry in E corresponding to the transition probability from x to x′, for x,x′ ⁇ 0,1 ⁇ n . Also, let
- ⁇ ( x,x ′) A ( x,x ′) ⁇ (1 ⁇ p ) n +p ⁇ (x,x′) ⁇ (1 ⁇ p ) n ⁇ (x,x′) ⁇ 1 [x ⁇ x′] (22)
- E(x,x′) A(x,x′) ⁇ (x,x′) and for each row of E, we have
- equation (17) can be rewritten as
- Theorem 3 allows us to bound the sensitivity of the limiting probabilities of any state of the PBN, relative to the probability of random gene perturbation.
- the mean first passage times M(x,y) can be computed in a straightforward way by using the recursive formula in (10), The same type of analysis as above may be conducted between two PBNs with different mutation probabilities p 1 ⁇ p 2 and the relative sensitivity of the limiting probabilities can be expressed in terms of p 1 , p 2 , and the mean first passage times.
- One important implication of Theorem 3 is that if a particular state of a PBN can be “easily reached” from other states, meaning that the mean first passage times are small, then its steady-state probability may be relatively unaffected by perturbations. Such sets of states, if we hypothesize them to correspond to some functional cellular states, are thus relatively insensitive to random gene mutations.
Abstract
Description
F 1={f j (i)}j=1,...,l(i) (1)
where each ƒj (i) is a possible function determining the value of node xi and l(i) is the number of possible functions for node xi. The functions ƒj (i) may be called predictors, since the process of inferring these functions from measurements or equivalently, of producing a minimum-error estimate of the value of a node at the next time point, is known as prediction in estimation theory. A realization of a PBN at a given instant of time may be determined by a vector of Boolean functions. If there are N possible realizations, then there are N vector functions, f1, f2, . . . , fN of the form fk=(ƒk1 (1), ƒk2 (2), . . . , ƒkn (n), for k=1,2, . . . , N; 1≦ki≦l(i) and where ƒki (i)∈Fi(i=1, . . . , n). In other words, the vector function fk: {0,1}n→{0,1}n acts as a transition function (mapping) representing a possible realization of the entire PBN. Thus, given the values of all nodes (x1, . . . , xn), fk(x1, . . . , xn)=(x′1, . . . , x′n) gives us the state of the nodes after one step of the network given by the realization fk.
is the number of possible PBN realizations. If l(i)=1 for all i=1, . . . , n, then N=1 and the PBN reduces to a standard Boolean network.
containing lexicographically ordered rows, each one corresponding to a possible network configuration. That is, row m corresponds to network m and the entry j in the ith column specifies that predictor fj (i) should be used for gene xi. K is an N×n matrix. Using this matrix, the probability that network i is selected may be represented by
where Kij is the ijth entry in matrix K. It may be checked that
by noting that
where we have used equation (3).
where in the last expression, binary values are treated as real values. Since Pi=Pr{Network i is selected}, equation (6) can be interpreted as
and Pr{(x1, . . . , Xn)→(x′1′, . . . , x′n)|Network i is selected|}∈{0,1}, as is the case for standard Boolean networks, described below. By using equations (5) and (6), and the fact that for any (x1, . . . , xn) there always exists an (x′1, . . . , x′n) and i such that
also a Markov matrix and the PBN is a homogeneous Markov process, meaning that the transition probabilities do not change with time. It also follows that A has at most N·2n non-zero entries and reduces to the binary state-transition matrix when N=1, as described below (see Example 1 below).
where εi is the error of the best (constant) estimate of Xi in the absence of any conditional variables. The COD is between 0 and 1 and measures the relative decrease in error from estimating Xi via ƒk (i)(Xk (i)) rather than by just the best constant estimate. For instance, in the case of minimum mean-square error estimation, εi is the error of the mean of Xi, which is the best constant estimate, and ƒk (i)(Xk (i)) is the conditional expectation of Xi given ƒk (i)(Xk (i)) that is, ƒk (i)(Xk (i))=E└Xi|Xk (i)┘. In practice, the COD must be estimated from training data with designed approximations being used in place of ƒ1 (i), ƒ2 (i), . . . , ƒl(i) (i). Consequently, the complexity of the functions ƒ1 (i), ƒ2 (i), . . . , ƒl(i) (i) and the amount of training data become an issue. For some microarray-based analysis, the number of genes in each predictor was kept to a maximum of three. The framework afforded by the PBN may be well suited for dealing with design imprecision due to limited sample size, where the domain of each predictor may need to be constrained due to lack of training data, but several predictors, with possibly different domains, may be collectively, employed.
where the CODs are the estimates formed from the training data. According to the above expression, those functions corresponding to the highest CODs will be selected more often in the probabilistic network. The number of chosen predictors, l(i), can be a user-selectable parameter and determines the amount of uncertainty that the model can handle.
we find that the limiting probabilities are π=[0.15, 0, 0, 0, 0, 0, 0, 0.85].
where Pij r is the r-step transition probability. Hence, if the initial distribution is or π=(π1, π2, . . . , πM), then the probability of being in state i at time r is equal to πi for all r and the Markov chain is a strictly stationary random process. The Markov chain is said to possess a steady state (limiting) distribution if there exists a probability distribution π=(π1, π2, . . . , πM) such that, for all states i, j∈S,
If there exists a steady-state distribution, then, regardless of the starting state, the probability of the Markov chain being in state i in the long run is πi. In particular, for any initial distribution D0=(D1 0, D2 0, . . . , DM 0), the state probability Di k approaches πi as k→∞. Relative to the probability vector π, the vector Dk satisfies limk→∞Dk=π. Every irreducible, finite-state, homogeneous Markov chain possesses a unique probability vector π, with 0<πi<1, providing the stationary distribution. If the chain is also aperiodic, then π also provides the steady-state distribution. Should the chain only be irreducible, and not necessarily aperiodic, then it may not possess a steady-state distribution. A more detailed treatment of the above concepts can be found in most textbooks on stochastic processes.
where x(i) is the same as x except that the jth component is toggled (from 0 to 1, or from 1 to 0). While this definition uses the real-valued equivalent of a Boolean function and resembles the definition of a real-valued derivative, another standard definition of the partial derivative of a Boolean function f is given by
where ⊕ is addition modulo 2 (exclusive OR) and, x(j,k)=(x1, . . . , xj−1, k, xj+1, . . . , xn), for k=0, 1. The second definition inherently indicates that the partial derivative is itself a Boolean function. The physical meaning behind the partial derivative of a Boolean function with respect to the ith variable is that, defined on the n−1 dimensional projection of the n-cube, it acts as an indicator of whether or not the function differs along the ith dimension. The partial derivative is 0 if toggling the value of variable xj does not change the value of the function, and it is 1 otherwise.
The last expression gives the influence as the probability that a toggle of the jth variable changes the value of the function.
where the notation Ij(xi) represents the influence of gene xj on gene xi, given ƒi as the predictor (cf. 10). The point of this observation is to show that the same methods and framework that are used for gene predictors in Boolean networks can be used for influences as well, simply by replacing predictors by their partial derivatives.
This calculation can be performed between all pairs of variables and a n×n matrix Γ of influences can be constructed. That is, Γij=Ii(xj). We will call 64 the influence matrix. See example 2 below for an example illustrating the computation of the influence of one variable on another, in the context of PBNs.
where ⊕ is component-wise addition modulo 2 and fk(x1, . . . , xn), k=1, 2, . . . , N, is the transition function representing a possible realization of the entire PBN. In other words, equation (10) states that if no genes are mutated, the standard network transition function will be used, whereas if at least one mutation does occur, then the next state will be determined according to the genes that are mutated. An important observation to make here is that for p>0, any state of the network becomes accessible from any other state, due to the possibility of any combination of random gene mutations.
for the states x of interest and for a sufficiently large K0. The intuition behind this approach is the following. Since the events {the first passage time from x to y will be at time k} are disjoint for different values of k, the sum of their probabilities for k=1, . . . , K0 is equal to the probability that the network, starting in state x, will visit state y before time K0. As a special case, when K0=∞, this is equal to the probability that the chain ever visits state y, starting at state x, which of course is equal to 1, since our chains are ergodic if p>0.
Alternatively, by minimizing the mean first passage times, the optimal gene satisfies
Another related approach to the one in (13) might be to first fix a probability h0 and wait until one of the HKo(x(i),y) reaches it first. Note that due to ergodicity, for every state x(i), there will always be a K0 (i) large enough such that HK
At first glance, it might appear as if both approaches, (13) and (15), may yield the same answer, since
to be the first passage probability from a set X to a set Y.
for some matrix norm ∥·∥ and κ, κj are called condition numbers and are used as measures of sensitivity. Recently, a new approach to measure the sensitivity of the Markov chain to perturbations, in terms of mean first passage times, has been proposed by Cho and Meyer. This approach has the advantage in that it does not require computing or estimating the condition numbers. The result is presented in the attached appendix under Theorem 2.
II. Boolean Networks—Models of Gene Regulatory Networks
where ik=∈{0,1}. Equation (17) can then be used in an iterative fashion, following the dynamic nature of the system. In other words, the computed joint distribution Pr{ƒk(x)=ik, k=1, . . . , n} can be used in place of D(x) to compute the joint distribution at the next time point. This defines the iterative system
D t+1=Ψ(D t) (18)
where the mapping Ψ:[0,1]2n→[0,1]2n is implicitly defined by (17). In fact, Ψ is an affine mapping. To see this, let Dt and Dt+1 be represented by 1×2n vectors containing the joint probabilities and let the matrix A be a 2n×2n binary matrix defined as
where
and each ij∈{0,1}. Thus, i and j are simply indices such that i is the integer representation of the binary vector (x1, . . . , xn) while j encodes the binary vector (ƒ1(x), . . . , ƒn(x)). This representation is efficient because the matrix A contains exactly one non-zero entry in each row. Thus, equation (18) can be written as
D t+1 =D t ·A=D 0 ·A t+1, (19)
where D0=D(x) is the starting (prior) joint distribution. Equation (19) is the familiar Markov chain representation, where the state-transition matrix A is binary. This is to be expected, since the state transitions are completely specified by the Boolean functions and the probability of transition can be either 0 or 1.
III. Relationship Between PBN and Bayesian Networks
| x1x2x3 | f1 (1) | f2 (l) | f1 (2) | f1 (3) | f2 (3) | ||
| 000 | 0 | 0 | 0 | 0 | 0 | ||
| 001 | 1 | 1 | 1 | 0 | 0 | ||
| 010 | 1 | 1 | 1 | 0 | 0 | ||
| 011 | 1 | 0 | 0 | 1 | 0 | ||
| 100 | 0 | 0 | 1 | 0 | 0 | ||
| 101 | 1 | 1 | 1 | 1 | 0 | ||
| 110 | 1 | 1 | 0 | 1 | 0 | ||
| 111 | 1 | 1 | 1 | 1 | 1 | ||
| cj (i) | 0.6 | 0.4 | 1 | 0.5 | 0.5 | ||
Since there are 2 functions for node x1, 1 function for node x2, and 2 functions for node x3, there are N=4 possible networks and matrix K is equal to
For example, the second row of K containing (1, 1, 2) means that the predictors (ƒ1 (1), ƒ1 (2), ƒ3 (3)) will be used. Finally, by using equation (9), the state transition matrix A is given by
Let us consider one of the entries in matrix A to clarify its construction. Suppose we wish to compute the transition probability Pr{(1, 1, 0)→(1, 0, 0)}, which corresponds to the entry A7.5 (the indexing starts with 1). To do this, we need to use the row corresponding to (x1, x2, x3)=(1, 1, 0) in the network truth table given above. Then, we look for possible combinations of the predictors for each of the three genes that will give us the values (1, 0, 0). By direct inspection, one can see that either (ƒ1 (1), ƒ1 (2), ƒ2 (3)) or (ƒ2 (1), ƒ1 (2), ƒ2 (3)) result in (1, 0, 0). The two possible combinations correspond to the second and fourth rows of matrix K. That is why this transition probability is equal to P2+P4. All other entries in A are computed similarly. The state transition diagram corresponding to this matrix is shown in
| x1x2x3 | f(1) | f(2) | f(3) | ||
| 000 | * | 1 | 1 | ||
| 001 | 0 | 1 | * | ||
| 010 | 0 | 0 | * | ||
| 011 | 0 | 0 | * | ||
| 100 | 1 | 1 | * | ||
| 101 | 1 | 1 | * | ||
| 110 | 1 | 0 | * | ||
| 111 | * | 0 | 0 | ||
So, for example, there are four possible predictors ƒ1 (1), ƒ2 (1), ƒ3 (1), ƒ4 (1) for the first gene. Similarly, there are 256 possible vector functions (network realizations) of the form f=(ƒ(1), ƒ(2), ƒ(3)). The corresponding Markov diagram is given in
Putting these two influences together, we obtain
I 2(x 1)=0.5·0.6+0.75·0.4=0.6.
If we repeat these calculations between all pairs of variables, we will obtain the influence matrix
It is not surprising that Γ is not symmetric, since the influence of variable xi on variable xj may be stronger than the influence of variable xi on variable xi or vice versa. Another useful measure is the average sensitivity of a function. For example, consider the sensitivity of ƒ at vector x:
The average sensitivity of ƒ (with respect to distribution D) is then
Thus, one definition of average sensitivity of function ƒ is the sum of the influences of all variables on ƒ.
Given the influence matrix, this can be computed as
Biologically, a gene with a high influence factor has a high collective impact on the other genes. It is precisely these genes that have the potential to regulate the dynamics of the network, as their perturbation can lead to significant downstream effects, possibly forcing the system to transition to a different basin of attraction. Many transcriptional factor genes fall into this category. In this example, genes x2 and x3 are equally more important than gene x1.
This fact facilitates economical representation of joint distributions in Bayesian networks, since the entire joint distribution table does not need to be stored. Let us consider these conditional probability building blocks of Bayesian networks in the context of PBNs.
is the set of all variables used to predict gene xi, or simply, the parents of xi. For convenience of notation, let us expand the domains of all predictors by adding fictitious variables so that all are functions of the variables in Pa(xi). Computationally, this step is not necessary. Then, the conditional probability that Xi=1, given the fact that predictor ƒj (i) is used, is equal to
where Di(x) is the joint distribution over the variables in Pa(xi). Because we are in the binary setting, equation (20) can also be interpreted as the conditional expectation of Xi given the predictor ƒj (i) Computationally, we only need to consider the essential variables of ƒj (i) and their joint distribution, which can be obtained from the entire joint distribution D(x) by integrating out the fictitious variables. Moreover, equation (20) can be computed as a vector multiplication of the joint distribution and the truth table of the predictor. Ultimately, we are interested in obtaining Pr{Xi=1}. Recall that cj (i)=Pr{ƒj (i) is used}. Then,
| TABLE 1 |
| Steady-state analysis of several pairs of genes |
| Tie-2 | NFκB | % | Tie-2 | TGFB3 | % | TGFB3 | NFκB | % |
| OFF | OFF | 15.68 | OFF | OFF | 14.75 | OFF | OFF | 10.25 |
| OFF | ON | 41.58 | OFF | ON | 42.50 | OFF | ON | 12.47 |
| ON | OFF | 9.21 | ON | OFF | 7.96 | ON | OFF | 14.64 |
| ON | ON | 31.53 | ON | ON | 32.78 | ON | ON | 60.65 |
where
is the Hamming distance between vectors x and x′, Pi is given in equation (4) above, and 1[x≠x′], is an indicator function that is equal to 1 only when [x≠x′].
which. in terms of the individual Boolean functions, can be expressed as:
where we treat binary values as real values. This is in fact the transition probability when p=0.
If at least one gene is mutated, then the transition probability depends on the number of mutated genes. Given that a mutation did occur, causing a transition from state x to state x′, we can conclude that the number of mutated genes was η(x, x′), which is the Hamming distance between x and x′. Because γ∈{0,1}n is i.i.d. with E [γi]=p, i=1, . . . , n, the probability that x got changed to x′ is equal to pη(x,x′) X (1−p)n−η(x,x′). It is clear that the fact that at least one mutation occurred implies that x and x′ cannot be equal and so this expression must be multiplied by 1[x≠x′].
The bound is tight in the sense that there always exists a perturbation E that attains the bound, Let us now consider this result in the context of random gene perturbations.
Theorem 3 Given a PBN G(V,F) with an existing steady-state distribution, let πy be a limiting probability of state y when p=0 (no mutations) and let {tilde over (π)}y be the limiting probability of the same state when 0<p<½. Then,
Proof. The perturbation matrix E from Theorem 3 can be expressed directly from Theorem 2 as follows. Let E (x,x′) be the entry in E corresponding to the transition probability from x to x′, for x,x′∈{0,1}n. Also, let
denote the transition matrix when p=0 and A (x,x′) denote the transition matrix given in Theorem 1, where a non-zero mutation probability is assumed, In other words,
Ã(x,x′)=A(x,x′)×(1−p)n +p η(x,x′)×(1−p)n−η(x,x′)×1[x≠x′] (22)
Then. E(x,x′)=A(x,x′)−Ã(x,x′) and for each row of E, we have
where we can remove the absolute value symbols since each summand is positive. Since the summation in equation (24) is taken over all possible values of x′ except x′=x, the Hamming distance η(x, x′) ranges from 1 to n, As there are
states x′ that are Hamming distance k from
equation (17) can be rewritten as
Thus, every row of E satisfies
and so
∥E∥ ∞≦2(1−(1−p)n) (26)
as well,
Using (26) together with Theorem 2 gives the desired result.
Claims (21)
Priority Applications (1)
| Application Number | Priority Date | Filing Date | Title |
|---|---|---|---|
| US10/354,907 US7257563B2 (en) | 2002-01-30 | 2003-01-30 | Probabilistic boolean networks |
Applications Claiming Priority (2)
| Application Number | Priority Date | Filing Date | Title |
|---|---|---|---|
| US35272502P | 2002-01-30 | 2002-01-30 | |
| US10/354,907 US7257563B2 (en) | 2002-01-30 | 2003-01-30 | Probabilistic boolean networks |
Publications (2)
| Publication Number | Publication Date |
|---|---|
| US20030225718A1 US20030225718A1 (en) | 2003-12-04 |
| US7257563B2 true US7257563B2 (en) | 2007-08-14 |
Family
ID=27663124
Family Applications (1)
| Application Number | Title | Priority Date | Filing Date |
|---|---|---|---|
| US10/354,907 Expired - Fee Related US7257563B2 (en) | 2002-01-30 | 2003-01-30 | Probabilistic boolean networks |
Country Status (2)
| Country | Link |
|---|---|
| US (1) | US7257563B2 (en) |
| WO (1) | WO2003065244A1 (en) |
Cited By (10)
| Publication number | Priority date | Publication date | Assignee | Title |
|---|---|---|---|---|
| US20030140063A1 (en) * | 2001-12-17 | 2003-07-24 | Pizzorno Joseph E. | System and method for providing health care advice by diagnosing system function |
| US20040249832A1 (en) * | 2002-01-04 | 2004-12-09 | Goldthorpe Ward Hillary | Method for systemic enterprise knowledge management |
| US20050256815A1 (en) * | 2002-03-15 | 2005-11-17 | Reeve Anthony E | Medical applications of adaptive learning systems using gene expression data |
| US20080162723A1 (en) * | 2003-03-05 | 2008-07-03 | Fuyong Zhao | Method and apparatus for updating probabilistic network routing information |
| US20080168463A1 (en) * | 2007-01-09 | 2008-07-10 | International Business Machines Corporation | System and method of load balancing using fuzzy logic |
| US20100061292A1 (en) * | 2008-09-09 | 2010-03-11 | Weinstein William W | Network communication systems and methods |
| US8018953B1 (en) | 2003-08-20 | 2011-09-13 | Cisco Technology, Inc. | Adaptive, deterministic ant routing approach for updating network routing information |
| US20180292386A1 (en) * | 2017-04-05 | 2018-10-11 | Korea Advanced Institute Of Science And Technology | Method for predicting a drug response based on the attractor dynamics of the network of a cancer-cell and device for the same |
| US10270677B2 (en) | 2015-10-06 | 2019-04-23 | Samsung Electronics Co., Ltd. | Method and device for analyzing interaction network |
| US11177042B2 (en) | 2017-08-23 | 2021-11-16 | International Business Machines Corporation | Genetic disease modeling |
Families Citing this family (30)
| Publication number | Priority date | Publication date | Assignee | Title |
|---|---|---|---|---|
| ATE398808T1 (en) * | 2002-08-29 | 2008-07-15 | Gene Network Sciences Inc | SYSTEMS AND METHODS FOR INFERENCE ON BIOLOGICAL NETWORKS |
| US20040059561A1 (en) * | 2002-09-25 | 2004-03-25 | Ilya Gluhovsky | Method and apparatus for determining output uncertainty of computer system models using sensitivity characterization |
| EP1494127A1 (en) * | 2003-07-01 | 2005-01-05 | Semeion | Method, computer program and computer readable means for projecting data from a multidimensional space into a space having less dimensions and to carry out a cognitive analysis on said data. |
| US8200775B2 (en) | 2005-02-01 | 2012-06-12 | Newsilike Media Group, Inc | Enhanced syndication |
| WO2005031591A1 (en) * | 2003-09-30 | 2005-04-07 | Intel Corporation | Most probable explanation generation for a dynamic bayesian network |
| US8347088B2 (en) * | 2005-02-01 | 2013-01-01 | Newsilike Media Group, Inc | Security systems and methods for use with structured and unstructured data |
| US20070050446A1 (en) | 2005-02-01 | 2007-03-01 | Moore James F | Managing network-accessible resources |
| US8200700B2 (en) | 2005-02-01 | 2012-06-12 | Newsilike Media Group, Inc | Systems and methods for use of structured and unstructured distributed data |
| US8700738B2 (en) | 2005-02-01 | 2014-04-15 | Newsilike Media Group, Inc. | Dynamic feed generation |
| US9202084B2 (en) | 2006-02-01 | 2015-12-01 | Newsilike Media Group, Inc. | Security facility for maintaining health care data pools |
| US8140482B2 (en) | 2007-09-19 | 2012-03-20 | Moore James F | Using RSS archives |
| US9223929B2 (en) * | 2005-03-14 | 2015-12-29 | The California Institute Of Technology | Method and apparatus for detection, identification and quantification of single-and multi-analytes in affinity-based sensor arrays |
| US11001881B2 (en) | 2006-08-24 | 2021-05-11 | California Institute Of Technology | Methods for detecting analytes |
| US8637436B2 (en) | 2006-08-24 | 2014-01-28 | California Institute Of Technology | Integrated semiconductor bioarray |
| WO2008014485A2 (en) | 2006-07-28 | 2008-01-31 | California Institute Of Technology | Multiplex q-pcr arrays |
| US11525156B2 (en) | 2006-07-28 | 2022-12-13 | California Institute Of Technology | Multiplex Q-PCR arrays |
| US11560588B2 (en) | 2006-08-24 | 2023-01-24 | California Institute Of Technology | Multiplex Q-PCR arrays |
| WO2008053499A1 (en) * | 2006-10-30 | 2008-05-08 | Humanitas Mirasole S.P.A. | Method for calculating the probability of developing tumoral or degenerative diseases. |
| US20080208948A1 (en) * | 2007-02-27 | 2008-08-28 | Panetta Karen A | Methods and apparatus for using boolean derivatives to process data |
| US20110107155A1 (en) * | 2008-01-15 | 2011-05-05 | Shunsuke Hirose | Network fault detection apparatus and method |
| CN103646159B (en) * | 2013-09-30 | 2016-07-06 | 温州大学 | A kind of maximum scores Forecasting Methodology based on restrictive Boolean network |
| KR101400946B1 (en) * | 2013-12-27 | 2014-05-29 | 한국과학기술정보연구원 | Biological network analyzing device and method thereof |
| US9708647B2 (en) | 2015-03-23 | 2017-07-18 | Insilixa, Inc. | Multiplexed analysis of nucleic acid hybridization thermodynamics using integrated arrays |
| US9499861B1 (en) | 2015-09-10 | 2016-11-22 | Insilixa, Inc. | Methods and systems for multiplex quantitative nucleic acid amplification |
| WO2017155858A1 (en) | 2016-03-07 | 2017-09-14 | Insilixa, Inc. | Nucleic acid sequence identification using solid-phase cyclic single base extension |
| CN106021991B (en) * | 2016-08-08 | 2017-04-12 | 温州大学 | Method for stimulating intervention of tumor cell states based on Boolean network |
| US11604937B2 (en) * | 2018-04-09 | 2023-03-14 | Kåre L. Andersson | Systems and methods for adaptive data processing associated with complex dynamics |
| CN113924041A (en) | 2019-03-14 | 2022-01-11 | 因斯利克萨公司 | Method and system for fluorescence detection based on time gating |
| US11461665B2 (en) * | 2019-11-12 | 2022-10-04 | Kåre L. Andersson | Systems and methods of a Boolean network development environment |
| US20210158901A1 (en) * | 2019-11-26 | 2021-05-27 | Accenture Global Solutions Limited | Utilizing a neural network model and hyperbolic embedded space to predict interactions between genes |
Citations (3)
| Publication number | Priority date | Publication date | Assignee | Title |
|---|---|---|---|---|
| US6169981B1 (en) | 1996-06-04 | 2001-01-02 | Paul J. Werbos | 3-brain architecture for an intelligent decision and control system |
| US20020042786A1 (en) | 2000-08-03 | 2002-04-11 | Unicru, Inc. | Development of electronic employee selection systems and methods |
| US20030130973A1 (en) * | 1999-04-05 | 2003-07-10 | American Board Of Family Practice, Inc. | Computer architecture and process of patient generation, evolution, and simulation for computer based testing system using bayesian networks as a scripting language |
-
2003
- 2003-01-30 WO PCT/US2003/002722 patent/WO2003065244A1/en not_active Application Discontinuation
- 2003-01-30 US US10/354,907 patent/US7257563B2/en not_active Expired - Fee Related
Patent Citations (4)
| Publication number | Priority date | Publication date | Assignee | Title |
|---|---|---|---|---|
| US6169981B1 (en) | 1996-06-04 | 2001-01-02 | Paul J. Werbos | 3-brain architecture for an intelligent decision and control system |
| US20030130973A1 (en) * | 1999-04-05 | 2003-07-10 | American Board Of Family Practice, Inc. | Computer architecture and process of patient generation, evolution, and simulation for computer based testing system using bayesian networks as a scripting language |
| US20020042786A1 (en) | 2000-08-03 | 2002-04-11 | Unicru, Inc. | Development of electronic employee selection systems and methods |
| US20020046199A1 (en) | 2000-08-03 | 2002-04-18 | Unicru, Inc. | Electronic employee selection systems and methods |
Non-Patent Citations (28)
| Title |
|---|
| Datta et al., "External control in Markovian genetic regulatory networks," (to appear in) Machine Learning., pp. 1-25. |
| Dougherty and Shmulevich, "Mappings between probabilistic Boolean networks," Signal Processing, 83:799-809, 2003. |
| Dougherty et al., "Coefficient of determination in nonlinear signal processing," Signal Processing, 80:2219-2235, 2000. |
| Fox and Furmanski, "Load balancing loosely synchronous problems with a neural network," ACM Hypercube Concurrent Computers and Applications, pp. 241-278, Feb. 1988. |
| Hashimoto et al., "Efficient selection of feature sets possessing high coefficients of determination based on incremental determinations," Signal Processing, 83(4):695-712, 2003. |
| Jimenez and Lin, "Dynamic branch prediction with perceptrons," Technical Report TR2000-08, Dept. of Computer Sciences, The University of Texas, pp. 1-10, 2000. |
| Jimenez and Lin, "Neural methods for dynamic branch prediction," ACM Transactions on Computer Systems, 20(4):369-397, 2002. |
| Jimenez et al., "Boolean formula-based branch prediction for future technologies," Proceedings of the International Conference on Parallel Architectures and Compilation Techniques, pp. 1-10, Sep. 2001. |
| Jimenez et al., "The Impact of delay on the design of branch predictors," Proceedings of the 33<SUP>rd </SUP>Annual International Symposium on Microarchitecture, pp. 1-10, Dec. 2000. |
| Kim et al., "Can Markov chain models mimic biological regulation?" J. Biol. Sys., 10:337-357, 2002. |
| Kim et al., "General nonlinear framework for the analysis of gene interaction via multivariate expression arrays," J. Biomed. Optics, 5(4):411-424, 2000. |
| Kim et al., "Multivariate measurement of gene expression relationships," Genomics, 67:201-209, 2000. |
| Lähdesmäki et al., "On learning gene regulatory networks under the boolean network system," Machine Learning, 17(36):1-26, 2002. |
| Learning by probabilistic Boolean networks, Dorigo, M.; Neural Networks, 1994. IEEE World Congress on Computational Intelligence., IEEE International Conference on pp. 887-891 vol. 2 Digital Object Identifier 10.1109/ICNN.1994.374297. * |
| Melnik et al., "Block-Median Pyramidal Transform: Analysis and Denoising Applications," IEEE Transactions on Signal Processing, 49(2):364-372, 2001. |
| Mulgund et al., "OLIPSA: on-line intelligent processor for situation assessment," 2<SUP>nd </SUP>Annual Symposium and Exhibiton on Situational Awareness in the Tactical Air Environment, pp. 1-13, Jun. 1997. |
| Reese et al., "Improved splice site detection in genie," ACM Annual Conference on Research in Computational Molecular Biology, pp. 232-240, 1997. |
| Schrodt, "Machine Learning," Chapter 5 in: Patterns Rules and Learning, Version 1.0, 1-76, 1995. |
| Shmulevich et al., "Control of stationary behavior in probabilistic Boolean networks by means of structural intervention," J. Biol. Sys., 10:431-445, 2002. |
| Shmulevich et al., "From Bolean to probabilistic Boolean networks as models of genetic regulatory networks," Proceedings of the IEEE, 90:1778-1792, 2002. |
| Shmulevich et al., "Gene pertubation and intervention in probabilistic Boolean networks," Bioinformatics, 18:1319-1331, 2002. |
| Shmulevich et al., "Inference of genetic regulatory networks via best-fit extensions," in: Computational and Statistical Approaches to Genomics, Zhang and Shmulevich (eds.), Chapter 11: pp. 197-210, 2002. |
| Shmulevich et al., "Probabilistic Boolean networks: a rule-based uncertainty model for gene regulatory networks," Bioinformatics, 18:261-274, 2002. |
| Suh et al., "Parallel computation and visualization tools for codetermination analysis of multivariate gene-expression relations," in: Computational and Statistical Approaches to Genomics, Zhang and Shmulevich (eds.), chapter 13: pp. 227-240, 2002. |
| Tabus and Astola, "On the use of MDL principle in gene expression prediction," J. of Applied Signal Processing, 2001(4):297-303, 2001. |
| Tabus et al., "Normalized maximum likelihood models for Boolean regression with application to prediction and classification in genomics," in: Computational and Statistical Approaches to Genomics, Zhang and Shmulevich (eds.), Chapter 10: pp. 173-196, 2002. |
| Watts and Strogatz, "Collective dynamics of 'small-world' networks," Nature, 393(6684):440-442, 1998. |
| Zhou et al., "Construction of genomic networks using mutual-information clustering and reversible-jump Markov-chain-Monte-Carlo predictor design," Signal Processing, 83:745-761, 2003. |
Cited By (16)
| Publication number | Priority date | Publication date | Assignee | Title |
|---|---|---|---|---|
| US20030140063A1 (en) * | 2001-12-17 | 2003-07-24 | Pizzorno Joseph E. | System and method for providing health care advice by diagnosing system function |
| US20040249832A1 (en) * | 2002-01-04 | 2004-12-09 | Goldthorpe Ward Hillary | Method for systemic enterprise knowledge management |
| US20050256815A1 (en) * | 2002-03-15 | 2005-11-17 | Reeve Anthony E | Medical applications of adaptive learning systems using gene expression data |
| US7370021B2 (en) * | 2002-03-15 | 2008-05-06 | Pacific Edge Biotechnology Ltd. | Medical applications of adaptive learning systems using gene expression data |
| US20080162723A1 (en) * | 2003-03-05 | 2008-07-03 | Fuyong Zhao | Method and apparatus for updating probabilistic network routing information |
| US7903650B2 (en) * | 2003-03-05 | 2011-03-08 | Cisco Technology, Inc. | Method and apparatus for updating probabilistic network routing information |
| US8018953B1 (en) | 2003-08-20 | 2011-09-13 | Cisco Technology, Inc. | Adaptive, deterministic ant routing approach for updating network routing information |
| US20080168463A1 (en) * | 2007-01-09 | 2008-07-10 | International Business Machines Corporation | System and method of load balancing using fuzzy logic |
| US7577635B2 (en) * | 2007-01-09 | 2009-08-18 | International Business Machines Corporation | System and method of load balancing using fuzzy logic |
| US20090276388A1 (en) * | 2007-01-09 | 2009-11-05 | International Business Machines Corporation | System and method of load balancing using fuzzy logic |
| US7844564B2 (en) | 2007-01-09 | 2010-11-30 | International Business Machines Corporation | System and method of load balancing using fuzzy logic |
| US20100061292A1 (en) * | 2008-09-09 | 2010-03-11 | Weinstein William W | Network communication systems and methods |
| US8730863B2 (en) | 2008-09-09 | 2014-05-20 | The Charles Stark Draper Laboratory, Inc. | Network communication systems and methods |
| US10270677B2 (en) | 2015-10-06 | 2019-04-23 | Samsung Electronics Co., Ltd. | Method and device for analyzing interaction network |
| US20180292386A1 (en) * | 2017-04-05 | 2018-10-11 | Korea Advanced Institute Of Science And Technology | Method for predicting a drug response based on the attractor dynamics of the network of a cancer-cell and device for the same |
| US11177042B2 (en) | 2017-08-23 | 2021-11-16 | International Business Machines Corporation | Genetic disease modeling |
Also Published As
| Publication number | Publication date |
|---|---|
| US20030225718A1 (en) | 2003-12-04 |
| WO2003065244A9 (en) | 2004-06-03 |
| WO2003065244A1 (en) | 2003-08-07 |
Similar Documents
| Publication | Publication Date | Title |
|---|---|---|
| US7257563B2 (en) | Probabilistic boolean networks | |
| Sverchkov et al. | A review of active learning approaches to experimental design for uncovering biological networks | |
| Grinberg et al. | An evaluation of machine-learning for predicting phenotype: studies in yeast, rice, and wheat | |
| Sesia et al. | Gene hunting with hidden Markov model knockoffs | |
| Emmert-Streib et al. | Statistical inference and reverse engineering of gene regulatory networks from observational expression data | |
| Dasgupta et al. | Brief review of regression‐based and machine learning methods in genetic epidemiology: the Genetic Analysis Workshop 17 experience | |
| Julius et al. | Genetic network identification using convex programming | |
| Thorne et al. | Graph spectral analysis of protein interaction network evolution | |
| Shojaie et al. | Inferring regulatory networks by combining perturbation screens and steady state gene expression profiles | |
| Backes et al. | Simulating the large-scale erosion of genomic privacy over time | |
| Žitnik et al. | Gene prioritization by compressive data fusion and chaining | |
| van Someren et al. | Genetic network models: A comparative study | |
| Gerard et al. | Unifying and generalizing methods for removing unwanted variation based on negative controls | |
| Feng et al. | Survival analysis of DNA mutation motifs with penalized proportional hazards | |
| Grzegorczyk | An introduction to Gaussian Bayesian networks | |
| Bernaola et al. | Learning massive interpretable gene regulatory networks of the human brain by merging Bayesian networks | |
| Todor et al. | Characterizing the topology of probabilistic biological networks | |
| Lee et al. | Tail-adaptive Bayesian shrinkage | |
| Chipman et al. | Using stochastic causal trees to augment Bayesian networks for modeling eQTL datasets | |
| Christoffersen et al. | Quasi-Monte Carlo Methods for Binary Event Models with Complex Family Data | |
| Djordjilović et al. | An empirical comparison of popular structure learning algorithms with a view to gene network inference | |
| Feng | Interpretable and reliable statistical models for biomedicine | |
| Nepusz et al. | Structural pattern discovery in protein–protein interaction networks | |
| Nguyen | Methods for inferring gene regulatory networks from time series expression data | |
| Border | Stochastic Lanczos Likelihood Estimation of Genomic Variance Components |
Legal Events
| Date | Code | Title | Description |
|---|---|---|---|
| AS | Assignment |
Owner name: BOARD OF REGENTS, THE UNIVERSITY OF TEXAS SYSTEM, Free format text: ASSIGNMENT OF ASSIGNORS INTEREST;ASSIGNORS:SHMULEVICH, ILYA;ZHANG, WEI;REEL/FRAME:014190/0632 Effective date: 20030520 Owner name: TEXAS A&M UNIVERSITY SYSTEM, TEXAS Free format text: ASSIGNMENT OF ASSIGNORS INTEREST;ASSIGNOR:DOUGHERTY, EDWARD R.;REEL/FRAME:014190/0638 Effective date: 20030417 |
|
| REMI | Maintenance fee reminder mailed | ||
| LAPS | Lapse for failure to pay maintenance fees | ||
| STCH | Information on status: patent discontinuation |
Free format text: PATENT EXPIRED DUE TO NONPAYMENT OF MAINTENANCE FEES UNDER 37 CFR 1.362 |
|
| FP | Lapsed due to failure to pay maintenance fee |
Effective date: 20110814 |