US7738948B2 - Form parameter forecaster for analyzing signals distorted by noise - Google Patents
Form parameter forecaster for analyzing signals distorted by noise Download PDFInfo
- Publication number
- US7738948B2 US7738948B2 US11/554,778 US55477806A US7738948B2 US 7738948 B2 US7738948 B2 US 7738948B2 US 55477806 A US55477806 A US 55477806A US 7738948 B2 US7738948 B2 US 7738948B2
- Authority
- US
- United States
- Prior art keywords
- signal
- waveform
- wave
- event
- signal component
- Prior art date
- Legal status (The legal status is an assumption and is not a legal conclusion. Google has not performed a legal analysis and makes no representation as to the accuracy of the status listed.)
- Active, expires
Links
Images


Classifications
-
- A—HUMAN NECESSITIES
- A61—MEDICAL OR VETERINARY SCIENCE; HYGIENE
- A61B—DIAGNOSIS; SURGERY; IDENTIFICATION
- A61B5/00—Measuring for diagnostic purposes; Identification of persons
- A61B5/24—Detecting, measuring or recording bioelectric or biomagnetic signals of the body or parts thereof
- A61B5/316—Modalities, i.e. specific diagnostic methods
- A61B5/318—Heart-related electrical modalities, e.g. electrocardiography [ECG]
- A61B5/346—Analysis of electrocardiograms
- A61B5/349—Detecting specific parameters of the electrocardiograph cycle
-
- A—HUMAN NECESSITIES
- A61—MEDICAL OR VETERINARY SCIENCE; HYGIENE
- A61N—ELECTROTHERAPY; MAGNETOTHERAPY; RADIATION THERAPY; ULTRASOUND THERAPY
- A61N1/00—Electrotherapy; Circuits therefor
- A61N1/18—Applying electric currents by contact electrodes
- A61N1/32—Applying electric currents by contact electrodes alternating or intermittent currents
- A61N1/36—Applying electric currents by contact electrodes alternating or intermittent currents for stimulation
- A61N1/362—Heart stimulators
- A61N1/37—Monitoring; Protecting
- A61N1/3702—Physiological parameters
Definitions
- the present invention relates to digital signal processing using waveform morphology.
- the invention relates to processing signals, such as sensed cardiac signals distorted by cross talk or other noise, to identify a signal component of interest.
- Implantable medical devices are used for a variety of monitoring and therapy delivery purposes. Many IMD's sense physiologic signals and provide outputs, either in the form of delivered therapy or in the form of monitored physiologic activity.
- pacemakers and implantable cardioverter defibrillators include electrodes (and in some cases other sensors) to sense cardiac activity.
- the sensed signals representing cardiac activity are processed in signal processing channels, and are used in the detection of cardiac arrhythmias and other conditions that require the delivery of therapy.
- the types of therapy that can be delivered include, for example, pacing pulses and cardioversion/defibrillation shocks delivered to the heart.
- An IMD that is monitoring or delivering therapy to the heart must accurately process sensed signals that may contain noise, such as cross talk, that distorts the signal waveform.
- a sensed signal from an atrial electrode will typically contain a P-wave signal representing depolarization of the atrium and a Far Field R-wave (FFRW) signal, which occurs when an atrial electrode detects an electrical signal resulting from ventricular depolarization.
- FFRW Far Field R-wave
- the Far Field R-wave is normally an unwanted atrial sensed signal, and can be considered cross talk or noise.
- Various techniques have been developed in the past to distinguish between P-waves and Far Field R-waves, so that a Far Field R-wave is not erroneously identified as P-wave.
- Signal processing of physiologic signals has generally been performed in IMDs by analog circuitry.
- Digital signal processing offers potential benefits that have been used in IMDs.
- the incoming sensed signal is converted to a digital signal at a specified rate.
- Sampled waveform data representing the input signal can then be processed digitally, which permits more sophisticated signal analysis and has generally been available with analog circuitry.
- the Wohlgemuth et al. U.S. Pat. No. 6,556,859 describes the use of digital signal processing to classify sensed atrial signals as P-wave or Far Field R-waves, based upon form factor histograms. In this technique, there must be some time separation between the P-wave form factor histogram and the R-wave form factor histogram, so that each has a specific form or shape. Other techniques are required if there is an overlap or near overlap.
- the resulting atrial signal will have a waveform which is a combination of the two overlapping signal components.
- the sensed atrial waveform may be distorted to the extent that it does not resemble either of the two waveform components (P-wave and FFRW) that are overlapping.
- Digital signal processing techniques with the ability to extract and identify the waveform component of interest, such as the P-wave in an atrial sensed signal, would be advantageous.
- a signal component of interest in an input signal (e.g., a P-wave signal component of an atrial sensed signal) is identified using signal morphology of the input signal, even if the input signal waveform is distorted by the presence of noise (e.g., a superimposed Far Field R-wave signal component).
- a plurality of composite waveforms are generated using a first waveform template representing the signal component of interest and a second waveform template representing the noise signal component. Each composite waveform represents the first and second templates superimposed with a different relative time shift.
- Form parameters are derived from each composite waveform, and a multidimensional map based upon the form factors of the composite waveforms is derived.
- a form parameter forecaster uses the multidimensional map to identify the signal component of interest from the input signal.
- Waveform data from the input signal is collected during a sensed event time window, and form parameters are derived based upon the waveform data.
- An output is produced identifying the signal component of interest and its location within the time window based upon the form parameters of the input signal waveform and the mapped sets of form parameters.
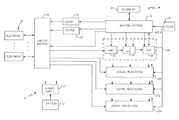
- FIG. 1 is a block diagram of an implantable cardioverter defibrillator (ICD) including digital signal processing channels for processing sensed cardiac signals.
- ICD implantable cardioverter defibrillator
- FIGS. 2A and 2B shows electrogram signals from an atrial electrode showing a P-wave and a Far Field R-wave, respectively.
- FIG. 3A shows a composite waveform produced by superimposing the waveforms of FIGS. 2A and 2B with a time shift, where the P-wave leads the Far Field R-wave.
- FIG. 3B shows a composite waveform produced by superimposing the waveforms of FIGS. 2A and 2B with a time shift, where the Far Field R-wave leads the P-wave.
- FIG. 4 shows a graph representing a set of two form parameters for each composite waveform.
- FIG. 5 is a graph of two form parameters with boundaries mapping a form parameter space.
- FIG. 6 shows a graph of two form parameters with boundaries and associated superposition sense compensation times.
- FIG. 7 is a flow diagram showing calculation of form parameter forecast boundaries.
- FIG. 8 shows a flow diagram showing classification of incoming input signal events using the form parameter forecast boundaries produced by the process shown in FIG. 7 .
- signal processing with a form parameter forecaster will be discussed in the context of an implantable medical device, and specifically in the context of processing of atrial sensed signals to identify a P-wave and distinguish it from a Far Field R-wave. It should be understood, however, that the use of the form parameter forecaster is applicable to other types of devices and to other types of signals.
- FIG. 1 is a block diagram of implantable cardioverter defibrillator (ICD) 10 , which includes battery 12 , power supply 14 , master control 16 , clock circuitry 18 , signal processing channels 20 a - 20 d , defibrillation circuitry 22 , pacing circuitry 24 , switch matrix 26 , electrodes 28 , and telemetry interface 30 .
- Each of the signal processing channels 20 a - 20 d is a digital signal processing channel that includes preamplifier 32 , sigma-delta analog-to-digital converter (ADC) 34 , and digital signal processor (DSP) 36 .
- ADC analog-to-digital converter
- DSP digital signal processor
- Battery 12 and power supply 14 provide all of the electrical energy used by ICD 10 to perform sensing, therapy delivery, and communication with other devices. This includes supply voltages required to operate the electronic circuitry of ICD 10 , and the energy required by pacing circuitry 24 to deliver pacing pulses and the voltages required by defibrillation circuitry 22 to provide cardioversion and defibrillation shocks.
- Master control 16 controls the overall operation of ICD 10 . It provides control inputs to each of the signal processing channels 20 a - 20 d , determines the appropriate therapy based upon the outputs of signal processing channels 20 a - 20 d together with stored detection criteria and therapy delivery programs, provides control signals to defibrillation circuitry 22 and pacing circuitry 24 , and communicates with external devices through telemetry interface 30 . Master control 16 can provide information regarding the status and operation of ICD 10 through telemetry interface 30 to an external device such as a programmer or a monitor, and may also receive downloads of information, including control settings, from an external programmer through telemetry interface 30 .
- Master control 16 may include, for example, a microcontroller, memory for data storage, memory for storing software and firmware, and memory for storing control settings and other information that may be provided via telemetry interface 30 .
- Clock circuitry 18 provides master clock (MCLK) signals to master control 16 , as well as to signal processing channels 20 a - 20 d .
- MCLK master clock
- each signal processing channel 20 a - 20 d derives from master clock MCLK the necessary clock signals to operate circuitry within that channel, including sigma-delta ADC 34 .
- Electrodes 28 may be carried by leads that extend from the housing of ICD 10 to locations in or near the heart.
- electrodes 28 may be carried by leads that extend into the right atrium, into the right ventricle, and through the coronary sinus into a coronary vein adjacent the left ventricle.
- electrodes 28 can also be carried by the housing of ICD 10 .
- Electrodes 28 are used to sense electrical activity of the heart, as well as to deliver pacing pulses or cardioversion/defibrillation shocks to the heart.
- Switch matrix 26 connects different electrodes to different components of ICD 10 depending on the sensing or therapy delivery function required.
- Defibrillator circuitry 22 delivers high voltage shocks to the heart under the control of master control 16 .
- the shocks are provided from defibrillation circuitry 22 through switch matrix 26 to selected electrodes 28 .
- master control 16 provides control signals to pacing circuitry 24 , to cause pacing pulses to be delivered through switch matrix 26 to selected electrodes 28 in order to deliver pacing therapy.
- electrodes 28 are used to provide signals representing cardiac activity, other forms of sensors may also be used to provide sense signals that are processed by one or more of signal processing channels 20 a - 20 d.
- Each of signal processing channels 20 a - 20 d comprises a digital signal processing channel for receiving input signals, converting those signals to digital form, processing those digital signals, and delivering the results of the signal processing to master control 16 .
- the use of digital signal processing channels 20 a - 20 d has significant advantages. Because most of the signal processing occurs in the digital rather than the analog realm, the same basic architecture and components can be used to provide a variety of different signal processing features. Changes in the signal processing can be made by changing instructions to master control 16 , which in turn controls digital signal processor 36 , rather than requiring redesign or replacement of analog components or circuits. In addition, the use of digital signal processing offers the potential of using high density digital integrated circuitry to implement signal processing functions.
- preamplifier 32 is an analog signal, which must be converted to digital form in order to perform digital signal processing functions.
- Preamplifier 32 is, in this embodiment, a variable gain preamplifier, although other types of preamplifier circuits may be used in other embodiments.
- preamplifier 32 could be omitted entirely in embodiments where electrodes 28 and/or switch matrix 26 are adapted to provide appropriate signals directly for conversion to digital form.
- Master control 16 provides control settings to preamplifier 32 to select the appropriate gain for that particular signal channel.
- Sigma-delta ADC 34 receives the output of preamplifier 32 and converts the analog signal at its input to a digital value that is then provided to digital signal processor 36 .
- Sigma-delta ADC 34 also receives the master clock MCLK signal from clock circuitry 16 .
- Sigma-delta ADC 34 divides master clock MCLK to an appropriate conversion clock (CCLK) rate to perform sigma-delta analog-to-digital conversion.
- conversion clock CCLK has a number of different phases that are used within sigma-delta ADC 34 in the conversion process.
- Sigma-delta ADC 34 can make use of a single stage or multiple stages of integration in the conversion process, and can provide a digital output in a single-bit or a multi-bit form.
- An advantage of sigma-delta ADC 34 is a relatively low energy consumption in the conversion process.
- the output of sigma-delta ADC 34 is a multi-bit digital signal representing a sample value of the analog input signal at the sample rate of ADC 34 .
- Digital signal processor 36 digitally filters the signal and senses an event, such as crossing of a threshold, to collect a series of samples over a time window.
- Digital signal processor 36 performs waveform analysis of the signal captured in the time window in order to identify the cardiac event within the time window. As part of this waveform analysis, digital signal processor 36 identifies the event based upon signal morphology. Form parameters are derived from the input signal waveform and are used to identify the cardiac event within the time window.
- An input signal from an atrial electrode may contain both a P-wave signal representative of an atrial sinus event, and a Far Field R-wave signal representative of a ventricular event.
- Digital signal processor 36 must distinguish between a P-wave signal and a Far Field R-wave signal.
- the P-wave signal represents the signal component of interest
- the Far Field R-wave signal represents cross talk or noise.
- a P-wave has a different signal morphology from a Far Field R-wave signal. Therefore, form parameters derived from the atrial input signal within the time window can be used to determine whether the event sensed is a P-wave signal or a Far Field R-wave signal.
- the resulting signal within the time window may be the result of overlapping P-wave and Far Field R-wave signals.
- the result is a distorted waveform morphology that may not resemble either a P-wave signal or a Far Field R-wave signal.
- the Far Field R-wave may even lead the P-wave, so that the event time window triggered by a threshold crossing may not be an accurate indication of when the P-wave occurred.
- digital signal processor 36 In order to identify P-waves within an atrial signal, digital signal processor 36 must be able to handle situations where the P-wave and Far Field R-wave signals may be overlapping.
- Digital signal processor 36 includes a form parameter forecaster, which uses form parameters of composite waveforms created by superimposing templates of P-wave and Far Field R-wave signals at different time delays (i.e., different amounts of overlap).
- the form parameter forecaster enables digital signal processor 36 to identify a P-wave within the time window, and to determine its location within the time window. With the use of the form parameter forecaster, digital signal processor 36 is able to identify a P-wave even when the atrial input signal is distorted because the P-wave and Far Field R-wave events occur so close in time that their signal components are superimposed.
- FIGS. 2A and 2B show electrogram signals from an atrial electrode.
- FIG. 2A shows P-wave signal 50 , which triggers sampling during time window 52 when P-wave signal crosses sensing threshold ST.
- the length of window 52 is shown as 40 samples in FIG. 2A .
- FFRW Far Field R-wave
- P-wave signal 50 and FFRW signal 60 have different signal morphology.
- Form parameters can be derived from P-wave signal 50 and FFRW signal 60 and used to identify and distinguish these signals from one another.
- the form parameters can include, for example, some or all of the following: minimum voltage unfiltered signal (MiU); maximum voltage unfiltered signal (MaU); minimum voltage filtered signal (MiF); maximum voltage filtered signal (MaF); minimum voltage slope signal (MiS); maximum voltage slope signal (MaS); timestamp minimum voltage unfiltered signal (TMiU); timestamp maximum voltage unfiltered signal (TMaU); timestamp minimum voltage filtered signal (TMiF); timestamp maximum voltage filtered signal (TMaF); timestamp minimum voltage slope signal (TMiS); timestamp maximum voltage slope signal (TMaS); and signalwidth (time between the first and the last threshold-crossing).
- FIGS. 2A and 2B show time windows of equal length resulting from a fixed number of samples following an event trigger
- the end of the time window can also be determined by other factors, such as when the signal is returned to baseline (i.e., when the P-wave or Far Field R-wave has ended). This can result in time windows of different length for different signal types.
- Digital signal processor 36 includes a form parameter forecaster in order to identify the P-wave even in those cases where the P-wave and the Far Field R-wave signals overlap in time (i.e., fall at least partially within the same event time window).
- the form parameter forecaster feature of digital signal processor 36 makes use of templates representing a P-wave signal and a Far Field R-wave signal.
- the templates may each represent a single example of a signal collected when the P-wave and the Far Field R-wave signals are not overlapping. Alternatively, they may represent an average waveform created from multiple P-wave signals or multiple Far Field R-wave signals.
- the form parameter forecaster makes use of composite waveforms created by superimposing the P-wave template and the FFRW template with different amounts of time shifting (i.e., different amounts of overlapping).
- a set of composite waveforms can be created by shifting FFRW signal 60 into the window for P-wave signal 50 one sample at a time. The shifting can start, for example, with the first sample of signal 60 overlapping with the last sample of signal 50 . The next composite waveform would then be created by overlapping the first two samples of signal 60 with the last two samples of signal 50 . The process continues with different time shifts until FFRW signal 60 has been shifted entirely through P-wave signal 50 .
- the set of composite waveforms will include a waveform representing a P-wave signal with no overlapping (i.e., the P-wave template), and a waveform representing an FFRW signal with no overlapping (i.e., the FFRW template).
- FIGS. 3A and 3B show two examples of composite waveforms created by superimposing P-wave signal 50 and FFRW signal 60 by different amounts.
- FFRW signal 60 is partially shifted into P-wave signal 50 to create composite waveform 70 .
- Time shift 74 represents the number of samples (or amount of time) between the beginning of P-wave time window 52 and the beginning of FFRW time window 62 .
- the shape of composite waveform 70 within the composite time window 72 represents a composite of P-wave signal 50 with a portion of FFRW signal 60 .
- FIG. 3B shows composite waveform 80 , which shows a situation in which FFRW signal 60 is actually shifted with respect to P-wave signal 50 so that the start of time window 82 is based upon the beginning of FFRW time window 62 rather than the beginning of P-wave time window 52 .
- Time shift 84 shown in FIG. 3B represents the delay by which P-wave signal 50 trails FFRW signal 60 within composite window 82 .
- This time shift which is referred to as the Superimposed Sense Compensation time, can be used by the form parameter forecaster to identify the location of P-wave signal 50 within composite waveform 80 .
- Digital signal processor 36 derives form parameters for each composite waveform, including the P-wave and FFRW templates that represent zero overlap. In order to identify each waveform uniquely, at least two form parameters should be used.
- FIG. 4 shows a graph of two form parameters, with each data point representing a pair of form parameters for a different composite waveform. Included in the graph of FIG. 4 are data points labeled PW and FFRW. These two data points represent the pair of form parameters derived from the templates of P-wave signal 50 and FFRW signal 60 respectively.
- the form parameter minimum voltage slope signal (MiS) is plotted along the horizontal axis.
- the form parameter minimum voltage filtered signal (MiF) is plotted along the vertical axis.
- the minimum voltage of P-wave signal 50 within time window 52 , MiF is ⁇ 10 millivolts.
- the minimum slope (i.e., the largest negative slope), MiS is about ⁇ 35. Those values correspond to data point PW in FIG. 4 .
- the minimum filtered voltage of FFRW signal 60 is about ⁇ 4 millivolts.
- the minimum slope value, MiS is about ⁇ 19.
- Digital signal processor 36 then takes the form parameters for the composite waveforms, and creates form parameter boundaries around those data points.
- boundaries 90 provide an outer limit within which form parameters of any signal including a P-wave, a Far Field R-wave, or a combination of the two should fall.
- Circle 92 represents a boundary of form parameters for events that will be classified as a P-wave only.
- circle 94 represents coordinates that will be identified as a Far Field R-wave only. For those signals that produce a set of form factors that fall within boundaries 90 , but not within circles 92 or 94 , the signal is classified as a superimposed wave. Those signals having a set of form factors outside boundaries 90 are classified as “other”.
- the difference between the timestamp of an actual P-wave signal 50 is shown in FIG. 2A and the timestamp of a superimposed event can be used to determine the time of occurrence of a P-wave when a combined event (e.g., P-wave plus Far Field R-wave) is sensed.
- a combined event e.g., P-wave plus Far Field R-wave
- the timestamp or trigger of the composite waveform will also be the same as the trigger or timestamp for the P-wave in that composite waveform.
- those situations like waveform 80 shown in FIG.
- FIG. 6 shows a graph similar to FIG. 5 , but with a Superposition Sense Compensation time value added to indicate the amount of time delay between the beginning of the signal window and occurrence of the P-wave.
- An association of boundaries and form parameter sets with Superposition Sense Compensation times can be used by digital signal processor 36 to provide the timing of the P-wave within the time window of a sensed atrial event.
- digital signal processor 36 When digital signal processor 36 senses a threshold crossing (i.e., an atrial event), it triggers the creation of a new time window.
- Form parameters are derived from the input waveform sampled during the time window, and a comparison is made between the set of form parameters for the input waveform and the boundaries defined by the sets of waveform parameters mapped by the form parameter forecaster.
- Digital signal processor 36 compares the set of waveform parameters to the boundaries and determines whether the input signal represents a P-wave, an R-wave, a composite of the two, or a waveform that does not fall into any of those categories.
- the input waveform is a composite of a P-wave and a Far Field R-wave signal
- a Superposition Sense Compensation time value (like those shown in FIG. 6 ) is associated with the input waveform based on the location within the boundaries.
- FIG. 7 shows a flow diagram illustrating a process by which composite waveforms are created and used to produce form parameter forecast boundaries.
- the process begins by producing a waveform template of a first sensed event, such as a P-wave (step 100 ), and a waveform template of a second sensed event (i.e., a Far Field R-wave) (step 102 ).
- Each sensed event represents a window that has been triggered by the crossing of a sensing threshold signaling the beginning of the sensed event.
- the template may be a single waveform, or may be the result of averaging of similar waveforms collected over a period of time.
- Each template should be representative of a window that contains only that sensed event, and not a time window in which the two events are so closely spaced that they both occur within the window.
- both waveform templates are used to calculate a superimposed or composite waveform with a particular time shift or degree of overlap.
- Form parameters are derived from the composite waveform.
- the set of form parameter values and a calculated Superposition Sense Compensation value related to the time shift are stored in memory (step 106 ).
- the creation of composite waveforms and the calculation of form parameter value sets and Superposition Sense Compensation values is repeated until all of the possible composite waveforms have been created and values have been stored.
- the stored form parameter sets and Superposition Sense Compensation values are then used to determine form parameter forecast boundaries.
- the form parameter forecast boundaries, and associated Superposition Sense Compensation values are stored in memory (step 110 ).
- FIG. 8 shows a process used for classifying incoming sensed events.
- digital signal processor 36 receives an incoming digitized waveform from analog-to-digital converter 34 , it filters the incoming signal and compares the signal to a sensing threshold. When a sensed event occurs, a window is triggered by the event to capture the input signal over a window length of, for example, 40 samples. (Step 120 ).
- the input waveform is then analyzed to derive a set of form parameters similar to the form parameters derived from the waveform templates and the composite waveforms. Based upon the form parameter set, the input waveform is classified using the form parameter forecast boundaries stored in memory (step 122 ).
- the sensed event may have form parameters that fall within the forecast boundaries and may be classified as a P-wave, a Far Field R-wave, a superimposed signal or other. In those cases where the sensed event does not fall within the form parameter forecast boundaries and is classified as “other”, further processing of the input waveform may be performed by digital signal processor 36 using other signal processing procedures.
- the input waveform is labeled with its correct class based upon the form parameter forecast boundaries. Depending upon where the parameters of the input waveform were located within the forecast boundaries, a Superposition Sense Compensation time may be used to provide a correct sensed event time for the P-wave. (Step 124 ).
- digital signal processor 36 is able to identify and distinguish P-wave signals and Far Field R-wave signals, even when the signals occur so close in time that they overlap one another and result in a distorted input signal.
- the same process can be used with other physiologic signals, and with other signal components that may overlap and thus distort a signal during a triggered event time window.
- form parameter forecaster can use more than two form parameters derived from each waveform, rather than only two as described.
- the use of a larger number of form parameters can provide greater discrimination between different waveforms based upon their morphology.
- the form parameter forecaster has been described in the context of composites of two signals of known shape. It can, however, be extended to situations involving more than two signals.
Abstract
Description
Claims (18)
Priority Applications (1)
| Application Number | Priority Date | Filing Date | Title |
|---|---|---|---|
| US11/554,778 US7738948B2 (en) | 2006-10-31 | 2006-10-31 | Form parameter forecaster for analyzing signals distorted by noise |
Applications Claiming Priority (1)
| Application Number | Priority Date | Filing Date | Title |
|---|---|---|---|
| US11/554,778 US7738948B2 (en) | 2006-10-31 | 2006-10-31 | Form parameter forecaster for analyzing signals distorted by noise |
Publications (2)
| Publication Number | Publication Date |
|---|---|
| US20080103401A1 US20080103401A1 (en) | 2008-05-01 |
| US7738948B2 true US7738948B2 (en) | 2010-06-15 |
Family
ID=39331178
Family Applications (1)
| Application Number | Title | Priority Date | Filing Date |
|---|---|---|---|
| US11/554,778 Active 2027-09-19 US7738948B2 (en) | 2006-10-31 | 2006-10-31 | Form parameter forecaster for analyzing signals distorted by noise |
Country Status (1)
| Country | Link |
|---|---|
| US (1) | US7738948B2 (en) |
Cited By (12)
| Publication number | Priority date | Publication date | Assignee | Title |
|---|---|---|---|---|
| US9126055B2 (en) | 2012-04-20 | 2015-09-08 | Cardiac Science Corporation | AED faster time to shock method and device |
| US9398883B2 (en) | 2011-05-02 | 2016-07-26 | The Regents Of The University Of California | System and method for reconstructing cardiac activation information |
| US9468387B2 (en) | 2011-05-02 | 2016-10-18 | The Regents Of The University Of California | System and method for reconstructing cardiac activation information |
| US9549684B2 (en) | 2010-04-08 | 2017-01-24 | The Regents Of The University Of California | System and method for reconstructing cardiac signals associated with a complex rhythm disorder |
| US9655535B2 (en) | 2011-05-02 | 2017-05-23 | The Regents Of The University Of California | System and method for targeting heart rhythm disorders using shaped ablation |
| US9668666B2 (en) | 2011-05-02 | 2017-06-06 | The Regents Of The University Of California | System and method for reconstructing cardiac activation information |
| US9724009B2 (en) | 2011-12-09 | 2017-08-08 | The Regents Of The University Of California | System and method of identifying sources for biological rhythms |
| US9955879B2 (en) | 2008-10-09 | 2018-05-01 | The Regents Of The University Of California | System for analysis of complex rhythm disorders |
| US10085655B2 (en) | 2013-03-15 | 2018-10-02 | The Regents Of The University Of California | System and method to define drivers of sources associated with biological rhythm disorders |
| US10136860B2 (en) | 2008-05-13 | 2018-11-27 | The Regents Of The University Of California | System for detecting and treating heart instability |
| US10398326B2 (en) | 2013-03-15 | 2019-09-03 | The Regents Of The University Of California | System and method of identifying sources associated with biological rhythm disorders |
| US10434319B2 (en) | 2009-10-09 | 2019-10-08 | The Regents Of The University Of California | System and method of identifying sources associated with biological rhythm disorders |
Citations (18)
| Publication number | Priority date | Publication date | Assignee | Title |
|---|---|---|---|---|
| US5284152A (en) | 1992-02-28 | 1994-02-08 | Hewlett-Packard Company | Method for displaying superimposed heartbeat waveforms |
| US5379776A (en) | 1993-04-01 | 1995-01-10 | Telectronics Pacing Systems, Inc. | Heart rhythm classification method, and implantable dual chamber cardioverter/defibrillator employing the same |
| US5400795A (en) | 1993-10-22 | 1995-03-28 | Telectronics Pacing Systems, Inc. | Method of classifying heart rhythms by analyzing several morphology defining metrics derived for a patient's QRS complex |
| US5439483A (en) | 1993-10-21 | 1995-08-08 | Ventritex, Inc. | Method of quantifying cardiac fibrillation using wavelet transform |
| US5549647A (en) | 1994-10-04 | 1996-08-27 | Vitatron Medical, B.V. | Pacemaker with improved far field R wave sensing and suppression |
| US5755739A (en) * | 1996-12-04 | 1998-05-26 | Medtronic, Inc. | Adaptive and morphological system for discriminating P-waves and R-waves inside the human body |
| US5999853A (en) | 1998-03-02 | 1999-12-07 | Vitatron Medical, B.V. | Dual chamber pacemaker with single pass lead and with bipolar and unipolar signal processing capability |
| US6029087A (en) * | 1998-09-22 | 2000-02-22 | Vitatron Medical, B.V. | Cardiac pacing system with improved physiological event classification based on DSP |
| US6212428B1 (en) | 1998-06-17 | 2001-04-03 | Cardiac Pacemakers, Inc. | Multiple stage morphology-based system detecting ventricular tachycardia and supraventricular tachycardia |
| US6266554B1 (en) | 1999-02-12 | 2001-07-24 | Cardiac Pacemakers, Inc. | System and method for classifying cardiac complexes |
| US20020032469A1 (en) | 1999-03-12 | 2002-03-14 | Cardiac Pacemakers, Inc. | Discrimination of supraventricular tachycardia and ventricular tachycardia events |
| US20030050563A1 (en) * | 2001-09-13 | 2003-03-13 | Suribhotla Rajasekhar V. | Multiple templates for filtering of far field R-waves |
| US20030060849A1 (en) | 1999-07-14 | 2003-03-27 | Cardiac Pacemakers, Inc. | Classification of supraventricular and ventricular cardiac rhythms using cross channel timing algorithm |
| US6556859B1 (en) | 2000-04-24 | 2003-04-29 | Medtronic, Inc. | System and method for classifying sensed atrial events in a cardiac pacing system |
| US6654637B2 (en) | 2001-04-30 | 2003-11-25 | Medtronic, Inc. | Method and system for ventricular fusion prevention |
| US6901291B2 (en) | 2000-12-04 | 2005-05-31 | Medtronic, Inc. | Distinguishing valid and invalid cardiac senses |
| US7076289B2 (en) | 2002-12-04 | 2006-07-11 | Medtronic, Inc. | Methods and apparatus for discriminating polymorphic tachyarrhythmias from monomorphic tachyarrhythmias facilitating detection of fibrillation |
| US20060161069A1 (en) | 2005-01-20 | 2006-07-20 | Cardiac Pacemakers, Inc. | Methods and apparatuses for cardiac arrhythmia classification using morphology stability |
-
2006
- 2006-10-31 US US11/554,778 patent/US7738948B2/en active Active
Patent Citations (20)
| Publication number | Priority date | Publication date | Assignee | Title |
|---|---|---|---|---|
| US5284152A (en) | 1992-02-28 | 1994-02-08 | Hewlett-Packard Company | Method for displaying superimposed heartbeat waveforms |
| US5379776A (en) | 1993-04-01 | 1995-01-10 | Telectronics Pacing Systems, Inc. | Heart rhythm classification method, and implantable dual chamber cardioverter/defibrillator employing the same |
| US5439483A (en) | 1993-10-21 | 1995-08-08 | Ventritex, Inc. | Method of quantifying cardiac fibrillation using wavelet transform |
| US5400795A (en) | 1993-10-22 | 1995-03-28 | Telectronics Pacing Systems, Inc. | Method of classifying heart rhythms by analyzing several morphology defining metrics derived for a patient's QRS complex |
| US5549647A (en) | 1994-10-04 | 1996-08-27 | Vitatron Medical, B.V. | Pacemaker with improved far field R wave sensing and suppression |
| US5755739A (en) * | 1996-12-04 | 1998-05-26 | Medtronic, Inc. | Adaptive and morphological system for discriminating P-waves and R-waves inside the human body |
| US5999853A (en) | 1998-03-02 | 1999-12-07 | Vitatron Medical, B.V. | Dual chamber pacemaker with single pass lead and with bipolar and unipolar signal processing capability |
| US6275732B1 (en) | 1998-06-17 | 2001-08-14 | Cardiac Pacemakers, Inc. | Multiple stage morphology-based system detecting ventricular tachycardia and supraventricular tachycardia |
| US6212428B1 (en) | 1998-06-17 | 2001-04-03 | Cardiac Pacemakers, Inc. | Multiple stage morphology-based system detecting ventricular tachycardia and supraventricular tachycardia |
| US6029087A (en) * | 1998-09-22 | 2000-02-22 | Vitatron Medical, B.V. | Cardiac pacing system with improved physiological event classification based on DSP |
| US6266554B1 (en) | 1999-02-12 | 2001-07-24 | Cardiac Pacemakers, Inc. | System and method for classifying cardiac complexes |
| US20020019593A1 (en) | 1999-02-12 | 2002-02-14 | Cardiac Pacemakers, Inc. | System and method for classifying cardiac complexes |
| US20020032469A1 (en) | 1999-03-12 | 2002-03-14 | Cardiac Pacemakers, Inc. | Discrimination of supraventricular tachycardia and ventricular tachycardia events |
| US20030060849A1 (en) | 1999-07-14 | 2003-03-27 | Cardiac Pacemakers, Inc. | Classification of supraventricular and ventricular cardiac rhythms using cross channel timing algorithm |
| US6556859B1 (en) | 2000-04-24 | 2003-04-29 | Medtronic, Inc. | System and method for classifying sensed atrial events in a cardiac pacing system |
| US6901291B2 (en) | 2000-12-04 | 2005-05-31 | Medtronic, Inc. | Distinguishing valid and invalid cardiac senses |
| US6654637B2 (en) | 2001-04-30 | 2003-11-25 | Medtronic, Inc. | Method and system for ventricular fusion prevention |
| US20030050563A1 (en) * | 2001-09-13 | 2003-03-13 | Suribhotla Rajasekhar V. | Multiple templates for filtering of far field R-waves |
| US7076289B2 (en) | 2002-12-04 | 2006-07-11 | Medtronic, Inc. | Methods and apparatus for discriminating polymorphic tachyarrhythmias from monomorphic tachyarrhythmias facilitating detection of fibrillation |
| US20060161069A1 (en) | 2005-01-20 | 2006-07-20 | Cardiac Pacemakers, Inc. | Methods and apparatuses for cardiac arrhythmia classification using morphology stability |
Cited By (24)
| Publication number | Priority date | Publication date | Assignee | Title |
|---|---|---|---|---|
| US10136860B2 (en) | 2008-05-13 | 2018-11-27 | The Regents Of The University Of California | System for detecting and treating heart instability |
| US9955879B2 (en) | 2008-10-09 | 2018-05-01 | The Regents Of The University Of California | System for analysis of complex rhythm disorders |
| US11147462B2 (en) | 2008-10-09 | 2021-10-19 | The Regents Of The University Of California | Method for analysis of complex rhythm disorders |
| US10092196B2 (en) | 2008-10-09 | 2018-10-09 | The Regents Of The University Of California | Method for analysis of complex rhythm disorders |
| US10434319B2 (en) | 2009-10-09 | 2019-10-08 | The Regents Of The University Of California | System and method of identifying sources associated with biological rhythm disorders |
| US9717436B2 (en) | 2010-04-08 | 2017-08-01 | The Regents Of The University Of California | Method and system for detection of biological rhythm disorders |
| US10856760B2 (en) | 2010-04-08 | 2020-12-08 | The Regents Of The University Of California | Method and system for detection of biological rhythm disorders |
| US9549684B2 (en) | 2010-04-08 | 2017-01-24 | The Regents Of The University Of California | System and method for reconstructing cardiac signals associated with a complex rhythm disorder |
| US10271786B2 (en) | 2011-05-02 | 2019-04-30 | The Regents Of The University Of California | System and method for reconstructing cardiac activation information |
| US9398883B2 (en) | 2011-05-02 | 2016-07-26 | The Regents Of The University Of California | System and method for reconstructing cardiac activation information |
| US9913615B2 (en) | 2011-05-02 | 2018-03-13 | The Regents Of The University Of California | System and method for reconstructing cardiac activation information |
| US9668666B2 (en) | 2011-05-02 | 2017-06-06 | The Regents Of The University Of California | System and method for reconstructing cardiac activation information |
| US10485438B2 (en) | 2011-05-02 | 2019-11-26 | The Regents Of The University Of California | System and method for targeting heart rhythm disorders using shaped ablation |
| US9655535B2 (en) | 2011-05-02 | 2017-05-23 | The Regents Of The University Of California | System and method for targeting heart rhythm disorders using shaped ablation |
| US9468387B2 (en) | 2011-05-02 | 2016-10-18 | The Regents Of The University Of California | System and method for reconstructing cardiac activation information |
| US10149622B2 (en) | 2011-05-02 | 2018-12-11 | The Regents Of The University Of California | System and method for reconstructing cardiac activation information |
| US10058262B2 (en) | 2011-12-09 | 2018-08-28 | The Regents Of The University Of California | System and method of identifying sources for biological rhythms |
| US9724009B2 (en) | 2011-12-09 | 2017-08-08 | The Regents Of The University Of California | System and method of identifying sources for biological rhythms |
| US9126055B2 (en) | 2012-04-20 | 2015-09-08 | Cardiac Science Corporation | AED faster time to shock method and device |
| US10271744B2 (en) | 2013-03-15 | 2019-04-30 | The Regents Of The University Of California | System and method to identify sources associated with biological rhythm disorders |
| US10398326B2 (en) | 2013-03-15 | 2019-09-03 | The Regents Of The University Of California | System and method of identifying sources associated with biological rhythm disorders |
| US10098560B2 (en) | 2013-03-15 | 2018-10-16 | The Regents Of The University Of California | System and method to identify sources associated with biological rhythm disorders |
| US10085655B2 (en) | 2013-03-15 | 2018-10-02 | The Regents Of The University Of California | System and method to define drivers of sources associated with biological rhythm disorders |
| US11446506B2 (en) | 2013-03-15 | 2022-09-20 | The Regents Of The University Of California | System and method of identifying sources associated with biological rhythm disorders |
Also Published As
| Publication number | Publication date |
|---|---|
| US20080103401A1 (en) | 2008-05-01 |
Similar Documents
| Publication | Publication Date | Title |
|---|---|---|
| US7738948B2 (en) | Form parameter forecaster for analyzing signals distorted by noise | |
| US6029087A (en) | Cardiac pacing system with improved physiological event classification based on DSP | |
| CN108883279B (en) | Confidence of arrhythmia detection | |
| US9451893B2 (en) | Calculation of self-correlation in an implantable cardiac device | |
| US6470210B1 (en) | System and method for continuously monitoring classified atrial arrhythmias | |
| US8428697B2 (en) | “Blurred template” approach for arrhythmia detection | |
| JP4657202B2 (en) | Physiological event detector and method thereof | |
| US20120289845A1 (en) | Techniques for determining morphological stability of cardiac cycles | |
| JP2003527143A (en) | Pacemaker using DSP with improved event type determination function and monitor function | |
| US20050004612A1 (en) | Form analysis to detect evoked response | |
| US8340768B2 (en) | Sensing threshold control to limit amplitude tracking | |
| US20150105681A1 (en) | Active medical device, including an implantable defibrillator, for detection of qrs complexes in a very noisy signal | |
| US5623936A (en) | Implantable medical device having means for discriminating between true R-waves and ventricular fibrillation | |
| US8521267B1 (en) | Methods and systems for trending ST segment changes over time | |
| US20050071303A1 (en) | Apparatus for the classification of physiological events | |
| US8255047B1 (en) | Cardiac pacing system with improved physiological event classification and heart monitoring based on DSP | |
| US20020183640A1 (en) | Cardiac stimulating device with morphology sensitive detection and method for automatically creating a morphology template | |
| Padeletti et al. | Digital technology for cardiac pacing | |
| US11577084B2 (en) | Method and device for managing biological activity data storage utilizing lossy compression | |
| Helfenbein et al. | A software-based pacemaker pulse detection and paced rhythm classification algorithm | |
| CN111407233B (en) | Method for solving T wave over-perception by combining heart sound and medical equipment | |
| US8560056B1 (en) | Intracardiac device and method for storing cardiac test results and associated EGM data | |
| Tukkie | What Are the Benefits of Morphological Signal Analysis Using Digital Technology? |
Legal Events
| Date | Code | Title | Description |
|---|---|---|---|
| AS | Assignment |
Owner name: MEDTRONIC, INC., MINNESOTA Free format text: ASSIGNMENT OF ASSIGNORS INTEREST;ASSIGNORS:ROUW, MATTIAS;SCHOLTEN, PATRICK;DE BRUYN, HENRICUS W.M.;REEL/FRAME:018850/0897 Effective date: 20070119 Owner name: MEDTRONIC, INC.,MINNESOTA Free format text: ASSIGNMENT OF ASSIGNORS INTEREST;ASSIGNORS:ROUW, MATTIAS;SCHOLTEN, PATRICK;DE BRUYN, HENRICUS W.M.;REEL/FRAME:018850/0897 Effective date: 20070119 |
|
| FEPP | Fee payment procedure |
Free format text: PAYOR NUMBER ASSIGNED (ORIGINAL EVENT CODE: ASPN); ENTITY STATUS OF PATENT OWNER: LARGE ENTITY |
|
| STCF | Information on status: patent grant |
Free format text: PATENTED CASE |
|
| FPAY | Fee payment |
Year of fee payment: 4 |
|
| MAFP | Maintenance fee payment |
Free format text: PAYMENT OF MAINTENANCE FEE, 8TH YEAR, LARGE ENTITY (ORIGINAL EVENT CODE: M1552) Year of fee payment: 8 |
|
| MAFP | Maintenance fee payment |
Free format text: PAYMENT OF MAINTENANCE FEE, 12TH YEAR, LARGE ENTITY (ORIGINAL EVENT CODE: M1553); ENTITY STATUS OF PATENT OWNER: LARGE ENTITY Year of fee payment: 12 |