US7765125B1 - Trunk branch repeated transaction index for property valuation - Google Patents
Trunk branch repeated transaction index for property valuation Download PDFInfo
- Publication number
- US7765125B1 US7765125B1 US11/033,979 US3397905A US7765125B1 US 7765125 B1 US7765125 B1 US 7765125B1 US 3397905 A US3397905 A US 3397905A US 7765125 B1 US7765125 B1 US 7765125B1
- Authority
- US
- United States
- Prior art keywords
- transaction records
- transaction
- records
- questioned
- bias
- Prior art date
- Legal status (The legal status is an assumption and is not a legal conclusion. Google has not performed a legal analysis and makes no representation as to the accuracy of the status listed.)
- Active, expires
Links
Images


Classifications
-
- G—PHYSICS
- G06—COMPUTING; CALCULATING OR COUNTING
- G06Q—INFORMATION AND COMMUNICATION TECHNOLOGY [ICT] SPECIALLY ADAPTED FOR ADMINISTRATIVE, COMMERCIAL, FINANCIAL, MANAGERIAL OR SUPERVISORY PURPOSES; SYSTEMS OR METHODS SPECIALLY ADAPTED FOR ADMINISTRATIVE, COMMERCIAL, FINANCIAL, MANAGERIAL OR SUPERVISORY PURPOSES, NOT OTHERWISE PROVIDED FOR
- G06Q30/00—Commerce
-
- G—PHYSICS
- G06—COMPUTING; CALCULATING OR COUNTING
- G06Q—INFORMATION AND COMMUNICATION TECHNOLOGY [ICT] SPECIALLY ADAPTED FOR ADMINISTRATIVE, COMMERCIAL, FINANCIAL, MANAGERIAL OR SUPERVISORY PURPOSES; SYSTEMS OR METHODS SPECIALLY ADAPTED FOR ADMINISTRATIVE, COMMERCIAL, FINANCIAL, MANAGERIAL OR SUPERVISORY PURPOSES, NOT OTHERWISE PROVIDED FOR
- G06Q20/00—Payment architectures, schemes or protocols
- G06Q20/08—Payment architectures
- G06Q20/20—Point-of-sale [POS] network systems
- G06Q20/201—Price look-up processing, e.g. updating
Definitions
- This invention relates generally to property valuation and more particularly to processing transaction data in conjunction with the estimation and application of house price indices (HPI) in marking-to-market predictions.
- HPI house price indices
- a house price index measures the average price appreciation of residential properties in a properly defined housing market. Once it is estimated, the HPI for a market can be used to predict the value of any property located in that market, provided the property had a prior transaction. The predicted value is derived using a previous transaction for that property and the overall market appreciation implied by the market HPI. This value prediction via the estimation and the application of HPI may be called marking-to-market (MTM).
- MTM marking-to-market
- the repeated transaction index (RTI) model is a commonly recognized method for estimating HPIs. This method was proposed by Bailey et al. (1963) and popularized by the seminal work of Case and Schiller (1989) (“Case-Shiller”).
- the RTI model which may also be referred to as a repeat sales model, regresses the log difference between the two transacted values of a same address on time dummies.
- the estimated parameters of the RTI model represent a house price index that may be a piecewise constant function of time, wherein each basic time interval (usually a calendar quarter) is deemed to have the same house price level.
- the RTI model may also be variously modified. For example, one might want to consider the HPI as a non-parametric and continuous function of time.
- aggregation bias One source of such systematic bias can be termed as aggregation bias. Because of the lack of sufficient transaction data for each local housing market, it becomes a necessity to define a very large area as one single housing market. A large geographic area may include numerous heterogeneous local neighborhoods that may differ greatly in housing price dynamics. Forcing all these neighborhoods to share the same HPI creates an aggregation bias.
- One way to circumvent the aggregation bias is to seek other data sources so that one can estimate separate HPIs for smaller and more homogeneous markets.
- some home price estimation uses data on mortgage transactions as well as on publicly recorded deed transactions, because associated with each mortgage loan transaction there is typically a valuation of the underlying collateral.
- Mortgage transactions can be classified into loans for purchases and loans for refinances.
- Using data on refinance transactions creates another source of systematic bias embedded in different transaction types.
- the best property transaction data are believed to be records of arm's length purchase transactions, wherein the transaction price reflects the results of negotiation between a buyer and a seller. It has been recognized that different loan types or segments imply different degrees of valuation bias. It is believed that valuation bias is a function of loan purpose, loan-to-value ratio, and other factors. This is referred to as transaction type bias.
- OFHEO Federal Housing Enterprise Oversight
- GSE Government Sponsored Entities
- idiosyncratic error Even for a purchase transaction, the recorded transaction value in the data does not always reflect the true market value for the underlying property at a given point of time.
- the source of this idiosyncratic error stems from (1) recording error (e.g., missing a decimal point, a mismatch for the address name or the unit number, etc.); (2) market inefficiency; and (3) outright fraudulent transaction.
- duplicate records may exist for various resources. For example one typically obtains property transaction data from several sources, which may each provide a record for a given transaction.
- Another problem with property valuation relates to marking-to-market, namely, how to use prior transactions and estimated HPIs to predict current property values.
- marking-to-market a property value by using a prior sale value and the estimated local HPI to derive the current value for a given property. If there is more than one prior transaction for the same property, one has to decide which prior transaction to use for predicting the current price of the property. There are different thoughts as to which prior transaction to choose. Being mindful of the embedded transaction type bias, one school of thought advocates using only prior purchase transactions to mark-to-market. This approach sacrifices in coverage, as there are properties whose only prior transactions are non-purchase transactions. However, if there are non-purchase transactions that are significantly more recent than the purchase transaction, a practitioner might prefer to use the non-purchase transaction. Each existing practice thus has significant drawbacks.
- the present invention provides various different aspects that may be independently practiced, or practiced together, such as components in a property valuation system.
- the present invention provides an RTI for HPI estimation that controls for systematic bias.
- This may be referred to as Trunk-Branch RTI (TB-RTI).
- TB-RTI particularly controls both aggregation bias and transaction type bias. It initially uses trusted (e.g., purchase) transaction records for HPI estimation for large areas where transaction data are deemed sufficient to support viable HPI estimation. It then removes the bias from individual records, particularly but not necessarily limited to questioned (e.g., non-purchase) transaction records. Finally, it then uses all available data for HPI estimation for smaller areas (e.g., zip codes, neighborhoods, etc.) once the biases in the data are corrected.
- trusted e.g., purchase
- questioned e.g., non-purchase
- the present invention provides data cleaning that mitigates idiosyncratic errors.
- data cleaning helps to ensure that the most accurate record is retained for a transaction. This is preferably accommodated by ensuring that the retained record is the most consistent with other transactions of the same property, the local market trend, and neighborhood market. Additionally, algorithms accommodate the adoption of a value as a representative single record for a transaction where multiple records are present for a transaction. Following duplicate removal, data cleaning further eliminates erroneous records by eliminating transaction outliers. This is preferably also based upon the local market trend, along with all of the remaining transactions for each given property.
- the present invention provides property valuation that uses multiple transactions in predicting a value for a property. This may be referred to as Multiple-Transaction Based Property Valuation (MTV). Instead of choosing only one prior transaction, MTV uses multiple transactions for a given property to provide a more accurate mark-to-market value. Preferably, a weighted combination of mark-to-market values provided by an HPI and individual ones of the multiple transaction records provide a predicted value for the given property. Weighting factors recency and transaction type to correct for both sources of potential inaccuracy.
- MTV Multiple-Transaction Based Property Valuation
- the present invention provides a system that includes elements that perform data cleaning with idiosyncratic error control, HPI estimation with systematic bias control, and property value prediction that uses multiple transactions.
- the present invention can be embodied in various forms, including business processes, computer implemented methods, computer program products, computer systems and networks, user interfaces, application programming interfaces, and the like.
- FIG. 1 is a block diagram illustrating an embodiment of a computer system that includes property value estimation with bias correction.
- FIG. 2 is a block diagram illustrating an embodiment of a property value estimation application.
- FIGS. 3A-B are flow diagrams illustrating an embodiment of a process for property value estimation with transaction bias correction.
- FIG. 4 is a schematic diagram illustrating components of a valuation bias matrix.
- FIG. 5 is a block diagram illustrating an embodiment of a property value estimation application that includes multiple transaction based property valuation and data cleaning.
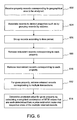
- FIG. 6 is a flow diagram illustrating an embodiment of a process for multiple transaction based property valuation.
- FIG. 7 is a graphical diagram schematically illustrating redundant record removal in conjunction with data cleaning.
- FIG. 8 is a graphical diagram schematically illustrating inconsistent record removal in conjunction with data cleaning.
- FIG. 9 is a graphical diagram schematically illustrating an example of weighting in multiple transaction based property valuation.
- FIG. 10 is a schematic diagram illustrating a system that includes data cleaning, HPI estimation with systematic bias control, and property value prediction that uses multiple prior transactions.
- FIG. 1 is a block diagram illustrating an embodiment of a computer system 100 including a property value estimation module 150 in accordance with the present invention.
- the computer system 100 may be a conventional desktop computer, a network computer, a handheld portable computer (e.g., PDA, cell phone) or any of various execution environments which will be readily apparent to the artisan and need not be named herein.
- the property value estimation module 150 runs on a conventional operating system in memory 130 and carries out the described functionality by execution of computer instructions. Operating systems may include but are not limited to Windows, Unix, Linux and Macintosh. The computer system may further implement applications that facilitate calculation including but not limited to MATLAB. The artisan will readily recognize the various alternative programming languages and execution platforms that are and will become available, and the present invention is not limited to any specific execution environment.
- the property value estimation module 150 is preferably provided as software, it may alternatively be hardware, firmware, or any combination of software, hardware and firmware.
- a computer system includes the property value estimation module 150 resident in memory 130 on a conventional computer system, with the property value estimation module 150 including instructions that are executed by a processor 120 .
- Alternative embodiments include an article of manufacture wherein the instructions are stored on a computer readable storage medium.
- the medium may be of any type, including but not limited to magnetic storage media (e.g., floppy disks, hard disks), optical storage media (e.g., CD, DVD), and others.
- Still other embodiments include computer implemented processes described in connection with the property value estimation module 150 as well as the corresponding flow diagrams.
- the property value estimation module 150 accommodates estimation of property values in situations where the dataset is insufficient to support home price index estimation using data solely originating from purchase transactions. This aspect is described further below, and in connection with the description of FIGS. 2-4 .
- the property value estimation module 150 implements multiple transaction based property valuation, wherein multiple transactions are used in connection with a repeat sales based home price estimation index to predict property prices. This aspect is primarily described in connection with FIGS. 5-9 .
- Property value estimation according to the first aspect is described as follows.
- the data is segregated into purchase transactions and non-purchase transactions.
- a repeat sales model is applied using the purchase transactions data to provide a base property price index.
- the base property price index may be referred to as the “Trunk” HPI.
- the base property price index is used to calibrate the median bias for non-purchase transactions, for each questionable loan segment, for each relatively large geographical area, and for each time period. This is accommodated by determining a property level bias corresponding to each non-purchase transaction value, grouping the determined property level biases, and determining the median bias for each group.
- the determined biases are then used to adjust the non-purchase transaction data.
- the adjustment is made according to which groups the corresponding property belongs. More specifically, the property corresponding to a non-purchase transaction value is within a given large geographical area, and the non-purchase transaction is of a particular loan segment type and from a particular time period.
- the non-purchase transaction value is thus adjusted because of its membership in these groups, based upon the median bias attributed to such groups in the previous step.
- Each value in the non-purchase transaction data is adjusted accordingly. This may also be referred to as treating the data for the determined biases.
- the bias treated data and the purchase data provide adjusted transaction data.
- a repeat sales model is then applied to the adjusted transaction data to provide a localized property price estimation index. That index is then used to predict the value for a given property in the small geographical unit.
- the localized index may be referred to as a “Branch” HPI.
- FIG. 2 is a block diagram illustrating an embodiment of a property value estimation application 200 in accordance with the present invention.
- this embodiment may implement any execution environment which is or may become available, including but not limited to a computer workstation containing a processor that executes instructions stored in memory.
- a computer workstation containing a processor that executes instructions stored in memory.
- one modular breakdown 202 - 210 is described, such is provided by way of example only, as the functionality of the property value estimation application 200 may be provided in any number of alternative designs having greater or fewer component modules.
- the property value estimation application 200 includes a property transactions database 202 , an RTI module 204 , a property level bias determination module 206 , a bias grouping and correction module 208 , and a value prediction module 210 .
- the property transactions database 202 includes data from transactions of various types. Conventional data management techniques may be used to organize the data. The information may be organized at a property specific level, with associated characteristics. These characteristics include the value of the property, the transaction type from which the value was established, the date or time period, and property location information. The data may come from one or more of various sources, including but not limited to a GSE database of information concerning acquired loans, data exchanges between GSEs, and data provided by data aggregators.
- the property transactions database 202 may be used to manage data as it is treated to correct for bias, as described further below. This may be accommodated by providing additional fields in association with the above described property level records, or by updating existing fields.
- the RTI module 204 accommodates the determination of property price indices.
- the RTI module 204 implements a repeat sales model to determine such indices.
- repeat sales methods of estimation use property values taken at periods or points in time and use such values to estimate a price index.
- the RTI module 204 may implement any available model to estimates home price indices, including but not limited to the previously introduced Bailey et al. and Case-Shiller implementations.
- the property level bias determination module 206 determines a property level bias by examining values in the data and determining the difference between such values and the values that are predicted based upon trusted values such as those from purchase transactions. To do this, the property level bias determination module 206 operates in conjunction with the property transaction database 202 and the RTI module 204 .
- a base (Trunk) HPI is determined, preferably using purchase transactions, and preferably corresponding to a relatively large geographical unit to ensure that there is sufficient data to produce a viable index.
- values originating from other transactions types are accessed and a property level bias is determined. This is done by obtaining a non-purchase transaction value corresponding to a particular property at a given time period, and then using the Trunk HPI to determine the predicted value for the particular property at the given time period, and comparing that value to the value provided by the non-purchase transaction. This process is repeated by the property level bias determination module 206 for each of the various properties in the relevant geographical area.
- the bias grouping and correction module 208 receives this information and then groups the determined property level biases by predetermined characteristics, and determines correction factors that are applicable at the group level.
- One example of a group correction factor is a median bias for the non-purchase transaction values, for properties having a particular group characteristic.
- groups are transaction type (which may also be referred to as loan segment), geographical area, and time period. Once a group correction factor is known, it can be applied to individual values within each particular group. In other words, non-purchase transaction values are corrected according to the median biases for the groups (type, area, period) to which each value belongs. Each value in the non-purchase transaction data is adjusted accordingly, to provide a set of treated transaction data.
- the grouping and correction of data is described further with reference to the flow diagrams of FIGS. 3A-B below.
- the property transactions database 202 is thus updated to include the purchase transaction data along with the treated non-purchase transaction data. Collectively this data may be referred to as the adjusted transactions data.
- the adjusted transactions data is sufficient to generate HPIs respectively corresponding to relatively smaller geographical areas that fall within the large geographical area. These HPIs may be referred to as localized or “Branch” HPIs. Any conventional repeat sales model may be used to generate the localized HPIs, again as provided by the RTI module 204 .
- the value prediction module 210 communicates with the RTI module 204 to access the relevant localized HPI for a particular property being evaluated. It determines the MTM value in the usual fashion, based upon the localized HPI and a transaction value corresponding to the particular property.
- FIGS. 3A-B are flow diagrams illustrating an embodiment of a computer implemented process 300 for property value estimation with transaction bias correction in accordance with the present invention, and further describe the functionality of the property value estimation application ( 200 , FIG. 2 ).
- records corresponding to numerous properties are received 302 and segregated according to the transaction type from which they originated, preferably according to purchase and non-purchase transaction types as described. Also as described, characteristics such as the applicable time period and location for the property are associated with each property value.
- a repeat transaction model is then applied 304 to the purchase transaction data.
- the repeat sales model is applied to provide a base price estimation index (“Trunk HPI”).
- the Trunk HPI is then used to calibrate bias correction. Preferably this is done by determining biases for individual properties (i.e., determining a property level bias), and then using the determined biases to calculate group level bias correction factors.
- the group correction factor is a central tendency such as median bias, for groups defined according to loan segment, large geographical unit, and time period. An example of determining this information is described further below in connection with the description of the valuation bias matrix (VBM).
- An initial phase of calibration of the median bias is the determination of the property level bias, which is described in connection with process steps 306 - 314 .
- a value from a non-purchase transaction is retrieved 306 from a given time period, as is a purchase transaction value from a different period.
- the Trunk HPI is then applied 308 to the trusted value, to determine a predicted value for the property in question at the given time period.
- This predicted value is then compared to the non-purchase transaction value to determine 310 , with the difference indicating the bias.
- the determined bias corresponds to an individual property and thus is referred to as a property level bias.
- all of the non-purchase transaction values are analyzed by proceeding 314 through each property for which non-purchase transaction values are available. The process continues until it is determined 312 that there are no additional properties.
- the property level biases are then grouped 316 according to defined characteristics.
- the groups are transaction type, time period and geographical units.
- the property level bias corresponding to each of the above described values that originated from refinance transactions may be retrieved as a set of data.
- the group bias correction factor is then determined 318 for each group.
- a group bias correction factor is a median bias. From the values in the retrieved set of data for each group, the median bias is easily determined according to standard mathematical techniques.
- the non-purchase transaction data is then treated 320 for bias by applying the group bias correction factor(s) appropriate for each value.
- the treated data and the purchase transaction data collectively provide adjusted transaction data that includes enough data to support the generation of viable localized HPIs, with correction for the various biases built in by the data treatment prior to generating such HPIs.
- This is done by applying 322 a repeat transaction model to the adjusted transaction data pertaining to a subset of a large geographic area to provide a localized HPI for that area.
- the area may be a relatively small geographical unit such as a particular ZIP code.
- any conventional model may be applied to the adjusted transactions data to provide the localized HPIs.
- FIG. 4 is a schematic diagram illustrating components of a VBM 400.
- the VBM 400 may be used to determine and apply the above described bias correction factors.
- the axes of the VBM 400 include area ( 402 ), period ( 404 ) and type ( 406 ).
- Equation 1 An example of a traditional RTI model specification that may be implemented is provided as Equation 1 below. Specifically, let P i t and P i s be the two repeated transaction prices for property i observed at two different time periods, t and s, assuming s precedes t.
- the estimated parameters of the RTI model represent HPIs that are piecewise constant functions of time. Each basic time interval (usually a calendar quarter) is deemed to have the same house price level.
- FGLS Feasible Generalized Least Square
- OLS Running Ordinary Lease Squares
- the RTI model is used to determine the base “Trunk” HPI corresponding to each relevant large geographical area (e.g., census areas and/or MSAs), using only the purchase transaction data.
- the Trunk HPI and all of the transaction data are then used to compute the VBM 400 for each large geographical area.
- the VBM 400 is used to treat the raw data corresponding to all of the transactions.
- the treated data is then used to estimate the localized, Branch HPI for relatively small (compared to the large geographical areas) local markets, such as counties or zip codes.
- the VBM 400 is calibrated using such transactions as benchmarks. It is also assumed that for the non-purchase transactions, the magnitude of valuation bias varies over region, time period and transaction type. Accordingly, the VBM 400 is three dimensional, with the valuation bias calibrated for each time period, each area, and each transaction type.
- the VBM 400 may be arranged as the practitioner desires. For example, it may be limited to two types—purchase transactions or non-purchase transactions. Some data may be excluded from the overall data so that certain non-purchase transactions will be excluded while others will be included in the original set of data. For example, the practitioner may want to omit cash-out refinances alltogether.
- the VBM 400 may also include three (or more) types, such as (1) “purchase”, (2) “cash-out refinance”, and (3) “rate/term refinance”.
- a practitioner is free to choose how to define transaction types, based upon the richness of his/her data and on the desired granularity of the analysis. For example, when working with mortgage refinance data, one might define a transaction type as the interaction between refinance purpose and LTV buckets.
- the VBM 400 is arranged to determine and calibrate bias correction factors as follows. If there are a total of I periods, J areas, and K types, the whole VBM has I*J*K elements.
- the localized or Branch HPIs are then estimated using the pre-treated data ⁇ tilde over (P) ⁇ t .
- the mark-to-market process will bring the house prices of previous transactions to the current period, denoted by T.
- This embodiment of the present invention thus provides increased coverage and increased accuracy in MTM value prediction.
- the coverage measures the percentage of the houses that one can value for a set of addresses randomly given by a customer.
- this aspect of the present invention uses both purchase and non-purchase transactions to estimate HPIs that are used to predict property values. Among other things, this provides increased coverage because it allows more data to be used.
- this aspect of the present invention controls and corrects the embedded valuation bias. Therefore, it produces improved local market HPIs and predicts the house prices with increased accuracy.
- the present invention provides data cleaning that mitigates idiosyncratic errors.
- data cleaning helps to ensure that the most accurate record is retained for a transaction. This is preferably accommodated by ensuring that the retained record is the most consistent with other transactions of the same property, the local market trend, and neighborhood market. Additionally, algorithms accommodate the adoption of a value as a representative single record for a transaction where multiple records are present for a transaction. Following duplicate removal, data cleaning further eliminates erroneous records by eliminating transaction outliers. This is preferably also based upon the local market trend, along with all of the remaining transactions for each given property.
- the data cleaning aspect may also be referred to as Market Based Data Cleaning (MBDC).
- MBDC Market Based Data Cleaning
- the present invention provides property valuation that uses multiple transaction. This may be referred to as Multiple-Transaction Based Property Valuation (MTV). Instead of choosing only one such prior transaction, MTV uses multiple transactions to provide a more accurate mark-to-market value.
- MTV uses multiple transactions to provide a more accurate mark-to-market value.
- the HPI is applied to a weighted combination of all transactions to accommodate this. Further, the weighting may implement recency and transaction type to correct for both sources of potential inaccuracy.
- FIG. 5 is a block diagram illustrating an embodiment of a property value estimation application 500 that includes multiple transaction based property valuation.
- this embodiment may implement any execution environment which is or may become available, including but not limited to a computer workstation containing a processor that executes instructions stored in memory.
- a computer workstation containing a processor that executes instructions stored in memory.
- one modular breakdown 502 - 510 is described, such is provided by way of example only, as the functionality of the property value estimation application 500 may be provided in any number of alternative designs having greater or fewer component modules.
- the property value estimation application 500 includes property transactions data 502 , an RTI module 504 , a market based data cleaning module 506 that includes a transaction record grouping module 508 and a transaction record removal module 510 , and a multiple transaction property valuation module 512 .
- the property transactions data 502 includes data from transactions of various types. Conventional data management techniques may be used to organize the data. The information may be variously organized and include various characteristics as desired by the practitioner. Preferred characteristics include the value of the property, the transaction type from which the value was established, the date or time period, and property location information.
- the RTI module 504 accommodates the determination of HPIs, preferably implementing a repeat sales model to estimate the indices.
- the RTI module 504 may implement any available model to estimates home price indices, including but not limited to the previously introduced Bailey et al. and Case-Shiller implementations. If desired, the RTI module 504 may also implement a localized Branch HPI that is generated using the previously described aspect of the present invention.
- a transaction may be thought of as an action related to a given property, such as a purchase or a refinancing. Each transaction should preferably have one record. However, you may have more than one record because of redundancy.
- the transaction data may refer to all of the records that are being analyzed pursuant to a particular calculation (e.g., all of the records corresponding to a large geographical area, or for a zip code, whatever is relevant).
- the MBDC module 506 accommodates the removal of redundant transactions as well as transactions that are determined to be improperly associated with a given property, to produce a cleaned set of transaction data.
- the data cleaning aspect may be used in conjunction with any property valuation technique. For example, the data cleaning aspect may be used in conjunction with TB-RTI as described previously, multiple transaction based property valuation as described below, or both as described in connection with FIG. 10 below.
- the transaction record grouping (TRG) module 508 groups transaction records. Millions of property data records are typically obtained from several data providers and stored in the property transactions database 502 . The TRG module 508 groups these various transaction records are into properties according to the records' address field. Then the records belonging to each property are grouped into transactions if the records fall into a determined window of time, such as 45 days. This identifies records as belonging to successive periods, or windows, along a time line.
- the transaction record removal (TRR) module 510 is in communication with the TRG module 508 .
- the TRR module 510 removes redundant records and inconsistent records, and preferably implements a market trend defined by a relevant, existing HPI to make decisions in that regard. Records removal is described further below in connection with FIGS. 7-8 .
- the multiple transaction property valuation module 512 is in communication with the TRR module 510 and thus receives the transaction records, with the redundant and inconsistent records having been eliminated.
- the multiple transaction property valuation module 512 preferably utilizes a weighted average of MTM values determined from multiple separate transactions in order to produce an overall predicted value for a given property. An example of equations implemented to accommodate this process is described further below, following the description of record removal.
- FIG. 6 is a flow diagram illustrating an embodiment of a process 600 for multiple transaction based property valuation.
- the process 600 initially comprises the receipt 602 of property records, which as described may be millions of records from various sources. For an analysis, those records pertaining to an analyzed geographical area will be relevant to the prediction of values.
- the records are then associated 604 with distinct properties. This is most readily accommodated by accessing the address information in the records, with a common address assumed to correspond to a common property.
- a given property may have numerous associated records.
- the records are grouped 606 according to the time period in which they reside. A series of time period windows may be initially defined, with the grouping simply being determined according to which window the date for a given record falls.
- Redundancy is then removed 608 by removing records or otherwise determining a representative value where multiple records correspond to a single time window. For example, where there are multiple records corresponding to a given time window, the average value given by those records may be used as the representative record for that given time period. Sometimes, however, records will be discarded. For example, if there are two records, with one being very divergent from a market expectation, that record might be discarded in favor of using the value that is closer to the market expectation.
- FIG. 7 is a graphical diagram 700 that conceptually illustrates redundant record removal.
- the graphical diagram 700 includes transaction time and property value axes, with periods of time 702 a - c sequentially depicted along the time line. As indicated by the legend, numerous records originating from 1 st , 2 nd , and 3 rd providers are plotted on the graphical diagram 700 .
- the diagram also includes a dotted line denoted as the local market HPI 704 .
- the local market HPI is typically for a relatively small geographical area such as zip code.
- the local market HPI may be a Branch HPI.
- the local market HPI may be used to accommodate the reconciliation of record redundancy and removal of erroneous “outlier” records.
- the local market HPI may be plotted on a relative scale and provides an indication of expectations for the local market. The local market HPI is therefore used to determine deviations from expectations for the local market, which in turn determines the algorithm for reconciling redundancy.
- the separation of the values for the two records is relatively large.
- one of the values may be eliminated in lieu of averaging them.
- a preferred tool for accommodating elimination is the local market HPI.
- the local market HPI may be determined from the data for a locality, and this determination may be made prior to the data cleaning process of this aspect of the present invention.
- the previously described HPI determination technique or any available alternative technique for determining the local market HPI may be used. Still referring to the values in the second window 704 b , the record having a value closer to the local market HPI is retained, and the other (divergent) value is discarded.
- the average MTM value may be determined by using the local market HPI and each record to provide several MTM values, and then averaging those value.
- the data provider reliability hierarchy can be variously determined by the practitioner, typically based upon knowledge of the industry and experience with particular providers.
- FIG. 8 is a graphical diagram 800 that conceptually illustrates inconsistent record removal.
- the graphical diagram 800 includes transaction time and property value axes, with time windows 802 a - d depicted along the time line. Again, numerous records originating from 1 st , 2 nd , and 3 rd providers are plotted on the graphical diagram 800 , and as is the local market HPI 804 .
- the value corresponding to the record belonging to time window 802 c is divergent from both the value suggested by the market, and the value corresponding to the other records. In this instance, the divergent record is discarded.
- inconsistent data removal preferably implements the other transactions of the property and local market information.
- inconsistency removal can be variously provided by the artisan, but an example follows:
- the process may be repeated a number of times to ensure that one has a thoroughly cleaned set of data.
- the data cleaning that results from removing 608 , 610 redundant and inconsistent records results in a retained set of records that may be accessed 612 for a determination of the predicted value for a given property.
- the determination 612 of the predicted value preferably implements a weighted combination of MTM values that are each determined from a price estimation index and respective ones of the multiple retained records.
- the weight for each transaction value is inversely proportional to the variance of its MTM value.
- the weights are computed by:
- v 1 i the variance of the log of MTM value of the property based on first transaction, and so on for the second and later transactions.
- the variance of a MTM prediction ⁇ circumflex over (P) ⁇ T,1 i depends upon (1) the sampling variance of the valuation bias parameter b ijk , which can be empirically estimated; (2) the sampling variance of the Branch HPI parameters Î T and Î t ; and (3) the variance of the disturbance term of Eq. 1, which is assumed to be a quadratic function of T ⁇ t.
- FIG. 9 is a graphical diagram 900 that conceptually illustrates an example of weighting in multiple transaction based property valuation, and the results provided by Eq. 9. The impact of transaction type and recency upon weighting are particularly evident from the graph.
- the transaction types are (1) purchase transaction, (2) rate/term refinance, and (3) cash out refinance.
- Plots of the weights corresponding to purchase 902 , rate/term refinance 904 , and cash out refinance 906 transactions are depicted. This graph depicts how the time period and type of transaction factor in the relevancy of the data, which in turn is implemented by the depicted weighting.
- FIG. 10 is a schematic diagram illustrating a system 1000 that includes an MBDC module 1010 , an HPI Estimation with Systematic Bias Control module 1020 , and a Property Value Prediction (e.g., mark-to-market) module 1030 .
- the system 1000 usefully inter-relates the previously described MBDC, TBRTI and MTV aspects of the present invention, which may each be practiced independently or in combinatorial systems involving two or more such as the illustrated system 1000 .
- the MBDC module 1010 implements data cleaning to mitigate idiosyncratic errors. As described, this may involve the removal of redundant records followed by the removal of inconsistent records, or outliers. The former is accommodated by ensuring that the retained record is the most consistent with other transactions of the same property, the local market trend, and neighborhood market. Additionally, algorithms accommodate the adoption of a value as a representative single record for a transaction where multiple records are present for a transaction. Following duplicate removal, the MBDC module 1010 further eliminates erroneous records by eliminating transaction outliers. This is preferably also based upon the local market trend, along with all of the remaining transactions for each given property.
- the cleaned data may be used in support of Property Value Prediction 1030 that, preferably, implements multiple transaction values such as MTV value prediction described above. Instead of choosing only one prior transaction, MTV uses multiple transactions to provide a more accurate mark-to-market value by applying a weighted combination of all transactions for a given property. The weighting factors recency and transaction type to correct for both sources of potential inaccuracy.
- the data cleaning helps ensure the removal of erroneous individual records and the retention of a single representative record for any given transaction, which furthers the accuracy of the MTV value prediction.
- the cleaned data may also be used in conjunction with HPI Estimation with Systematic Bias Control 1020 .
- HPI Estimation with Systematic Bias Control 1020 An example of such HPI estimation is the previously described TB-RTI.
- TB-RTI particularly controls both aggregation bias and transaction type bias. It initially uses trusted transaction records for HPI estimation for large areas where transaction data are deemed sufficient to support viable HPI estimation. It then removes the bias from individual records, particularly but not necessarily limited to questioned transaction records. Finally, it then uses all available data for HPI estimation for smaller areas (e.g., zip codes, neighborhoods, etc.) once the biases in the data are corrected.
- the HPI provided by HPI Estimation with Systematic Bias Control 1020 may be used as the HPI in the Property Value Prediction module 1030 .
- the HPI Estimation with Systematic Bias Control 1020 makes further adjustments to transaction records following the adjustments that were made pursuant to Data Cleaning 1010 . These further adjustments may be made available for Data Cleaning 1010 in a following cycle. For example, a first month's set of data may be subjected to Data Cleaning 1010 , with the cleaned data then being used for both HPI Estimation 1020 and Property Value Predication 1030 . In a following month, the Data Cleaning 1010 may receive additional data that became available in the intervening period of time, and may also invoke the adjustments made within the HPI Estimation 1020 process from the first month.
- embodiments of the present invention provide home price estimation that provides a viable localized home price index where one would not otherwise be available, and home price estimation that facilitates multiple transaction consideration in valuation.
Abstract
Description
log(P t i)−log(P s i)=I t −I s+εst i, (Eq. 1)
where It is the HPI in logarithm to be estimated, and εi st is the cross-sectional disturbance term that has zero mean. In one embodiment, the estimated parameters of the RTI model represent HPIs that are piecewise constant functions of time. Each basic time interval (usually a calendar quarter) is deemed to have the same house price level.
bij1=0 for all i and all j. (Eq. 2)
{circumflex over (P)} t =P sexp{Î t −Î s}, (Eq. 3)
where Ps is observed value of a purchase transaction in period s. We use it as the benchmark to predict the property value, {circumflex over (P)}t, for a non-purchase transaction in period t. Ît and Îs are the estimated large geographical area-specific Trunk HPI.
B=log(P t)−log({circumflex over (P)} t). (Eq. 4)
bijk=median(B) for all transaction B whose non-purchase transaction is in period i, in area j, and transaction type k. (Eq. 5)
{tilde over (P)} t =P texp{−b ijk} (Eq. 6)
if transaction Pt is in period i, in area j, and of type k.
{circumflex over (P)} i T =P i t*exp{−b ijk}*exp{Î T −Î t}, (Eq. 7)
where both ÎT and Ît are estimated branch HPI, as opposed to Eq. 3 where the HPI used were trunk HPI. Notice again that a purchase transaction (k=1) gets no adjustment, because it embodies no systematic bias, and by construction, bij1=0 for all i and all j.
log({circumflex over (P)} i T)=w 1 i log({circumflex over (P)} T,1 i)+w i 2 log({circumflex over (P)} T,2 i)+ (Eq. 8)
where {circumflex over (P)}T,1 i, is the MTM value of the property based on its first transaction, wi 1, is the weight of the first transaction, and so on for the second and later transactions.
where v1 i is the variance of the log of MTM value of the property based on first transaction, and so on for the second and later transactions.
Claims (26)
Priority Applications (1)
| Application Number | Priority Date | Filing Date | Title |
|---|---|---|---|
| US11/033,979 US7765125B1 (en) | 2005-01-12 | 2005-01-12 | Trunk branch repeated transaction index for property valuation |
Applications Claiming Priority (1)
| Application Number | Priority Date | Filing Date | Title |
|---|---|---|---|
| US11/033,979 US7765125B1 (en) | 2005-01-12 | 2005-01-12 | Trunk branch repeated transaction index for property valuation |
Publications (1)
| Publication Number | Publication Date |
|---|---|
| US7765125B1 true US7765125B1 (en) | 2010-07-27 |
Family
ID=42341945
Family Applications (1)
| Application Number | Title | Priority Date | Filing Date |
|---|---|---|---|
| US11/033,979 Active 2029-03-02 US7765125B1 (en) | 2005-01-12 | 2005-01-12 | Trunk branch repeated transaction index for property valuation |
Country Status (1)
| Country | Link |
|---|---|
| US (1) | US7765125B1 (en) |
Cited By (10)
| Publication number | Priority date | Publication date | Assignee | Title |
|---|---|---|---|---|
| US8452641B1 (en) * | 2008-12-29 | 2013-05-28 | Federal Home Loan Mortgage Corporation | System and method for providing a regularized adjusted weighted repeat sale index |
| US20130166354A1 (en) * | 2011-12-22 | 2013-06-27 | Yahoo! Inc. | Valuation estimation |
| US20170357984A1 (en) * | 2015-02-27 | 2017-12-14 | Sony Corporation | Information processing device, information processing method, and program |
| US10733364B1 (en) | 2014-09-02 | 2020-08-04 | Dotloop, Llc | Simplified form interface system and method |
| US10826951B2 (en) | 2013-02-11 | 2020-11-03 | Dotloop, Llc | Electronic content sharing |
| US10861028B2 (en) * | 2016-05-16 | 2020-12-08 | Cerebri AI Inc. | Detecting and reducing bias (including discrimination) in an automated decision making process |
| US10976885B2 (en) | 2013-04-02 | 2021-04-13 | Zillow, Inc. | Systems and methods for electronic signature |
| US11176518B2 (en) | 2011-10-18 | 2021-11-16 | Zillow, Inc. | Systems, methods and apparatus for form building |
| US11288690B1 (en) * | 2001-12-28 | 2022-03-29 | Fannie Mae | Method for determining house price indices |
| US11393057B2 (en) | 2008-10-17 | 2022-07-19 | Zillow, Inc. | Interactive real estate contract and negotiation tool |
Citations (33)
| Publication number | Priority date | Publication date | Assignee | Title |
|---|---|---|---|---|
| US5361201A (en) | 1992-10-19 | 1994-11-01 | Hnc, Inc. | Real estate appraisal using predictive modeling |
| US5680305A (en) * | 1995-02-16 | 1997-10-21 | Apgar, Iv; Mahlon | System and method for evaluating real estate |
| US5893069A (en) | 1997-01-31 | 1999-04-06 | Quantmetrics R&D Associates, Llc | System and method for testing prediction model |
| US6058369A (en) * | 1991-03-11 | 2000-05-02 | R.E. Rothstein | Method and apparatus for monitoring the strength of a real estate market and making lending and insurance decisions therefrom |
| US6178406B1 (en) * | 1995-08-25 | 2001-01-23 | General Electric Company | Method for estimating the value of real property |
| US20010039506A1 (en) * | 2000-04-04 | 2001-11-08 | Robbins Michael L. | Process for automated real estate valuation |
| US20020059126A1 (en) | 2000-06-27 | 2002-05-16 | John Ricciardi | System and method for a selecting an investment item |
| US6401070B1 (en) * | 1996-10-11 | 2002-06-04 | Freddie Mac | System and method for providing house price forecasts based on repeat sales model |
| US20020082903A1 (en) * | 2000-06-22 | 2002-06-27 | Seiichiro Yasuzawa | Real estate net-market system |
| US20020087389A1 (en) * | 2000-08-28 | 2002-07-04 | Michael Sklarz | Value your home |
| US6510419B1 (en) | 1998-04-24 | 2003-01-21 | Starmine Corporation | Security analyst performance tracking and analysis system and method |
| US20030046199A1 (en) | 2001-08-30 | 2003-03-06 | Nissan Motor Co. Ltd. | Method and system for lease |
| US20030078878A1 (en) | 2001-10-22 | 2003-04-24 | Opsahl-Ong Lorinda R. | Systems and methods for evaluating commercial real estate property using stochastic vacancy information |
| US6609109B1 (en) * | 1995-10-12 | 2003-08-19 | Freddie Mac | Method for combining house price forecasts |
| US6609118B1 (en) * | 1999-06-21 | 2003-08-19 | General Electric Company | Methods and systems for automated property valuation |
| US6636803B1 (en) * | 2001-11-30 | 2003-10-21 | Corus Home Realty | Real-estate information search and retrieval system |
| US20040010443A1 (en) | 2002-05-03 | 2004-01-15 | May Andrew W. | Method and financial product for estimating geographic mortgage risk |
| US6681211B1 (en) | 1998-04-24 | 2004-01-20 | Starmine Corporation | Security analyst estimates performance viewing system and method |
| US20040019517A1 (en) * | 2002-07-26 | 2004-01-29 | Fidelity National Information Solutions, Inc. | Method of establishing an insurable value estimate for a real estate property |
| US6842738B1 (en) * | 1996-10-11 | 2005-01-11 | Freddie Mac | System and method for providing property value estimates |
| US6876955B1 (en) * | 2001-12-28 | 2005-04-05 | Fannie Mae | Method and apparatus for predicting and reporting a real estate value based on a weighted average of predicted values |
| US20050187778A1 (en) * | 2004-02-20 | 2005-08-25 | Guy Mitchell | Method and system for estimating the value of real estate |
| US20050261927A1 (en) * | 2004-05-24 | 2005-11-24 | Bilak Mark R | System and method for valuing intellectual property |
| US20060100950A1 (en) * | 2004-10-12 | 2006-05-11 | Global Skyline, Llc | Method for valuign forwards, futures and options on real estate |
| US20060190396A1 (en) * | 2005-02-23 | 2006-08-24 | Winterhalder Edward W | Real estate sales/financing plan |
| US20070061228A1 (en) * | 2003-06-28 | 2007-03-15 | Global Skyline | Method for valuing forwards, futures and options on real estate |
| US7219078B2 (en) * | 2001-09-06 | 2007-05-15 | Causeway Data Communications Limited | Spatially-based valuation of property |
| US20070185906A1 (en) * | 2006-02-03 | 2007-08-09 | Stan Humphries | Automatically determining a current value for a home |
| US7289965B1 (en) * | 2001-08-10 | 2007-10-30 | Freddie Mac | Systems and methods for home value scoring |
| US20080027806A1 (en) * | 2006-04-25 | 2008-01-31 | Countrywide Financial Corporation | Home equity estimator, banner providing interactive home equity estimation, and method for implementing the same |
| US20090018975A1 (en) * | 2007-07-10 | 2009-01-15 | Massachusetts Institute Of Technology | Method for establishing a commercial real estate price change index supporting tradable derivatives |
| US7509261B1 (en) * | 1999-12-06 | 2009-03-24 | Federal Home Loan Mortgage Corporation | Method for forecasting house prices using a dynamic error correction model |
| US7574414B2 (en) * | 2003-04-15 | 2009-08-11 | Siebel Systems, Inc. | Method for implementing a rules-based engine |
-
2005
- 2005-01-12 US US11/033,979 patent/US7765125B1/en active Active
Patent Citations (33)
| Publication number | Priority date | Publication date | Assignee | Title |
|---|---|---|---|---|
| US6058369A (en) * | 1991-03-11 | 2000-05-02 | R.E. Rothstein | Method and apparatus for monitoring the strength of a real estate market and making lending and insurance decisions therefrom |
| US5361201A (en) | 1992-10-19 | 1994-11-01 | Hnc, Inc. | Real estate appraisal using predictive modeling |
| US5680305A (en) * | 1995-02-16 | 1997-10-21 | Apgar, Iv; Mahlon | System and method for evaluating real estate |
| US6178406B1 (en) * | 1995-08-25 | 2001-01-23 | General Electric Company | Method for estimating the value of real property |
| US6609109B1 (en) * | 1995-10-12 | 2003-08-19 | Freddie Mac | Method for combining house price forecasts |
| US6842738B1 (en) * | 1996-10-11 | 2005-01-11 | Freddie Mac | System and method for providing property value estimates |
| US6401070B1 (en) * | 1996-10-11 | 2002-06-04 | Freddie Mac | System and method for providing house price forecasts based on repeat sales model |
| US5893069A (en) | 1997-01-31 | 1999-04-06 | Quantmetrics R&D Associates, Llc | System and method for testing prediction model |
| US6681211B1 (en) | 1998-04-24 | 2004-01-20 | Starmine Corporation | Security analyst estimates performance viewing system and method |
| US6510419B1 (en) | 1998-04-24 | 2003-01-21 | Starmine Corporation | Security analyst performance tracking and analysis system and method |
| US6609118B1 (en) * | 1999-06-21 | 2003-08-19 | General Electric Company | Methods and systems for automated property valuation |
| US7509261B1 (en) * | 1999-12-06 | 2009-03-24 | Federal Home Loan Mortgage Corporation | Method for forecasting house prices using a dynamic error correction model |
| US20010039506A1 (en) * | 2000-04-04 | 2001-11-08 | Robbins Michael L. | Process for automated real estate valuation |
| US20020082903A1 (en) * | 2000-06-22 | 2002-06-27 | Seiichiro Yasuzawa | Real estate net-market system |
| US20020059126A1 (en) | 2000-06-27 | 2002-05-16 | John Ricciardi | System and method for a selecting an investment item |
| US20020087389A1 (en) * | 2000-08-28 | 2002-07-04 | Michael Sklarz | Value your home |
| US7289965B1 (en) * | 2001-08-10 | 2007-10-30 | Freddie Mac | Systems and methods for home value scoring |
| US20030046199A1 (en) | 2001-08-30 | 2003-03-06 | Nissan Motor Co. Ltd. | Method and system for lease |
| US7219078B2 (en) * | 2001-09-06 | 2007-05-15 | Causeway Data Communications Limited | Spatially-based valuation of property |
| US20030078878A1 (en) | 2001-10-22 | 2003-04-24 | Opsahl-Ong Lorinda R. | Systems and methods for evaluating commercial real estate property using stochastic vacancy information |
| US6636803B1 (en) * | 2001-11-30 | 2003-10-21 | Corus Home Realty | Real-estate information search and retrieval system |
| US6876955B1 (en) * | 2001-12-28 | 2005-04-05 | Fannie Mae | Method and apparatus for predicting and reporting a real estate value based on a weighted average of predicted values |
| US20040010443A1 (en) | 2002-05-03 | 2004-01-15 | May Andrew W. | Method and financial product for estimating geographic mortgage risk |
| US20040019517A1 (en) * | 2002-07-26 | 2004-01-29 | Fidelity National Information Solutions, Inc. | Method of establishing an insurable value estimate for a real estate property |
| US7574414B2 (en) * | 2003-04-15 | 2009-08-11 | Siebel Systems, Inc. | Method for implementing a rules-based engine |
| US20070061228A1 (en) * | 2003-06-28 | 2007-03-15 | Global Skyline | Method for valuing forwards, futures and options on real estate |
| US20050187778A1 (en) * | 2004-02-20 | 2005-08-25 | Guy Mitchell | Method and system for estimating the value of real estate |
| US20050261927A1 (en) * | 2004-05-24 | 2005-11-24 | Bilak Mark R | System and method for valuing intellectual property |
| US20060100950A1 (en) * | 2004-10-12 | 2006-05-11 | Global Skyline, Llc | Method for valuign forwards, futures and options on real estate |
| US20060190396A1 (en) * | 2005-02-23 | 2006-08-24 | Winterhalder Edward W | Real estate sales/financing plan |
| US20070185906A1 (en) * | 2006-02-03 | 2007-08-09 | Stan Humphries | Automatically determining a current value for a home |
| US20080027806A1 (en) * | 2006-04-25 | 2008-01-31 | Countrywide Financial Corporation | Home equity estimator, banner providing interactive home equity estimation, and method for implementing the same |
| US20090018975A1 (en) * | 2007-07-10 | 2009-01-15 | Massachusetts Institute Of Technology | Method for establishing a commercial real estate price change index supporting tradable derivatives |
Non-Patent Citations (20)
| Title |
|---|
| Abraham et al., New Evidence on Home Prices from Freddie Mac Repeat Sales. (Journal of the American Real Estate & Urban Economics Assication, Fall 1991, vol. 19, Issue 3, pp. 333-352). |
| Alternate Methods of Increasing the precision of Weighted Repeat Sales House Prices Indices, Michelle H Dreiman, Journal of Real Estate Finance and Eco, Jun. 2004, vol. 28, Iss 4, p. 299. * |
| Andrews, R.L.& Ferguson,J.T., "Integrating Judgement with Regression Appraisal",Real Estate Appraiser and Analyst, Spring 1986, pp. 71-74. |
| Archer, W.R. et al., "Measuring the Importance of Location in House Price Appreciation", J. of Urban Economics,vol. 40, 1996, pp. 334-353. |
| Case et al., On Choosing Among House Price Index Methodologies, (Journal of the American Real Estate & Urban Economics Association, vol. 19, No. 3,1991, pp. 286-307). |
| Case, B. & Quigley, J.M., "The Dynamics of Real Estate Prices", Rev. of Econ. & Stats., Feb. 1991, 73(1), pp. 50-58. |
| Case, K.E. & Shiller, R.J., "Forecasting Prices and Excess Returns in the Housing Market", J. of the AREUEA, 1990, 18(3), pp. 253-273. |
| Case, K.E. & Shiller, R.J., "Prices of Single-Family Homes Since 1970:New Indexes for Four Cities", New England Economic Review, Sep./Oct. 1987, pp. 45-46. |
| Case, K.E. & Shiller, R.J., "The Efficiency of the Market for Single-Family Homes", The American Economic Review, vol. 79(1), Mar. 1989,pp. 125-137. |
| Clean data is a key of automated value estimates, Mortgage servicing News, Mar. 2001, vol. 5, Iss 3 p. 24. * |
| Conventional Mortgage home price index, Stephens William , Journal of Housing research, 1995, vol. 6, Iss 3, p. 308 (30 pages). * |
| Gearge W. Gau, "Optimal Comparable Selection and Weighting in Real Property Valuation: An Extension" (Journal of the American Real Estate and Urban Economics Association 1992, V20, 1: pp. 107-123. |
| Pace, R.K. & Gilley, O.W., "Appraisal Across Jurisdictions Using Bayesian Estatemation with Bootstrapped Priors for Secondary Mortgage Market Applications", Prop. Tax J. Mar. 1989, 8 (1), pp. 27-42. |
| Quigley, J.M., "A Simple Hybrid Model for Estimating Real Estate Price Indexes", J. Houseing Econ., Mar. 1995,4 (1), pp. 1-12. |
| Raftery, A. et al., "Model Selection and Accounting for Model Uncertainty in Linear Regression Models", Nov. 19, 1993, U of Washington, pp. 1-24. |
| Sessions, D.N. & Chatterjee, S., "The Combining of Forecasts Using Recrursive Tecniques With Non-Stationary Weights", J. of Forecasts, 1989, 8(3), pp. 239-251. |
| Stephens, W. et al. "Conventional Mortgage Home Price Index", J. of Housing Research, vol. 6(3),pp. 389-418. |
| Steven Wood "Combining Forecasts to Predict Property Values for Single-Family Residences" (Land Economics, May 1976, pp. 221-229). |
| The dynamics of Location in Home Price, Alan Geggrand, Journal of Real Estate Finance and Eco, Sep. 2004, vol. 29, Iss 2, p. 149. * |
| Vandell, K.D., "Optimal Comparable Selection and Weighting in Real Property Valuation", AREUEA Journal, vol. 19(2), 1991, pp. 213-239. |
Cited By (17)
| Publication number | Priority date | Publication date | Assignee | Title |
|---|---|---|---|---|
| US11288690B1 (en) * | 2001-12-28 | 2022-03-29 | Fannie Mae | Method for determining house price indices |
| US11393057B2 (en) | 2008-10-17 | 2022-07-19 | Zillow, Inc. | Interactive real estate contract and negotiation tool |
| US10937091B1 (en) * | 2008-12-29 | 2021-03-02 | Federal Home Loan Mortgage Corporation (Freddie Mac) | System and method for providing an estimate of property value growth based on a repeat sales house price index |
| US8452641B1 (en) * | 2008-12-29 | 2013-05-28 | Federal Home Loan Mortgage Corporation | System and method for providing a regularized adjusted weighted repeat sale index |
| US10628839B1 (en) * | 2008-12-29 | 2020-04-21 | Federal Home Loan Mortgage Corporation (Freddie Mac) | System and method for providing an estimate of property value growth based on a repeat sales house price index |
| US11176518B2 (en) | 2011-10-18 | 2021-11-16 | Zillow, Inc. | Systems, methods and apparatus for form building |
| US20130166354A1 (en) * | 2011-12-22 | 2013-06-27 | Yahoo! Inc. | Valuation estimation |
| US10826951B2 (en) | 2013-02-11 | 2020-11-03 | Dotloop, Llc | Electronic content sharing |
| US11621983B1 (en) | 2013-02-11 | 2023-04-04 | MFTB Holdco, Inc. | Electronic content sharing |
| US11258837B1 (en) | 2013-02-11 | 2022-02-22 | Zillow, Inc. | Electronic content sharing |
| US11494047B1 (en) | 2013-04-02 | 2022-11-08 | Zillow, Inc. | Systems and methods for electronic signature |
| US10976885B2 (en) | 2013-04-02 | 2021-04-13 | Zillow, Inc. | Systems and methods for electronic signature |
| US10733364B1 (en) | 2014-09-02 | 2020-08-04 | Dotloop, Llc | Simplified form interface system and method |
| US20170357984A1 (en) * | 2015-02-27 | 2017-12-14 | Sony Corporation | Information processing device, information processing method, and program |
| US20210056569A1 (en) * | 2016-05-16 | 2021-02-25 | Cerebri AI Inc. | Detecting and reducing bias (including discrimination) in an automated decision making process |
| US10861028B2 (en) * | 2016-05-16 | 2020-12-08 | Cerebri AI Inc. | Detecting and reducing bias (including discrimination) in an automated decision making process |
| US11922435B2 (en) * | 2016-05-16 | 2024-03-05 | Cerebri AI Inc. | Detecting and reducing bias (including discrimination) in an automated decision making process |
Similar Documents
| Publication | Publication Date | Title |
|---|---|---|
| US8214275B1 (en) | Multiple transaction property valuation | |
| US7765125B1 (en) | Trunk branch repeated transaction index for property valuation | |
| US8244619B2 (en) | Price indexing | |
| US10713711B2 (en) | Multiple funding account payment instrument analytics | |
| US8195473B2 (en) | Method and system for optimized real estate appraisal | |
| US20120095892A1 (en) | Price indexing | |
| US20100228657A1 (en) | Price indexing | |
| US7451095B1 (en) | Systems and methods for income scoring | |
| Li et al. | Lattice models for pricing American interest rate claims | |
| US7974854B1 (en) | Systems and methods for retrospective home value scoring | |
| US8577791B2 (en) | System and computer program for modeling and pricing loan products | |
| US8682762B2 (en) | Causal modeling for estimating outcomes associated with decision alternatives | |
| US20150112874A1 (en) | Method and system for performing owner association analytics | |
| US10062112B1 (en) | Systems, methods, and computer-readable storage media for calculating a housing volatility index | |
| US8738388B1 (en) | Market based data cleaning | |
| US20130282596A1 (en) | Systems and methods for evaluating property valuations | |
| US20200387990A1 (en) | Systems and methods for performing automated feedback on potential real estate transactions | |
| Korteweg et al. | Estimating Loan‐to‐Value Distributions | |
| US20160307272A1 (en) | System for reducing computational costs associated with predicting demand for products | |
| WO2014059187A2 (en) | Systems for determining and providing a portfolio overlay for investment portfolio adjustment to mitigate financial risk | |
| US20210350459A1 (en) | Diamond Asset Systems and Methods Facilitating Transactions, Valuation, and Securitization | |
| Korteweg et al. | Estimating loan-to-value and foreclosure behavior | |
| US20080222028A1 (en) | Method and System for Providing Mortgage Data Quality Control Verification | |
| US20180341958A1 (en) | System and method for generating specialty property cost index | |
| Ölkers et al. | Exploring the role of interest rates, macroeconomic environment, agricultural cycle, and gender on loan demand in the agricultural sector: Evidence from Mali |
Legal Events
| Date | Code | Title | Description |
|---|---|---|---|
| AS | Assignment |
Owner name: MAE, FANNIE, DISTRICT OF COLUMBIA Free format text: ASSIGNMENT OF ASSIGNORS INTEREST;ASSIGNORS:AN, MARK Y.;GAO, ANDRE H.;SIGNING DATES FROM 20050329 TO 20050404;REEL/FRAME:016472/0263 |
|
| STCF | Information on status: patent grant |
Free format text: PATENTED CASE |
|
| FPAY | Fee payment |
Year of fee payment: 4 |
|
| MAFP | Maintenance fee payment |
Free format text: PAYMENT OF MAINTENANCE FEE, 8TH YEAR, LARGE ENTITY (ORIGINAL EVENT CODE: M1552) Year of fee payment: 8 |
|
| MAFP | Maintenance fee payment |
Free format text: PAYMENT OF MAINTENANCE FEE, 12TH YEAR, LARGE ENTITY (ORIGINAL EVENT CODE: M1553); ENTITY STATUS OF PATENT OWNER: LARGE ENTITY Year of fee payment: 12 |