US8886553B2 - Visual workflow process notation and layout - Google Patents

Visual workflow process notation and layout Download PDF

Info

Publication number
US8886553B2
US8886553B2 US11/415,834 US41583406A US8886553B2 US 8886553 B2 US8886553 B2 US 8886553B2 US 41583406 A US41583406 A US 41583406A US 8886553 B2 US8886553 B2 US 8886553B2
Authority
US
United States
Prior art keywords
activity
workflow
node
work
path
Prior art date
Legal status (The legal status is an assumption and is not a legal conclusion. Google has not performed a legal analysis and makes no representation as to the accuracy of the status listed.)
Expired - Fee Related, expires
Application number
US11/415,834
Other versions
US20070260499A1 (en
Inventor
Arthur R. Greef
Jens Olesen Lund
Christian Hagel-Sorensen
Current Assignee (The listed assignees may be inaccurate. Google has not performed a legal analysis and makes no representation or warranty as to the accuracy of the list.)
Microsoft Technology Licensing LLC
Original Assignee
Microsoft Corp
Priority date (The priority date is an assumption and is not a legal conclusion. Google has not performed a legal analysis and makes no representation as to the accuracy of the date listed.)
Filing date
Publication date
Application filed by Microsoft Corp filed Critical Microsoft Corp
Priority to US11/415,834 priority Critical patent/US8886553B2/en
Assigned to MICROSOFT CORPORATION reassignment MICROSOFT CORPORATION ASSIGNMENT OF ASSIGNORS INTEREST (SEE DOCUMENT FOR DETAILS). Assignors: SORENSEN, CHRISTIAN HAGEL, GREEF, ARTHUR R., LUND, JENS OLESEN
Priority to EP07749450A priority patent/EP2024822A4/en
Priority to PCT/US2007/002394 priority patent/WO2007130180A1/en
Publication of US20070260499A1 publication Critical patent/US20070260499A1/en
Application granted granted Critical
Publication of US8886553B2 publication Critical patent/US8886553B2/en
Assigned to MICROSOFT TECHNOLOGY LICENSING, LLC reassignment MICROSOFT TECHNOLOGY LICENSING, LLC ASSIGNMENT OF ASSIGNORS INTEREST (SEE DOCUMENT FOR DETAILS). Assignors: MICROSOFT CORPORATION
Expired - Fee Related legal-status Critical Current
Adjusted expiration legal-status Critical

Links

Images

Classifications

    • GPHYSICS
    • G05CONTROLLING; REGULATING
    • G05BCONTROL OR REGULATING SYSTEMS IN GENERAL; FUNCTIONAL ELEMENTS OF SUCH SYSTEMS; MONITORING OR TESTING ARRANGEMENTS FOR SUCH SYSTEMS OR ELEMENTS
    • G05B19/00Programme-control systems
    • G05B19/02Programme-control systems electric
    • G05B19/18Numerical control [NC], i.e. automatically operating machines, in particular machine tools, e.g. in a manufacturing environment, so as to execute positioning, movement or co-ordinated operations by means of programme data in numerical form
    • G05B19/409Numerical control [NC], i.e. automatically operating machines, in particular machine tools, e.g. in a manufacturing environment, so as to execute positioning, movement or co-ordinated operations by means of programme data in numerical form characterised by using manual input [MDI] or by using control panel, e.g. controlling functions with the panel; characterised by control panel details, by setting parameters
    • GPHYSICS
    • G06COMPUTING; CALCULATING OR COUNTING
    • G06QINFORMATION AND COMMUNICATION TECHNOLOGY [ICT] SPECIALLY ADAPTED FOR ADMINISTRATIVE, COMMERCIAL, FINANCIAL, MANAGERIAL OR SUPERVISORY PURPOSES; SYSTEMS OR METHODS SPECIALLY ADAPTED FOR ADMINISTRATIVE, COMMERCIAL, FINANCIAL, MANAGERIAL OR SUPERVISORY PURPOSES, NOT OTHERWISE PROVIDED FOR
    • G06Q10/00Administration; Management
    • G06Q10/06Resources, workflows, human or project management; Enterprise or organisation planning; Enterprise or organisation modelling
    • G06Q10/063Operations research, analysis or management
    • G06Q10/0631Resource planning, allocation, distributing or scheduling for enterprises or organisations
    • G06Q10/06313Resource planning in a project environment
    • GPHYSICS
    • G06COMPUTING; CALCULATING OR COUNTING
    • G06QINFORMATION AND COMMUNICATION TECHNOLOGY [ICT] SPECIALLY ADAPTED FOR ADMINISTRATIVE, COMMERCIAL, FINANCIAL, MANAGERIAL OR SUPERVISORY PURPOSES; SYSTEMS OR METHODS SPECIALLY ADAPTED FOR ADMINISTRATIVE, COMMERCIAL, FINANCIAL, MANAGERIAL OR SUPERVISORY PURPOSES, NOT OTHERWISE PROVIDED FOR
    • G06Q10/00Administration; Management
    • G06Q10/06Resources, workflows, human or project management; Enterprise or organisation planning; Enterprise or organisation modelling
    • G06Q10/063Operations research, analysis or management
    • G06Q10/0631Resource planning, allocation, distributing or scheduling for enterprises or organisations
    • G06Q10/06316Sequencing of tasks or work
    • GPHYSICS
    • G06COMPUTING; CALCULATING OR COUNTING
    • G06QINFORMATION AND COMMUNICATION TECHNOLOGY [ICT] SPECIALLY ADAPTED FOR ADMINISTRATIVE, COMMERCIAL, FINANCIAL, MANAGERIAL OR SUPERVISORY PURPOSES; SYSTEMS OR METHODS SPECIALLY ADAPTED FOR ADMINISTRATIVE, COMMERCIAL, FINANCIAL, MANAGERIAL OR SUPERVISORY PURPOSES, NOT OTHERWISE PROVIDED FOR
    • G06Q10/00Administration; Management
    • G06Q10/06Resources, workflows, human or project management; Enterprise or organisation planning; Enterprise or organisation modelling
    • G06Q10/063Operations research, analysis or management
    • G06Q10/0633Workflow analysis
    • GPHYSICS
    • G06COMPUTING; CALCULATING OR COUNTING
    • G06QINFORMATION AND COMMUNICATION TECHNOLOGY [ICT] SPECIALLY ADAPTED FOR ADMINISTRATIVE, COMMERCIAL, FINANCIAL, MANAGERIAL OR SUPERVISORY PURPOSES; SYSTEMS OR METHODS SPECIALLY ADAPTED FOR ADMINISTRATIVE, COMMERCIAL, FINANCIAL, MANAGERIAL OR SUPERVISORY PURPOSES, NOT OTHERWISE PROVIDED FOR
    • G06Q10/00Administration; Management
    • G06Q10/06Resources, workflows, human or project management; Enterprise or organisation planning; Enterprise or organisation modelling
    • G06Q10/063Operations research, analysis or management
    • G06Q10/0639Performance analysis of employees; Performance analysis of enterprise or organisation operations
    • G06Q10/06393Score-carding, benchmarking or key performance indicator [KPI] analysis
    • GPHYSICS
    • G06COMPUTING; CALCULATING OR COUNTING
    • G06QINFORMATION AND COMMUNICATION TECHNOLOGY [ICT] SPECIALLY ADAPTED FOR ADMINISTRATIVE, COMMERCIAL, FINANCIAL, MANAGERIAL OR SUPERVISORY PURPOSES; SYSTEMS OR METHODS SPECIALLY ADAPTED FOR ADMINISTRATIVE, COMMERCIAL, FINANCIAL, MANAGERIAL OR SUPERVISORY PURPOSES, NOT OTHERWISE PROVIDED FOR
    • G06Q10/00Administration; Management
    • G06Q10/10Office automation; Time management
    • G06Q10/103Workflow collaboration or project management
    • H04L67/36
    • HELECTRICITY
    • H04ELECTRIC COMMUNICATION TECHNIQUE
    • H04LTRANSMISSION OF DIGITAL INFORMATION, e.g. TELEGRAPHIC COMMUNICATION
    • H04L67/00Network arrangements or protocols for supporting network services or applications
    • H04L67/50Network services
    • H04L67/75Indicating network or usage conditions on the user display
    • GPHYSICS
    • G05CONTROLLING; REGULATING
    • G05BCONTROL OR REGULATING SYSTEMS IN GENERAL; FUNCTIONAL ELEMENTS OF SUCH SYSTEMS; MONITORING OR TESTING ARRANGEMENTS FOR SUCH SYSTEMS OR ELEMENTS
    • G05B2219/00Program-control systems
    • G05B2219/30Nc systems
    • G05B2219/31From computer integrated manufacturing till monitoring
    • G05B2219/31449Monitor workflow, to optimize business, industrial processes

Definitions

  • the first data structure is a Bill of Materials (BOM).
  • BOM Bill of Materials
  • Routing Both data structures are typically stored electronically, but can also be displayed in printed form.
  • the BOM data structure represents the component parts and end products that will be produced or used at steps in the production process.
  • a BOM structure may take the form of a table, but is typically shown as a tree-shaped list.
  • a BOM tree fans out from a top level product to show component and sub-component parts that the top level product is comprised of.
  • example component parts shown as branches might be frames and seats.
  • Sub-components shown as additional branches stemming from a frame component branch might be types of steel pipe.
  • sub-components shown as additional branches stemming from a seat component branch might be leather and foam padding.
  • a single BOM tree may be used to describe a bill of materials for an entire production process, such as the process of making bicycles.
  • many separate BOMs may be used to show bills of material for raw materials and component parts that are used in production of an end product, such as a bicycle.
  • the routing data structure describes or traces a path that that each part and end product will take through a production facility, such as between work stations and inventory locations. If multiple production sites or factories are involved in a production process, the routing will also trace part and product paths between production sites. Routing structures can be displayed as trees, but are more typically displayed as tables of rows and columns similar to those of a spread sheet. Routing structures contain information describing the activities performed on the parts listed in the BOM, such as: labor, machine time, or scheduling information related to a particular activity. A product routing may be described in a single routing data structure, or many smaller routing data structures.
  • BOM and routing structures are typically used by managers to plan logistics, costs, and production schedules for a manufacturing process. For instance, if a market exists for 1000 bicycles, a manager can determine, through analysis of these structures, where and when to produce the components of these bicycles so that the correct number of end products can be manufactured. Further analysis of these data structures can help a manufacturer determine how much a product will cost to produce, and where the costs are generated.
  • a third data structure type called a process flow diagram
  • the process flow diagram visually displays steps in a process. Examples of such process flow diagrams include flow charts, Gant charts, and Pert charts.
  • process flow diagrams currently in use contain very little, if any, information used by managers. These process flow diagrams are instead typically used by process engineers and production schedulers to visually represent, design, and operate a process, rather than by managers who manage the process.
  • a technology for visual workflow process notation and layout is disclosed.
  • the technology represents elements and activities of workflow processes with a notation comprised of visually distinct symbols.
  • a workflow process graphical user interface (GUI) is generated and displayed by a system that lays out portions of a workflow process using the visual workflow process notation.
  • Activity nodes are arranged along a workflow path, with each activity node representing a work activity that is performed in the workflow process that the GUI is being generated for.
  • the activity nodes are arranged on the workflow path in representation of the order of performance of work activities within the workflow process.
  • textual labels are added to portions of the graphical user interface.
  • graphical and/or textual performance metrics are also added to portions of the GUI that is displayed.
  • a material flow path is then optionally arranged adjacent to the workflow path.
  • the material flow path is representative of a flow of a material through the work activities associated with the plurality of activity nodes.
  • a resource allocation node is then optionally disposed adjacent to a portion of the material flow path and one of the activity nodes.
  • the resource allocation node symbolizes a resource utilized in performing a work activity, represented by the adjacent activity node, upon a material represented by the adjacent portion of the material flow path.
  • a plurality of resource allocation nodes may be used, as required to illustrate the workflow process.
  • FIG. 1 is a diagram of an exemplary computer system used in accordance with embodiments of the present technology for visual workflow process notation and layout.
  • FIG. 2 is a diagram of one embodiment of a system for visual workflow process notation and layout.
  • FIG. 3 is a flow diagram of operations performed in accordance with one embodiment of the present technology for visual workflow process notation and layout.
  • FIG. 4 is a representation of an exemplary visual workflow process notation generated in accordance with one embodiment of the present technology for visual workflow process notation and layout.
  • FIG. 5 is a representation of an exemplary visual workflow process layout generated in accordance with one embodiment of the present technology for visual workflow process notation and layout.
  • FIG. 6A is a representation of an exemplary metric generated in accordance with one embodiment of the present technology for visual workflow process notation and layout.
  • FIG. 6B is a representation of an exemplary metric generated in accordance with one embodiment of the present technology for visual workflow process notation and layout.
  • FIG. 7 is a flow diagram of operations performed in accordance with one embodiment of the present technology for visual workflow process notation and layout.
  • FIG. 8 is a representation of an exemplary visual workflow process layout generated in accordance with one embodiment of the present technology for visual workflow process notation and layout.
  • the present technology for visual workflow process notation and layout is also well suited to the use of other computer systems such as, for example, optical, virtual, and mechanical computers. Additionally, it should be understood that in embodiments of the present technology for visual workflow process notation and layout, one or more of the steps can be performed manually.
  • FIG. 1 portions of the technology for visual workflow process notation and layout are composed of computer-readable and computer-executable instructions that reside, for example, in computer-usable media of a computer system. That is, FIG. 1 illustrates one example of a type of computer that can be used to implement embodiments, which are discussed below, of the present technology for visual workflow process notation and layout.
  • FIG. 1 illustrates an exemplary computer system 100 used in accordance with embodiments of the present technology for visual workflow process notation and layout. It is appreciated that system 100 of FIG.
  • FIG. 1 is exemplary only and that the present technology for visual workflow process notation and layout can operate on or within a number of different computer systems including general purpose networked computer systems, embedded computer systems, routers, switches, server devices, client devices, various intermediate devices/nodes, stand alone computer systems, and the like.
  • computer system 100 of FIG. 1 is well adapted to having peripheral computer readable media 102 such as, for example, a floppy disk, a compact disc, and the like coupled thereto.
  • System 100 of FIG. 1 includes an address/data bus 104 for communicating information, and a processor 106 A coupled to bus 104 for processing information and instructions. As depicted in FIG. 1 , system 100 is also well suited to a multi-processor environment in which a plurality of processors 106 A, 106 B, and 106 C are present. Conversely, system 100 is also well suited to having a single processor such as, for example, processor 106 A. Processors 106 A, 106 B, and 106 C may be any of various types of microprocessors. System 100 also includes data storage features such as a computer usable volatile memory 108 , e.g.
  • System 100 also includes computer usable non-volatile memory 110 , e.g. read only memory (ROM), coupled to bus 104 for storing static information and instructions for processors 106 A, 106 B, and 106 C. Also present in system 100 is a data storage unit 112 (e.g., a magnetic or optical disk and disk drive) coupled to bus 104 for storing information and instructions.
  • System 100 also includes an optional alphanumeric input device 114 including alphanumeric and function keys coupled to bus 104 for communicating information and command selections to processor 106 A or processors 106 A, 106 B, and 106 C.
  • System 100 also includes an optional cursor control device 116 coupled to bus 104 for communicating user input information and command selections to processor 106 A or processors 106 A, 106 B, and 106 C.
  • System 100 of the present embodiment also includes an optional display device 118 coupled to bus 104 for displaying information.
  • optional display device 118 of FIG. 1 may be a liquid crystal device, cathode ray tube, plasma display device or other display device suitable for creating graphic images and alphanumeric characters recognizable to a user.
  • Optional cursor control device 116 allows the computer user to dynamically signal the movement of a visible symbol (cursor) on a display screen of display device 118 .
  • cursor control device 116 are known in the art including a trackball, mouse, touch pad, joystick or special keys on alpha-numeric input device 114 capable of signaling movement of a given direction or manner of displacement.
  • System 100 can be directed and/or activated via input from alpha-numeric input device 114 using special keys and key sequence commands.
  • System 100 is also well suited to having a cursor directed by other means such as, for example, voice commands.
  • System 100 also includes an I/O device 120 for coupling system 100 with external entities.
  • I/O device 120 is a modem for enabling wired or wireless communications between system 100 and an external network such as, but not limited to, the Internet.
  • an operating system 122 when present, an operating system 122 , applications 124 , modules 126 , and data 128 are shown as typically residing in one or some combination of computer usable volatile memory 108 , e.g. random access memory (RAM), and data storage unit 112 .
  • RAM random access memory
  • the present technology for visual workflow process notation and layout for example, is stored as an application 124 or module 126 in memory locations within RAM 108 and memory areas within data storage unit 112
  • FIG. 2 shows a block diagram of components of an exemplary system 200 which generates visual workflow process notations and layouts, according to one embodiment of the present technology.
  • the following discussion will begin with a description of the physical structure of system 200 . Discussion will turn to description of components of system 200 used in an exemplary method for generating a workflow process graphical user interface. An exemplary notation and layout created using the exemplary method will be described Discussion will proceed to a description of components of system 200 used in an exemplary method for displaying a unified visual representation of a workflow process on a display device in a computer system. An exemplary unified visual representation generated using the exemplary method will be described.
  • system 200 is comprised of an activity node generator 205 , a material flow path generator 210 , a resource allocation node generator 215 , and a metric generator 220 which are all coupled to one another and configure to couple to a common input/output bus such as bus 104 ( FIG. 1 ).
  • system 200 is also configured to couple, for example via bus 104 , to computer system 100 and display device 118 (both of FIG. 1 ).
  • system 200 takes the form of an application 124 ( FIG. 1 ) that is resident on portions of computer system 100 .
  • System 200 is configured to generate elements of a workflow process layout for visual display on a display device, such as display device 118 .
  • flow diagrams 300 and 700 each illustrate exemplary steps used by various embodiments of the present technology for visual workflow process notation and layout.
  • Flow diagrams 300 and 700 include processes that, in various embodiments, are carried out by a processor under the control of computer-readable and computer-executable instructions.
  • the computer-readable and computer-executable instructions reside, for example, in data storage features such as computer usable volatile memory 108 , computer usable non-volatile memory 110 , and/or data storage unit 112 of FIG. 1 .
  • the computer-readable and computer-executable instructions are used to control or operate in conjunction with, for example, processor 106 A and/or processors 106 A, 106 B, and 106 C of FIG. 1 .
  • processor 106 A and/or processors 106 A, 106 B, and 106 C of FIG. 1 Although specific steps are disclosed in flow diagrams 300 and 700 , such steps are exemplary. That is, embodiments are well suited to performing various other steps or variations of the steps recited in flow diagrams 300 and 700 . It is appreciated that the steps in flow diagrams 300 and 700 may be performed in an order different than presented, and that not all of the steps in flow diagrams 300 and 700 may be performed.
  • FIG. 3 is a flow diagram 300 of operations performed in accordance with one embodiment of the present technology for visual workflow process notation and layout. More specifically, FIG. 3 illustrates a flow diagram 300 of an exemplary embodiment of a method for generating a workflow process graphical user interface. Elements of system 200 and flow diagram 300 are explained below, in conjunction with workflow layout 500 of FIG. 5 and visual notation legend 400 of FIG. 4 .
  • FIG. 5 represents an exemplary visual workflow process layout 500 generated in accordance with one embodiment of the present technology for visual workflow process notation and layout.
  • visual workflow process layout 500 represents a workflow process graphical user interface generated and displayed by method 300 and system 200 of the present technology.
  • workflow process 500 is “read” from upper left to lower right, and is a workflow process for making steel pipe from the raw material of steel ingots.
  • workflow process 500 is arranged and read in the direction that matches cultural reading and writing conventions. For example right to left and from top to bottom is the reading and writing convention in some cultures.
  • System 200 is used to generate all visual symbols and textual labels in workflow process layout 500 .
  • starting label 501 is generated by system 200 .
  • Other labels and symbols in visual layout 500 are described below, in conjunction with applicable portions of system 200 or flow diagram 300 .
  • activity node generator 205 of the present technology for visual workflow process notation and layout, arranges a plurality of activity nodes along a workflow path.
  • Activity node generator 205 is configured to generate activity nodes and a workflow path for display on a display device, such as display device 118 .
  • the activity nodes and workflow path are generated and displayed as part of a graphical user interface of a workflow process or a unified visual representation of a workflow process.
  • Each activity node represents an individual work activity or event that occurs in a process of performing work, such as, for example, in a manufacturing process.
  • Activity node generator 205 then arranges the activity nodes along the workflow path in representation of an order of performing work within the process that is being visually represented.
  • Activity node generator 205 receives information for generating activity nodes via: manual user inputs (such as through computer system 100 or some similar input method); via information retrieval from files or data structures such as electronically stored Pert charts, Gant charts, routing structures, or BOM structures; or via some combination of manual input and retrieval from stored electronic information.
  • Activity node generator 205 generates activity nodes to represent both value added and non-value added work activities and events.
  • Value added work activities and events are those that increase the value of a product, for instance by transforming a raw material into a different form.
  • Non-value added activities or events are those that do not increase the value of a product.
  • Some examples of a non-value added activities are events such as moving a component from one place to another place in a warehouse or transporting a component from one station to another station in a manufacturing line.
  • activity node generator 205 generates separate visual symbols to represent value added and non-value added activity nodes.
  • Value added activity node symbol 420 and non-value added activity node symbol 410 both of FIG. 4 , exemplify an embodiment of separate visual symbols used to represent value added and non-value added activity nodes.
  • other visual symbols are also generated for sub-classifications of value added and non-value added activities and/or for other classifications of activities.
  • activity node generator 205 arranges activity nodes along a workflow path by populating a first end of the workflow path with an initial activity node, such as non-value added activity node 410 a of FIG. 5 .
  • the initial activity node represents a first work activity or event in a process of production, manufacturing, or some other type of work.
  • Activity node generator 205 populates a second end of the workflow path with a terminal activity node, such as non-value added activity node 410 g of FIG. 5 .
  • the terminal activity node represents a final work activity or event in the process of production, manufacturing, or some other type of work.
  • Activity node generator 205 populates the work flow path with activity nodes associated with intermediate work activities.
  • Non-value added activity nodes 410 b , 410 c , 410 d , 410 e , and 410 f , and value added activity nodes 420 a and 420 b , all of FIG. 5 are examples of intermediate activity nodes.
  • Activity node generator 205 arranges these intermediate activity nodes in sequential order of occurrence along the workflow path between the initial activity node and the terminal activity node of the workflow process.
  • activity node generator 205 renders a textual label adjacent to one of more of the activity nodes.
  • the textual label describes the work activity or event that the activity node represents.
  • Activity node label 511 a of FIG. 5 “Delivered”, is an example of such a label.
  • the textual label also comprises a step number to denote its place in a sequential order of performance of the activities in the represented workflow process.
  • Activity node label 511 b of FIG. 5 “ 1 Inspected”, is an example of such a label.
  • Activity node label 511 b represents the first activity performed in a workflow process.
  • Labels 511 c , 511 d , 511 e , 511 f , 511 g , 511 h , and 511 i are other examples of activity node labels shown in FIG. 5 .
  • Activity node generator 205 uses a unique visual notation to represent a workflow path.
  • Element 405 of FIG. 4 a thick line, represents one embodiment of a visual notation for a workflow path.
  • Workflow path 405 a of FIG. 5 shows an example of this notation in use.
  • the visual notation for a work flow path can comprise lines similar to element 405 that are configured in a variety of colors, shadings, or visual textures to represent distinct workflow paths or distinct portions of a workflow path.
  • activity node generator 205 automatically scales and arranges the workflow path that is generated, such that an end-to-end overview of a workflow process is displayed in aggregate on a single screen of a display device. This is useful, for example, so that a manager can get a quick overview of the activities and other information associated with a workflow process.
  • FIG. 8 represents such an example of such an end-to-end overview.
  • one or more selectable portions of a displayed workflow process layout are configured to display in an enlarged fashion in response to a user selection. This allows the selectable portions to display more detailed process information when enlarged. It also reduces the visual complexity a top-level workflow process graphical user interface. Value added activity node 420 c, “ 1 Steel Pipe Made”, of FIG.
  • workflow process 500 of FIG. 5 is displayed to show an enlarged, more detailed workflow process diagram of the process for making steel pipe from ingots of steel.
  • material flow path generator 210 of the present technology for visual workflow process notation and layout, arranges a material flow path for display adjacent to the workflow path generated by activity node generator 205 .
  • the material flow path generator is configured to generate a material flow path for display adjacent to the workflow path on a display device such as display device 118 ( FIG. 1 ).
  • the material flow path is generated as part of a workflow process graphical user interface or a unified visual representation of a workflow process that is being displayed.
  • material flow path generator 210 generates a material flow path to represent the flow of each of the materials used in the process.
  • Material flow path generator 210 receives information for generating a material flow path via: manual user inputs (such as through computer system 100 or some similar input method); via information retrieval from files or data structures such as electronically stored Pert charts, Gant charts, routing structures, or BOM structures; or via some combination of manual input and retrieval from stored electronic information.
  • Material flow path generator 210 uses a unique visual notation to represent a flow of material, such as a raw material or transformed intermediate material, through the various work activities associated with the plurality of activity nodes generated by activity node generator 205 .
  • Dashed line 430 of FIG. 4 , and dashed line 430 a of FIG. 5 each exemplify an embodiment of a unique visual symbol that is used in one embodiment of the present technology to represent a material flow path.
  • material flow path generator 210 also uses a unique visual notation to represent transformations of a material. These transformations are, for example, transformations that take place due to value added activities that are performed on a material.
  • Element 435 of FIG. 4 , (a notch shaped dashed line) exemplifies one embodiment of a unique visual notation that is used in one embodiment of the present technology to denote a transformation of a material on a material flow path.
  • material flow path generator 210 denotes transformation points on the material flow path to represent transformational stages.
  • An example of a transformational stage is a transformative step in the process of creating a finished product from a raw material. For example, in FIG.
  • transformation point 435 a indicates where the activity of casting billets, represented by 420 a , transforms steel ingot material into steel round.
  • transformation point 435 b indicates where the activity of sawing, represented by 420 b , transforms the material of steel round into steel pipe.
  • material flow path generator 210 also associates textual labels with a material flow path, such as, for example, by inserting one or more textual labels into the material flow path.
  • Material flow path label 531 a of FIG. 5 “Steel Ingot”, is exemplary of one embodiment of such a textual label.
  • Such labels give a quick visual indication of what material is represented by a flow path.
  • such labels are modified after material transformations occur on a material flow path.
  • Material flow path label 531 b of FIG. 5 “Steel Round”, is an example of a label that has been modified following a transformation, indicated by 435 a , which occurred in a material flow path 430 a .
  • Material flow path label 531 c “Steel Pipe”, is another such label that shows a modification to a material following a transformation, indicated by 435 b , which occurred in material flow path 430 a.
  • resource allocation node generator 215 disposes a resource allocation node adjacent to a portion of one of the activity nodes and/or the material flow path.
  • Resource allocation node generator is configured to generate resource allocation nodes for display on a display device, such as display device 118 ( FIG. 1 ).
  • the resource allocation node represents a resource utilized in performing a work activity represented by the adjacent activity node upon the material represented by the adjacent portion of the material flow path.
  • a resource allocation node is generated for display adjacent to the workflow path and/or material flow path displayed on a display device, for example, as part of a graphical user interface or as part of a unified visual representation of a workflow process.
  • resource allocation node generator 215 generates multiple resource allocation nodes for display adjacent to the activity node.
  • Resource allocation node generator 215 receives information for generating resource allocation nodes via: manual user inputs (such as through computer system 100 or some similar input method); via information retrieval from files or data structures such as electronically stored Pert charts, Gant charts, routing structures, or BOM structures; or via some combination of manual input and retrieval from stored electronic information.
  • Resource allocation node generator 215 uses a unique visual notation to represent application of resources, such as: human labor, machine labor, or other such resources to perform an activity in a workflow process.
  • Element 440 , of FIG. 4 (two white square boxes connected by a line segment) exemplifies a unique visual symbol that is used in one embodiment of the present technology to represent a resource allocation node. Viewing element 440 from left to right, the first box represents the starting point of the resource allocation, the line segment represents a period of application of the resource, and the second box represents the end of the resource allocation.
  • resource allocation node generator 215 identifies allocation of bottleneck resources with a unique visual notation.
  • Element 450 of FIG. 4 (two shaded square boxes connected by a line segment) exemplifies a unique visual symbol that is used, in one embodiment of the present technology, to represent allocation of a bottleneck or constrained resource.
  • resource allocation node generator 215 uses a unique visual notation to represent a resource utilization path of resources that are used for a longer period of time, such as a period of time that spans multiple activities represented by multiple activity nodes.
  • Element 445 of FIG. 4 , (a line segment) exemplifies a unique visual symbol that is used in one embodiment of the present technology to represent a resource allocated over a period of time or allocated in association with more than one activity.
  • a longer line segment extended between the start point and end point boxes of element 440 or 450 represents a longer resource allocation time, while a shorter line segment represents a shorter resource allocation time.
  • a resource allocation path that spans multiple activity nodes is visually indicative of a resource utilized in conjunction with a plurality of work activities associated with the activity nodes that are encompassed by the lengthwise span of the resource utilization path and the start and end points of the resource allocation node.
  • resource allocation nodes 440 a , 440 b , and resource utilization path 445 a are exemplary of such a resource utilization path that spans multiple activity nodes.
  • Resource allocation nodes 440 g , 440 h , and resource allocation path 445 c are another such example.
  • Resource allocation nodes 450 a , 450 b , and resource utilization path 445 b are exemplary of a bottleneck resource utilization path that spans multiple activity nodes.
  • Resource allocation nodes 440 c - 440 d (bottleneck resource)
  • 440 e - 440 f , and 440 i - 440 j are examples of resource allocations that do not span multiple activity nodes.
  • resource allocation node generator 215 also associates a textual label with a resource allocation node, such as, for example, by displaying a textual label adjacent to the resource allocation node.
  • Resource allocation node label 541 a of FIG. 5 “Forklift Operator Time”, is exemplary of one embodiment of such a textual label displayed adjacent to resource allocation node 440 a .
  • Resource allocation node labels 541 b , 541 c , 541 d , 541 e , and 541 f are other examples of textual labels.
  • Such resource allocation node labels give a quick visual indication of what resource is represented by a resource allocation node.
  • system 200 of the present technology for visual workflow process notation and layout, generates a legend.
  • System 200 generates the legend for display on a display device, for instance, in conjunction with or separately from the display of a workflow process.
  • the legend that is generated and displayed explains the visual notations and representations used to portray elements of the workflow process, such as in a workflow process graphical user interface or in a unified visual representation of a workflow process.
  • Legend 400 of FIG. 4 is an example of a legend generated by an embodiment of the present technology.
  • Legend 400 is comprised of visual notation elements 405 , 410 , 420 , 430 , 435 , 440 , 445 , and 450 (all previously described).
  • Each visual notation element ( 405 , 410 , 420 , 430 , 435 , 440 , 445 , and 450 ) is presented in conjunction with a label that describes what the visual notation element is used for. For example the label “Workflow Path” is presented in conjunction with element 405 , which is the visual notation element for a workflow path.
  • metric generator 215 of the present technology for visual workflow process notation and layout, displays a message near an activity node.
  • Metric generator 215 is configured to generate and display metrics on a display device, such as display device 118 ( FIG. 1 ).
  • the metric is generated for display as part of a graphical user interface or as part of a unified visual representation of a workflow process.
  • the message box conveys textual information related to performance metric of the activity node.
  • the message box conveys information related to a time for performing a work activity associated with the activity node that the message box is displayed near.
  • a time displayed in a message box is a measured time for actually completing the activity, such as a piece of work, associated with the activity node. While in other embodiments, the time displayed is the time allocated by a manager for completion of an activity associated with an activity node.
  • Message box 570 of FIG. 5 is an example of such a message box. Message box 570 indicates that one piece of steel round is being created in five minutes of time, by the activity associated with activity node 420 a.
  • Metric generator 220 receives source information for generating performance metrics via: manual user inputs (such as through computer system 100 or some similar input method); via information retrieval from files or data structures such as electronically stored Pert charts, Gant charts, routing structures, or BOM structures; via measurements or samplings of actual performance of work activities, or via some combination of these sources.
  • Metric generator 215 uses the received source information, which is related to performance of work activities in a workflow process, to generate a metric or metrics for display adjacent to an activity node associated with the work activity.
  • this performance metric takes the form of a text box, as was described in conjunction with step 350 of FIG. 3 .
  • this performance metric takes the form of a graphical representation of data, such as a trend bar, pie graph, histogram, or other graphical representation of data.
  • metric generator 215 of the present technology for visual workflow process notation and layout, exhibits a trend bar adjacent to an activity node.
  • the trend bar provides a summarized graphical performance metric of a work activity that is associated with an activity node.
  • Trend bar 560 of FIG. 5 is an example of such a trend bar.
  • Trend bar 560 presents a summarized visual display of two related metrics, such as present throughput efficiency of a work activity and the historical trend of that throughput over a period of time. The functioning of trend bar 560 is additionally described in conjunction with FIGS. 6A and 6B .
  • selecting trend bar 560 causes trend bar 560 to display a more detailed version of the summarized graphical performance metric that was displayed prior to the selection.
  • selecting a metric, such as a trend bar, displayed near an activity node causes the source data for the metric to be displayed for viewing, and in some embodiments, user manipulation and/or alteration.
  • FIG. 6A shows an enlarged view of trend bar 560 .
  • Trend bar 560 is exhibited on workflow path 405 a .
  • Trend bar 560 is associated with and disposed adjacent to activity node 420 a .
  • Activity node 420 a represents the activity of casting billets, as represented by activity node label 411 c , “Cast Billets”.
  • trend bar 560 displays a summarized performance metric for the billet casting activity with utilization bar 601 and trend line 605 .
  • Utilization bar 601 is divided into two sections, 603 and 604 , by a present level of utilization indicator line 602 .
  • Shaded region 604 represents a percentage of performance, such as capacity, which is being attained by the billet casting activity of node 420 a .
  • Unshaded region 603 represents a percentage of performance, such as capacity, which is unattained by the billet casting activity of node 420 a.
  • FIG. 6B also shows trend bar 560 exhibited on workflow path 405 a .
  • Trend bar 560 is still associated with and disposed adjacent to activity node 420 a .
  • trend bar 560 uses utilization bar 601 and trend line 605 to display a more detailed representation of the summarized performance metric displayed in FIG. 6A .
  • This more detailed view is shown in response to a user selection of trend bar 560 , such as, for example, with cursor 610 .
  • utilization bar 601 is divided into two sections, 603 and 604 , by a present level of utilization indicator line 602 .
  • Shaded region 604 still represents a percentage of performance, such as capacity, which is being attained by the billet casting activity of node 420 a .
  • Unshaded region 603 still represents a percentage of performance, such as capacity, which is unattained by the billet casting activity of node 420 a .
  • trend line 605 now shows a detailed trend graph of changing data over some pre-specified period of time.
  • labels such as labels 605 and 606 , are added to show more detail about the metric being displayed.
  • FIG. 7 is a flow diagram 700 of operations performed in accordance with one embodiment of the present technology for visual workflow process notation and layout. More specifically, FIG. 7 illustrates a flow diagram 700 of an exemplary embodiment of a method for displaying a unified visual representation of a workflow process on a display device. Elements of flow diagram 700 are described below in conjunction with reference to portions of system 200 of FIG. 2 , flow diagram 300 of FIG. 3 , and workflow process layout 800 of FIG. 8 .
  • FIG. 8 represents an exemplary visual workflow process layout 800 generated in accordance with one embodiment of the present technology for visual workflow process notation and layout.
  • visual workflow process layout 800 represents a unified workflow process generated and displayed on a display device by method 700 and system 200 of the present technology.
  • Workflow process 800 is “read” from left to right, and is a workflow process for making bicycles from the raw materials of steel pipe and leather.
  • System 200 is used to generate all visual symbols and textual labels in workflow process layout 800 .
  • Much of the visual notation, comprised of labels and symbols, has been previously described in conjunction with workflow layout 500 of FIG. 5 and flow diagram 300 of FIG. 3 . In the interests of clarity and to avoid redundancy, reference is made to these previous descriptions, where possible.
  • activity node generator 205 of the present technology for visual workflow process notation and layout arranges a plurality of activity nodes along a workflow path associated with a material used in an end product.
  • the displayed workflow path comprises an end-to-end overview of an entire workflow process configured for aggregate display on a single screen of a display device.
  • Each displayed activity node, such as node 420 c or node 410 h represents an individual work activity within a process of performing work, such as a manufacturing process used to produce a product.
  • user selection of some portion of the displayed unified visual representation of the workflow process causes a more detailed view of that portion of the workflow process to be displayed. For example, in response to a user selection of activity node 420 c (steel pipe made) of FIG. 8 , workflow process 500 , which shows a detailed process of making steel pipe, is displayed.
  • activity node generator 205 operates in the previously described fashion to arrange a plurality of activity nodes, such as value added activity nodes 420 c , 420 d , 420 e , and 420 g , and non-value added activity node 410 h , along a material flow path, such as material flow path 405 b . Additionally, activity node generator 205 arranges non-value added activity node 410 i and value added activity nodes 420 f and 420 g along material flow path 405 c . Finally, activity node generator 205 also arranges value added activity node 420 g and non-value added activity node 410 j along a combined material flow path 405 d.
  • activity node generator 205 operates in the previously described fashion to arrange a plurality of activity nodes, such as value added activity nodes 420 c , 420 d , 420 e , and 420 g , and non-value added activity node 410 h , along a material flow path
  • arranging a plurality of activity nodes along a workflow path associated with material used in a product comprises combining a plurality of workflow paths to illustrate a production process.
  • workflow path 405 b is associated with steel pipe being welded into frames and assembled into bicycles
  • workflow path 405 c is associated with leather being assembled into seats that are then assembled into bicycles.
  • These workflow paths are combined and merge into workflow path 405 d to show a bicycle production process.
  • separate workflow paths are shown in a distinct fashion, such as in different colors, so that they may be easily visually differentiated.
  • activity node generator 205 of the present technology for visual workflow process notation and layout displays a textual label adjacent to one or more of the of the activity nodes that have been arranged along a workflow path.
  • Each displayed activity node such as node 420 c or node 410 h , represents an individual work activity within a process of performing work to produce a product.
  • value added activity 420 c represents steel pipe being made in the process of producing bicycles.
  • activity node generator 205 has rendered textual activity node label 411 p , “Steel Pipe Made” adjacent to activity node 420 c .
  • Activity node generator 205 has also generated labels 411 q , 411 r , 411 s , 411 t , 411 u , 411 v , and 411 w , which provide descriptions of the individual work activities represented by the activity nodes they are respectively displayed adjacent to.
  • Each of the activity nodes, in FIG. 8 is arranged on workflow paths 405 b , 405 c , and 405 d in representation of the order of performance of the work activities within the illustrated workflow process of performing work to produce and ship bicycles.
  • metric generator 220 of the present technology for visual workflow process notation and layout exhibits a summarized graphic performance metric adjacent to one or more of the activity nodes arrayed along workflow paths 405 b , 405 c , and 405 d of FIG. 8 .
  • Much of the functionality metric generator 220 was previously described in conjunction with steps 350 and 360 of flow diagram 300 .
  • Metric generator 220 operates in this previously described fashion to exhibit summarized textual and/or graphical performance metrics.
  • Each displayed performance metric provides information regarding the performance of the work activity represented by the particular activity node that the metric is displayed adjacent to.
  • metric generator 220 has generated graphical performance metrics 560 b , 560 c , 560 d , and 560 e , and textual performance metrics 570 b , 570 c , 570 d , and 570 e .
  • These performance metrics display visual summaries of the performance of an activity.
  • trend bar 560 b represents a summarized metric of the performance of activity of cutting ( 411 r ) that is represented by activity node 420 d .
  • text message metric 570 b represents a summarized metric of the performance of activity of cutting ( 411 r ) that is represented by activity node 420 d.
  • the displayed performance metrics are configured to display a more detailed version of the summarized graphic performance metric in response to a user selection.
  • Trend bar 560 e which is displayed adjacent to activity node 420 g is an example of a more detailed graphical performance metric that is displayed in response to a user selection, such as with cursor 610 .
  • trend bar 560 e shows a utilization bar with two shaded regions 805 and 810 , an unshaded region 820 , and a trend graph 830 .
  • Shaded region 805 displays a percentage of performance related to workflow path 405 c .
  • Shaded region 810 shows percentage of performance related to workflow path 405 b .
  • Unshaded region 820 shows remaining capability, such as unattained performance capacity.
  • Trend graph 830 shows a detailed graph of performance data over a pre-specified period of time.
  • a displayed performance metric such as summarized graphical performance metric is configured to display source data that is used to create the summarized graphical performance metric.
  • the present technology displays the source data for trend bar 560 e in response to an additional selection via cursor 610 .
  • the displayed source data can then be viewed and/or edited by a user.

Abstract

In a method of a technology for visual workflow process notation and layout, a workflow process graphical user interface is generated. A plurality of activity nodes is arranged along a workflow path, with each activity node representing a work activity. The activity nodes are arranged on the workflow path in representation of an order of performance of work activities within the process of performing work. A material flow path is arranged adjacent to the workflow path. The material flow path is representative of a flow of a material through the work activities associated with the plurality of activity nodes. A resource allocation node is disposed adjacent to a portion of the material flow path and one of said activity nodes. The resource allocation node represents a resource utilized in performing a work activity, represented by the adjacent activity node, upon a material represented by the portion of the material flow path.

Description

BACKGROUND
In business management environments, especially in production and manufacturing processes, many tools are used to represent the activities involved in the processes that are used to perform a task or to create a product. These tools give managers insight into information, such as: details of individual activities, materials consumed, time spent, costs involved, products created, and a variety of other data necessary to understand, manage and improve the processes.
In a manufacturing process, such as, for example, a bicycle building process, it is desirable to represent the process used to build a product. To do this, two data structures are typically used. The first data structure is a Bill of Materials (BOM). The second data structure is a Routing. Both data structures are typically stored electronically, but can also be displayed in printed form.
The BOM data structure represents the component parts and end products that will be produced or used at steps in the production process. A BOM structure may take the form of a table, but is typically shown as a tree-shaped list. A BOM tree fans out from a top level product to show component and sub-component parts that the top level product is comprised of. For instance, with a top level product of a bicycle, example component parts shown as branches might be frames and seats. Sub-components shown as additional branches stemming from a frame component branch might be types of steel pipe. While sub-components shown as additional branches stemming from a seat component branch might be leather and foam padding. In some instances, a single BOM tree may be used to describe a bill of materials for an entire production process, such as the process of making bicycles. In other instances, many separate BOMs may be used to show bills of material for raw materials and component parts that are used in production of an end product, such as a bicycle.
The routing data structure describes or traces a path that that each part and end product will take through a production facility, such as between work stations and inventory locations. If multiple production sites or factories are involved in a production process, the routing will also trace part and product paths between production sites. Routing structures can be displayed as trees, but are more typically displayed as tables of rows and columns similar to those of a spread sheet. Routing structures contain information describing the activities performed on the parts listed in the BOM, such as: labor, machine time, or scheduling information related to a particular activity. A product routing may be described in a single routing data structure, or many smaller routing data structures.
BOM and routing structures are typically used by managers to plan logistics, costs, and production schedules for a manufacturing process. For instance, if a market exists for 1000 bicycles, a manager can determine, through analysis of these structures, where and when to produce the components of these bicycles so that the correct number of end products can be manufactured. Further analysis of these data structures can help a manufacturer determine how much a product will cost to produce, and where the costs are generated.
A third data structure type, called a process flow diagram, also exists. The process flow diagram visually displays steps in a process. Examples of such process flow diagrams include flow charts, Gant charts, and Pert charts. However process flow diagrams currently in use contain very little, if any, information used by managers. These process flow diagrams are instead typically used by process engineers and production schedulers to visually represent, design, and operate a process, rather than by managers who manage the process.
These separate data structures are useful, but have many drawbacks. For instance, it is very difficult to see all parts of a process at once, as the components and activities are represented in at least two, and sometimes many more separate data structures. Further, even if all parts can be seen at once it can be challenging to visualize a process flow from data tables and tree structures. Another drawback is that different disciples such as managing and engineering rely on different structures to describe the same process. Further, because different data structures exist, it is hard to correlate the information during planning. It is also difficult to keep the information in sync when the process is running. These difficulties in correlating and syncing data can lead to mistakes which negatively impact cost, schedule, and performance of a process. It is also very difficult to improve a process when it cannot be visualized in its entirety.
SUMMARY
This Summary is provided to introduce a selection of concepts in a simplified form that are further described below in the Detailed Description. This Summary is not intended to identify key features or essential features of the claimed subject matter, nor is it intended to be used as an aid in determining the scope of the claimed subject matter.
A technology for visual workflow process notation and layout is disclosed. The technology represents elements and activities of workflow processes with a notation comprised of visually distinct symbols. In one method approach, a workflow process graphical user interface (GUI) is generated and displayed by a system that lays out portions of a workflow process using the visual workflow process notation. Activity nodes are arranged along a workflow path, with each activity node representing a work activity that is performed in the workflow process that the GUI is being generated for. The activity nodes are arranged on the workflow path in representation of the order of performance of work activities within the workflow process. In some embodiments, textual labels are added to portions of the graphical user interface. In some embodiments, graphical and/or textual performance metrics are also added to portions of the GUI that is displayed.
A material flow path is then optionally arranged adjacent to the workflow path. The material flow path is representative of a flow of a material through the work activities associated with the plurality of activity nodes. A resource allocation node is then optionally disposed adjacent to a portion of the material flow path and one of the activity nodes. The resource allocation node symbolizes a resource utilized in performing a work activity, represented by the adjacent activity node, upon a material represented by the adjacent portion of the material flow path. A plurality of resource allocation nodes may be used, as required to illustrate the workflow process.
DESCRIPTION OF THE DRAWINGS
The accompanying drawings, which are incorporated in and form a part of this specification, illustrate embodiments of the technology for visual workflow process notation and layout and, together with the description, serve to explain principles discussed below:
FIG. 1 is a diagram of an exemplary computer system used in accordance with embodiments of the present technology for visual workflow process notation and layout.
FIG. 2 is a diagram of one embodiment of a system for visual workflow process notation and layout.
FIG. 3 is a flow diagram of operations performed in accordance with one embodiment of the present technology for visual workflow process notation and layout.
FIG. 4 is a representation of an exemplary visual workflow process notation generated in accordance with one embodiment of the present technology for visual workflow process notation and layout.
FIG. 5 is a representation of an exemplary visual workflow process layout generated in accordance with one embodiment of the present technology for visual workflow process notation and layout.
FIG. 6A is a representation of an exemplary metric generated in accordance with one embodiment of the present technology for visual workflow process notation and layout.
FIG. 6B is a representation of an exemplary metric generated in accordance with one embodiment of the present technology for visual workflow process notation and layout.
FIG. 7 is a flow diagram of operations performed in accordance with one embodiment of the present technology for visual workflow process notation and layout.
FIG. 8 is a representation of an exemplary visual workflow process layout generated in accordance with one embodiment of the present technology for visual workflow process notation and layout.
The drawings referred to in this description should be understood as not being drawn to scale except if specifically noted.
DETAILED DESCRIPTION
Reference will now be made in detail to embodiments of the present technology for identifying design issues in electronic forms, examples of which are illustrated in the accompanying drawings. While the technology for visual workflow process notation and layout will be described in conjunction with various embodiments, it will be understood that they are not intended to limit the present technology for visual workflow process notation and layout to these embodiments. On the contrary, the presented technology for visual workflow process notation and layout is intended to cover alternatives, modifications and equivalents, which may be included within the spirit and scope the various embodiments as defined by the appended claims. Furthermore, in the following detailed description, numerous specific details are set forth in order to provide a thorough understanding of the present technology for visual workflow process notation and layout. However, the present technology for visual workflow process notation and layout may be practiced without these specific details. In other instances, well known methods, procedures, components, and circuits have not been described in detail as not to unnecessarily obscure aspects of the present embodiments.
Unless specifically stated otherwise as apparent from the following discussions, it is appreciated that throughout the present detailed description, discussions utilizing terms such as “arranging”, “disposing”, “displaying”, “exhibiting”, “configuring”, “selecting”, “populating”, “utilizing”, “rendering”, “denoting”, “extending”, “combining”, “generating”, and “receiving”, or the like, refer to the actions and processes of a computer system (such as computer 100 of FIG. 1), or similar electronic computing device. The computer system or similar electronic computing device manipulates and transforms data represented as physical (electronic) quantities within the computer system's registers and memories into other data similarly represented as physical quantities within the computer system memories or registers or other such information storage, transmission, or display devices. The present technology for visual workflow process notation and layout is also well suited to the use of other computer systems such as, for example, optical, virtual, and mechanical computers. Additionally, it should be understood that in embodiments of the present technology for visual workflow process notation and layout, one or more of the steps can be performed manually.
Example Computer System Environment
With reference now to FIG. 1, portions of the technology for visual workflow process notation and layout are composed of computer-readable and computer-executable instructions that reside, for example, in computer-usable media of a computer system. That is, FIG. 1 illustrates one example of a type of computer that can be used to implement embodiments, which are discussed below, of the present technology for visual workflow process notation and layout. FIG. 1 illustrates an exemplary computer system 100 used in accordance with embodiments of the present technology for visual workflow process notation and layout. It is appreciated that system 100 of FIG. 1 is exemplary only and that the present technology for visual workflow process notation and layout can operate on or within a number of different computer systems including general purpose networked computer systems, embedded computer systems, routers, switches, server devices, client devices, various intermediate devices/nodes, stand alone computer systems, and the like. As shown in FIG. 1, computer system 100 of FIG. 1 is well adapted to having peripheral computer readable media 102 such as, for example, a floppy disk, a compact disc, and the like coupled thereto.
System 100 of FIG. 1 includes an address/data bus 104 for communicating information, and a processor 106A coupled to bus 104 for processing information and instructions. As depicted in FIG. 1, system 100 is also well suited to a multi-processor environment in which a plurality of processors 106A, 106B, and 106C are present. Conversely, system 100 is also well suited to having a single processor such as, for example, processor 106A. Processors 106A, 106B, and 106C may be any of various types of microprocessors. System 100 also includes data storage features such as a computer usable volatile memory 108, e.g. random access memory (RAM), coupled to bus 104 for storing information and instructions for processors 106A, 106B, and 106C. System 100 also includes computer usable non-volatile memory 110, e.g. read only memory (ROM), coupled to bus 104 for storing static information and instructions for processors 106A, 106B, and 106C. Also present in system 100 is a data storage unit 112 (e.g., a magnetic or optical disk and disk drive) coupled to bus 104 for storing information and instructions. System 100 also includes an optional alphanumeric input device 114 including alphanumeric and function keys coupled to bus 104 for communicating information and command selections to processor 106A or processors 106A, 106B, and 106C. System 100 also includes an optional cursor control device 116 coupled to bus 104 for communicating user input information and command selections to processor 106A or processors 106A, 106B, and 106C. System 100 of the present embodiment also includes an optional display device 118 coupled to bus 104 for displaying information.
Referring still to FIG. 1, optional display device 118 of FIG. 1, may be a liquid crystal device, cathode ray tube, plasma display device or other display device suitable for creating graphic images and alphanumeric characters recognizable to a user. Optional cursor control device 116 allows the computer user to dynamically signal the movement of a visible symbol (cursor) on a display screen of display device 118. Many implementations of cursor control device 116 are known in the art including a trackball, mouse, touch pad, joystick or special keys on alpha-numeric input device 114 capable of signaling movement of a given direction or manner of displacement. Alternatively, it will be appreciated that a cursor can be directed and/or activated via input from alpha-numeric input device 114 using special keys and key sequence commands. System 100 is also well suited to having a cursor directed by other means such as, for example, voice commands. System 100 also includes an I/O device 120 for coupling system 100 with external entities. For example, in one embodiment, I/O device 120 is a modem for enabling wired or wireless communications between system 100 and an external network such as, but not limited to, the Internet.
Referring still to FIG. 1, various other components are depicted for system 100. Specifically, when present, an operating system 122, applications 124, modules 126, and data 128 are shown as typically residing in one or some combination of computer usable volatile memory 108, e.g. random access memory (RAM), and data storage unit 112. In one embodiment, the present technology for visual workflow process notation and layout, for example, is stored as an application 124 or module 126 in memory locations within RAM 108 and memory areas within data storage unit 112
Exemplary System for Generating Visual Workflow Process Notations and Layouts
FIG. 2 shows a block diagram of components of an exemplary system 200 which generates visual workflow process notations and layouts, according to one embodiment of the present technology. The following discussion will begin with a description of the physical structure of system 200. Discussion will turn to description of components of system 200 used in an exemplary method for generating a workflow process graphical user interface. An exemplary notation and layout created using the exemplary method will be described Discussion will proceed to a description of components of system 200 used in an exemplary method for displaying a unified visual representation of a workflow process on a display device in a computer system. An exemplary unified visual representation generated using the exemplary method will be described.
Physical Structure
With respect to the physical structure, system 200 is comprised of an activity node generator 205, a material flow path generator 210, a resource allocation node generator 215, and a metric generator 220 which are all coupled to one another and configure to couple to a common input/output bus such as bus 104 (FIG. 1). In one embodiment of the present technology, system 200 is also configured to couple, for example via bus 104, to computer system 100 and display device 118 (both of FIG. 1). In another embodiment of the present technology, not illustrated, system 200 takes the form of an application 124 (FIG. 1) that is resident on portions of computer system 100. System 200 is configured to generate elements of a workflow process layout for visual display on a display device, such as display device 118.
Exemplary Methods of Operation
The following discussion sets forth in detail the operation of present technology for visual workflow process notation and layout. With reference to FIGS. 3 and 7, flow diagrams 300 and 700 each illustrate exemplary steps used by various embodiments of the present technology for visual workflow process notation and layout. Flow diagrams 300 and 700 include processes that, in various embodiments, are carried out by a processor under the control of computer-readable and computer-executable instructions. The computer-readable and computer-executable instructions reside, for example, in data storage features such as computer usable volatile memory 108, computer usable non-volatile memory 110, and/or data storage unit 112 of FIG. 1. The computer-readable and computer-executable instructions are used to control or operate in conjunction with, for example, processor 106A and/or processors 106A, 106B, and 106C of FIG. 1. Although specific steps are disclosed in flow diagrams 300 and 700, such steps are exemplary. That is, embodiments are well suited to performing various other steps or variations of the steps recited in flow diagrams 300 and 700. It is appreciated that the steps in flow diagrams 300 and 700 may be performed in an order different than presented, and that not all of the steps in flow diagrams 300 and 700 may be performed.
Generating a Workflow Process Graphical User Interface
FIG. 3 is a flow diagram 300 of operations performed in accordance with one embodiment of the present technology for visual workflow process notation and layout. More specifically, FIG. 3 illustrates a flow diagram 300 of an exemplary embodiment of a method for generating a workflow process graphical user interface. Elements of system 200 and flow diagram 300 are explained below, in conjunction with workflow layout 500 of FIG. 5 and visual notation legend 400 of FIG. 4.
FIG. 5 represents an exemplary visual workflow process layout 500 generated in accordance with one embodiment of the present technology for visual workflow process notation and layout. For example, in one embodiment, visual workflow process layout 500 represents a workflow process graphical user interface generated and displayed by method 300 and system 200 of the present technology. In the displayed embodiment, workflow process 500 is “read” from upper left to lower right, and is a workflow process for making steel pipe from the raw material of steel ingots. In other embodiments of the present technology, workflow process 500 is arranged and read in the direction that matches cultural reading and writing conventions. For example right to left and from top to bottom is the reading and writing convention in some cultures. System 200 is used to generate all visual symbols and textual labels in workflow process layout 500. For instance, starting label 501 is generated by system 200. Other labels and symbols in visual layout 500 are described below, in conjunction with applicable portions of system 200 or flow diagram 300.
At step 310 of flow diagram 300, in one embodiment, activity node generator 205, of the present technology for visual workflow process notation and layout, arranges a plurality of activity nodes along a workflow path. Activity node generator 205 is configured to generate activity nodes and a workflow path for display on a display device, such as display device 118. In one embodiment, the activity nodes and workflow path are generated and displayed as part of a graphical user interface of a workflow process or a unified visual representation of a workflow process. Each activity node represents an individual work activity or event that occurs in a process of performing work, such as, for example, in a manufacturing process. Activity node generator 205 then arranges the activity nodes along the workflow path in representation of an order of performing work within the process that is being visually represented.
Activity node generator 205 receives information for generating activity nodes via: manual user inputs (such as through computer system 100 or some similar input method); via information retrieval from files or data structures such as electronically stored Pert charts, Gant charts, routing structures, or BOM structures; or via some combination of manual input and retrieval from stored electronic information.
Activity node generator 205 generates activity nodes to represent both value added and non-value added work activities and events. Value added work activities and events are those that increase the value of a product, for instance by transforming a raw material into a different form. Non-value added activities or events are those that do not increase the value of a product. Some examples of a non-value added activities are events such as moving a component from one place to another place in a warehouse or transporting a component from one station to another station in a manufacturing line.
In one embodiment of the present technology, activity node generator 205 generates separate visual symbols to represent value added and non-value added activity nodes. Value added activity node symbol 420 and non-value added activity node symbol 410, both of FIG. 4, exemplify an embodiment of separate visual symbols used to represent value added and non-value added activity nodes. In some embodiments, other visual symbols are also generated for sub-classifications of value added and non-value added activities and/or for other classifications of activities.
In one embodiment of the present technology, activity node generator 205 arranges activity nodes along a workflow path by populating a first end of the workflow path with an initial activity node, such as non-value added activity node 410 a of FIG. 5. The initial activity node represents a first work activity or event in a process of production, manufacturing, or some other type of work. Activity node generator 205 populates a second end of the workflow path with a terminal activity node, such as non-value added activity node 410 g of FIG. 5. The terminal activity node represents a final work activity or event in the process of production, manufacturing, or some other type of work. Activity node generator 205 populates the work flow path with activity nodes associated with intermediate work activities. Non-value added activity nodes 410 b, 410 c, 410 d, 410 e, and 410 f, and value added activity nodes 420 a and 420 b, all of FIG. 5, are examples of intermediate activity nodes. Activity node generator 205 arranges these intermediate activity nodes in sequential order of occurrence along the workflow path between the initial activity node and the terminal activity node of the workflow process.
In one embodiment, activity node generator 205 renders a textual label adjacent to one of more of the activity nodes. The textual label describes the work activity or event that the activity node represents. Activity node label 511 a of FIG. 5, “Delivered”, is an example of such a label. In one embodiment, the textual label also comprises a step number to denote its place in a sequential order of performance of the activities in the represented workflow process. Activity node label 511 b of FIG. 5, “1Inspected”, is an example of such a label. Activity node label 511 b represents the first activity performed in a workflow process. Labels 511 c, 511 d, 511 e, 511 f, 511 g, 511 h, and 511 i are other examples of activity node labels shown in FIG. 5.
Activity node generator 205, of the present technology, uses a unique visual notation to represent a workflow path. Element 405 of FIG. 4, a thick line, represents one embodiment of a visual notation for a workflow path. Workflow path 405 a of FIG. 5 shows an example of this notation in use. In some embodiments, the visual notation for a work flow path can comprise lines similar to element 405 that are configured in a variety of colors, shadings, or visual textures to represent distinct workflow paths or distinct portions of a workflow path.
In one embodiment, activity node generator 205 automatically scales and arranges the workflow path that is generated, such that an end-to-end overview of a workflow process is displayed in aggregate on a single screen of a display device. This is useful, for example, so that a manager can get a quick overview of the activities and other information associated with a workflow process. FIG. 8 represents such an example of such an end-to-end overview. In one embodiment, one or more selectable portions of a displayed workflow process layout are configured to display in an enlarged fashion in response to a user selection. This allows the selectable portions to display more detailed process information when enlarged. It also reduces the visual complexity a top-level workflow process graphical user interface. Value added activity node 420 c, “ 1Steel Pipe Made”, of FIG. 8 represents a selectable portion that can be enlarged. For example, in response to a user selection of activity node 420 c, workflow process 500 of FIG. 5 is displayed to show an enlarged, more detailed workflow process diagram of the process for making steel pipe from ingots of steel.
At step 320 of flow diagram 300, in one embodiment, material flow path generator 210, of the present technology for visual workflow process notation and layout, arranges a material flow path for display adjacent to the workflow path generated by activity node generator 205. In one embodiment, the material flow path generator is configured to generate a material flow path for display adjacent to the workflow path on a display device such as display device 118 (FIG. 1). In one embodiment, the material flow path is generated as part of a workflow process graphical user interface or a unified visual representation of a workflow process that is being displayed. In some embodiments where multiple materials are used in a workflow process, material flow path generator 210 generates a material flow path to represent the flow of each of the materials used in the process.
Material flow path generator 210 receives information for generating a material flow path via: manual user inputs (such as through computer system 100 or some similar input method); via information retrieval from files or data structures such as electronically stored Pert charts, Gant charts, routing structures, or BOM structures; or via some combination of manual input and retrieval from stored electronic information.
Material flow path generator 210 uses a unique visual notation to represent a flow of material, such as a raw material or transformed intermediate material, through the various work activities associated with the plurality of activity nodes generated by activity node generator 205. Dashed line 430 of FIG. 4, and dashed line 430 a of FIG. 5, each exemplify an embodiment of a unique visual symbol that is used in one embodiment of the present technology to represent a material flow path.
In one embodiment, material flow path generator 210 also uses a unique visual notation to represent transformations of a material. These transformations are, for example, transformations that take place due to value added activities that are performed on a material. Element 435, of FIG. 4, (a notch shaped dashed line) exemplifies one embodiment of a unique visual notation that is used in one embodiment of the present technology to denote a transformation of a material on a material flow path. Using such visual notations, material flow path generator 210 denotes transformation points on the material flow path to represent transformational stages. An example of a transformational stage, is a transformative step in the process of creating a finished product from a raw material. For example, in FIG. 5, transformation point 435 a, indicates where the activity of casting billets, represented by 420 a, transforms steel ingot material into steel round. Similarly, transformation point 435 b indicates where the activity of sawing, represented by 420 b, transforms the material of steel round into steel pipe.
In one embodiment, material flow path generator 210 also associates textual labels with a material flow path, such as, for example, by inserting one or more textual labels into the material flow path. Material flow path label 531 a of FIG. 5, “Steel Ingot”, is exemplary of one embodiment of such a textual label. Such labels give a quick visual indication of what material is represented by a flow path. In one embodiment, such labels are modified after material transformations occur on a material flow path. Material flow path label 531 b of FIG. 5, “Steel Round”, is an example of a label that has been modified following a transformation, indicated by 435 a, which occurred in a material flow path 430 a. Material flow path label 531 c, “Steel Pipe”, is another such label that shows a modification to a material following a transformation, indicated by 435 b, which occurred in material flow path 430 a.
At step 330 of flow diagram 300, in one embodiment, resource allocation node generator 215, of the present technology for visual workflow process notation and layout, disposes a resource allocation node adjacent to a portion of one of the activity nodes and/or the material flow path. Resource allocation node generator is configured to generate resource allocation nodes for display on a display device, such as display device 118 (FIG. 1). The resource allocation node represents a resource utilized in performing a work activity represented by the adjacent activity node upon the material represented by the adjacent portion of the material flow path. In one embodiment, a resource allocation node is generated for display adjacent to the workflow path and/or material flow path displayed on a display device, for example, as part of a graphical user interface or as part of a unified visual representation of a workflow process. In an embodiment where multiple resources are allocated to perform an activity represented by an activity node, resource allocation node generator 215 generates multiple resource allocation nodes for display adjacent to the activity node.
Resource allocation node generator 215 receives information for generating resource allocation nodes via: manual user inputs (such as through computer system 100 or some similar input method); via information retrieval from files or data structures such as electronically stored Pert charts, Gant charts, routing structures, or BOM structures; or via some combination of manual input and retrieval from stored electronic information.
Resource allocation node generator 215 uses a unique visual notation to represent application of resources, such as: human labor, machine labor, or other such resources to perform an activity in a workflow process. Element 440, of FIG. 4, (two white square boxes connected by a line segment) exemplifies a unique visual symbol that is used in one embodiment of the present technology to represent a resource allocation node. Viewing element 440 from left to right, the first box represents the starting point of the resource allocation, the line segment represents a period of application of the resource, and the second box represents the end of the resource allocation. In one embodiment, resource allocation node generator 215 identifies allocation of bottleneck resources with a unique visual notation. Element 450 of FIG. 4, (two shaded square boxes connected by a line segment) exemplifies a unique visual symbol that is used, in one embodiment of the present technology, to represent allocation of a bottleneck or constrained resource.
In one embodiment, resource allocation node generator 215 uses a unique visual notation to represent a resource utilization path of resources that are used for a longer period of time, such as a period of time that spans multiple activities represented by multiple activity nodes. Element 445, of FIG. 4, (a line segment) exemplifies a unique visual symbol that is used in one embodiment of the present technology to represent a resource allocated over a period of time or allocated in association with more than one activity. For example, in one embodiment, a longer line segment extended between the start point and end point boxes of element 440 or 450 represents a longer resource allocation time, while a shorter line segment represents a shorter resource allocation time. Thus, a resource allocation path that spans multiple activity nodes is visually indicative of a resource utilized in conjunction with a plurality of work activities associated with the activity nodes that are encompassed by the lengthwise span of the resource utilization path and the start and end points of the resource allocation node.
Referring to FIG. 5, resource allocation nodes 440 a, 440 b, and resource utilization path 445 a, are exemplary of such a resource utilization path that spans multiple activity nodes. Resource allocation nodes 440 g, 440 h, and resource allocation path 445 c are another such example. Resource allocation nodes 450 a, 450 b, and resource utilization path 445 b, are exemplary of a bottleneck resource utilization path that spans multiple activity nodes. Resource allocation nodes 440 c-440 d (bottleneck resource), and 440 e-440 f, and 440 i-440 j are examples of resource allocations that do not span multiple activity nodes.
In one embodiment, resource allocation node generator 215 also associates a textual label with a resource allocation node, such as, for example, by displaying a textual label adjacent to the resource allocation node. Resource allocation node label 541 a of FIG. 5, “Forklift Operator Time”, is exemplary of one embodiment of such a textual label displayed adjacent to resource allocation node 440 a. Resource allocation node labels 541 b, 541 c, 541 d, 541 e, and 541 f, are other examples of textual labels. Such resource allocation node labels give a quick visual indication of what resource is represented by a resource allocation node.
At step 340 of flow diagram 300, in one embodiment, system 200, of the present technology for visual workflow process notation and layout, generates a legend. System 200 generates the legend for display on a display device, for instance, in conjunction with or separately from the display of a workflow process. The legend that is generated and displayed explains the visual notations and representations used to portray elements of the workflow process, such as in a workflow process graphical user interface or in a unified visual representation of a workflow process. Legend 400 of FIG. 4 is an example of a legend generated by an embodiment of the present technology. Legend 400 is comprised of visual notation elements 405, 410, 420, 430, 435, 440, 445, and 450 (all previously described). Each visual notation element (405, 410, 420, 430, 435, 440, 445, and 450) is presented in conjunction with a label that describes what the visual notation element is used for. For example the label “Workflow Path” is presented in conjunction with element 405, which is the visual notation element for a workflow path.
At step 350 of flow diagram 300, in one embodiment, metric generator 215, of the present technology for visual workflow process notation and layout, displays a message near an activity node. Metric generator 215 is configured to generate and display metrics on a display device, such as display device 118 (FIG. 1). In one embodiment the metric is generated for display as part of a graphical user interface or as part of a unified visual representation of a workflow process. The message box conveys textual information related to performance metric of the activity node. In one embodiment, the message box conveys information related to a time for performing a work activity associated with the activity node that the message box is displayed near. For example, in some embodiments, a time displayed in a message box is a measured time for actually completing the activity, such as a piece of work, associated with the activity node. While in other embodiments, the time displayed is the time allocated by a manager for completion of an activity associated with an activity node. Message box 570 of FIG. 5 is an example of such a message box. Message box 570 indicates that one piece of steel round is being created in five minutes of time, by the activity associated with activity node 420 a.
Metric generator 220 receives source information for generating performance metrics via: manual user inputs (such as through computer system 100 or some similar input method); via information retrieval from files or data structures such as electronically stored Pert charts, Gant charts, routing structures, or BOM structures; via measurements or samplings of actual performance of work activities, or via some combination of these sources.
Metric generator 215 uses the received source information, which is related to performance of work activities in a workflow process, to generate a metric or metrics for display adjacent to an activity node associated with the work activity. In some embodiments, this performance metric takes the form of a text box, as was described in conjunction with step 350 of FIG. 3. In other embodiments, this performance metric takes the form of a graphical representation of data, such as a trend bar, pie graph, histogram, or other graphical representation of data.
At step 360 of flow diagram 300, in one embodiment, metric generator 215, of the present technology for visual workflow process notation and layout, exhibits a trend bar adjacent to an activity node. The trend bar provides a summarized graphical performance metric of a work activity that is associated with an activity node. Trend bar 560 of FIG. 5 is an example of such a trend bar. Trend bar 560 presents a summarized visual display of two related metrics, such as present throughput efficiency of a work activity and the historical trend of that throughput over a period of time. The functioning of trend bar 560 is additionally described in conjunction with FIGS. 6A and 6B. In one embodiment, selecting trend bar 560 (or any other metric displayed near an activity node), for instance with a cursor device, causes trend bar 560 to display a more detailed version of the summarized graphical performance metric that was displayed prior to the selection. In one embodiment, selecting a metric, such as a trend bar, displayed near an activity node, causes the source data for the metric to be displayed for viewing, and in some embodiments, user manipulation and/or alteration.
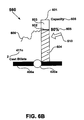
FIG. 6A shows an enlarged view of trend bar 560. Trend bar 560 is exhibited on workflow path 405 a. Trend bar 560 is associated with and disposed adjacent to activity node 420 a. Activity node 420 a represents the activity of casting billets, as represented by activity node label 411 c, “Cast Billets”. In FIG. 6A, trend bar 560 displays a summarized performance metric for the billet casting activity with utilization bar 601 and trend line 605. Utilization bar 601 is divided into two sections, 603 and 604, by a present level of utilization indicator line 602. Shaded region 604 represents a percentage of performance, such as capacity, which is being attained by the billet casting activity of node 420 a. Unshaded region 603 represents a percentage of performance, such as capacity, which is unattained by the billet casting activity of node 420 a.
FIG. 6B also shows trend bar 560 exhibited on workflow path 405 a. Trend bar 560 is still associated with and disposed adjacent to activity node 420 a. However, in FIG. 6B, trend bar 560 uses utilization bar 601 and trend line 605 to display a more detailed representation of the summarized performance metric displayed in FIG. 6A. This more detailed view is shown in response to a user selection of trend bar 560, such as, for example, with cursor 610. In FIG. 6B, as in FIG. 6A, utilization bar 601 is divided into two sections, 603 and 604, by a present level of utilization indicator line 602. Shaded region 604 still represents a percentage of performance, such as capacity, which is being attained by the billet casting activity of node 420 a. Unshaded region 603 still represents a percentage of performance, such as capacity, which is unattained by the billet casting activity of node 420 a. However, trend line 605 now shows a detailed trend graph of changing data over some pre-specified period of time. In addition, in one embodiment, labels, such as labels 605 and 606, are added to show more detail about the metric being displayed.
Displaying a Unified Visual Representation of a Workflow Process
FIG. 7 is a flow diagram 700 of operations performed in accordance with one embodiment of the present technology for visual workflow process notation and layout. More specifically, FIG. 7 illustrates a flow diagram 700 of an exemplary embodiment of a method for displaying a unified visual representation of a workflow process on a display device. Elements of flow diagram 700 are described below in conjunction with reference to portions of system 200 of FIG. 2, flow diagram 300 of FIG. 3, and workflow process layout 800 of FIG. 8.
FIG. 8 represents an exemplary visual workflow process layout 800 generated in accordance with one embodiment of the present technology for visual workflow process notation and layout. For example, in one embodiment, visual workflow process layout 800 represents a unified workflow process generated and displayed on a display device by method 700 and system 200 of the present technology. Workflow process 800 is “read” from left to right, and is a workflow process for making bicycles from the raw materials of steel pipe and leather. System 200 is used to generate all visual symbols and textual labels in workflow process layout 800. Much of the visual notation, comprised of labels and symbols, has been previously described in conjunction with workflow layout 500 of FIG. 5 and flow diagram 300 of FIG. 3. In the interests of clarity and to avoid redundancy, reference is made to these previous descriptions, where possible.
At step 710 of flow diagram 700, activity node generator 205 of the present technology for visual workflow process notation and layout arranges a plurality of activity nodes along a workflow path associated with a material used in an end product. In one such embodiment, the displayed workflow path comprises an end-to-end overview of an entire workflow process configured for aggregate display on a single screen of a display device. Each displayed activity node, such as node 420 c or node 410 h represents an individual work activity within a process of performing work, such as a manufacturing process used to produce a product. In one embodiment, user selection of some portion of the displayed unified visual representation of the workflow process causes a more detailed view of that portion of the workflow process to be displayed. For example, in response to a user selection of activity node 420 c (steel pipe made) of FIG. 8, workflow process 500, which shows a detailed process of making steel pipe, is displayed.
Much of the functionality of activity node generator 205 was previously described in conjunction with step 310 of flow diagram 300. In step 710, activity node generator 205 operates in the previously described fashion to arrange a plurality of activity nodes, such as value added activity nodes 420 c, 420 d, 420 e, and 420 g, and non-value added activity node 410 h, along a material flow path, such as material flow path 405 b. Additionally, activity node generator 205 arranges non-value added activity node 410 i and value added activity nodes 420 f and 420 g along material flow path 405 c. Finally, activity node generator 205 also arranges value added activity node 420 g and non-value added activity node 410 j along a combined material flow path 405 d.
In one embodiment, as shown in FIG. 8, arranging a plurality of activity nodes along a workflow path associated with material used in a product comprises combining a plurality of workflow paths to illustrate a production process. For example, workflow path 405 b is associated with steel pipe being welded into frames and assembled into bicycles, while workflow path 405 c is associated with leather being assembled into seats that are then assembled into bicycles. These workflow paths are combined and merge into workflow path 405 d to show a bicycle production process. In some embodiments of the present technology, separate workflow paths are shown in a distinct fashion, such as in different colors, so that they may be easily visually differentiated.
In step 720 of FIG. 7, activity node generator 205 of the present technology for visual workflow process notation and layout displays a textual label adjacent to one or more of the of the activity nodes that have been arranged along a workflow path. Each displayed activity node, such as node 420 c or node 410 h, represents an individual work activity within a process of performing work to produce a product. For example, in layout 800, value added activity 420 c represents steel pipe being made in the process of producing bicycles.
This is evident, because activity node generator 205 has rendered textual activity node label 411 p, “Steel Pipe Made” adjacent to activity node 420 c. Activity node generator 205 has also generated labels 411 q, 411 r, 411 s, 411 t, 411 u, 411 v, and 411 w, which provide descriptions of the individual work activities represented by the activity nodes they are respectively displayed adjacent to. Each of the activity nodes, in FIG. 8 is arranged on workflow paths 405 b, 405 c, and 405 d in representation of the order of performance of the work activities within the illustrated workflow process of performing work to produce and ship bicycles.
At step 730 of flow diagram 700, metric generator 220 of the present technology for visual workflow process notation and layout exhibits a summarized graphic performance metric adjacent to one or more of the activity nodes arrayed along workflow paths 405 b, 405 c, and 405 d of FIG. 8. Much of the functionality metric generator 220 was previously described in conjunction with steps 350 and 360 of flow diagram 300. Metric generator 220 operates in this previously described fashion to exhibit summarized textual and/or graphical performance metrics. Each displayed performance metric provides information regarding the performance of the work activity represented by the particular activity node that the metric is displayed adjacent to.
For example in FIG. 8, metric generator 220 has generated graphical performance metrics 560 b, 560 c, 560 d, and 560 e, and textual performance metrics 570 b, 570 c, 570 d, and 570 e. These performance metrics display visual summaries of the performance of an activity. For example, trend bar 560 b, represents a summarized metric of the performance of activity of cutting (411 r) that is represented by activity node 420 d. Likewise, text message metric 570 b represents a summarized metric of the performance of activity of cutting (411 r) that is represented by activity node 420 d.
In one embodiment of the present technology, the displayed performance metrics, such as the graphical performance metrics, are configured to display a more detailed version of the summarized graphic performance metric in response to a user selection. Trend bar 560 e, which is displayed adjacent to activity node 420 g is an example of a more detailed graphical performance metric that is displayed in response to a user selection, such as with cursor 610. As shown in FIG. 8, trend bar 560 e shows a utilization bar with two shaded regions 805 and 810, an unshaded region 820, and a trend graph 830. Shaded region 805 displays a percentage of performance related to workflow path 405 c. Shaded region 810 shows percentage of performance related to workflow path 405 b. Unshaded region 820 shows remaining capability, such as unattained performance capacity. Trend graph 830 shows a detailed graph of performance data over a pre-specified period of time.
In one embodiment of the present technology, a displayed performance metric, such as summarized graphical performance metric is configured to display source data that is used to create the summarized graphical performance metric. In one such embodiment, for example, the present technology displays the source data for trend bar 560 e in response to an additional selection via cursor 610. The displayed source data can then be viewed and/or edited by a user.
Exemplary embodiments and advantages of the present technology for visual workflow process notation and layout is thus described. Although the subject matter has been described in a language specific to structural features and/or methodological acts, it is to be understood that the subject matter defined in the appended claims is not necessarily limited to the specific features or acts described above. Rather, the specific features and acts described above are disclosed as example forms of implementing the claims.

Claims (16)

What is claimed is:
1. A computer implemented method for generating a workflow process graphical user interface, said method comprising:
arranging by a processor a plurality of activity nodes along a workflow path on said workflow process graphical user interface, wherein each said activity node represents an individual work activity within a process of performing work, and wherein said activity nodes are arranged on said workflow path in representation of an order of performance of work activities within said process of performing work;
arranging a material flow path adjacent to said workflow path on said workflow process graphical user interface, said material flow path representative of a flow of different materials through said work activities associated with said plurality of activity nodes;
disposing a resource allocation node adjacent to a portion of said material flow path and two or more of said activity nodes on said workflow process graphical user interface, wherein said disposing comprises extending a resource utilization path between a start point of said resource allocation node and an end point of said resource allocation node, said resource allocation node representative of a resource utilized in performing a plurality of work activities upon a material represented by said portion of said material flow path, wherein said plurality of work activities are associated with activity nodes encompassed by a lengthwise span of said resource utilization path and said start and end points and wherein a first visual indicator is used to denote the start and end points of a resource allocation node and a second visual indicator is used to denote the start and end points of a bottlenecked source; and
displaying a message box near one of said plurality of activity nodes, said message box for conveying textual information related to a performance metric associated with said activity node, the textual information provides a visual indication of what material is represented by said material flow path.
2. The method of claim 1, further comprising:
displaying a legend, said legend for explaining visual representations used to portray elements of said workflow process graphical user interface.
3. The method of claim 1, further comprising:
exhibiting a trend bar adjacent to one of said plurality of activity nodes, wherein said trend bar provides a summarized graphical performance metric of a work activity related to said activity node.
4. The method of claim 3, further comprising:
configuring said trend bar to display a detailed version of said summarized graphical performance metric in response to a user selection of said trend bar.
5. The method of claim 1, wherein said workflow path comprises:
an end-to-end overview of an entire workflow process configured for aggregate display on a single screen of a display device.
6. The method of claim 5, wherein said workflow path further comprises:
one or more selectable portions configured to display in an enlarged fashion in response to a user selection, said selectable portions configured to display more detailed process information when enlarged.
7. The method of claim 1, wherein said arranging a plurality of activity nodes along a workflow path comprises:
populating a first end of said workflow path with an initial work activity node, said initial work activity node representing an initial work activity in said process of performing work; and
populating a second end of said workflow path with a terminal work activity node, said terminal work activity node representing a final work activity in said process of performing work.
8. The method of claim 1, wherein said arranging a plurality of activity nodes along a workflow path, comprises:
utilizing a first visually distinct symbol to depict each of said plurality of activity nodes associated with a value added work activity; and
utilizing a second visually distinct symbol to depict each of said plurality of activity nodes associated with a non-value added work activity.
9. The method of claim 1, wherein said arranging a material flow path adjacent to said workflow path comprises:
denoting transformation points on said material flow path, said transformation points representing intermediate transformational stages in a transformation of a raw material to a finished product.
10. A system, comprising:
a memory arranged to store instructions for a workflow process graphical user interface; and
a processor to couple to said memory, said processor operative to execute said instructions stored by said memory to generate said workflow process graphical user interface arranged with a plurality of activity nodes along a workflow path with each activity node representing an individual work activity within a process of performing work, a material flow path adjacent to said workflow path and representative of a flow of different materials through said work activities associated with said plurality of activity nodes, and a resource allocation node adjacent to a portion of said material flow path and two or more activity nodes, wherein said resource allocation node comprises a resource utilization path extended between a start point of said resource allocation node and an end point of said resource allocation node, said resource allocation node representing a resource utilized in performing a plurality of work activities upon a material represented by said portion of said material flow path, wherein said plurality of work activities are associated with activity nodes encompassed by a lengthwise span of said resource utilization path and said start and end points and wherein a first visual indicator is used to denote the start and end points of a resource allocation node and a second visual indicator is used to denote the start and end points of a bottlenecked source, said processor further operative to display a message box near one of said plurality of activity nodes, said message box for conveying textual information related to a performance metric associated with said activity node.
11. The system of claim 10, said workflow process graphical user interface comprising a legend, said legend for explaining visual representations used to portray elements of said workflow process graphical user interface.
12. The system of claim 10, said workflow process graphical user interface comprising a trend bar adjacent to one of said plurality of activity nodes, wherein said trend bar provides a summarized graphical performance metric of a work activity related to said activity node.
13. The system of claim 10, said workflow process graphical user interface comprising an end-to-end overview of an entire workflow process configured for aggregate display on a single screen of a display device.
14. The system of claim 10, said workflow process graphical user interface comprising one or more selectable portions configured to display in an enlarged fashion in response to a user selection, said selectable portions configured to display more detailed process information when enlarged.
15. The system of claim 10, said workflow process graphical user interface arranged to populate a first end of said workflow path with an initial work activity node, said initial work activity node representing an initial work activity in said process of performing work, and populate a second end of said workflow path with a terminal work activity node, said terminal work activity node representing a final work activity in said process of performing work.
16. The system of claim 10, said workflow process graphical user interface arranged to denote transformation points on said material flow path, said transformation points representing intermediate transformational stages in a transformation of a raw material to a finished product.
US11/415,834 2006-05-02 2006-05-02 Visual workflow process notation and layout Expired - Fee Related US8886553B2 (en)

Priority Applications (3)

Application Number Priority Date Filing Date Title
US11/415,834 US8886553B2 (en) 2006-05-02 2006-05-02 Visual workflow process notation and layout
EP07749450A EP2024822A4 (en) 2006-05-02 2007-01-29 Visual workflow process notation and layout
PCT/US2007/002394 WO2007130180A1 (en) 2006-05-02 2007-01-29 Visual workflow process notation and layout

Applications Claiming Priority (1)

Application Number Priority Date Filing Date Title
US11/415,834 US8886553B2 (en) 2006-05-02 2006-05-02 Visual workflow process notation and layout

Publications (2)

Publication Number Publication Date
US20070260499A1 US20070260499A1 (en) 2007-11-08
US8886553B2 true US8886553B2 (en) 2014-11-11

Family

ID=38662224

Family Applications (1)

Application Number Title Priority Date Filing Date
US11/415,834 Expired - Fee Related US8886553B2 (en) 2006-05-02 2006-05-02 Visual workflow process notation and layout

Country Status (3)

Country Link
US (1) US8886553B2 (en)
EP (1) EP2024822A4 (en)
WO (1) WO2007130180A1 (en)

Cited By (1)

* Cited by examiner, † Cited by third party
Publication number Priority date Publication date Assignee Title
US20130346138A1 (en) * 2012-06-26 2013-12-26 Xerox Corporation Creation of production process workflow diagrams

Families Citing this family (52)

* Cited by examiner, † Cited by third party
Publication number Priority date Publication date Assignee Title
US20080115103A1 (en) * 2006-11-13 2008-05-15 Microsoft Corporation Key performance indicators using collaboration lists
US8645854B2 (en) * 2010-01-19 2014-02-04 Verizon Patent And Licensing Inc. Provisioning workflow management methods and systems
US8621421B2 (en) * 2010-06-10 2013-12-31 Microsoft Corporation Workflow visualization
US20120116836A1 (en) * 2010-11-08 2012-05-10 International Business Machines Corporation Consolidating business process workflows through the use of semantic analysis
EP2648060A1 (en) * 2012-04-04 2013-10-09 ABB Research Ltd. A method for tracking a batch of material in a process for production of raw or semi-processed material
US9983575B2 (en) 2013-04-09 2018-05-29 Fisher-Rosemount Systems, Inc. Systems and methods to graphically display process control system information
US10013149B2 (en) 2013-03-15 2018-07-03 Fisher-Rosemount Systems, Inc. Graphical process variable trend monitoring for a process control system
US10803636B2 (en) 2013-03-15 2020-10-13 Fisher-Rosemount Systems, Inc. Graphical process variable trend monitoring, predictive analytics and fault detection in a process control system
US10180681B2 (en) 2013-03-15 2019-01-15 Fisher-Rosemount Systems, Inc. Graphical process variable trend monitoring with zoom features for use in a process control system
GB2532859B (en) * 2013-03-15 2020-11-25 Fisher Rosemount Systems Inc Graphical process variable trend monitoring in a process control system using a navigation pane
US10514668B2 (en) 2013-03-15 2019-12-24 Fisher-Rosemount Systems, Inc. Graphical process variable trend monitoring in a process control system using a navigation pane
JP7071052B2 (en) * 2013-03-15 2022-05-18 フィッシャー-ローズマウント システムズ,インコーポレイテッド How to generate and display graphic trend symbols for process control systems, and computer-readable storage media
US20140337071A1 (en) * 2013-05-09 2014-11-13 Optymyze Pte. Ltd. Method and system for configuring and processing requests through workflow applications
US10606859B2 (en) 2014-11-24 2020-03-31 Asana, Inc. Client side system and method for search backed calendar user interface
CN104933526A (en) * 2015-06-16 2015-09-23 武汉华工赛百数据系统有限公司 Data entry method and system
US10692030B2 (en) * 2016-06-21 2020-06-23 Amazon Technologies, Inc. Process visualization platform
US10545951B1 (en) 2016-12-15 2020-01-28 Amazon Technologies, Inc. Workflow dependency management system
US10977434B2 (en) 2017-07-11 2021-04-13 Asana, Inc. Database model which provides management of custom fields and methods and apparatus therfor
US10623359B1 (en) 2018-02-28 2020-04-14 Asana, Inc. Systems and methods for generating tasks based on chat sessions between users of a collaboration environment
US11138021B1 (en) 2018-04-02 2021-10-05 Asana, Inc. Systems and methods to facilitate task-specific workspaces for a collaboration work management platform
US10613735B1 (en) 2018-04-04 2020-04-07 Asana, Inc. Systems and methods for preloading an amount of content based on user scrolling
US11704731B2 (en) * 2018-04-11 2023-07-18 Hartford Fire Insurance Company Processing system to generate risk scores for electronic records
US10785046B1 (en) 2018-06-08 2020-09-22 Asana, Inc. Systems and methods for providing a collaboration work management platform that facilitates differentiation between users in an overarching group and one or more subsets of individual users
EP3803522B1 (en) * 2018-07-30 2023-11-22 Siemens Aktiengesellschaft Method for producing or machining a product and control device for controlling a production system
US10616151B1 (en) 2018-10-17 2020-04-07 Asana, Inc. Systems and methods for generating and presenting graphical user interfaces
US10956845B1 (en) 2018-12-06 2021-03-23 Asana, Inc. Systems and methods for generating prioritization models and predicting workflow prioritizations
US11113667B1 (en) 2018-12-18 2021-09-07 Asana, Inc. Systems and methods for providing a dashboard for a collaboration work management platform
US11568366B1 (en) 2018-12-18 2023-01-31 Asana, Inc. Systems and methods for generating status requests for units of work
US11782737B2 (en) 2019-01-08 2023-10-10 Asana, Inc. Systems and methods for determining and presenting a graphical user interface including template metrics
US10684870B1 (en) 2019-01-08 2020-06-16 Asana, Inc. Systems and methods for determining and presenting a graphical user interface including template metrics
US11204683B1 (en) 2019-01-09 2021-12-21 Asana, Inc. Systems and methods for generating and tracking hardcoded communications in a collaboration management platform
JP7229132B2 (en) * 2019-09-18 2023-02-27 日本製鉄株式会社 Load condition drawing device, load condition drawing method, and load condition drawing program
US11341445B1 (en) 2019-11-14 2022-05-24 Asana, Inc. Systems and methods to measure and visualize threshold of user workload
US11783253B1 (en) 2020-02-11 2023-10-10 Asana, Inc. Systems and methods to effectuate sets of automated actions outside and/or within a collaboration environment based on trigger events occurring outside and/or within the collaboration environment
US11599855B1 (en) 2020-02-14 2023-03-07 Asana, Inc. Systems and methods to attribute automated actions within a collaboration environment
CN111612330B (en) * 2020-05-19 2023-06-16 浙江大学 Service mode quantitative evaluation method for cross-border service
US11455601B1 (en) 2020-06-29 2022-09-27 Asana, Inc. Systems and methods to measure and visualize workload for completing individual units of work
US11449836B1 (en) 2020-07-21 2022-09-20 Asana, Inc. Systems and methods to facilitate user engagement with units of work assigned within a collaboration environment
JP7425691B2 (en) * 2020-07-21 2024-01-31 株式会社日立製作所 Process model creation system and process model creation method
US11568339B2 (en) 2020-08-18 2023-01-31 Asana, Inc. Systems and methods to characterize units of work based on business objectives
US11769115B1 (en) 2020-11-23 2023-09-26 Asana, Inc. Systems and methods to provide measures of user workload when generating units of work based on chat sessions between users of a collaboration environment
US11405435B1 (en) 2020-12-02 2022-08-02 Asana, Inc. Systems and methods to present views of records in chat sessions between users of a collaboration environment
US11694162B1 (en) 2021-04-01 2023-07-04 Asana, Inc. Systems and methods to recommend templates for project-level graphical user interfaces within a collaboration environment
US11676107B1 (en) 2021-04-14 2023-06-13 Asana, Inc. Systems and methods to facilitate interaction with a collaboration environment based on assignment of project-level roles
US11553045B1 (en) 2021-04-29 2023-01-10 Asana, Inc. Systems and methods to automatically update status of projects within a collaboration environment
US11803814B1 (en) 2021-05-07 2023-10-31 Asana, Inc. Systems and methods to facilitate nesting of portfolios within a collaboration environment
US11792028B1 (en) 2021-05-13 2023-10-17 Asana, Inc. Systems and methods to link meetings with units of work of a collaboration environment
US11809222B1 (en) 2021-05-24 2023-11-07 Asana, Inc. Systems and methods to generate units of work within a collaboration environment based on selection of text
US11756000B2 (en) 2021-09-08 2023-09-12 Asana, Inc. Systems and methods to effectuate sets of automated actions within a collaboration environment including embedded third-party content based on trigger events
US11635884B1 (en) 2021-10-11 2023-04-25 Asana, Inc. Systems and methods to provide personalized graphical user interfaces within a collaboration environment
US11836681B1 (en) 2022-02-17 2023-12-05 Asana, Inc. Systems and methods to generate records within a collaboration environment
US11863601B1 (en) 2022-11-18 2024-01-02 Asana, Inc. Systems and methods to execute branching automation schemes in a collaboration environment

Citations (42)

* Cited by examiner, † Cited by third party
Publication number Priority date Publication date Assignee Title
US5524077A (en) * 1987-07-24 1996-06-04 Faaland; Bruce H. Scheduling method and system
US5586021A (en) * 1992-03-24 1996-12-17 Texas Instruments Incorporated Method and system for production planning
US5826239A (en) * 1996-12-17 1998-10-20 Hewlett-Packard Company Distributed workflow resource management system and method
US5835898A (en) * 1996-02-29 1998-11-10 Dcd Corporation Visual schedule management system for a manufacturing facility
US5999911A (en) * 1995-06-02 1999-12-07 Mentor Graphics Corporation Method and system for managing workflow
US6003011A (en) * 1998-01-07 1999-12-14 Xerox Corporation Workflow management system wherein ad-hoc process instances can be generalized
US6023702A (en) * 1995-08-18 2000-02-08 International Business Machines Corporation Method and apparatus for a process and project management computer system
US6041306A (en) * 1996-12-05 2000-03-21 Hewlett-Packard Company System and method for performing flexible workflow process execution in a distributed workflow management system
US6065009A (en) * 1997-01-20 2000-05-16 International Business Machines Corporation Events as activities in process models of workflow management systems
US6092048A (en) * 1996-11-08 2000-07-18 Hitachi, Ltd. Task execution support system
US6243696B1 (en) * 1992-11-24 2001-06-05 Pavilion Technologies, Inc. Automated method for building a model
US6256651B1 (en) * 1997-06-20 2001-07-03 Raja Tuli Time management workflow software
US6278901B1 (en) * 1998-12-18 2001-08-21 Impresse Corporation Methods for creating aggregate plans useful in manufacturing environments
US6279009B1 (en) * 1998-12-04 2001-08-21 Impresse Corporation Dynamic creation of workflows from deterministic models of real world processes
US6336053B1 (en) * 1998-05-29 2002-01-01 Plexus Systems, Llc Graphical user interface shop floor control system
US20020055849A1 (en) * 2000-06-30 2002-05-09 Dimitrios Georgakopoulos Workflow primitives modeling
US6397191B1 (en) * 1998-06-05 2002-05-28 I2 Technologies Us, Inc. Object-oriented workflow for multi-enterprise collaboration
US20020078432A1 (en) * 2000-09-01 2002-06-20 Dietrich Charisius Methods and systems for improving a workflow based on data mined from plans created from the workflow
US6434440B1 (en) * 1998-08-27 2002-08-13 Fujitsu Limited Production estimate management system
US20030004767A1 (en) * 2001-06-28 2003-01-02 International Business Machines Corporation Workflow system, information processor, and method and program for workflow management
US20030014314A1 (en) * 2001-03-15 2003-01-16 Pelion Systems, Inc. Manufacturing flow control method and system
US20030033191A1 (en) * 2000-06-15 2003-02-13 Xis Incorporated Method and apparatus for a product lifecycle management process
US20030195646A1 (en) * 2002-04-10 2003-10-16 Hao-Ching Yang Production cell information system based on activity costs and an architecture therefor
US20030217054A1 (en) * 2002-04-15 2003-11-20 Bachman George E. Methods and apparatus for process, factory-floor, environmental, computer aided manufacturing-based or other control system with real-time data distribution
US20040015821A1 (en) * 2001-05-01 2004-01-22 Tonbu, Inc. System and method for interactive collaborative process management and project management
US20040078373A1 (en) * 1998-08-24 2004-04-22 Adel Ghoneimy Workflow system and method
US20040148047A1 (en) * 2001-12-18 2004-07-29 Dismukes John P Hierarchical methodology for productivity measurement and improvement of productions systems
US6775647B1 (en) * 2000-03-02 2004-08-10 American Technology & Services, Inc. Method and system for estimating manufacturing costs
US6795071B2 (en) * 1999-12-03 2004-09-21 Dcs, Inc. Method of managing workflow information
US6834370B1 (en) * 1999-07-08 2004-12-21 Osi Software, Inc. Method for creating master recipes
US20050040223A1 (en) * 2003-08-20 2005-02-24 Abb Technology Ag. Visual bottleneck management and control in real-time
US20060005157A1 (en) * 2004-06-30 2006-01-05 Vivek Saxena Engineering standard work framework method and system
US20060031840A1 (en) * 2003-08-20 2006-02-09 Abb Inc. Real time monitoring manufacturing scheduling and control
US20060080616A1 (en) * 2004-10-13 2006-04-13 Xerox Corporation Systems, methods and user interfaces for document workflow construction
US20060190231A1 (en) * 2005-02-18 2006-08-24 Opnet Technologies, Inc. Tracking, analyzing, and visualizing application delay
US7100147B2 (en) * 2001-06-28 2006-08-29 International Business Machines Corporation Method, system, and program for generating a workflow
US20060235557A1 (en) * 2002-10-11 2006-10-19 Thomas Knight Associated systems and methods for improving planning, scheduling, and supply chain management
US20070076228A1 (en) * 2005-10-04 2007-04-05 Jacob Apelbaum System and method for providing data services via a network
US7302401B1 (en) * 1999-04-06 2007-11-27 Single Source Oy Data management mechanism for project planning
US7428724B2 (en) * 2004-06-30 2008-09-23 United Technologies Corporation Interactive interface for engineering standard work
US7577554B2 (en) * 2001-07-03 2009-08-18 I2 Technologies Us, Inc. Workflow modeling using an acyclic directed graph data structure
US7801689B2 (en) * 2006-07-17 2010-09-21 Oracle International Corporation Systems and methods for tracking the composition of distilled spirits in production and storage

Family Cites Families (4)

* Cited by examiner, † Cited by third party
Publication number Priority date Publication date Assignee Title
GB0306746D0 (en) * 2003-03-24 2003-04-30 Medic To Medic Ltd A graphical user interface
CA2451164C (en) * 2003-09-11 2016-08-30 Teamplate Inc. Customizable components
US20060069605A1 (en) * 2004-09-29 2006-03-30 Microsoft Corporation Workflow association in a collaborative application
US7936863B2 (en) * 2004-09-30 2011-05-03 Avaya Inc. Method and apparatus for providing communication tasks in a workflow

Patent Citations (56)

* Cited by examiner, † Cited by third party
Publication number Priority date Publication date Assignee Title
US5524077A (en) * 1987-07-24 1996-06-04 Faaland; Bruce H. Scheduling method and system
US5586021A (en) * 1992-03-24 1996-12-17 Texas Instruments Incorporated Method and system for production planning
US6243696B1 (en) * 1992-11-24 2001-06-05 Pavilion Technologies, Inc. Automated method for building a model
US5999911A (en) * 1995-06-02 1999-12-07 Mentor Graphics Corporation Method and system for managing workflow
US6023702A (en) * 1995-08-18 2000-02-08 International Business Machines Corporation Method and apparatus for a process and project management computer system
US5835898A (en) * 1996-02-29 1998-11-10 Dcd Corporation Visual schedule management system for a manufacturing facility
US6092048A (en) * 1996-11-08 2000-07-18 Hitachi, Ltd. Task execution support system
US6041306A (en) * 1996-12-05 2000-03-21 Hewlett-Packard Company System and method for performing flexible workflow process execution in a distributed workflow management system
US5826239A (en) * 1996-12-17 1998-10-20 Hewlett-Packard Company Distributed workflow resource management system and method
US6065009A (en) * 1997-01-20 2000-05-16 International Business Machines Corporation Events as activities in process models of workflow management systems
US6256651B1 (en) * 1997-06-20 2001-07-03 Raja Tuli Time management workflow software
US6003011A (en) * 1998-01-07 1999-12-14 Xerox Corporation Workflow management system wherein ad-hoc process instances can be generalized
US6336053B1 (en) * 1998-05-29 2002-01-01 Plexus Systems, Llc Graphical user interface shop floor control system
US6397191B1 (en) * 1998-06-05 2002-05-28 I2 Technologies Us, Inc. Object-oriented workflow for multi-enterprise collaboration
US20040078373A1 (en) * 1998-08-24 2004-04-22 Adel Ghoneimy Workflow system and method
US6434440B1 (en) * 1998-08-27 2002-08-13 Fujitsu Limited Production estimate management system
US6279009B1 (en) * 1998-12-04 2001-08-21 Impresse Corporation Dynamic creation of workflows from deterministic models of real world processes
US6278901B1 (en) * 1998-12-18 2001-08-21 Impresse Corporation Methods for creating aggregate plans useful in manufacturing environments
US7302401B1 (en) * 1999-04-06 2007-11-27 Single Source Oy Data management mechanism for project planning
US6834370B1 (en) * 1999-07-08 2004-12-21 Osi Software, Inc. Method for creating master recipes
US6798413B1 (en) * 1999-12-03 2004-09-28 Dcs, Inc. Workflow management system
US6795071B2 (en) * 1999-12-03 2004-09-21 Dcs, Inc. Method of managing workflow information
US6775647B1 (en) * 2000-03-02 2004-08-10 American Technology & Services, Inc. Method and system for estimating manufacturing costs
US20030033191A1 (en) * 2000-06-15 2003-02-13 Xis Incorporated Method and apparatus for a product lifecycle management process
US20020055849A1 (en) * 2000-06-30 2002-05-09 Dimitrios Georgakopoulos Workflow primitives modeling
US20020078432A1 (en) * 2000-09-01 2002-06-20 Dietrich Charisius Methods and systems for improving a workflow based on data mined from plans created from the workflow
US20030014314A1 (en) * 2001-03-15 2003-01-16 Pelion Systems, Inc. Manufacturing flow control method and system
US20040015821A1 (en) * 2001-05-01 2004-01-22 Tonbu, Inc. System and method for interactive collaborative process management and project management
US8433601B2 (en) * 2001-06-28 2013-04-30 International Business Machines Corporation Workflow system, information processor, and method and program for workflow management
US7349864B2 (en) * 2001-06-28 2008-03-25 International Business Machines Corporation Workflow system, information processor, and method and program for workflow management
US20120290350A1 (en) * 2001-06-28 2012-11-15 International Business Machines Corporation Workflow system, information processor, and mehtod and program for workflow management
US20030004767A1 (en) * 2001-06-28 2003-01-02 International Business Machines Corporation Workflow system, information processor, and method and program for workflow management
US20070208603A1 (en) * 2001-06-28 2007-09-06 International Business Machines Corporation Workflow System, Information Processor, and Method and Program for Workflow Management
US7100147B2 (en) * 2001-06-28 2006-08-29 International Business Machines Corporation Method, system, and program for generating a workflow
US7577554B2 (en) * 2001-07-03 2009-08-18 I2 Technologies Us, Inc. Workflow modeling using an acyclic directed graph data structure
US20040148047A1 (en) * 2001-12-18 2004-07-29 Dismukes John P Hierarchical methodology for productivity measurement and improvement of productions systems
US6976033B2 (en) * 2002-04-10 2005-12-13 Charming Systems Corpration Production cell information system based on activity costs and an architecture therefor
US20030195646A1 (en) * 2002-04-10 2003-10-16 Hao-Ching Yang Production cell information system based on activity costs and an architecture therefor
US20030225462A1 (en) * 2002-04-15 2003-12-04 Bachman George E. Component object model communication method for process, factory-floor, environmental, computer aided manufacturing-based or other control system
US20040002950A1 (en) * 2002-04-15 2004-01-01 Brennan Sean F. Methods and apparatus for process, factory-floor, environmental, computer aided manufacturing-based or other control system using hierarchically enumerated data set
US20030217054A1 (en) * 2002-04-15 2003-11-20 Bachman George E. Methods and apparatus for process, factory-floor, environmental, computer aided manufacturing-based or other control system with real-time data distribution
US20030217053A1 (en) * 2002-04-15 2003-11-20 Bachman George E. Context control mechanism for data executed in workflows of process, factory-floor, environmental, computer aided manufacturing-based or other control system
US20030220707A1 (en) * 2002-04-15 2003-11-27 Budinger Bruce D. Workflow control configurator for use with process, factory-floor, environmental, computer aided manufacturing-based or other control system
US6975914B2 (en) * 2002-04-15 2005-12-13 Invensys Systems, Inc. Methods and apparatus for process, factory-floor, environmental, computer aided manufacturing-based or other control system with unified messaging interface
US20030225469A1 (en) * 2002-04-15 2003-12-04 Deremer Robert A. Methods and apparatus for process, factory-floor, environmental, computer aided manufacturing-based or other control system with unified messaging interface
US7242991B2 (en) * 2002-04-15 2007-07-10 Invensys Systems, Inc. Workflow control configurator for use with process, factory-floor, environmental, computer aided manufacturing-based or other control system
US20060235557A1 (en) * 2002-10-11 2006-10-19 Thomas Knight Associated systems and methods for improving planning, scheduling, and supply chain management
US20050040223A1 (en) * 2003-08-20 2005-02-24 Abb Technology Ag. Visual bottleneck management and control in real-time
US20060031840A1 (en) * 2003-08-20 2006-02-09 Abb Inc. Real time monitoring manufacturing scheduling and control
US20060005157A1 (en) * 2004-06-30 2006-01-05 Vivek Saxena Engineering standard work framework method and system
US7428724B2 (en) * 2004-06-30 2008-09-23 United Technologies Corporation Interactive interface for engineering standard work
US7496860B2 (en) * 2004-06-30 2009-02-24 United Technologies Corporation Engineering standard work framework method and system
US20060080616A1 (en) * 2004-10-13 2006-04-13 Xerox Corporation Systems, methods and user interfaces for document workflow construction
US20060190231A1 (en) * 2005-02-18 2006-08-24 Opnet Technologies, Inc. Tracking, analyzing, and visualizing application delay
US20070076228A1 (en) * 2005-10-04 2007-04-05 Jacob Apelbaum System and method for providing data services via a network
US7801689B2 (en) * 2006-07-17 2010-09-21 Oracle International Corporation Systems and methods for tracking the composition of distilled spirits in production and storage

Non-Patent Citations (2)

* Cited by examiner, † Cited by third party
Title
Arena User's Guide. Rockwell Software. Rockwell Automation. Oct. 2005. 1-150. *
Wackerow D, Adam W and Burton D (2001). MQSeries Workflow for Windows NY for Beginners. IBM Redbooks. Mar. 2001. pp. 1-164. *

Cited By (1)

* Cited by examiner, † Cited by third party
Publication number Priority date Publication date Assignee Title
US20130346138A1 (en) * 2012-06-26 2013-12-26 Xerox Corporation Creation of production process workflow diagrams

Also Published As

Publication number Publication date
US20070260499A1 (en) 2007-11-08
EP2024822A1 (en) 2009-02-18
WO2007130180A1 (en) 2007-11-15
EP2024822A4 (en) 2011-07-06

Similar Documents

Publication Publication Date Title
US8886553B2 (en) Visual workflow process notation and layout
US11301623B2 (en) Digital processing systems and methods for hybrid scaling/snap zoom function in table views of collaborative work systems
US10809901B2 (en) Providing a user interface that maintains information and context continuity while transitioning between views pertaining to different types of enterprise data
Cottyn et al. A method to align a manufacturing execution system with Lean objectives
Lian et al. Analysing the effects of Lean manufacturing using a value stream mapping-based simulation generator
US7168045B2 (en) Modeling business objects
US8799796B2 (en) System and method for generating graphical dashboards with drill down navigation
US20030014409A1 (en) Method and system for managing projects utilizing histogrammatical representations of real-time tasking and statusing
US20090164599A1 (en) Method and System for Monitoring a Supply-Chain
US20070192748A1 (en) Project management system and method
JP2005115494A (en) Business process tracking device, business process tracking method, business process tracking program, and recording medium recording business process tracking program
TWI479437B (en) Scheduling opportunity previewer
US10296859B1 (en) Workflow discovery through user action monitoring
US20140157177A1 (en) Consolidated display of time-based events associated with multiple systems
JP2007304660A (en) Command execution result recording system and command execution result recording method
US20110264593A1 (en) System and method for task management with sub-portions
Assad et al. Project management using a microcomputer
CN112598391A (en) Business process creation method and device, electronic equipment and storage medium
JP2009193489A (en) Work procedure manual creation system
JP6318019B2 (en) Planning work support method and system
JP4327686B2 (en) Method and system for supporting construction of individual system based on EA
JP6133763B2 (en) Production information management device, production information management method and program
JP4192937B2 (en) Production management device
CN116088817B (en) Panorama service view designer and device based on mesh topological structure
US20100153159A1 (en) Project timeline visualization methods and systems

Legal Events

Date Code Title Description
AS Assignment

Owner name: MICROSOFT CORPORATION, WASHINGTON

Free format text: ASSIGNMENT OF ASSIGNORS INTEREST;ASSIGNORS:GREEF, ARTHUR R.;LUND, JENS OLESEN;SORENSEN, CHRISTIAN HAGEL;REEL/FRAME:018750/0063;SIGNING DATES FROM 20060426 TO 20060502

Owner name: MICROSOFT CORPORATION, WASHINGTON

Free format text: ASSIGNMENT OF ASSIGNORS INTEREST;ASSIGNORS:GREEF, ARTHUR R.;LUND, JENS OLESEN;SORENSEN, CHRISTIAN HAGEL;SIGNING DATES FROM 20060426 TO 20060502;REEL/FRAME:018750/0063

STCF Information on status: patent grant

Free format text: PATENTED CASE

AS Assignment

Owner name: MICROSOFT TECHNOLOGY LICENSING, LLC, WASHINGTON

Free format text: ASSIGNMENT OF ASSIGNORS INTEREST;ASSIGNOR:MICROSOFT CORPORATION;REEL/FRAME:034542/0001

Effective date: 20141014

MAFP Maintenance fee payment

Free format text: PAYMENT OF MAINTENANCE FEE, 4TH YEAR, LARGE ENTITY (ORIGINAL EVENT CODE: M1551)

Year of fee payment: 4

FEPP Fee payment procedure

Free format text: MAINTENANCE FEE REMINDER MAILED (ORIGINAL EVENT CODE: REM.); ENTITY STATUS OF PATENT OWNER: LARGE ENTITY

LAPS Lapse for failure to pay maintenance fees

Free format text: PATENT EXPIRED FOR FAILURE TO PAY MAINTENANCE FEES (ORIGINAL EVENT CODE: EXP.); ENTITY STATUS OF PATENT OWNER: LARGE ENTITY

STCH Information on status: patent discontinuation

Free format text: PATENT EXPIRED DUE TO NONPAYMENT OF MAINTENANCE FEES UNDER 37 CFR 1.362

FP Lapsed due to failure to pay maintenance fee

Effective date: 20221111