US8938122B2 - Image processing apparatus, image processing method, and computer-readable recording device - Google Patents
Image processing apparatus, image processing method, and computer-readable recording device Download PDFInfo
- Publication number
- US8938122B2 US8938122B2 US13/464,352 US201213464352A US8938122B2 US 8938122 B2 US8938122 B2 US 8938122B2 US 201213464352 A US201213464352 A US 201213464352A US 8938122 B2 US8938122 B2 US 8938122B2
- Authority
- US
- United States
- Prior art keywords
- area
- specific area
- small areas
- small
- image
- Prior art date
- Legal status (The legal status is an assumption and is not a legal conclusion. Google has not performed a legal analysis and makes no representation as to the accuracy of the status listed.)
- Active, expires
Links
- 238000012545 processing Methods 0.000 title claims abstract description 49
- 238000003672 processing method Methods 0.000 title claims description 5
- 230000015654 memory Effects 0.000 claims description 3
- 230000003902 lesion Effects 0.000 description 133
- 230000006870 function Effects 0.000 description 56
- 238000000034 method Methods 0.000 description 37
- 238000009826 distribution Methods 0.000 description 30
- 238000010586 diagram Methods 0.000 description 18
- 238000004422 calculation algorithm Methods 0.000 description 11
- 238000012986 modification Methods 0.000 description 11
- 230000004048 modification Effects 0.000 description 11
- 230000008569 process Effects 0.000 description 11
- 238000006243 chemical reaction Methods 0.000 description 10
- 230000005484 gravity Effects 0.000 description 7
- 230000009467 reduction Effects 0.000 description 7
- 210000004877 mucosa Anatomy 0.000 description 6
- 239000013598 vector Substances 0.000 description 6
- 238000001514 detection method Methods 0.000 description 4
- 230000008901 benefit Effects 0.000 description 3
- 230000000694 effects Effects 0.000 description 3
- 210000001035 gastrointestinal tract Anatomy 0.000 description 3
- 239000011159 matrix material Substances 0.000 description 3
- 239000008280 blood Substances 0.000 description 2
- 210000004369 blood Anatomy 0.000 description 2
- 238000004364 calculation method Methods 0.000 description 2
- 239000002775 capsule Substances 0.000 description 2
- 238000012937 correction Methods 0.000 description 2
- 230000007423 decrease Effects 0.000 description 2
- 239000006185 dispersion Substances 0.000 description 2
- 238000001914 filtration Methods 0.000 description 2
- 238000003384 imaging method Methods 0.000 description 2
- 230000002452 interceptive effect Effects 0.000 description 2
- 210000003734 kidney Anatomy 0.000 description 2
- 230000011218 segmentation Effects 0.000 description 2
- XLYOFNOQVPJJNP-UHFFFAOYSA-N water Substances O XLYOFNOQVPJJNP-UHFFFAOYSA-N 0.000 description 2
- 208000025865 Ulcer Diseases 0.000 description 1
- 238000002835 absorbance Methods 0.000 description 1
- 238000004458 analytical method Methods 0.000 description 1
- 238000004891 communication Methods 0.000 description 1
- 238000007796 conventional method Methods 0.000 description 1
- 238000003066 decision tree Methods 0.000 description 1
- 238000005315 distribution function Methods 0.000 description 1
- 238000005516 engineering process Methods 0.000 description 1
- 238000009499 grossing Methods 0.000 description 1
- 238000007654 immersion Methods 0.000 description 1
- 238000011017 operating method Methods 0.000 description 1
- 238000003909 pattern recognition Methods 0.000 description 1
- 238000004088 simulation Methods 0.000 description 1
- 238000012706 support-vector machine Methods 0.000 description 1
- 231100000397 ulcer Toxicity 0.000 description 1
Images


Classifications
-
- G—PHYSICS
- G06—COMPUTING; CALCULATING OR COUNTING
- G06T—IMAGE DATA PROCESSING OR GENERATION, IN GENERAL
- G06T7/00—Image analysis
- G06T7/10—Segmentation; Edge detection
- G06T7/143—Segmentation; Edge detection involving probabilistic approaches, e.g. Markov random field [MRF] modelling
-
- G06T7/0083—
-
- G06T7/0087—
-
- G—PHYSICS
- G06—COMPUTING; CALCULATING OR COUNTING
- G06T—IMAGE DATA PROCESSING OR GENERATION, IN GENERAL
- G06T7/00—Image analysis
- G06T7/10—Segmentation; Edge detection
- G06T7/12—Edge-based segmentation
-
- G—PHYSICS
- G06—COMPUTING; CALCULATING OR COUNTING
- G06T—IMAGE DATA PROCESSING OR GENERATION, IN GENERAL
- G06T2207/00—Indexing scheme for image analysis or image enhancement
- G06T2207/10—Image acquisition modality
- G06T2207/10024—Color image
-
- G—PHYSICS
- G06—COMPUTING; CALCULATING OR COUNTING
- G06T—IMAGE DATA PROCESSING OR GENERATION, IN GENERAL
- G06T2207/00—Indexing scheme for image analysis or image enhancement
- G06T2207/10—Image acquisition modality
- G06T2207/10068—Endoscopic image
-
- G—PHYSICS
- G06—COMPUTING; CALCULATING OR COUNTING
- G06T—IMAGE DATA PROCESSING OR GENERATION, IN GENERAL
- G06T2207/00—Indexing scheme for image analysis or image enhancement
- G06T2207/20—Special algorithmic details
- G06T2207/20112—Image segmentation details
- G06T2207/20152—Watershed segmentation
-
- G—PHYSICS
- G06—COMPUTING; CALCULATING OR COUNTING
- G06T—IMAGE DATA PROCESSING OR GENERATION, IN GENERAL
- G06T2207/00—Indexing scheme for image analysis or image enhancement
- G06T2207/30—Subject of image; Context of image processing
- G06T2207/30004—Biomedical image processing
- G06T2207/30096—Tumor; Lesion
Definitions
- the present invention relates to an image processing apparatus that detects a specific area from an image, an image processing method, and a computer-readable recording device.
- the graph cut area division method is a method of dividing, as described in the following, an image into a specific area to be detected and a non-specific area that is the background of the area to be detected.
- a connected graph is created. Multiple nodes N corresponding to multiple pixels in an image and two nodes S and T, which are determination labels for each pixel and correspond to the specific area and the non-specific area, are connected via links. Each link represents by its size the probability for each pixel that the pixel is attributed to the specific area or the non-specific area. Furthermore the nodes corresponding to pixels and adjacent to each other are connected via links. Each link represents by its size the probability that the adjacent pixels are contained in the same area.
- the group of nodes N is separated into a group connected to the node S and a group connected to the node T.
- the links are cut off such that the sum of the probability is the minimum using the max-flow min-cut theorem of graph network theory (i.e., the sum of the probability of uncut links is the maximum), thereby area division is optimized (see Y. Boykov, M. Jolly, “Interactive Graph Cuts for Optimal Boundary & Region Segmentation of Objects in N-D Images”, Proceeding of “International Conference on Computer Vision”, July 2001, vol. 1, pp. 105-112).
- An image processing apparatus includes: a small area divider that divides, on the basis of edge information of an image, the image into multiple small areas each including multiple pixels; an attribute probability estimator that estimates attribute probability for each of the small areas, which is probability that the small area is attributed to a specific area to be detected; an adjacent-small-area connection strength calculator that calculates connection strength that quantitatively indicates a degree to which small areas adjacent to each other among the multiple small areas are attributed to the same area that is the specific area or a non-specific area other than the specific area; and a specific area detector that detects the specific area by dividing the image into the specific area and the non-specific area on the basis of the attribute probability and the connection strength.
- An image processing method includes: on the basis of edge information of an image, dividing the image into multiple small areas each including multiple pixels; estimating attribute probability for each of the small areas, which is probability that the small area is attributed to a specific area to be detected; calculating connection strength that quantitatively indicates a degree to which small areas adjacent to each other among the multiple small areas are attributed to the same area that is the specific area or a non-specific area other than the specific area; and detecting the specific area by dividing the image into the specific area and the non-specific area on the basis of the attribute probability and the connection strength.
- a computer-readable recording device has an executable program stored thereon, wherein the program instructs a processor to perform: on the basis of edge information of an image, dividing the image into multiple small areas each including multiple pixels; estimating attribute probability for each of the small areas, which is probability that the small area is attributed to a specific area to be detected; calculating connection strength that quantitatively indicates a degree to which small areas adjacent to each other among the multiple small areas are attributed to the same area that is the specific area or a non-specific area other than the specific area; and detecting the specific area by dividing the image into the specific area and the non-specific area on the basis of the attribute probability and the connection strength.
- FIG. 1 is a block diagram of a configuration of an image processing apparatus according to a first embodiment of the present invention
- FIG. 2 is a flowchart of operations of the image processing apparatus shown in FIG. 1 ;
- FIG. 3 is a schematic diagram of an exemplary image of a lumen on which image processing is performed
- FIG. 4 is a flowchart of operations of the area divider shown in FIG. 1 ;
- FIG. 5 is a schematic diagram depicting the lumen image shown in FIG. 3 divided into small areas
- FIG. 6 is a flowchart of operations of the attribute probability estimator shown in FIG. 1 ;
- FIG. 7A is a graph of feature data distribution of the small areas in teacher data
- FIG. 7B is a graph of exemplary probability density functions that are estimated on the basis of the teacher data
- FIG. 8 is a flowchart of operations of the adjacent-small-area connection strength calculator shown in FIG. 1 ;
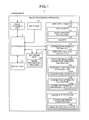
- FIG. 9 is a flowchart of operations of the lesion site detector shown in FIG. 1 ;
- FIG. 10A is a schematic diagram of an exemplary connected graph
- FIG. 10B is a schematic diagram depicting that the connected graph shown in FIG. 10A is cut according to a max-flow min-cut theorem;
- FIG. 11 is a schematic diagram of a configuration of an arithmetic operator of an image processing apparatus according to a second embodiment of the present invention.
- FIG. 12 is a flowchart of operations of the attribute probability estimator shown in FIG. 11 ;
- FIG. 13A is a schematic diagram of an exemplary result of clustering a feature data distribution projected in a feature space consisting of two types of color feature data.
- FIG. 13B is a schematic diagram depicting the centers of gravity of the clusters shown in FIG. 13A ;
- FIG. 14 is a flowchart of a process of estimating a cluster corresponding to a lesion site
- FIG. 15A is a diagram of exemplary clustering of a feature data distribution corresponding to an image
- FIG. 15B is a diagram of exemplary clustering of a feature data distribution corresponding to another image
- FIG. 16 is a flowchart of operations of the adjacent-small-area connection strength calculator shown in FIG. 11 ;
- FIG. 17 is a schematic diagram of a configuration of an arithmetic operator of an image processing apparatus according to a third embodiment of the present invention.
- FIG. 18 is a flowchart of operations of the adjacent-small-area connection strength calculator shown in FIG. 17 ;
- FIG. 19 is a diagram illustrating a method of calculating boundary strength
- FIG. 20 is a block diagram of a configuration of an arithmetic operator of an image processing apparatus according to a modification of the third embodiment
- FIG. 21 is a flowchart of operations of the adjacent-small-area connection strength calculator shown in FIG. 20 ;
- FIG. 22 is a block diagram of a configuration of an arithmetic operator of an image processing apparatus according to a fourth embodiment.
- a lumen image obtained by imaging the inside of the lumen (digestive tract) of a subject by using a medical observation apparatus, such as an endoscope or a capsule endoscope.
- the lumen image is, for example, a color image having, in each pixel, a pixel level (pixel value) of each of the color components of R (red), G (green), and B (blue).
- the present invention is not limited to lumen images but can be widely applicable to other image processing apparatuses that detect a specific area from a normal image.
- a lesion site in a lumen image is described as a specific area to be detected and a non-lesion site other than the lesion site (mucosa, contents of the lumen such as residue, bubbles, etc.) are described as non-specific areas that are the background.
- desired sites may be set as a specific area and a non-specific area, e.g., a lesion site and mucosa are set as a specific area and an area other than the lesion site and mucosa (contents and bubbles) may be set as a non-specific area.
- FIG. 1 is a block diagram of a configuration of an image processing apparatus according to a first embodiment of the present invention.
- an image processing apparatus 1 includes a controller 10 that controls the whole operation of the image processing apparatus 1 ; an image acquiring unit 11 that acquires image data of a lumen image that is captured by the medical observation apparatus; an input unit 12 that receives input signals that are input from the outside; a display unit 13 that displays a screen including a lumen image and various types of information; a recording unit 14 ; and an arithmetic operator 15 that performs arithmetic operation processing for detecting a specific area from a lumen image.
- the controller 10 is a configuration of hardware, such as a CPU. By reading various programs stored in the recording unit 14 , the controller 10 transfers instructions and data to each unit forming the image processing apparatus 1 in accordance with image data that is input from the image acquiring unit 11 and operation signals that are input from the input unit 12 and accordingly entirely controls operations of the image processing apparatus 1 .
- the image acquiring unit 11 is appropriately configured according to the mode of the system that includes the medical observation apparatus.
- the medical observation apparatus is a capsule endoscope and a portable recording medium is used to receive image data of lumen images from the medical observation apparatus
- the recording medium can be removably attached to the image acquiring unit 11 and the image acquiring unit 11 is configured from a reader device that reads image data stored in the recording medium.
- the image acquiring unit 11 is configured from a communication device, etc. that is connected to the server and the image acquiring unit 11 acquires image data by communicating with the server.
- the image acquiring unit 11 may be configured from an interface device that inputs image signals via a cable from the medical observation apparatus, such as an endoscope.
- the input unit 12 is configured from, for example, a key board, a mouse, a touch panel, and various switches.
- the input unit 12 outputs input signals received from the outside to the controller 10 .
- the display unit 13 is a configuration of a display device, such as an LCD or an EL display.
- the recording unit 14 is a configuration of an information recording device, such as various IC memories, such as ROM and RAM that are updatable and recordable flash memories, an internal/external hard disk, or a CD-ROM; and a reading device.
- the recording unit 14 stores, in addition to the image data of lumen images acquired by the image acquiring unit 11 , a program for causing the image processing apparatus 1 to operate and execute various functions and data used during execution of the program.
- the recording unit 14 stores an image processing program 14 a for detecting a specific area from a lumen image.
- the arithmetic operator 15 is a configuration of hardware, such as a CPU. By reading the image processing program 14 a , the arithmetic operator 15 processes the image data of a lumen image and performs various types of arithmetic processing for detecting a specific area from the lumen image.
- the arithmetic operator 15 includes an area divider 110 , an attribute probability estimator 120 , an adjacent-small-area connection strength calculator 130 , and a lesion site detector 140 .
- the area divider 110 divides the lumen image into small areas each including pixels on the basis of edge information of the lumen image.
- the area divider 110 includes an edge intensity calculator 111 that calculates edge intensity of each pixel in the lumen image; and a divider 112 that divides the lumen image into multiple small areas by using the ridges of the edge intensity as the boundary.
- the attribute probability estimator 120 estimates the probability (attribute probability) for each small area that the small area is attributed to the specific area.
- the attribute probability estimator 120 includes an area feature data calculator 121 that calculates for each small area feature data on the small area. On the basis of the feature data on each small area, the attribute probability estimator 120 estimates the probability of being attributed to the specific area (specific-area attribute probability).
- the feature data used to estimate attribute probability is, for example, color feature data and texture feature data of small areas.
- the adjacent-small-area connection strength calculator 130 calculates connection strength between two small areas that are adjacent to each other (also referred to as adjacent small areas).
- the connection strength is data that quantitatively indicates the degree to which the adjacent small areas are attributed to the same area, i.e., are attributed to the specific area or the non-specific area.
- the adjacent-small-area connection strength calculator 130 includes an adjacency information acquiring unit 131 that acquires, for each small area, adjacency information on a small area that is adjacent to the small area; and a connection strength calculator 132 that calculates connection strength between the small areas adjacent to each other on the basis of the adjacency information.
- the adjacency information acquiring unit 131 includes an outline pixel detector 131 a that detects the outline pixels of each small area. On the basis of the information on the outline pixels of each small area, the adjacency information acquiring unit 131 acquires adjacency information.
- connection strength calculator 132 further includes an attribute probability difference calculator 132 a that calculates the difference in attribute probability between the adjacent small areas. On the basis of the difference in attribute probability, the connection strength calculator 132 calculates connection strength between the adjacent small areas.
- the lesion site detector 140 On the basis of the attribute probability estimated by the attribute probability estimator 120 and the connection strength calculated by the adjacent-small-area connection strength calculator 130 , the lesion site detector 140 detects a lesion area as a specific area from the lumen image.
- the lesion site detector 140 divides the lumen image into a lesion site and a site other than the lesion site (non-lesion site) by using a graph cut area division method.
- the lesion site detector 140 includes a connected graph constructor 141 that constructs a connected graph on the basis of the attribute probability and the connection strength; and a minimum cut calculator 142 that calculates a minimum cut position in the connected graph.
- the lesion site detector 140 divides the small areas into a small area group attributed to the lesion site and a small area group attributed to the non-lesion site.
- FIG. 2 is a flowchart of operations of the image processing apparatus 1 .
- FIG. 3 is a schematic diagram of an exemplary lumen image.
- the image 100 includes a lesion site 101 to be detected and a non-lesion area 102 , which is other than the lesion area 101 .
- the image 100 further includes a boundary 103 of a structure corresponding to the folds of mucosa.
- the area divider 110 divides the image 100 into multiple small areas each including multiple pixels.
- FIG. 4 is a flowchart of operations of the area divider 110 at step S 20 .
- the edge intensity calculator 111 calculates edge intensity of each pixel in the image 100 and creates an edge intensity image. Specifically, the edge intensity calculator 111 performs a known differential filter process, such as Sobel filtering, on G components among pixel values of the pixels (see CG-ARTS Association, “Digital Image Processing” pp. 114 to 121). The G components are used because the G components absorb light in a band that is close to the band in which blood absorbs light and thus the structure information on the boundary in the lumen image between the lesion, mucosa, and contents can be well reflected.
- edge intensity may be calculated on the basis of color components other then the G components and values that are secondarily calculated from the pixel values by using a known conversion process. Specifically, the luminance calculated by YCbCr conversion, color difference, hue calculated by HSI conversion, chroma, and brightness can be used.
- the divider 112 performs a smoothing process to remove noises on the edge intensity image, if necessary.
- the divider 112 acquires the gradient direction of the edge intensity of each pixel in the edge intensity image.
- the gradient direction is the direction in which the value of the edge intensity decreases.
- the divider 112 searches for a pixel of the minimum value that is reached from each pixel along the gradient direction.
- the divider 112 divides the image such that the pixels from which the pixels of minimum values adjacent to each other are reached are contained in the same area.
- FIG. 5 is a schematic diagram of an exemplary area label image obtained as described above.
- a watershed algorithm may be used as a method of dividing an image on the basis of edge intensity m (see, Luc Vincent and Pierre Soille, “Watersheds in Digital Spaces: An Efficient Algorithm Based on Immersion Simulations”, IEEE Transactions on Pattern Analysis and Machine Intelligence, Vol. 13, No. 6, pp. 583-598, June 1991).
- the watershed algorithm is a method of dividing an image such that, when the landform where pixel value information is regarded as the altitude is filled with water, a boundary appears as water that collects in different pockets.
- the attribute probability estimator 120 estimates the attribute probability for each small area A n that it is attributed to the lesion site 101 .
- a method is used in which the feature data distribution in the pre-created teacher data is approximated using a probability model (probability density function) and attribute probability is estimated on the basis of the probability model.
- FIG. 6 is a flowchart of operations of the attribute probability estimator 120 at step S 30 .
- the area feature data calculator 121 calculates feature data on each small area A n .
- the feature data that is used is data indicating the overall features of a small area A n , which is not each pixel but a collection of pixels, such as statistical data of each of the RGB components of pixel values of pixels in each small area A n (average, dispersion, distortion, kurtosis, frequency distribution, etc.) or texture information on each small area A n (frequency feature, texture feature data such as a simultaneous co-occurrence matrix, etc., see CG-ARTS Association, “Digital Image Processing”, pp. 192 to 195).
- statistical data may be used as the feature data, such as the luminance, color difference, hue, chroma, brightness, and color ratio that are secondarily calculated from each of the RGB components of pixel values of pixels in each small area A n , or texture information based on these secondarily calculated vales.
- the attribute probability estimator 120 acquires teacher data that is pre-created and stored in the recording unit 14 .
- the teacher data is a data set in which feature data of the small areas and results of determination on whether the small areas are attributed to the lesion site are associated with each other.
- the attribute probability estimator 120 estimates the teacher-data based occurrence probability Pc that a small area is attributed to the lesion area (hereinafter, lesion site area) by dividing the number N S of small areas that are determined to be attributed to the lesion site by the total number of small areas (N S +N T ).
- N T is the number of small areas determined to be attributed to the non-lesion site in the teacher data.
- the attribute probability estimator 120 estimates a probability density function of the lesion site area and a probability density function of the non-lesion site area.
- the estimate is performed by using a known expectation maximization algorithm (EM algorithm) to apply a contaminated normal distribution to the feature data distributions of the small areas determined to be attributed to the lesion site and small areas determined to be attributed to the non-lesion site.
- EM algorithm is an arithmetic operating method for estimating parameters by repeating the calculation of an expected value of a model based on a given parameter and the calculation of a parameter for maximizing the calculated expected value.
- FIG. 7A depicts feature data distribution of the small areas in the teacher data.
- Peak 1 shown in FIG. 7A corresponds to the peak of the frequency of small areas determined to be attributed to the lesion site and Peak 2 corresponds to the peak of frequency of small area determined to be attributed to the non-lesion site.
- FIG. 7B is a graph indicating probability density functions where the feature data serves as a probability variable, which is a probability density function acquired on the basis of the feature data distribution shown in FIG. 7A .
- the probability density function f S(REF) shown in FIG. 7B corresponds to a probability density of small areas attributed to the lesion site and the probability density function f T(REF) shown in FIG. 7B corresponds to a probability density of small areas attributed to the non-lesion site.
- the feature data C Th is feature data obtained when the probability density is approximately equal in both probability density functions f S(REF) and f T(REF) .
- the attribute probability estimator 120 estimates the attribute probability P n for each small area A n that it is attributed to the lesion site 101 in the image 100 (or the attribute probability P n ′ for each small area An that it is attributed to the non-lesion area 102 ).
- an estimate of occurrence probability and estimate of probability density functions based on the teacher data may be previously performed and the coefficients of the occurrence probability and the probability density functions may be recorded in the recording unit 14 .
- the arithmetic operation at step S 305 is performed by using the feature data calculated at step S 301 and by using the occurrence probability and the coefficients of the probability density functions that are read from the recording unit 14 .
- an average ⁇ and a variance Z are given by the following Equations (2) and (3):
- N D is the number of types of data.
- Equation (4) the parts surrounded by the broken line are the coefficients to be obtained.
- the coefficients of the probability density function f T (C n ) of the non-lesion area is similarly calculated but with different data.
- the occurrence probability Pc and Pc′ of a lesion site area and a non-lesion site area and the coefficients of the probability density functions f S (C n ) and f T (C n ) of the lesion site area and the non-lesion site area, which are previously obtained as described above, are recorded and, on the basis of these values and the feature data C n of the small area to be discriminated, the attribute probability P n is calculated of attribute of the small area to be discriminated to the lesion site by using the following Equation (5):
- Equation (6) is an equation of a liner sum of the normal distribution f S (C n ):
- the method used to estimate attribute probability on the basis of the probability density function is a method in which the attribute probability is a continuous value.
- the attribute probability is not necessarily a continuous value.
- the probability of being attributed/not attributed to the lesion site may be represented by one of two values: 1 or 2.
- the attribute probability is estimated by using a known method, such as a decision tree used for pattern recognition, etc., a neighborhood method, or a support vector machine.
- FIG. 8 is a flowchart of operations of the adjacent-small-area connection strength calculator 130 at step S 40 .
- the outline pixel detector 131 a detects outline pixels of each small area A n .
- Known various methods can be used as the method of detecting outline pixels.
- pixels of interest are sequentially set while raster scanning the area label image generated at step S 206 ; the label value of the pixel of interest is compared to the label values of adjacent pixels adjacent to the top, bottom, right, or left of a pixel of interest; and the pixel of interest is detected as an outline pixel when its label value is different from the label values.
- the adjacency information acquiring unit 131 acquires adjacency information on a small area A n′ (n′ ⁇ n) adjacent to each small area A n .
- the adjacency information is information indicating which small area A n is adjacent to which small area A n′ .
- the adjacency information acquiring unit 131 records, as adjacency information, the label value added to the pixel of interest that is detected as an outline pixel at step S 401 and the label value of the adjacent pixel when the pixel of interest is determined as an outline pixel.
- the attribute probability difference calculator 132 a calculates the difference ⁇ P in attribute probability of attributed to the lesion site 101 between the adjacent areas (hereinafter, attribute probability difference). Specifically, the attribute probability difference calculator 132 a specifies small areas A n and A n′ adjacent to each other on the basis of the adjacency information acquired at step S 402 and calculates, as an attribute probability difference ⁇ P, the difference (absolute value)
- the connection strength calculator 132 calculates the connection strength between each adjacent small area on the basis of the attribute probability difference ⁇ P calculated at step S 402 .
- the fact that the attribute probability difference ⁇ P with respect to the lesion site 101 between the small areas A n and A n′ , adjacent to each other is small means that it is highly likely that the small areas A n and A n′ are attributed to the same area and the connection strength is high.
- the connection strength calculator 132 uses the attribute probability difference ⁇ P as a variable, sets a reduction function that increases the connection strength as the attribute probability difference ⁇ P becomes smaller, and calculates the connection strength between the small areas A n and A n′ by using the reduction function.
- the connection strength calculator 132 may generate a conversion table in which the attribute probability difference ⁇ P and the connection strength are associated with each other such that the connection strength increases as the attribute probability difference ⁇ P becomes smaller and may acquire the connection strength by referring to the conversion table.
- FIG. 9 is a flowchart of operations of the lesion site detector 140 at step S 50 .
- the connected graph constructor 141 constructs a connected graph 105 in which nodes N n corresponding to small areas A n , the node S corresponding to the lesion site 101 , and the node T corresponding to the non-lesion site 102 are connected (see FIG. 10A ).
- the node S and each node N n are connected via S links (s-link) having a size corresponding to the attribute probability P n that the corresponding small area A n is attributed to the lesion site 101 .
- the node T and each node N n are connected via T links (t-link) having a size corresponding to the attribute probability (1 ⁇ P n ) that the corresponding small area A n is attributed to the non-lesion site 102 . Furthermore, the nodes N n and N n′ adjacent to each other are connected via N links (n-link) having a size corresponding to the connection strength between the corresponding small areas A n and A n′ .
- the minimum cut calculator 142 calculates a minimum cut position in the connected graph 105 .
- the minimum cut position is a cut position with which, when any of the S links, T links, and the N links are cut such that all nodes N n are divided into the node N n group attributed to the node S and the node N n group attributed to the node T, the sum of the attribute probability P n of the cut S link, the attribute probability 1 ⁇ P n of the T link, and the connection strength of the N link is a minimum value.
- Such a minimum cut position is calculated on the basis of the max-flow min-cut theorem in graph-network theory (see, Y. Boykov, M. Jolly, “Interactive Graph Cuts for Optimal Boundary & Region Segmentation of Objects in N-D Images”, Proceeding of “International Conference on Computer Vision”, July 2001, vol. 1, pp. 105-112).
- the lesion site detector 140 specifies small areas A n attributed to the lesion site 101 on the basis of the minimum cut position calculated at step S 502 . Specifically, as a result of cutting the connected graph 105 at the minimum cut position, the small areas A n corresponding to the nodes N n whose link relationship with the node S is maintained serve as small areas A n attributed to the lesion site 101 .
- step S 60 the arithmetic operator 15 outputs the small areas A n specified at step S 503 , which is a result of the detection of the lesion site, to the display unit 13 and records the small areas A n in the recording unit 14 .
- the lumen image is divided into multiple small areas on the basis of the edge information of the lumen image, the attribute probability for each small area that it is attributed to the specific area (lesion site) and the connection strength to the adjacent small areas are calculated, and the image is divided into the specific area and the non-specific area on the basis of the attribute probability and the connection strength. Accordingly, according to the first embodiment, area division can be performed in consideration of a feature derived from the small area of a collection of pixels. Accordingly, the accuracy with which a specific area is detected from a lumen image can be improved.
- the result of the detection of a specific area can be obtained more quickly in comparison with the conventional method while reducing the number of arithmetic operations.
- An image processing apparatus includes, instead of the arithmetic operator 15 shown in FIG. 1 , an arithmetic operator 20 as shown in FIG. 11 .
- the arithmetic operator 20 includes the area divider 110 , an attribute probability estimator 220 , an adjacent-small-area connection strength calculator 230 , and the lesion site detector 140 .
- the attribute probability estimator 220 includes, in addition to the area feature data calculator 121 that calculates feature data for each small area, a probability function estimator 221 that estimates a probability function for calculating attribute probability that a small area is attributed to the lesion site on the basis of the feature data of the small area.
- the probability function estimator 221 includes a clustering unit 221 a that clusters the feature data distribution in the lumen image; a cluster estimator 221 b that estimates a cluster corresponding to the lesion site; and a probability density function estimator 221 c that estimates probability density functions of the lesion site area and the non-lesion site area on the basis of the result of the estimate of a cluster.
- the adjacent-small-area connection strength calculator 230 includes the adjacency information acquiring unit 131 that acquires adjacency information, for each small area, on a small area adjacent to the small area; and a connection strength calculator 231 that calculates connection strength on the basis of the adjacency information.
- the connection strength calculator 231 includes an internal feature data difference calculator 231 a that calculates the difference in internal feature data between adjacent small areas.
- the connection strength calculator 231 calculates the connection strength of the adjacent small areas on the basis of the difference in internal feature data.
- FIG. 12 is a flowchart of operations of the attribute probability estimator 220 at step S 30 .
- the operations at step S 321 correspond to step S 301 shown in FIG. 6 .
- the clustering unit 221 a clusters a distribution of the feature data of the small areas A n in the image 100 .
- known methods can be used, such as a hierarchical method, a k-means method (see CG-ARTS Association, “Digital Image Processing” pp. 231 to 232), an expectation maximization algorithm (EM algorithm), and a self-organizing map.
- FIG. 13A represents an exemplary result of projecting small areas A n having color feature data (C ⁇ n , C ⁇ n ) to a feature space 106 consisting of two axes of feature data C ⁇ and C ⁇ and clustering the feature data distribution of the small areas A n .
- the feature data (C ⁇ n , C ⁇ n ) corresponding to the small area A n is clustered in two clusters CL 1 and CL 2 .
- step S 323 the cluster estimator 221 b estimates a cluster corresponding to the lesion site 101 .
- FIG. 14 is a flowchart of the detailed process at step S 323 .
- the cluster estimator 221 b calculates gravity center coordinates G 1 and G 2 of the respective clusters CL 1 and CL 2 (see FIG. 13B ).
- the gravity center coordinates G 1 and G 2 correspond to average values of the feature data (C ⁇ n , C ⁇ n ) attributed to the respective clusters CL 1 and CL 2 .
- the cluster estimator 221 b estimates probability density functions f S(REF) and f T(REF) of the lesion site area and the non-lesion site area.
- the method of estimating probability density functions are the same as those of steps S 302 to S 304 of the first embodiment.
- feature vectors (C ⁇ , C ⁇ ) are used instead of the feature data C of the first embodiment.
- N D is the number of types of data.
- Equation (9) coefficients of the probability density function f S (C n ) of the lesion site area are calculated, which are shown in the following Equation (9):
- Coefficients of the probability density function f T (C n ) of the non-lesion site are calculated by similar arithmetic operation processing but with different data.
- the cluster estimator 221 b estimates the attribute probability, for the gravity center coordinates G 1 and G 2 , that they are attributed to the lesion site from the probability density functions f S(REF) and f T(REF) and the gravity center coordinates G 1 (C ⁇ G1 ,C ⁇ G1 ) and G 2 (C ⁇ G2 ,C ⁇ G2 ).
- a cluster of the gravity center coordinates whose attribute probability that they are attributed to the lesion site is a given value (e.g., 0.5) or more is estimated as a cluster corresponding to the lesion site 101 (hereinafter, lesion site cluster) (step s 04 : YES at step s 05 ).
- the cluster of the gravity center coordinates whose attribute probability that they are attributed to the lesion site is smaller than the given value (e.g., 0.5) is estimated as a cluster corresponding to the non-lesion site 102 (hereinafter, non-lesion site cluster) (step s 04 : NO at step s 06 ).
- the cluster CL 1 shown in FIG. 13B is estimated as the lesion site cluster and the cluster CL 2 shown in FIG. 13B is estimated as the non-lesion cluster.
- the probability density function estimator 221 c estimates the probability density function f S of the lesion site 101 and the probability density function f T of the non-lesion site 102 in the feature space 106 . They are estimated by applying Equations (7) to (9) to the feature data distribution of the small areas A n contained in the lesion site cluster CL 1 and the feature data distribution of the small areas A n not contained in the lesion site cluster CL 1 (i.e., contained in the non-lesion site cluster CL 2 in FIG. 13A ).
- Equation (6) is an equation of a linear sum of the normal distribution f s (C n ).
- the probability function estimator 221 estimates a probability function F P that gives the attribute probability for each small area An that it is attributed to the lesion site 101 .
- the probability function F P is estimated by estimating the occurrence probability Pc of the lesion site area by dividing the number N S of small areas A n having the feature data attributed to the lesion site cluster CL 1 by the number (N S +N T ) of all small areas A n in the image 100 and by performing a maximum post probability estimate using the occurrence probability Pc and the probability density function f S estimated at step S 324 (or the occurrence probability (1 ⁇ Pc) and the probability density function f T ).
- the attribute probability estimator 220 estimates the attribute probability P n for each small area An that it is attributed to the lesion site 101 .
- the attribute probability estimator 220 estimates the probability function as described above because of the following reasons.
- the features, such as color, in the lumen image 100 often appear in accordance with the sites, such as the lesion site or the non-lesion site, in the subject.
- the clusters CL 1 and CL 2 of the feature data distribution corresponding to each site are generated.
- the features of such sites may differ depending on each subject or the difference in the imaging location in the digestive tract.
- the boundary in the feature data distribution in the feature space 106 which is the boundary dividing the attribute probability of being attributed to the lesion site or the non-lesion site varies in each image (determining to area the attribute probability is higher), varies depending on each image.
- the clusters CL 1 and CL 2 that are divided by the boundary Th 1 are formed as shown in FIG. 15A
- the clusters CL 1 ′ and CL 2 ′ that are divided by the different boundary Th 2 may be generated as shown in FIG. 15B .
- the lesion site 101 may not be appropriately detected.
- the feature data distribution is clustered in each image, the attribute probability of being attributed to the lesion site or the non-lesion site is determined for each cluster, and the attribute probability for each small area An that it is attributed to the lesion site or the non-lesion site is estimated using the result of the determination.
- the feature data (C ⁇ n , C ⁇ n ) contained in the area S 1 is attributed to the cluster CL 2 according to the boundary Th ALL but is categorized as one with higher attribute probability of being attributed to the lesion site.
- the boundary Th 1 is applied to the feature space 106 as shown in FIG. 15A , the feature data (C ⁇ n , C ⁇ n ) contained in the area S 1 is categorized as one with higher attribute probability of being attributed to the non-lesion site.
- the feature data (C ⁇ n , C ⁇ n ) contained in the area S 2 is attributed to the cluster CL 1 , according to the boundary Th ALL but is categorized as one with higher attribute probability of being attributed to the non-lesion site.
- the boundary Th 2 is applied to the feature space 106 as shown in FIG. 15B , the feature data (C ⁇ n , C ⁇ n ) contained in the area S 2 is categorized as one with higher attribute probability of being attributed to the lesion site.
- FIG. 16 is a flowchart of operations of the adjacent-small-area connection strength calculator 230 at step S 40 in FIG. 2 .
- the operations at steps S 421 and S 422 correspond to steps S 401 and S 402 shown in FIG. 8 .
- the following are used as the feature data: statistic data of each of RGB components of pixel values of pixels in each small area A n (average, dispersion, distortion, kurtosis, frequency distribution etc.); texture information on each small area A n ; statistical data (described above), such as the luminance, color difference, hue, chroma, brightness, and color ratio that are secondarily calculated from each of RGB components of pixel values; or texture information based on these secondarily calculated vales.
- the type of the feature data may be the same type as that calculated at step S 321 or a different type. In the former case, the feature data calculated at step S 321 may be stored in the recording unit 14 and, at step S 422 , the feature data may be acquired from the recording unit 14 .
- the connection strength calculator 231 calculates the connection strength of each adjacent small area.
- the fact that the difference ⁇ C in the internal feature data between the small areas A n and A n′ is small means that it is highly likely that the small areas A n and A n′ are contained in the same area and have higher connection strength.
- the connection strength calculator 231 calculates the connection strength such that the value of the connection strength increases as the internal feature data difference ⁇ C becomes smaller.
- connection strength may be calculated.
- a conversion table may be generated in which the internal feature data difference ⁇ C and the connection strength are associated with each other such that the connection strength increases as the internal feature data difference ⁇ C becomes smaller, and the connection strength may be acquired by referring to the conversion table.
- the specific area is detected on the basis of the connection strength that is calculated (acquired) from the difference in the internal feature data between the small areas obtained by dividing the image on the basis of the edge information, thereby the accuracy with which the specific area is detected can be improved. Furthermore, according to the second embodiment, because the probability function corresponding to the feature data distribution of the small areas is estimated in each image, the suitable attribute probability can be estimated for each image by using such a probability function, thereby the accuracy with which the specific area is detected can be further improved.
- An image processing apparatus includes, instead of the arithmetic operator 15 shown in FIG. 1 , an arithmetic operator 30 as shown in FIG. 17 .
- the arithmetic operator 30 includes the area divider 110 , the attribute probability estimator 120 , an adjacent-small-area connection strength calculator 330 , and a lesion site detector 140 .
- the attribute probability estimator 120 the attribute probability estimator 220 shown in FIG. 11 may be provided.
- the adjacent-small-area connection strength calculator 330 includes a connection strength calculator 331 in addition to the adjacency information acquiring unit 131 .
- the connection strength calculator 331 includes a boundary strength calculator 331 a that calculates, as the connection strength, the boundary strength between small areas adjacent to each other. More specifically, the boundary strength calculator 331 a includes a boundary pixel detector a 1 that detects boundary pixels between the small areas adjacent to each other; and a boundary edge intensity calculator a 2 that calculates edge intensity of the boundary pixels.
- the boundary strength calculator 331 a calculates the boundary strength on the basis of the edge intensity of the boundary pixels.
- FIG. 18 is a flowchart of operations of the adjacent-small-area connection strength calculator 330 at step S 40 .
- the operations at step S 431 and step S 432 correspond to steps S 401 and S 402 shown in FIG. 8 .
- a known method may be used, such as tracing the outline in the area label image that is generated at step S 206 (see, CG-ARTS Association, “Digital Image Processing” pp. 178 to 179).
- the boundary edge intensity calculator a 2 calculates edge intensity I EDG (G m ) of the boundary pixels G m .
- the edge intensity of the boundary pixels G m can be calculated by sequentially setting the boundary pixels detected at step S 433 as pixels of interest and by performing a differential filter processing, such as Sobel filtering, on G components of the pixel values of each pixel of interest and pixels in the vicinity of the pixel of interest (see CG-ARTS Association, “Digital Image Processing” pp. 114 to 121).
- the G components are used because, as described above, the G components are close to the absorbance band of blood and thus well reflect the internal structure information on the lumen image.
- color components may be used other than the G components or values (luminance, color difference, hue, chroma, and brightness) based on the pixel values and secondarily calculated from the pixel values by using a known conversion process.
- the connection strength calculator 331 calculates connection strength between each adjacent small area.
- the fact that the boundary strength I BOR between small adjacent areas A n and A n′ is small means that it is highly likely the small areas A n and A n′ are attributed to the same area and have higher connection strength.
- the connection strength calculator 331 calculates the connection strength such that the value of the connection strength increases as the boundary strength I BOR becomes smaller. Specifically, it is satisfactory if if a reduction function where the boundary strength I BOR is a variable is set and connection strength is calculated.
- a conversion table may be created in which the boundary strength I BOR and the boundary strength are associated with each other such that the connection strength increases as the boundary strength I BOR becomes smaller, and the connection strength may be acquired by referring to the conversion table.
- the specific area (lesion site) is detected on the basis of the connection strength that is calculated (acquired) from the boundary strength of the small areas obtained by dividing the image on the basis of the edge information, the accuracy with which the specific area is detected can be improved.
- FIG. 20 is a block diagram of a configuration of an arithmetic operator of an image processing apparatus according to the modification.
- an arithmetic operator 31 according to the modification includes an adjacent-small-area connection strength calculator 340 including a connection strength calculator 341 instead of the connection strength calculator 331 shown in FIG. 17 .
- the connection strength calculator 341 further includes a boundary strength corrector 331 b in addition to the boundary strength calculator 331 a .
- the configuration of the arithmetic operator 31 excluding the boundary strength corrector 331 b is the same as that of the third embodiment.
- FIG. 21 is a flowchart of operations of the adjacent-small-area connection strength calculator 340 .
- the operations at steps S 431 to S 435 and step S 436 are the same as those of the third embodiment.
- the boundary strength corrector 331 b corrects the boundary strength I BOR between small areas adjacent to each other on the basis of the attribute probability P n for each small area that it is attributed to the lesion site 101 (or the attribute probability (1 ⁇ P n ) that it is attributed to the non-lesion site).
- the boundary strength may not be high only between an area attributed to the lesion site and an area attributed to the non-lesion site, but higher boundary strength may be calculated from within the lesion site and within the non-lesion site.
- lesion detection is performed using the boundary strength between the small areas as it is, detection accuracy may decrease.
- the boundary strength between the small areas is corrected on the basis of the attribute probability of each of the adjacent small areas.
- the boundary strength corrector 331 b performs a correction such that, the closer the average value P AVE of attribute probability is to 1 or 0, i.e., the higher the probability that the small areas A n and A n′ are attributed to the same area (the lesion site or the non-lesion site) is, the smaller the boundary strength I BOR between the small areas A n and A n′ becomes.
- the effects can be reduced of the boundary strength between the small areas in the specific area (lesion site) or the non-lesion site (non-lesion site) on discrimination on such areas. Accordingly, the accuracy with which the specific area is detected can be improved.
- An image processing apparatus includes, instead of the arithmetic operator shown in FIG. 1 , an arithmetic operator 40 as shown in FIG. 22 .
- the arithmetic operator 40 includes the area divider 110 , the attribute probability estimator 120 , an adjacent-small-area connection strength calculator 430 , and a lesion site detector 140 .
- the attribute probability estimator 120 the attribute probability estimator 220 shown in FIG. 11 may be provided.
- the adjacent-small-area connection strength calculator 430 includes the adjacency information acquiring unit 131 , a connection strength calculator 431 , and a connection strength corrector 432 .
- the connection strength calculator 431 includes the attribute probability difference calculator 132 a , the internal feature data difference calculator 231 a , and the boundary strength calculator 331 a .
- the connection strength calculator 431 calculates the connection strength between the adjacent small area on the basis of the attribute probability difference ⁇ P calculated by the attribute probability difference calculator 132 a , the internal feature data difference ⁇ C calculated by the internal feature data difference calculator 231 a , and the boundary strength I BOR that is calculated by the boundary strength calculator 331 a .
- connection strength corrector 432 corrects the connection strength I, which is calculated for each adjacent small area, on the basis of the attribute probability P n that the small area is attributed to the lesion site 101 (or the attribute probability (1 ⁇ P n ) that it is attributed to the non-lesion site). Specifically, the connection strength corrector 432 calculates the average value P AVE (P AVE (P n +P n′ /2) of the attribute probability P n and P n′ of the adjacent small areas A n and A n′ and performs a correction such that, the closer the average value P AVE is to 1 or 0, the smaller the boundary strength I becomes. It is satisfactory if, for example, a reduction function F C (P AVE ) where the average value P AVE of attribute probability is a variable is set and the product of the boundary strength I and the function f c is the corrected boundary strength I′.
- connection strength of an arbitrary combination of the attribute probability difference, the internal feature data difference, and the boundary strength can be calculated by adjusting the weighting coefficients w 1 , w 2 , and w 3 . Accordingly, the accuracy with which the lesion site is detected can be improved according to the feature of the image. For example, when an image is diagnosed of a site where color difference can be found in the non-lesion site, the effects of the difference in feature data between adjacent small areas can be reduced by performing an adjustment for reducing the weighting coefficient w 2 .
- connection strength between the small areas can be corrected on the basis of the attribute probability of each small area that is adjacent to another, the effects can be reduced of the connection strength between the adjacent small areas in the specific area or the non-specific area on the discrimination of such areas. Accordingly, the accuracy with which specific area is detected can be improved.
- the image is divided into multiple small areas on the basis of the edge information and then the specific area is detected from the image on the basis of the attribute probability for each small area that it is attributed to the specific area and the connection strength between the small areas adjacent to each other, area division can be performed in consideration of the feature of the small areas each including multiple pixels. Accordingly, the accuracy with which the specific area is detected can be improved.
- the image processing apparatuses according to the first to fourth embodiments and the modification may be used by executing an image processing program that is stored in a recording device by a computer system, such as a personal computer or a work station, etc.
- a computer system may be used by connecting it to a device, such as another computer system or a server, via a local area network (LAN), a wide area network (WAN), or a public line such as the Internet.
- LAN local area network
- WAN wide area network
- public line such as the Internet.
- the image processing apparatuses may acquire image data of a lumen image via the network, output the results of the image processing to various output devices (viewer, printer, etc.) connected via the network, or store the image processing results in a storage device (a recording device and a reading device) that is connected via the network.
Abstract
Description
where ND is the number of types of data.
where Cn is the feature data of the small area to be discriminated. In Equation (4), the parts surrounded by the broken line are the coefficients to be obtained.
where aj≧0 and
where ND is the number of types of data.
where |Z| is the determinant of Z, and Z−1 is the inverse matrix of Z. In Equation (9), the parts surrounded by the broken line are the coefficients to be calculated.
ΔC=√{square root over ((C αn −C αn′)2+(C βn −C βn′)2)}{square root over ((C αn −C αn′)2+(C βn −C βn′)2)} (10)
I=w 1 ·f X(ΔP)+w 2 ·f Y(ΔC)+w 3 ·f Z(I BOR) (11)
where w1, w2 and w3 are weighting coefficients and are constants satisfying w1≧0, w2≧0, w3≧0, and w1+w2+w3=1.
Claims (11)
Applications Claiming Priority (2)
| Application Number | Priority Date | Filing Date | Title |
|---|---|---|---|
| JP2011-104698 | 2011-05-09 | ||
| JP2011104698A JP5771442B2 (en) | 2011-05-09 | 2011-05-09 | Image processing apparatus, image processing method, and image processing program |
Publications (2)
| Publication Number | Publication Date |
|---|---|
| US20120288199A1 US20120288199A1 (en) | 2012-11-15 |
| US8938122B2 true US8938122B2 (en) | 2015-01-20 |
Family
ID=46229128
Family Applications (1)
| Application Number | Title | Priority Date | Filing Date |
|---|---|---|---|
| US13/464,352 Active 2032-09-29 US8938122B2 (en) | 2011-05-09 | 2012-05-04 | Image processing apparatus, image processing method, and computer-readable recording device |
Country Status (4)
| Country | Link |
|---|---|
| US (1) | US8938122B2 (en) |
| EP (1) | EP2523164B1 (en) |
| JP (1) | JP5771442B2 (en) |
| CN (1) | CN102842125B (en) |
Cited By (2)
| Publication number | Priority date | Publication date | Assignee | Title |
|---|---|---|---|---|
| US20150317800A1 (en) * | 2014-05-05 | 2015-11-05 | Xiaomi Inc. | Method and device for image segmentation |
| US10517472B2 (en) | 2015-01-21 | 2019-12-31 | Hoya Corporation | Endoscope system |
Families Citing this family (9)
| Publication number | Priority date | Publication date | Assignee | Title |
|---|---|---|---|---|
| JP5881625B2 (en) * | 2013-01-17 | 2016-03-09 | 富士フイルム株式会社 | Region dividing apparatus, program, and method |
| JP6136537B2 (en) | 2013-04-26 | 2017-05-31 | オムロン株式会社 | Image processing apparatus, image processing method, image processing control program, and recording medium |
| CN107529963B (en) | 2015-04-23 | 2020-06-12 | 奥林巴斯株式会社 | Image processing apparatus, image processing method, and storage medium |
| US10936277B2 (en) * | 2015-06-29 | 2021-03-02 | Audeara Pty Ltd. | Calibration method for customizable personal sound delivery system |
| JP7072765B2 (en) * | 2017-01-31 | 2022-05-23 | 株式会社アイシン | Image processing device, image recognition device, image processing program, and image recognition program |
| CN107563413B (en) * | 2017-08-09 | 2020-10-16 | 千寻位置网络有限公司 | Unmanned aerial vehicle aerial image farmland block object accurate extraction method |
| KR102521889B1 (en) * | 2017-11-06 | 2023-04-13 | 에이조 가부시키가이샤 | Image processing device, image processing method and recording medium recording image processing program |
| CN110580729B (en) * | 2018-06-11 | 2022-12-09 | 阿里巴巴集团控股有限公司 | Image color matching method and device and electronic equipment |
| WO2020133236A1 (en) * | 2018-12-28 | 2020-07-02 | 深圳迈瑞生物医疗电子股份有限公司 | Spinal imaging method and ultrasonic imaging system |
Citations (13)
| Publication number | Priority date | Publication date | Assignee | Title |
|---|---|---|---|---|
| US5767978A (en) * | 1997-01-21 | 1998-06-16 | Xerox Corporation | Image segmentation system |
| US6606408B1 (en) * | 1999-06-24 | 2003-08-12 | Samsung Electronics Co., Ltd. | Image segmenting apparatus and method |
| US20040086184A1 (en) * | 1998-07-31 | 2004-05-06 | Canon Kabushiki Kaisha | Image processing apparatus, image processing method, and storage medium |
| US20050247897A1 (en) * | 2004-05-04 | 2005-11-10 | Werner Haug | Process for the collection and presentation of an X-ray image stored in a phosphor layer |
| EP1847955A1 (en) | 2005-01-31 | 2007-10-24 | Olympus Corporation | Image processor, microscope system, and area specification program |
| JP2009232962A (en) | 2008-03-26 | 2009-10-15 | Fujifilm Corp | Target region extraction device, method and program |
| US7844118B1 (en) * | 2009-07-01 | 2010-11-30 | Xerox Corporation | Image segmentation system and method with improved thin line detection |
| US20110069876A1 (en) | 2008-06-05 | 2011-03-24 | Olympus Corporation | Image processing apparatus, image processing program recording medium, and image processing method |
| US7936924B2 (en) * | 2006-12-21 | 2011-05-03 | Fujifilm Corporation | Mass segmentation using mirror image of region of interest |
| US7965892B2 (en) * | 2005-02-01 | 2011-06-21 | Canon Kabushiki Kaisha | Image processing apparatus, control method thereof, and program |
| US20110243466A1 (en) * | 2010-03-30 | 2011-10-06 | Chung-Ang University Industry-Academy Cooperation Foundation | Apparatus and method of estimating scale ratio and noise strength of encoded image |
| US20120301032A1 (en) * | 2010-11-29 | 2012-11-29 | Ryouichi Kawanishi | Image classification apparatus, image classification method, program, recording medium, integrated circuit, and model creation apparatus |
| US20130188869A1 (en) * | 2012-01-20 | 2013-07-25 | Korea Advanced Institute Of Science And Technology | Image segmentation method using higher-order clustering, system for processing the same and recording medium for storing the same |
Family Cites Families (4)
| Publication number | Priority date | Publication date | Assignee | Title |
|---|---|---|---|---|
| AUPP009697A0 (en) * | 1997-10-29 | 1997-11-20 | Canon Information Systems Research Australia Pty Ltd | Image interpretation method and apparatas |
| US6766037B1 (en) * | 1998-10-02 | 2004-07-20 | Canon Kabushiki Kaisha | Segmenting moving objects and determining their motion |
| JP4905931B2 (en) * | 2006-07-04 | 2012-03-28 | 富士フイルム株式会社 | Human body region extraction method, apparatus, and program |
| JP2011034178A (en) * | 2009-07-30 | 2011-02-17 | Sony Corp | Apparatus and method for image processing, and program |
-
2011
- 2011-05-09 JP JP2011104698A patent/JP5771442B2/en active Active
-
2012
- 2012-05-04 US US13/464,352 patent/US8938122B2/en active Active
- 2012-05-04 EP EP12003438.4A patent/EP2523164B1/en active Active
- 2012-05-09 CN CN201210142707.7A patent/CN102842125B/en active Active
Patent Citations (15)
| Publication number | Priority date | Publication date | Assignee | Title |
|---|---|---|---|---|
| US5767978A (en) * | 1997-01-21 | 1998-06-16 | Xerox Corporation | Image segmentation system |
| US20040086184A1 (en) * | 1998-07-31 | 2004-05-06 | Canon Kabushiki Kaisha | Image processing apparatus, image processing method, and storage medium |
| US7076099B2 (en) * | 1998-07-31 | 2006-07-11 | Canon Kabushiki Kaisha | Image processing apparatus, image processing method, and storage medium |
| US6606408B1 (en) * | 1999-06-24 | 2003-08-12 | Samsung Electronics Co., Ltd. | Image segmenting apparatus and method |
| US20050247897A1 (en) * | 2004-05-04 | 2005-11-10 | Werner Haug | Process for the collection and presentation of an X-ray image stored in a phosphor layer |
| EP1847955A1 (en) | 2005-01-31 | 2007-10-24 | Olympus Corporation | Image processor, microscope system, and area specification program |
| US7965892B2 (en) * | 2005-02-01 | 2011-06-21 | Canon Kabushiki Kaisha | Image processing apparatus, control method thereof, and program |
| US7936924B2 (en) * | 2006-12-21 | 2011-05-03 | Fujifilm Corporation | Mass segmentation using mirror image of region of interest |
| JP2009232962A (en) | 2008-03-26 | 2009-10-15 | Fujifilm Corp | Target region extraction device, method and program |
| US20110069876A1 (en) | 2008-06-05 | 2011-03-24 | Olympus Corporation | Image processing apparatus, image processing program recording medium, and image processing method |
| US7844118B1 (en) * | 2009-07-01 | 2010-11-30 | Xerox Corporation | Image segmentation system and method with improved thin line detection |
| US20110243466A1 (en) * | 2010-03-30 | 2011-10-06 | Chung-Ang University Industry-Academy Cooperation Foundation | Apparatus and method of estimating scale ratio and noise strength of encoded image |
| US8320700B2 (en) * | 2010-03-30 | 2012-11-27 | Chun-Ang University Industry—Academy Cooperation Foundation | Apparatus and method of estimating scale ratio and noise strength of encoded image |
| US20120301032A1 (en) * | 2010-11-29 | 2012-11-29 | Ryouichi Kawanishi | Image classification apparatus, image classification method, program, recording medium, integrated circuit, and model creation apparatus |
| US20130188869A1 (en) * | 2012-01-20 | 2013-07-25 | Korea Advanced Institute Of Science And Technology | Image segmentation method using higher-order clustering, system for processing the same and recording medium for storing the same |
Non-Patent Citations (4)
| Title |
|---|
| Bilodeau, G. et al., "Multistage Graph-Based Segmentation of Thoracoscopic Images", Computerized Medical Imaging and Graphics 30 (2006), pp. 437-446. |
| Boykov, Yuri Y. et al., "Interactive Graph Cuts for Optimal Boundary & Region Segmentation of Objects in N-D Images", Proceedings of "International Conference on Computer Vision", Vancouver, Canada, Jul. 2001, vol. 1, pp. 105-112. |
| Boykov, Yuri Y. et al., "Interactive Graphic Cuts for Optimal Boundary & Region Segmentation of Objects in N-D Images", Proceedings of "International Conference on Computer Vision", Vancouver, Canada, Jul. 2001, vol. 1, pp. 105-112. |
| European Search Report dated Aug. 13, 2012 from corresponding European Patent Application No. EP 12 00 3438.4. |
Cited By (3)
| Publication number | Priority date | Publication date | Assignee | Title |
|---|---|---|---|---|
| US20150317800A1 (en) * | 2014-05-05 | 2015-11-05 | Xiaomi Inc. | Method and device for image segmentation |
| US9633444B2 (en) * | 2014-05-05 | 2017-04-25 | Xiaomi Inc. | Method and device for image segmentation |
| US10517472B2 (en) | 2015-01-21 | 2019-12-31 | Hoya Corporation | Endoscope system |
Also Published As
| Publication number | Publication date |
|---|---|
| US20120288199A1 (en) | 2012-11-15 |
| JP2012238041A (en) | 2012-12-06 |
| CN102842125A (en) | 2012-12-26 |
| JP5771442B2 (en) | 2015-08-26 |
| CN102842125B (en) | 2016-05-04 |
| EP2523164B1 (en) | 2018-07-11 |
| EP2523164A1 (en) | 2012-11-14 |
Similar Documents
| Publication | Publication Date | Title |
|---|---|---|
| US8938122B2 (en) | Image processing apparatus, image processing method, and computer-readable recording device | |
| US8768017B2 (en) | Image processing apparatus, computer readable recording medium storing therein image processing program, and image processing method | |
| Unger et al. | TVSeg-Interactive Total Variation Based Image Segmentation. | |
| US7689016B2 (en) | Automatic detection of critical dermoscopy features for malignant melanoma diagnosis | |
| JP5926937B2 (en) | Image processing apparatus, image processing method, and image processing program | |
| US8781233B2 (en) | Image processing apparatus, method of processing image, and computer-readable recording medium | |
| US8948479B2 (en) | Image processing device, image processing method and computer readable recording device | |
| US9773185B2 (en) | Image processing apparatus, image processing method, and computer readable recording device | |
| US20100124365A1 (en) | Image display device, computer readable storage medium storing image processing program, and image processing method | |
| JP2008520345A (en) | Method and system for detecting and classifying lesions in ultrasound images | |
| US9165370B2 (en) | Image processing apparatus, image processing method, and computer-readable recording device | |
| US9881381B2 (en) | Image processing apparatus, image processing method, and computer-readable recording medium | |
| Karargyris et al. | Segmenting anatomy in chest x-rays for tuberculosis screening | |
| US9129412B2 (en) | Image processing apparatus, image processing method, and computer-readable recording device | |
| US7912294B2 (en) | System and method for toboggan-based object detection in cutting planes | |
| Zinoveva et al. | A texture-based probabilistic approach for lung nodule segmentation | |
| Mishra et al. | Automatic lesion border selection in dermoscopy images using morphology and color features | |
| US9672600B2 (en) | Clavicle suppression in radiographic images | |
| US8774521B2 (en) | Image processing apparatus, image processing method, and computer-readable recording device | |
| Moradi et al. | Multi-class segmentation of skin lesions via joint dictionary learning | |
| KR101474162B1 (en) | Automatic Segmentation system and the method of Ground-glass Opacity Nodule in Chest CT Images | |
| Gómez et al. | Finding regions of interest in pathological images: An attentional model approach | |
| Kaftan et al. | Locally adaptive fuzzy pulmonary vessel segmentation in contrast enhanced CT data | |
| Peruch et al. | Simple, fast, accurate melanocytic lesion segmentation in 1D colour space | |
| Pochernina et al. | Semi-automatic Algorithm for Lumen Segmentation in Histological Images |
Legal Events
| Date | Code | Title | Description |
|---|---|---|---|
| AS | Assignment |
Owner name: OLYMPUS CORPORATION, JAPAN Free format text: ASSIGNMENT OF ASSIGNORS INTEREST;ASSIGNORS:KANDA, YAMATO;KITAMURA, MAKOTO;HIROTA, MASASHI;AND OTHERS;SIGNING DATES FROM 20120501 TO 20120507;REEL/FRAME:028535/0519 |
|
| STCF | Information on status: patent grant |
Free format text: PATENTED CASE |
|
| AS | Assignment |
Owner name: OLYMPUS CORPORATION, JAPAN Free format text: CHANGE OF ADDRESS;ASSIGNOR:OLYMPUS CORPORATION;REEL/FRAME:039344/0502 Effective date: 20160401 |
|
| MAFP | Maintenance fee payment |
Free format text: PAYMENT OF MAINTENANCE FEE, 4TH YEAR, LARGE ENTITY (ORIGINAL EVENT CODE: M1551) Year of fee payment: 4 |
|
| MAFP | Maintenance fee payment |
Free format text: PAYMENT OF MAINTENANCE FEE, 8TH YEAR, LARGE ENTITY (ORIGINAL EVENT CODE: M1552); ENTITY STATUS OF PATENT OWNER: LARGE ENTITY Year of fee payment: 8 |