US9001320B2 - Real-time mapping of electronic structure with single-shot two-dimensional electronic spectroscopy - Google Patents
Real-time mapping of electronic structure with single-shot two-dimensional electronic spectroscopy Download PDFInfo
- Publication number
- US9001320B2 US9001320B2 US13/814,427 US201113814427A US9001320B2 US 9001320 B2 US9001320 B2 US 9001320B2 US 201113814427 A US201113814427 A US 201113814427A US 9001320 B2 US9001320 B2 US 9001320B2
- Authority
- US
- United States
- Prior art keywords
- signal
- pulse
- sample
- spectrum
- laser
- Prior art date
- Legal status (The legal status is an assumption and is not a legal conclusion. Google has not performed a legal analysis and makes no representation as to the accuracy of the status listed.)
- Active
Links
- 238000000426 electronic spectroscopy Methods 0.000 title abstract description 13
- 238000013507 mapping Methods 0.000 title description 7
- 238000000034 method Methods 0.000 claims abstract description 142
- 238000004611 spectroscopical analysis Methods 0.000 claims abstract description 111
- 238000002265 electronic spectrum Methods 0.000 claims abstract description 13
- 238000001914 filtration Methods 0.000 claims description 3
- 238000001228 spectrum Methods 0.000 description 178
- 239000000523 sample Substances 0.000 description 172
- 230000003287 optical effect Effects 0.000 description 82
- 230000008878 coupling Effects 0.000 description 70
- 238000010168 coupling process Methods 0.000 description 70
- 238000005859 coupling reaction Methods 0.000 description 70
- 238000012546 transfer Methods 0.000 description 53
- 230000003595 spectral effect Effects 0.000 description 51
- 230000002123 temporal effect Effects 0.000 description 47
- OKKJLVBELUTLKV-UHFFFAOYSA-N Methanol Chemical compound OC OKKJLVBELUTLKV-UHFFFAOYSA-N 0.000 description 42
- 238000010009 beating Methods 0.000 description 42
- 238000002474 experimental method Methods 0.000 description 41
- 230000003993 interaction Effects 0.000 description 40
- 238000005259 measurement Methods 0.000 description 40
- 238000010521 absorption reaction Methods 0.000 description 39
- 230000005284 excitation Effects 0.000 description 35
- 230000001427 coherent effect Effects 0.000 description 26
- 230000000694 effects Effects 0.000 description 26
- 230000006870 function Effects 0.000 description 25
- 230000007704 transition Effects 0.000 description 25
- 238000003384 imaging method Methods 0.000 description 24
- 238000000862 absorption spectrum Methods 0.000 description 23
- 230000005281 excited state Effects 0.000 description 23
- 230000037361 pathway Effects 0.000 description 23
- 230000001934 delay Effects 0.000 description 22
- 230000004044 response Effects 0.000 description 21
- 238000005481 NMR spectroscopy Methods 0.000 description 20
- 238000013459 approach Methods 0.000 description 20
- 239000002904 solvent Substances 0.000 description 20
- 238000001514 detection method Methods 0.000 description 19
- 238000001208 nuclear magnetic resonance pulse sequence Methods 0.000 description 19
- 230000001052 transient effect Effects 0.000 description 19
- 238000005070 sampling Methods 0.000 description 18
- 230000010287 polarization Effects 0.000 description 17
- 239000000463 material Substances 0.000 description 16
- 230000035559 beat frequency Effects 0.000 description 15
- 230000000875 corresponding effect Effects 0.000 description 14
- 230000007246 mechanism Effects 0.000 description 14
- 238000004458 analytical method Methods 0.000 description 13
- 238000005305 interferometry Methods 0.000 description 13
- 230000008859 change Effects 0.000 description 12
- 230000008569 process Effects 0.000 description 12
- 239000002096 quantum dot Substances 0.000 description 12
- 230000009466 transformation Effects 0.000 description 12
- 239000000049 pigment Substances 0.000 description 11
- 239000000243 solution Substances 0.000 description 11
- 230000003068 static effect Effects 0.000 description 11
- XKRFYHLGVUSROY-UHFFFAOYSA-N Argon Chemical compound [Ar] XKRFYHLGVUSROY-UHFFFAOYSA-N 0.000 description 10
- 238000002595 magnetic resonance imaging Methods 0.000 description 10
- 230000010355 oscillation Effects 0.000 description 10
- 230000008901 benefit Effects 0.000 description 9
- 238000002156 mixing Methods 0.000 description 9
- 230000000243 photosynthetic effect Effects 0.000 description 9
- 108090000623 proteins and genes Proteins 0.000 description 9
- 102000004169 proteins and genes Human genes 0.000 description 9
- 230000001172 regenerating effect Effects 0.000 description 9
- 230000006641 stabilisation Effects 0.000 description 9
- 238000011105 stabilization Methods 0.000 description 9
- 241000191043 Rhodobacter sphaeroides Species 0.000 description 8
- 238000009826 distribution Methods 0.000 description 8
- 238000003306 harvesting Methods 0.000 description 8
- XCAUINMIESBTBL-UHFFFAOYSA-N lead(ii) sulfide Chemical compound [Pb]=S XCAUINMIESBTBL-UHFFFAOYSA-N 0.000 description 8
- 230000002829 reductive effect Effects 0.000 description 8
- 239000000126 substance Substances 0.000 description 8
- 108010059332 Photosynthetic Reaction Center Complex Proteins Proteins 0.000 description 7
- 239000011521 glass Substances 0.000 description 7
- 230000005283 ground state Effects 0.000 description 7
- 239000010936 titanium Substances 0.000 description 7
- 241000192142 Proteobacteria Species 0.000 description 6
- 238000012512 characterization method Methods 0.000 description 6
- 230000002596 correlated effect Effects 0.000 description 6
- 238000005314 correlation function Methods 0.000 description 6
- 238000007405 data analysis Methods 0.000 description 6
- 230000001419 dependent effect Effects 0.000 description 6
- 238000010995 multi-dimensional NMR spectroscopy Methods 0.000 description 6
- 239000002159 nanocrystal Substances 0.000 description 6
- 239000002086 nanomaterial Substances 0.000 description 6
- 230000009467 reduction Effects 0.000 description 6
- 239000004065 semiconductor Substances 0.000 description 6
- 238000000926 separation method Methods 0.000 description 6
- 238000005084 2D-nuclear magnetic resonance Methods 0.000 description 5
- 238000012935 Averaging Methods 0.000 description 5
- 229910052786 argon Inorganic materials 0.000 description 5
- 230000002238 attenuated effect Effects 0.000 description 5
- 238000004364 calculation method Methods 0.000 description 5
- 239000013078 crystal Substances 0.000 description 5
- 238000009792 diffusion process Methods 0.000 description 5
- 239000006185 dispersion Substances 0.000 description 5
- 230000010113 energy transfer pathway Effects 0.000 description 5
- 230000033001 locomotion Effects 0.000 description 5
- 229910052594 sapphire Inorganic materials 0.000 description 5
- 239000010980 sapphire Substances 0.000 description 5
- 238000013519 translation Methods 0.000 description 5
- 241000191382 Chlorobaculum tepidum Species 0.000 description 4
- FAPWRFPIFSIZLT-UHFFFAOYSA-M Sodium chloride Chemical compound [Na+].[Cl-] FAPWRFPIFSIZLT-UHFFFAOYSA-M 0.000 description 4
- 238000007792 addition Methods 0.000 description 4
- 239000000975 dye Substances 0.000 description 4
- 238000010585 feynman-diagram Methods 0.000 description 4
- 239000007789 gas Substances 0.000 description 4
- CCCMONHAUSKTEQ-UHFFFAOYSA-N octadec-1-ene Chemical compound CCCCCCCCCCCCCCCCC=C CCCMONHAUSKTEQ-UHFFFAOYSA-N 0.000 description 4
- 230000035945 sensitivity Effects 0.000 description 4
- 238000001327 Förster resonance energy transfer Methods 0.000 description 3
- 238000001069 Raman spectroscopy Methods 0.000 description 3
- 230000015572 biosynthetic process Effects 0.000 description 3
- 238000006243 chemical reaction Methods 0.000 description 3
- 230000003111 delayed effect Effects 0.000 description 3
- 238000013461 design Methods 0.000 description 3
- 230000001627 detrimental effect Effects 0.000 description 3
- 230000005684 electric field Effects 0.000 description 3
- 230000005274 electronic transitions Effects 0.000 description 3
- 230000002427 irreversible effect Effects 0.000 description 3
- 230000000670 limiting effect Effects 0.000 description 3
- 239000012528 membrane Substances 0.000 description 3
- VLKZOEOYAKHREP-UHFFFAOYSA-N n-Hexane Chemical compound CCCCCC VLKZOEOYAKHREP-UHFFFAOYSA-N 0.000 description 3
- 230000008521 reorganization Effects 0.000 description 3
- 238000011160 research Methods 0.000 description 3
- 238000005316 response function Methods 0.000 description 3
- 238000004088 simulation Methods 0.000 description 3
- 239000007787 solid Substances 0.000 description 3
- 238000007614 solvation Methods 0.000 description 3
- 238000012306 spectroscopic technique Methods 0.000 description 3
- 230000008093 supporting effect Effects 0.000 description 3
- 238000004627 transmission electron microscopy Methods 0.000 description 3
- 238000012573 2D experiment Methods 0.000 description 2
- 102000006410 Apoproteins Human genes 0.000 description 2
- 108010083590 Apoproteins Proteins 0.000 description 2
- OKTJSMMVPCPJKN-UHFFFAOYSA-N Carbon Chemical compound [C] OKTJSMMVPCPJKN-UHFFFAOYSA-N 0.000 description 2
- HEDRZPFGACZZDS-UHFFFAOYSA-N Chloroform Chemical compound ClC(Cl)Cl HEDRZPFGACZZDS-UHFFFAOYSA-N 0.000 description 2
- 108020004414 DNA Proteins 0.000 description 2
- LFQSCWFLJHTTHZ-UHFFFAOYSA-N Ethanol Chemical compound CCO LFQSCWFLJHTTHZ-UHFFFAOYSA-N 0.000 description 2
- 238000004566 IR spectroscopy Methods 0.000 description 2
- 239000007844 bleaching agent Substances 0.000 description 2
- 238000004422 calculation algorithm Methods 0.000 description 2
- 239000002041 carbon nanotube Substances 0.000 description 2
- 229910021393 carbon nanotube Inorganic materials 0.000 description 2
- 230000019522 cellular metabolic process Effects 0.000 description 2
- 150000001875 compounds Chemical class 0.000 description 2
- 230000006835 compression Effects 0.000 description 2
- 238000007906 compression Methods 0.000 description 2
- 230000001276 controlling effect Effects 0.000 description 2
- 238000012937 correction Methods 0.000 description 2
- 238000013016 damping Methods 0.000 description 2
- DIOQZVSQGTUSAI-UHFFFAOYSA-N decane Chemical compound CCCCCCCCCC DIOQZVSQGTUSAI-UHFFFAOYSA-N 0.000 description 2
- 238000011161 development Methods 0.000 description 2
- 238000010586 diagram Methods 0.000 description 2
- 238000006073 displacement reaction Methods 0.000 description 2
- 238000005516 engineering process Methods 0.000 description 2
- 230000007613 environmental effect Effects 0.000 description 2
- 238000000605 extraction Methods 0.000 description 2
- 230000004907 flux Effects 0.000 description 2
- 238000009615 fourier-transform spectroscopy Methods 0.000 description 2
- 239000005350 fused silica glass Substances 0.000 description 2
- 230000001976 improved effect Effects 0.000 description 2
- 230000002452 interceptive effect Effects 0.000 description 2
- 238000011835 investigation Methods 0.000 description 2
- 239000000990 laser dye Substances 0.000 description 2
- 230000003446 memory effect Effects 0.000 description 2
- 239000000203 mixture Substances 0.000 description 2
- 238000012821 model calculation Methods 0.000 description 2
- 238000012986 modification Methods 0.000 description 2
- 230000004048 modification Effects 0.000 description 2
- 238000012544 monitoring process Methods 0.000 description 2
- 238000000655 nuclear magnetic resonance spectrum Methods 0.000 description 2
- 239000002245 particle Substances 0.000 description 2
- 238000005424 photoluminescence Methods 0.000 description 2
- 238000012805 post-processing Methods 0.000 description 2
- 238000002360 preparation method Methods 0.000 description 2
- 230000001902 propagating effect Effects 0.000 description 2
- 238000004445 quantitative analysis Methods 0.000 description 2
- 239000004054 semiconductor nanocrystal Substances 0.000 description 2
- 239000011780 sodium chloride Substances 0.000 description 2
- 241000894007 species Species 0.000 description 2
- 230000007480 spreading Effects 0.000 description 2
- 238000003892 spreading Methods 0.000 description 2
- YBNMDCCMCLUHBL-UHFFFAOYSA-N (2,5-dioxopyrrolidin-1-yl) 4-pyren-1-ylbutanoate Chemical compound C=1C=C(C2=C34)C=CC3=CC=CC4=CC=C2C=1CCCC(=O)ON1C(=O)CCC1=O YBNMDCCMCLUHBL-UHFFFAOYSA-N 0.000 description 1
- WRIDQFICGBMAFQ-UHFFFAOYSA-N (E)-8-Octadecenoic acid Natural products CCCCCCCCCC=CCCCCCCC(O)=O WRIDQFICGBMAFQ-UHFFFAOYSA-N 0.000 description 1
- QKNYBSVHEMOAJP-UHFFFAOYSA-N 2-amino-2-(hydroxymethyl)propane-1,3-diol;hydron;chloride Chemical compound Cl.OCC(N)(CO)CO QKNYBSVHEMOAJP-UHFFFAOYSA-N 0.000 description 1
- LQJBNNIYVWPHFW-UHFFFAOYSA-N 20:1omega9c fatty acid Natural products CCCCCCCCCCC=CCCCCCCCC(O)=O LQJBNNIYVWPHFW-UHFFFAOYSA-N 0.000 description 1
- QSBYPNXLFMSGKH-UHFFFAOYSA-N 9-Heptadecensaeure Natural products CCCCCCCC=CCCCCCCCC(O)=O QSBYPNXLFMSGKH-UHFFFAOYSA-N 0.000 description 1
- 230000002407 ATP formation Effects 0.000 description 1
- 241001270131 Agaricus moelleri Species 0.000 description 1
- 241000269350 Anura Species 0.000 description 1
- 108010003118 Bacteriochlorophylls Proteins 0.000 description 1
- 102000053602 DNA Human genes 0.000 description 1
- 108090000790 Enzymes Proteins 0.000 description 1
- 102000004190 Enzymes Human genes 0.000 description 1
- 108010034715 Light-Harvesting Protein Complexes Proteins 0.000 description 1
- ZQPPMHVWECSIRJ-UHFFFAOYSA-N Oleic acid Natural products CCCCCCCCC=CCCCCCCCC(O)=O ZQPPMHVWECSIRJ-UHFFFAOYSA-N 0.000 description 1
- 239000005642 Oleic acid Substances 0.000 description 1
- 238000001237 Raman spectrum Methods 0.000 description 1
- 241000131970 Rhodospirillaceae Species 0.000 description 1
- VYPSYNLAJGMNEJ-UHFFFAOYSA-N Silicium dioxide Chemical compound O=[Si]=O VYPSYNLAJGMNEJ-UHFFFAOYSA-N 0.000 description 1
- RTAQQCXQSZGOHL-UHFFFAOYSA-N Titanium Chemical compound [Ti] RTAQQCXQSZGOHL-UHFFFAOYSA-N 0.000 description 1
- 239000007983 Tris buffer Substances 0.000 description 1
- 238000002835 absorbance Methods 0.000 description 1
- 230000003044 adaptive effect Effects 0.000 description 1
- 230000003466 anti-cipated effect Effects 0.000 description 1
- 230000001580 bacterial effect Effects 0.000 description 1
- DSJXIQQMORJERS-AGGZHOMASA-M bacteriochlorophyll a Chemical compound C1([C@@H](C(=O)OC)C(=O)C2=C3C)=C2N2C3=CC([C@H](CC)[C@H]3C)=[N+]4C3=CC3=C(C(C)=O)C(C)=C5N3[Mg-2]42[N+]2=C1[C@@H](CCC(=O)OC\C=C(/C)CCC[C@H](C)CCC[C@H](C)CCCC(C)C)[C@H](C)C2=C5 DSJXIQQMORJERS-AGGZHOMASA-M 0.000 description 1
- 238000005284 basis set Methods 0.000 description 1
- 230000006399 behavior Effects 0.000 description 1
- 239000012472 biological sample Substances 0.000 description 1
- RLECCBFNWDXKPK-UHFFFAOYSA-N bis(trimethylsilyl)sulfide Chemical compound C[Si](C)(C)S[Si](C)(C)C RLECCBFNWDXKPK-UHFFFAOYSA-N 0.000 description 1
- 239000000872 buffer Substances 0.000 description 1
- UHYPYGJEEGLRJD-UHFFFAOYSA-N cadmium(2+);selenium(2-) Chemical compound [Se-2].[Cd+2] UHYPYGJEEGLRJD-UHFFFAOYSA-N 0.000 description 1
- 239000003575 carbonaceous material Substances 0.000 description 1
- 230000015556 catabolic process Effects 0.000 description 1
- 238000005119 centrifugation Methods 0.000 description 1
- 150000004770 chalcogenides Chemical class 0.000 description 1
- 239000003086 colorant Substances 0.000 description 1
- 230000000295 complement effect Effects 0.000 description 1
- 238000001816 cooling Methods 0.000 description 1
- 238000005100 correlation spectroscopy Methods 0.000 description 1
- 230000001351 cycling effect Effects 0.000 description 1
- 230000003247 decreasing effect Effects 0.000 description 1
- 238000007872 degassing Methods 0.000 description 1
- 238000006731 degradation reaction Methods 0.000 description 1
- 230000002939 deleterious effect Effects 0.000 description 1
- 238000012217 deletion Methods 0.000 description 1
- 230000037430 deletion Effects 0.000 description 1
- 239000003599 detergent Substances 0.000 description 1
- 230000004069 differentiation Effects 0.000 description 1
- 239000000539 dimer Substances 0.000 description 1
- SYELZBGXAIXKHU-UHFFFAOYSA-N dodecyldimethylamine N-oxide Chemical compound CCCCCCCCCCCC[N+](C)(C)[O-] SYELZBGXAIXKHU-UHFFFAOYSA-N 0.000 description 1
- 238000007876 drug discovery Methods 0.000 description 1
- 238000002592 echocardiography Methods 0.000 description 1
- 238000000295 emission spectrum Methods 0.000 description 1
- 230000005279 excitation period Effects 0.000 description 1
- 238000000695 excitation spectrum Methods 0.000 description 1
- 230000001747 exhibiting effect Effects 0.000 description 1
- 239000000284 extract Substances 0.000 description 1
- 238000010304 firing Methods 0.000 description 1
- 229910052731 fluorine Inorganic materials 0.000 description 1
- 239000012634 fragment Substances 0.000 description 1
- 101150083586 hemL gene Proteins 0.000 description 1
- 238000001455 hole-burning spectroscopy Methods 0.000 description 1
- 239000012478 homogenous sample Substances 0.000 description 1
- 230000006872 improvement Effects 0.000 description 1
- 230000006698 induction Effects 0.000 description 1
- 230000001939 inductive effect Effects 0.000 description 1
- 230000010354 integration Effects 0.000 description 1
- 150000002500 ions Chemical class 0.000 description 1
- QXJSBBXBKPUZAA-UHFFFAOYSA-N isooleic acid Natural products CCCCCCCC=CCCCCCCCCC(O)=O QXJSBBXBKPUZAA-UHFFFAOYSA-N 0.000 description 1
- 150000002605 large molecules Chemical class 0.000 description 1
- 229910000464 lead oxide Inorganic materials 0.000 description 1
- 238000012417 linear regression Methods 0.000 description 1
- 239000007788 liquid Substances 0.000 description 1
- 230000007774 longterm Effects 0.000 description 1
- 229920002521 macromolecule Polymers 0.000 description 1
- 230000001404 mediated effect Effects 0.000 description 1
- 239000002207 metabolite Substances 0.000 description 1
- 238000000329 molecular dynamics simulation Methods 0.000 description 1
- 239000000178 monomer Substances 0.000 description 1
- 230000008450 motivation Effects 0.000 description 1
- 230000007935 neutral effect Effects 0.000 description 1
- 239000012299 nitrogen atmosphere Substances 0.000 description 1
- 238000005312 nonlinear dynamic Methods 0.000 description 1
- 238000012585 nuclear overhauser effect spectroscopy experiment Methods 0.000 description 1
- ZQPPMHVWECSIRJ-KTKRTIGZSA-N oleic acid Chemical compound CCCCCCCC\C=C/CCCCCCCC(O)=O ZQPPMHVWECSIRJ-KTKRTIGZSA-N 0.000 description 1
- 238000005457 optimization Methods 0.000 description 1
- 230000005693 optoelectronics Effects 0.000 description 1
- 230000008520 organization Effects 0.000 description 1
- 230000003534 oscillatory effect Effects 0.000 description 1
- YEXPOXQUZXUXJW-UHFFFAOYSA-N oxolead Chemical compound [Pb]=O YEXPOXQUZXUXJW-UHFFFAOYSA-N 0.000 description 1
- 238000005192 partition Methods 0.000 description 1
- 230000002093 peripheral effect Effects 0.000 description 1
- 230000002572 peristaltic effect Effects 0.000 description 1
- 230000010363 phase shift Effects 0.000 description 1
- 229910052698 phosphorus Inorganic materials 0.000 description 1
- 230000000886 photobiology Effects 0.000 description 1
- 230000008832 photodamage Effects 0.000 description 1
- 238000001782 photodegradation Methods 0.000 description 1
- 238000006303 photolysis reaction Methods 0.000 description 1
- 230000029553 photosynthesis Effects 0.000 description 1
- 238000010672 photosynthesis Methods 0.000 description 1
- 230000015843 photosynthesis, light reaction Effects 0.000 description 1
- 230000001376 precipitating effect Effects 0.000 description 1
- 238000003825 pressing Methods 0.000 description 1
- 230000001737 promoting effect Effects 0.000 description 1
- CMDGQTVYVAKDNA-UHFFFAOYSA-N propane-1,2,3-triol;hydrate Chemical compound O.OCC(O)CO CMDGQTVYVAKDNA-UHFFFAOYSA-N 0.000 description 1
- 230000012846 protein folding Effects 0.000 description 1
- 238000001472 pulsed field gradient Methods 0.000 description 1
- 230000005610 quantum mechanics Effects 0.000 description 1
- 238000010791 quenching Methods 0.000 description 1
- 230000000171 quenching effect Effects 0.000 description 1
- 230000005855 radiation Effects 0.000 description 1
- 239000011541 reaction mixture Substances 0.000 description 1
- 230000002040 relaxant effect Effects 0.000 description 1
- 230000002441 reversible effect Effects 0.000 description 1
- 238000012552 review Methods 0.000 description 1
- 238000007493 shaping process Methods 0.000 description 1
- 238000004904 shortening Methods 0.000 description 1
- 230000019491 signal transduction Effects 0.000 description 1
- 150000003384 small molecules Chemical class 0.000 description 1
- 239000000758 substrate Substances 0.000 description 1
- 229910052717 sulfur Inorganic materials 0.000 description 1
- 238000003786 synthesis reaction Methods 0.000 description 1
- 229920001059 synthetic polymer Polymers 0.000 description 1
- 238000012360 testing method Methods 0.000 description 1
- 229910052719 titanium Inorganic materials 0.000 description 1
- 230000001131 transforming effect Effects 0.000 description 1
- 230000001960 triggered effect Effects 0.000 description 1
- 238000001845 vibrational spectrum Methods 0.000 description 1
- 238000012800 visualization Methods 0.000 description 1
- 238000005406 washing Methods 0.000 description 1
Images


Classifications
-
- G—PHYSICS
- G01—MEASURING; TESTING
- G01J—MEASUREMENT OF INTENSITY, VELOCITY, SPECTRAL CONTENT, POLARISATION, PHASE OR PULSE CHARACTERISTICS OF INFRARED, VISIBLE OR ULTRAVIOLET LIGHT; COLORIMETRY; RADIATION PYROMETRY
- G01J3/00—Spectrometry; Spectrophotometry; Monochromators; Measuring colours
- G01J3/28—Investigating the spectrum
- G01J3/40—Measuring the intensity of spectral lines by determining density of a photograph of the spectrum; Spectrography
-
- G—PHYSICS
- G01—MEASURING; TESTING
- G01J—MEASUREMENT OF INTENSITY, VELOCITY, SPECTRAL CONTENT, POLARISATION, PHASE OR PULSE CHARACTERISTICS OF INFRARED, VISIBLE OR ULTRAVIOLET LIGHT; COLORIMETRY; RADIATION PYROMETRY
- G01J3/00—Spectrometry; Spectrophotometry; Monochromators; Measuring colours
- G01J3/02—Details
- G01J3/10—Arrangements of light sources specially adapted for spectrometry or colorimetry
-
- G—PHYSICS
- G01—MEASURING; TESTING
- G01J—MEASUREMENT OF INTENSITY, VELOCITY, SPECTRAL CONTENT, POLARISATION, PHASE OR PULSE CHARACTERISTICS OF INFRARED, VISIBLE OR ULTRAVIOLET LIGHT; COLORIMETRY; RADIATION PYROMETRY
- G01J3/00—Spectrometry; Spectrophotometry; Monochromators; Measuring colours
- G01J3/28—Investigating the spectrum
- G01J3/447—Polarisation spectrometry
-
- G—PHYSICS
- G01—MEASURING; TESTING
- G01J—MEASUREMENT OF INTENSITY, VELOCITY, SPECTRAL CONTENT, POLARISATION, PHASE OR PULSE CHARACTERISTICS OF INFRARED, VISIBLE OR ULTRAVIOLET LIGHT; COLORIMETRY; RADIATION PYROMETRY
- G01J3/00—Spectrometry; Spectrophotometry; Monochromators; Measuring colours
- G01J3/28—Investigating the spectrum
- G01J3/45—Interferometric spectrometry
- G01J3/453—Interferometric spectrometry by correlation of the amplitudes
Definitions
- the present application generally relates to techniques for optical spectroscopy and, more particularly, to single laser-shot two-dimensional spectroscopic mapping techniques.
- the electronic structure of a material and the dynamics within that material determine the properties and behavior of the material.
- Relatively mature processes such as spectroscopic and other imaging techniques, are often used to measure the structure of a material. Measuring material dynamics, however, can be more challenging. This is in part because, to measure dynamics, the necessary timescales typically range from attoseconds to milliseconds. This range is vast and requires very specialized equipment, and even then the techniques are limited.
- Two-dimensional (2D) optical spectroscopy for example, has been used to probe fast spatiotemporal electronic dynamics in complex multichromophoric systems. However, acquiring the desired spectra requires long point-by-point acquisitions that preclude observations on the millisecond and microsecond timescales.
- the present disclosure provides techniques for imaging temporally encoded information within a homogeneous sample by mapping the evolution of the electronic Hamiltonian with femtosecond temporal resolution in a single laser-shot.
- the result is the first real-time mapping of electronic coupling within a sample.
- the techniques termed herein GRadient-Assisted Photon Echo spectroscopy (GRAPE), largely eliminate phase errors deleterious to Fourier-based spectroscopic techniques, while reducing the acquisition time by orders of magnitude using only conventional optical components.
- the GRAPE spectroscopy techniques described herein take advantage of spatial encoding to construct electronic correlation maps, in a loosely similar manner to that of magnetic resonance imaging (MRI) in which magnetic field gradients are used to create spatial correlation maps. Unlike magnetic resonance, however, this spatial encoding of a nonlinear polarization along the excitation frequency axis of the 2D spectrum results in no loss in signal while simultaneously reducing overall noise.
- the techniques can thus provide substantial advantages over existing imaging techniques and allow for assessment of electronic structure in many different fields of study. For example, these present techniques can correlate energy transfer events and electronic coupling that occur in the tens of femtoseconds with much slower dynamics that occur on the sub-second timescale.
- UV/Vis spectrometers give you only a linear spectrum to characterize a sample.
- the present techniques may provide two-dimensional (2D) spectral data (static spectra) and a three-dimensional (3D) spectral data (static spectra plus dynamics). The additional dimensions of resolution remove ambiguities associated with current UV/Vis linear methods. Further, the present techniques are able to perform full 3D characterizations in the same amount of time or faster than linear UV/Vis spectrometers.
- a method for performing a spectroscopic analysis on a sample using a single incident laser pulse comprises: converting the incident laser pulse into a plurality of laser pulses that each are made to generally propagate along a direction of propagation incident upon the sample, wherein the plurality of laser pulses includes the incident laser pulse; tilting the wavefronts of at least some of the plurality of laser pulses relative to the incident laser pulse and to at least one of the plurality of laser pulses; focusing the incident laser pulse and the plurality of laser pulses onto a sampling region of the sample; and performing a spectroscopic analysis of a resulting pulsed output signal from the sampling region.
- converting the incident laser pulse comprises coupling the incident laser pulse to a beam splitting mirror element for converting the incident laser pulse into four laser pulses, including the incident laser pulse.
- the beam splitting mirror element is a set of wedges, which may be coated to increase the power of the reflected beams.
- converting the incident laser pulse comprises coupling the incident laser pulse to an acousto-optic modulator or spatial light modulator for converting the incident laser pulse into four laser pulses, including the incident laser pulse.
- converting the incident laser pulse comprises forming a first laser pulse, a second laser pulse, and a third laser pulse, and wherein tilting the wavefronts comprises tilting the incident laser pulse and the third laser pulse in opposite directions relative to the first laser pulse and the second laser pulse, wherein the first laser pulse and the second laser pulse have substantially parallel wavefronts.
- the method further includes focusing the incident laser pulse, the first laser pulse, the second laser pulse, and the third laser pulse onto a line in the sample region, wherein the line has a coherence time defined by the relative tilting of the wavefronts on the plurality of laser pulses.
- any of the incident laser pulses may be focused onto a line in the sample region using a cylindrical lens or a cylinder mirror.
- the line may be longer than 1 mm, 2 mm, and 3 mm, in different examples.
- a cylinder mirror may be selected to optimize the bandwidth for a particular application, for example, to broaden the bandwidth.
- the coherence time is less than 10 picoseconds. In some of these examples, the coherence time is between about 100 to about 300 femtoseconds. In general, the coherence time is limited to a particular time range.
- the formed line extends within the sample and is substantially perpendicular to the direction of propagation.
- the method comprises imaging the pulsed output signal onto a two-dimensional photodetector of a spectrometer.
- the two-dimensional photodetector of a spectrometer may be a fast camera.
- the method includes, in response to imaging the pulsed output signal onto the two-dimensional photodetector, converting data from the photodetector into a two-dimensional frequency spectra indicating a physical attribute of the sample over the sampling region.
- the physical attribute can be any of the following or a combination thereof: an electron state energy transfer event; a Stokes shift energy transfer event; a vibrational state shift in the ground or excited electronic states; inhomogeneous broadening within the sample; and homogenous linewidth of a molecule within the sample.
- the physical attribute demonstrates coupling between different chromophores forming the sample.
- the method further includes: performing the spectroscopic analysis of the resulting pulsed output signal at different times; in response to imaging the pulsed output signal onto the two-dimensional photodetector, converting data from the photodetector at the different times into two-dimensional frequency spectra; and comparing the two-dimensional frequency spectra at the different times to determine a dynamic attribute of the sample over the sampling region.
- the dynamic attribute may be a relaxation effect and/or a memory effect.
- the dynamic attribute may be quantum beating, energy transfer, or absorption and emission spectra differences.
- the dynamic attributes can provide information on relaxation effects, e.g., changes in the populations of each state during a delay, or relaxation to different states.
- Quantum beating may allow for efficient energy transfer in biological systems (e.g. photosynthetic complexes).
- biological systems e.g. photosynthetic complexes.
- the techniques could determine if a molecule that oscillates at one frequency ‘remembers’ its transition energy a certain amount of time later or if that information lost.
- a method for forming a two-dimensional electronic spectrum of a sample includes: illuminating a line within a homogeneous portion of the sample with four laser pulses; wherein along the entire line the difference in the arrival times between the first and second laser pulses varies as a function of the position of the point on the line and the difference in the arrival times between the third and fourth laser pulses is constant along the entire line; and performing a spectroscopic analysis of a resulting pulsed output signal from the illuminated line.
- At at least one position on the line the second laser pulse arrives before the third laser pulse and wherein at at least one other position on the line the second laser pulse arrives after the third laser pulse.
- the first laser pulse arrives before all of the second, third and fourth laser pulses.
- the first laser pulse arrives after all of the second, third and fourth laser pulses.
- a method for forming a two-dimensional electronic spectrum of a sample includes: illuminating a line within a homogeneous portion of the sample with four laser pulses; wherein along the entire line the interval between the arrival of the first laser pulse and the arrival of the third laser pulse varies, along the entire line the interval between the arrival of the second laser pulse and the arrival of the third laser pulse varies, and along the entire line the interval between the arrival of the third laser pulse and the arrival of the fourth laser pulse is constant; and performing a spectroscopic analysis of a resulting pulsed output signal from the illuminated line.
- the interval between the arrival of the first laser pulse and the arrival of the third laser pulse is greater than the interval between the arrival of the second laser pulse and the arrival of the third laser pulse.
- the first laser pulse arrives before the second, third and fourth laser pulses.
- the fourth laser pulse arrives after the first, second and third laser pulses.
- the second laser pulse arrives before the third laser pulse, and at other points positions along the line, the second laser pulse arrives after the third laser pulse.
- performing a spectroscopic analysis comprises filtering out the first, second and third laser pulses, and collecting and binning the pulsed output signal along the line using a grating and spectrometer.
- FIG. 1A illustrates a 2D photon echo pulse sequence.
- Pulse 1 creates a single-quantum coherence between ground and excited states of the system which evolves for a coherence time ⁇ .
- Pulse 2 stores the phase acquired during the coherence time as a zero-quantum coherence (i.e., population) for a waiting time, T.
- Pulse 3 then returns the system to a single-quantum coherence where, for inhomogeneously broadened systems, a photon echo forms after a rephasing time t ⁇ .
- the photon echo interferes with a weak local oscillator (LO) pulse at the spectrometer to retrieve phase and amplitude information during detection.
- LO weak local oscillator
- FIG. 1B illustrates a glass wedge delay.
- Two anti-parallel glass wedges are used to create sub-wavelength accuracy delays between pulses 1 and 2. Movement of one wedge along a wedge angle, ⁇ , by a distance d creates a delay of approximately ⁇ d/c for small angles without changing the direction of the propagating beam.
- FIG. 2 illustrates a spatially encoded 2D pulse sequence.
- Tilted wavefronts serve to define the pulse sequence along the y-axis of the sample.
- the wavefronts of beams 2 and 3 are parallel, which act to define a constant population time, T, across the sample.
- Wavefronts of beams 1 and 4 i.e. LO
- ⁇ (y) Each position along the y-axis of the sample uniquely maps to a single delay of the coherence time, ⁇ , which in aggregate defines the entire 2D photon echo pulse sequence.
- the CCD camera then acts to bin a range of coherence times ( ⁇ ⁇ 0.5 fs) for each pixel.
- FIG. 3A illustrates a box-car geometry in accordance with a conventional point-by-point optical spectroscopy technique.
- This phase-matched geometry provides passive phase stability for point-by-point acquisition methods.
- FIG. 3B illustrates a distorted box-car geometry in accordance with the present techniques.
- This phase-matched geometry provides passive phase stability for single-shot acquisition.
- the beams are focused in a direction parallel to the y-axis.
- This scheme allows beams 2 and 3 to maintain parallel wavefronts at the sample, while introducing a temporal gradient, dt 1,2(3) /dy between beams 1 and 2 ( 3 ).
- Beam 4 i.e., LO
- Beam 4 coincides with the rephasing signal and has an opposite temporal gradient, dt 4,2(3) /dy ⁇ dt 1,2(3) /dy, with respect to beam 2 ( 3 ).
- FIG. 4 illustrates an optical setup of a single-shot spectroscopy technique in accordance with the present examples.
- Two beams resulting from passing a 40 fs, 50 nJ pulse through a wedged beam splitter (BS) are delayed by a time, T, with respect to one another by a motorized translation stage (T).
- These time-delayed beams pass through another wedged beam splitter (WS—inset i.) to form the four beams, k 1 -k 4 , used in the GRAPE pulse sequence.
- These beams then reflect off the GRAPE mirror assembly (GM—inset ii.) toward a cylindrical lens (L) which focuses the beams along the x-axis of the sample (S—inset iii).
- the emitted non-linear signal is imaged onto the entrance slit of the spectrometer (SPEC) by two spherical mirrors SM1 and SM2) that form a 2 ⁇ telescope.
- the signal and local oscillator are isolated from the pump beams using a spatial filter (SF—inset iv.) before detection by a thermoelectrically cooled CCD camera.
- FIG. 5 illustrates example pulse timings resulting from the configuration of FIG. 4 .
- Spatially encoded pulse timings are determined by analyzing the interferogram resulting from scatter between beams 1 and 3 with beam 4 at the position of the sample. Scatter points with high fringe contrast are selected for analysis by spectral interferometry to give t 34 (y) (squares, the curve of which intersects the t-axis at ⁇ 1.6 ps) and t 14 (y) (circles, the curve of which intersects the t-axis at ⁇ 1.3 ps).
- FIG. 6A illustrates a scatter-subtracted raw signal.
- the vertical pixel axis is converted to ⁇ values according to measurements taken by spectral interferometry (see FIG. 5 ).
- FIG. 6B illustrates a projection of the raw signal along ⁇ .
- An interferogram is formed by interference of the signal with the local oscillator. Oscillation frequency is given by the timing between pulse 4 and the signal.
- the inset shows an enlarged area of the heterodyned signal showing high fringe contrast and high signal-to-noise.
- FIG. 6C illustrates a photon echo signal.
- Fourier transformation of the Fourier interpolated signal in FIG. 6A about ⁇ t results in a ⁇ t plot containing the homodyne and photon echo signals. After windowing to remove the homodyne signal, an echo appears at roughly 1.8 ps after pulse 4.
- FIG. 6D illustrates rotating frame detection.
- Fourier transformation of a cut through the photon echo signal (dashed line in FIG. 6C ) about ⁇ confirms that the signal in GRAPE is measured in the rotating frame.
- the linewidth of the signal is given by a convolution of the linear absorption spectrum and the laser spectrum.
- Beams 2 and 3 are used as the pump and probe pulses, respectively. Since the wavefronts of beams 2 and 3 are parallel at the focus of the cylindrical lens, the entire illuminated region of the sample contributes to the spectrally resolved pump probe signal.
- FIG. 7B illustrates phasing of 2D spectra.
- the projection of the real part of the 2D spectra (solid curve) is ‘phased’ to match the projection of the pump-probe image in FIG. 7A along the vertical axis of the detector (circles).
- FIG. 8A illustrates the Experimental Rephasing 2D spectra.
- Real part of rephasing 2D spectra of 0.4 mM IR-144 in methanol at T 0, 40, and 80 fs.
- Negative amplitude is represented by dotted contours.
- the vertical dimension is given by ⁇ ⁇ ⁇ 0 because the coherence frequency is detected in the rotating frame. Deviation of the central peak from the diagonal (dotted line) results from a dynamic Stokes shifted emission.
- FIG. 9 illustrates an analogy between GRAPE and a conventional single scan nuclear magnetic resonance (NMR) technique.
- a heterogeneous excitation of the sample is achieved via the use of a tilted wavefront with GRAPE (top) and a magnetic field gradient with chirped pulse excitation in single scan NMR (bottom).
- the signal in GRAPE is spectrally resolved onto a two dimensional CCD via the use of a grating and interfered with a reference to yield the magnitude and phase of the resulting signal.
- an echo planar chemical-shift imaging protocol is used to encode the chemical information into the free induction decay which is monitored by the use of a coil around the sample.
- FIG. 10 illustrates a schematic diagram of the GRAPE mirror assembly, in accordance with an example.
- the inset shows the pulse sequence used in two-dimensional photon echo spectroscopy.
- Two phase-matched pairs of pulses reflect from a wedged beamsplitter (see FIG. 13 ) to form beams 1-4.
- Tilted wavefronts created by reflections of a three-mirror assembly, are used to spatially encode the ⁇ delay between pulses 1 and 2 while keeping pulses 2 and 3 at a constant delay time, T, across the sample.
- Beams 2 and 3 reflect off a single horizontal mirror and focus to parallel lines at the sample cell (cylindrical focusing lens not shown).
- Beam 1 is tilted at an angle, ⁇ , relative to beams 2 and 3, while the local oscillator (LO), beam 4, is titled at an equal, but opposite angle to beam 1 to form the phase-matched geometry yielding signal in the rotating frame.
- the signal emanates in the direction of the LO for each point along the unfocused beam waist (y-direction) before being spectrally dispersed by a diffraction grating.
- the resultant 2D image is recorded by a CCD camera.
- the slopes of t 24 and t 34 are kept identical to ensure a constant population time across the beam waist.
- a schematic of the corresponding pulse ordering along the beam waist is shown to the right.
- the pixel axis is mapped with the ⁇ (y) axis according to the interference patterns recorded in A.
- FIG. 13 illustrates an example optical setup of the GRAPE apparatus.
- the top left inset shows the generation of four pulses from the front and back Fresnel reflection of a wedged substrate, where ⁇ is 0.5 degrees and ⁇ is 1 degree.
- the right-most inset shows the beam geometry at the spatial filter.
- FIG. 14 illustrates the extraction of information from a linear (one-dimensional) absorption measurement, a two-dimensional Ultrafast Spectroscopy measurement, and a nonlinear coherent multidimensional spectroscopy measurement.
- FIG. 15B shows a double-sided Feynman diagram for a two state system for the experimental pulse sequence, where the intermediate populations have been ignored.
- FIG. 15C illustrates phase matching geometry and
- FIG. 15D illustrates absorbance spectra of the model system IR144 in methanol along with the model calculation of the absorbance spectra overlaid.
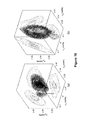
- FIG. 16A and FIG. 16B illustrate experimental and simulated isosurfaces of the absolute value of the data, respectively.
- a vibronic cross-peak is resolved at (0.07,2.32,2.35) (rad/fs).
- Isosurfaces are shown at 10%, 15%, 20%, 40%, and 60% of the maximum of the absolute value of the signal.
- the model figure has an additional isosurface at 7%. Contour lines are drawn at 8%, 13% and then in 10% increments of the maximum value of each projection.
- the ⁇ 1 axis is detected in the rotating frame. 14
- FIG. 17 illustrates the integrated signal strength versus. Agreement between the measured signal and theory indicates that cascades do not contribute significantly to the signal.
- the two parameter model takes into account the re-absorption of the signal as it propagates through the sample cell.
- FIG. 18 illustrates a schematic of the GRAPE apparatus in accordance with an example.
- Four pulses are reflected off three mirrors and focused using a 250 mm cylindrical lens (not shown) onto a 200 ⁇ m thick sample cell.
- the spatially encoded 2D photon echo pulse sequence is shown in the upper-right.
- the tilt of the wavefronts of each pulse defines the temporal gradient along the beam waist.
- LH2 light harvesting complex 2
- FIG. 20 illustrates an LH2 linear absorption spectrum at room temperature.
- B800 and B850 bands from the light harvesting complex of the photosynthetic bacterium Rhodobacter sphaeroides at room temperature are shown.
- the continuum-generated pulse spectrum is shown in the top curve. Dashed lines correspond to limits of detections for the grating and CCD combination used in these experiments.
- FIG. 21 illustrates a 2D Power Spectra of LH2 at select waiting times.
- the acquisition time for each spectrum is 200 ms and is displayed normalized to its highest peak value for ease of visualization.
- the contour lines are displayed in increments of 0.5% from 7.5% to 9.5% and in increments of 5% from 10% to 100% of the signal maximum for each waiting time.
- Only the absolute value of the 2D spectra is shown even though the complex third-order nonlinear signal is measured owing to ambiguity in the global phase term. This term does not affect the analysis because it is uniform across the 2D spectrum.
- the large tail of the 800 nm diagonal peak towards the blue edge of the spectrum arises from excited-state absorption.
- the deviation of the peak maximum near the diagonal of the spectrum is a result of an ultrafast Stokes shift due to solvent reorganization.
- the bottom of FIG. 22B illustrates the region inside the dashed box of FIG. 23A fit to an exponentially decaying sinusoidal function.
- the single frequency value of the fit is displayed as a zero-quantum coherence (ZQC) beating map.
- ZQC zero-quantum coherence
- FIG. 23A illustrates some of the primary factors controlling energy transfer optimization in LH2.
- Dephasing and beating maps in the upper left cross-peak of the 2D spectrum are shown. Maps are derived from fitting each pixel in the 2D spectrum to the functional form described in the text.
- the dephasing map is a measure of the extent of system-bath interactions during the waiting period.
- the amplitude map is proportional to the strength of electronic coupling between excitons on each of the two subunits of LH2. Cuts through the dephasing time (top, dashed lines) and amplitude (center, dashed lines) maps showing strong anti-correlation.
- FIG. 23B illustrates that the phase map modulates the quantum mechanical interference between different energy transfer pathways. A cut through a fixed value of the rephasing frequency at 794 nm is shown on the right.
- FIG. 24 illustrates a model of quantum phase interferometry. Shown is a three-site closed loop configuration employing the phases of mutual coupling terms that optimize energy transfer to the trap state—the photosynthetic reaction center (RC) or LH1/RC complex.
- the two states in the B850 ring are presumably coupled by a superexchange mechanism (dashed line), while each state independently couples through dipole coupling to the B800 state.
- the strength of the coupling is represented by the thickness of the line connecting the states.
- the arrows indicate the extent of system-bath interactions, which lead to coupling between states.
- the experimentally determined phase terms are indicated to within 0.1 radians of the values measured.
- FIG. 25 illustrates the decay of B800 (lower concave up curve) and B850 (upper concave up) bands with waiting time. Fit of B800 to B850 energy transfer (concave down curve). Inset: effects of laser spectral and intensity fluctuations on the 2D spectrum during the waiting time.
- FIG. 26 illustrates Feynman diagrams contributing to quantum beats in the cross-peak of the 2D spectrum.
- Above pathways correspond to electronic coherence between two coupled exciton states,
- ⁇ 1 and ⁇ 2 (dashed lines) correspond to the energies in the site representation, prior to electronic coupling.
- the pathways in the bottom part of the figure correspond to pathways from a single chromophore with vibrational states in the ground and first excited electronic states. If the displacement of the excited state potential is zero, these pathways do not contribute to an observable signal.
- FIG. 27 illustrates a beating frequency map and associated error map corresponding to 90% confidence interval calculated for each point in the AD cross-peak of the 2D spectrum.
- FIG. 28A illustrates representative two-dimensional spectra of FMO from Chlorobium tepidum taken at 77 K and a waiting time of 1870 fs (upper) and of LH2 from Rhodobacter sphaeroides taken at 294 K and a waiting time of 390 fs (lower).
- FMO the beating signal in a 100 cm ⁇ 1 ⁇ 100 cm ⁇ 1 region highlighted around the exciton 1-2 cross peak is analyzed to determine the 1-2 beat frequency throughout the cross peak region.
- For LH2 the beating signal in a 450 cm ⁇ 1 ⁇ 430 cm ⁇ 1 region highlighted near the upper B800-B850 cross peak was analyzed to determine the beat frequency throughout the cross peak.
- FIG. 28B illustrates the exciton 1-2 beat frequency (upper) throughout the cross peak with contour lines drawn for every 2 cm ⁇ 1 interval, and the grayscale colorbar axis indicates the range expected for a purely inhomogeneous dephasing process.
- the B800-B850 beat frequency is shown throughout the cross peak (lower), contour lines are drawn for every 15 cm ⁇ 1 interval, and the grayscale colorbar axis indicates the range expected for a purely inhomogeneous dephasing process.
- FIG. 28C illustrates beating signals extracted from two representative points within the region and show little changes in the beat frequency for FMO (upper) and a change in frequency for LH2 (lower).
- FIG. 29A illustrates Crystal structure of FMO (upper) and LH2 (Lower) to scale.
- FIG. 29B illustrates for FMO, different members of the ensemble differ in exciton energy levels, but the relative gap remains constant, while for LH2 the energy gap does not remain constant. Also shown is the linear absorbance spectrum where the coherence between the highlighted regions is investigated.
- FIG. 29C illustrates that the correlation of the energy gap across the ensemble leads to homogeneous broadening for FMO and inhomogeneous broadening for LH2.
- FIG. 30 illustrates homogeneous and inhomogeneous broadening.
- FIG. 31A illustrates a source of inhomogeneous broadening in the absorption spectrum of PbS quantum dots, particularly a linear absorption spectrum of PbS near the band gap at the 1S e -1S h transition (solid curve).
- the dashed curve is the calculated band gap for a distribution of quantum dot sizes as determined by TEM as shown in FIG. 31B , and reveals the dominant source of inhomogeneous broadening in ensemble measurements of the sample of PbS quantum dots.
- FIG. 31C illustrates a representative transient absorption spectrum upon 775 nm excitation at early population times (T ⁇ 300 fs).
- FIG. 32A illustrates ultrabroadband GRAPE spectroscopy, specifically a single-shot transient grating profile of a continuum source generated by focusing the output of a Ti:Sapphire amplifier into Argon gas showing the spectral as well as temporal characteristics of the pulse.
- FIG. 32B illustrates a principle of GRAPE spectroscopy showing the emitted signal and local oscillator dispersed off a grating and imaged by a two-dimensional CCD detector.
- FIG. 32C illustrates that a spatially encoded 2D photon echo pulse sequence can sample all relevant coherence times along the unfocused axis of the beam waist. The relative angle between k 1 and k 2 determines the strength of the temporal gradient.
- FIG. 33 illustrates ultrafast dynamics of PbS quantum dots at low excitation power.
- the dotted line shows the diagonal of the 2D spectrum in which absorption and stimulated emission/excited state absorption are identical.
- the coherence frequency, E ⁇ recorded in the rotating frame, includes the contribution from the carrier frequency in the plot.
- Ultrafast optical spectroscopy can elucidate sub-picosecond molecular dynamics, providing insight into vibrational and electronic structure and solute-solvent interactions in the IR and visible regions of the spectrum.
- Two-dimensional electronic spectroscopy directly probes correlations between electronic states providing detailed maps of energy transfer and coupling.
- two-dimensional spectroscopy provides no means by which to connect the initial dynamics in the first few hundred femtoseconds of electronic motion with slower dynamics associated with large structural changes.
- Two-dimensional electronic spectroscopy maps the electronic structure of complex systems on a femtosecond timescale. While analogous to multidimensional NMR spectroscopy, 2D optical spectroscopy differs significantly in its implementation. 2D Fourier spectroscopies require point-by-point sampling of the time delay between two pulses responsible for creating quantum coherence among states. Unlike NMR, achieving the requisite phase stability at optical frequencies between these pulse pairs remains experimentally challenging. Nonetheless, 2D optical spectroscopy has been successfully demonstrated by combining passive and active phase stabilization along with precise control of optical delays and long-term temperature stability, although the widespread adoption of 2D ES has been significantly hampered by these technical challenges.
- Ultrafast nonlinear spectroscopy can monitor vibrational and electronic dynamics in complex systems on a femtosecond timescale. As the complexity of the system increases, one-dimensional techniques no longer provide unambiguous assignment of energy eigenstates and their associated relaxation dynamics because couplings can only be measured indirectly.
- the extension of these methods to two-dimensions with 2D photon echo spectroscopy provides a direct probe of molecular structure, electronic coupling, energy transfer, and solute-solvent dynamics in the IR and visible regions of the electromagnetic spectrum.
- the potential of multidimensional spectroscopy in the optical regime was first recognized by Ernst during the development of two-dimensional NMR.
- multidimensional spectroscopy necessarily involves parametric sampling of one or more time delays.
- controlling propagating beams of light requires adjustments of optical path lengths to sub-wavelength accuracy.
- small errors in path length due to fluctuations in mirror positions and delay stages, index of refraction changes from eddies in the air, and temperature fluctuations in the environment all lead to phase errors which manifest themselves in the two-dimensional spectrum as increased noise and broadened linewidths.
- GRAPE spectroscopy techniques described herein can eliminate the need for phase stabilization by acquiring the entire two-dimensional spectrum in a single laser shot with higher signal-to-noise than is achievable with point-by-point acquisition protocols currently in use.
- the present techniques map the multidimensional spectroscopic problem onto an imaging one by trading a temporal scan for a spatial dimension. This mapping permits the acquisition of the entire two-dimensional (2D) optical spectrum using a single laser shot. Unlike other single-shot 2D methods (DeCamp, M. F., DeFlores, L. P., Jones, K. C., & Tokmakoff, A. (2007) Single-shot two-dimensional infrared spectroscopy. Optics Express 15, 233-241 and U.S. patent application Ser. No.
- the present GRAPE spectroscopy techniques are able to circumvent these limitations by harnessing the full power of two-dimensional photon echo spectroscopy with no temporal smearing and no loss in signal. Further, the method can be easily implemented on existing spectrometers without linear delay stages, diffractive optics, pulse shapers, or phase stabilization.
- NMR nuclear magnetic resonance
- optical spectroscopy The most notable difference between nuclear magnetic resonance (NMR) and optical spectroscopy is the relative size of the sample to the illuminating wavelength.
- the sample size In the visible region of the spectrum the sample size is typically 100 ⁇ instead of ⁇ /100 as in NMR. For non-linear propagation, this results in a background-free signal that emerges in a unique phase-matched direction.
- the signal In NMR, the signal is emitted isotropically, and the detectors encompassing must use phase cycling to isolate the desired coherence pathway to resolve the image.
- the sample region illuminated by focused beams typically represents less than one part in 10 4 of the total sample area. Defocusing the light increases the number of molecules contributing to the signal, but creates temporal broadening of the integrated signal due to the crossing angles of the beams. Previously, this effect had been regarded as an unwanted artifact and was avoided by creating a tight focus at the sample in which the temporal gradient was smaller than the duration of the pulse.
- MRI which can be viewed as a multidimensional correlation technique that correlates spins in space across orthogonal spatial dimensions
- multidimensional NMR spectroscopy which correlates frequencies over several spectral dimensions, differ significantly in their sampling schemes.
- MRI which can be viewed as a multidimensional correlation technique that correlates spins in space across orthogonal spatial dimensions
- NMR spectroscopy which correlates frequencies over several spectral dimensions, differ significantly in their sampling schemes.
- multidimensional NMR spectroscopy requires a slow, multi-scan acquisition scheme in which the indirect temporal dimension is systematically scanned prior to Fourier transformation, regardless of the available sensitivity.
- a radio frequency sweep is applied to the sample in the presence of a pulsed gradient to uniformly excite each position in the sample at a different moment in time.
- spins along the gradient axis undergo a phase evolution directly proportional to their position along the gradient.
- a suitable unwrapping of this spatial encoding results in an n-dimensional NMR spectrum.
- the two-dimensional photon echo electronic spectroscopic techniques described herein are degenerate four-wave mixing spectroscopic techniques that reveal the correlation between the absorption and emission frequencies of a material system.
- the 2D spectra generated by measuring the third-order nonlinear polarization in a unique phase matched direction, links the dipole oscillation frequency during an initial period, ⁇ , with that of a final period, t, for each ‘waiting time,’ T. Peaks appearing on the diagonal provide a measure of the ‘memory’ of the system in which an oscillating dipole at a given frequency is correlated to the same oscillator a time, T, later. Cross-peaks provide information on electronic coupling between dipoles.
- a femtosecond laser pulse may be split into four identical beams by using beam splitters or diffractive optics in the non-collinear geometry or by an acousto-optic modulator (AOM) in the collinear configuration.
- AOM acousto-optic modulator
- all four beams are focused onto a ⁇ 100 ⁇ m diameter spot in the sample and the heterodyned signal is spectrally resolved using a spectrometer and CCD camera.
- the pulse sequence is shown in FIG. 1A .
- the first pulse, k 1 generates a one-quantum coherence in the sample that evolves for a specific amount of time, ⁇ , before application of the second pulse, k 2 , that stores the phase as a zero-quantum coherence, commonly referred to as a population.
- the third pulse, k 3 After a “waiting time,” T, the third pulse, k 3 , returns the system to a single-quantum coherence where an echo forms a time, t echo , later.
- Frequency-resolved detection occurs by heterodyning the emitted signal with the local oscillator pulse, k 4 .
- the third-order nonlinear polarization is then measured as a function of the two delay times, ⁇ and T, for each emitted frequency.
- the 2D spectrum generated for each waiting time by a double Fourier transform about the coherence times correlates the dipole oscillation during the initial period, ⁇ , with that during the final period, t. Peaks on the diagonal therefore provide a measure of the “memory” of the system in which oscillating dipoles at a given frequency are correlated to one another at the same frequency at a later time, T. Cross-peaks provide information on electronic couplings between dipoles. Changes in the 2D spectrum as a function of the waiting time reveal the dynamics of energy transfer among chromophores as well as interactions of chromophores with the bath. In the case of photon echo spectroscopy, inhomogeneous broadening along the direct t-domain is reduced to the homogeneous limit, making it particularly useful for systems with unresolvable linear spectra.
- this gradient causes a delay across the unfocused beam diameter of a few hundred femtoseconds, which establishes the range of the ⁇ values to be sampled.
- all the pulses in the photon echo pulse sequence can be angled such that each position along the y-axis corresponds directly to a different indirect time-domain sequence, which in aggregate captures the whole 2D experiment.
- Measuring the spatially resolved signal requires the use of an imaging spectrograph that spectrally resolves this distribution of points by projecting it onto a two-dimensional CCD camera.
- the various experimental apparatuses can differ in the way the pulse delays are generated.
- the ⁇ delay would be created by accurate positioning of pairs of identical glass wedges in an anti-parallel orientation mounted on linear translation stages, where each set of wedges essentially acts like a glass plate of varying thickness ( FIG. 1B ).
- Delays can also be generated by use of pulse shaping technology such as spatial light modulation (SLM) or acousto-optic modulation (AOM).
- SLM spatial light modulation
- AOM acousto-optic modulation
- ⁇ may be systematically scanned for each population time to sample the optical frequency of the signal or, for rotating frame detection, to sample the largest difference frequency of the oscillating dipoles in the sample.
- phase stability is an important consideration for their successful implementation, particularly in the visible region of the spectrum. As shown, by resolving the beams to (overlapping) lineshapes instead of point focuses, the present techniques are able to limit and even avoid the phase stability problems inherent in other optical spectroscopy techniques.
- the wavefront of a beam of light is perpendicular to its direction of propagation.
- the wavefront is approximately flat.
- ⁇ is given by (tan ⁇ )/c.
- the maximum time delay across a five-millimeter beam waist for a crossing angle of 1° is 291 fs, within the range of single-quantum coherence times for many systems exhibiting electronic transitions in the visible region of the spectrum such as the laser dye examined in an example, here. If the time delay between pulses 2 and 3 remains constant, then each spatial location across the sample uniquely maps to a different four-wave mixing experiment, equivalent to parametric sampling of the ⁇ delay for a fixed population time, T, as shown in FIG. 2 . After passage through a spectrometer, the resultant two-dimensional image forms an instantaneous snapshot of a two-dimensional photon echo spectrum for a fixed population time.
- Diffractive optics are not necessary for GRAPE and diffractive beam-splitters as currently used by many practioners of two-dimensional optical spectroscopy may be problematic in a single-shot design because of angular dispersion.
- the point of focus from which the four beams originate is imaged onto the sample so that angular dispersion does not present a problem. That is, all colors, even though they are diffracted in different directions by the grating, are then refocused onto the sample and hence arrive at the same moment in time.
- the conventional boxcar geometry ( FIG. 3A ) used for phase matching in two-dimensional spectroscopy in which all four pulses are focused to an isotropic beam waist creates a temporal gradient between all pairs of pulses.
- This effect present in all non-collinear multi-wave mixing experiments causes a slight temporal smearing of the pulses due to the crossing angle and finite beam waist. For small fixed crossing angles, less than a few degrees, this smearing is roughly proportional to the beam waist.
- the beam waist is kept small ( ⁇ 100 ⁇ m) to minimize this smearing to less than a few femtoseconds.
- this smearing would be on the order of a few hundred femtoseconds, precluding the accurate acquisition of 2D spectra.
- the present techniques consider the phase-matched geometry shown in FIG. 3B . Instead of focusing to a point, the beams now focus to a line perpendicular to the direction of propagation and the line connecting beams 2 and 3. At each position along the vertical axis of the focal plane, a small temporal smearing of the pulses exists due to the finite horizontal beam waist ( ⁇ 100 um); however, the wavefronts of beams 2 and 3 are exactly parallel in the unfocused direction, resulting in the spatially encoded pulse sequence shown in FIG. 2 .
- the signal, emitted from the sample in the direction k s ⁇ k 1 +k 2 +k 3 , is now in the form of a line, rather than a point, from the sample. Imaging this line onto a spectrometer input slit results in a two-dimensional map with the ⁇ delay along the vertical direction (y) and wavelength along the horizontal direction (x).
- the image shares similarities with a trace formed by transient grating frequency resolved optical gating (TG FROG) used for pulse characterization. Unlike TG FROG, however, the signal is phase resolved by interference with a reference pulse. Fourier transformation of this two-dimensional signal along the ⁇ direction yields the two-dimensional spectrum of the material system.
- TG FROG transient grating frequency resolved optical gating
- FIG. 4 A schematic of an example optical layout in accordance with the present techniques is shown in FIG. 4 .
- a Ti:sapphire oscillator (Micra, COHERENT Inc.) is used to seed a regenerative amplifier (Legend Elite USP-HE, COHERENT Inc.) to generate 40 fs pulses centered at 807 nm at a 5 kHz repetition rate.
- the pulse length is measured using single-shot second harmonic frequency-resolved optical gating (Grenouille, Swamp Optics) prior to the sample.
- a small fraction of the amplifier output pulse (20 ⁇ J) passes through a beam splitter, creating two beams, each with a 1/e diameter of roughly 6 mm.
- the relative delay between the beams is controlled by a motorized translation stage (Aerotech Inc.), which defines the population time, T.
- the beams are then further split into two pulse pairs creating four pulses, labeled here as k 1 -k 4 , by the use of front and back Fresnel reflections from a 3 mm thick uncoated 0.5 degree wedged optic ( FIG. 4 , wedge beam splitter expanded in panel i).
- the input angles to the wedged optic are adjusted such that the back reflection of the 1,2 pair is parallel to the front reflection of the 3,4 pair. Assuming small angles, this results in identical relative angles between beams 1 and 2 and between beams 3 and 4, which are formed by the remaining front and back reflections.
- the wedged optic provides a convenient means of dumping excess pulse energy and reduces the number of optical components by eliminating additional pairs of beam splitters and mirrors necessary to steer the beams back towards the sample.
- the incident angles of the two input beams to the wedged optic are adjusted such that the reflection from the rear surface of one wedge (k 2 ) is parallel to the reflection from the front surface of the other (k 3 ).
- the remaining reflections comprise beams k 1 and k 4 , respectively.
- the four beams are aligned to form the distorted boxcar geometry shown in FIG. 3B .
- the four beams are reflected off a mirror assembly, which we refer to as the GRAPE mirror as shown in FIG. 4 (see panel ii).
- the mirrors in the GRAPE assembly are oriented such that the vertical position of the four beams overlaps at the sample to generate the required tilted wavefronts that spatially encode the temporal delays across the sample and permit acquisition of the echo signal in the rotating frame.
- Beams 2 and 3 reflect off a single mirror while pulses 1 and 4 reflect off separate mirrors, each mounted on a delay stage which acts to compensate for temporal delays caused by the finite thickness of the wedged beamsplitter.
- All four beams then pass through a cylindrical lens with 250 mm focal length, which focuses the beams in the horizontal dimension onto a 40 ⁇ m wide, 6 mm tall focal line at the sample ( FIG. 4 , panel iii).
- beams 1 and 4 are directed towards the sample where they overlap with beams 2 and 3.
- the vertical angle, ⁇ , at which beam 1 crosses beam 2 serves to define the temporal gradient. This gradient can be adjusted by changing the distance of the cylinder lens and sample from the GRAPE mirror or, alternatively, by adjusting the distance from the wedged optic to the GRAPE mirror while maintaining the distance between the GRAPE mirror and the sample.
- the vertical angle at which beam k 4 is directed towards the sample is roughly negative in sign to the vertical angle in which k 1 is directed towards the sample. These two angles serve to define the timing of the signal relative to the echo and hence the slope of the echo signals relative to the ⁇ axis.
- beam 4 is attenuated by utilizing the front Fresnel reflection from an optical flat and neutral density placed after the mirror assembly, resulting in a total attenuation of roughly three orders of magnitude.
- the energy of pulse k 1 -k 3 was roughly 50 nJ per pulse, which resulted in an energy flux of 20 ⁇ J/cm 2 comparable to point-by-point methods or to other multi-scan setups that focus to a spot.
- a spatial filter was placed at the focus of SM1 after the sample (roughly 25 cm after the first spherical mirror), which isolated only the photon echo signal and LO.
- all four beams separated in the horizontal direction which allowed beams k 1 -k 3 to be blocked for background-free detection ( FIG. 4 iv).
- the heterodyned signal was spectrally resolved using a 1200 lines/mm diffraction grating and a 2048 ⁇ 2048 thermoelectrically cooled CCD array (Andor).
- the resulting interference pattern enabled determination of the phase and magnitude of the signal.
- the spatially encoded pulse timings for the GRAPE technique were determined by spectral interferometry.
- a scattering element was placed at the sample position, and the timings of beams 1, 2, and 3 were separately measured with respect to beam 4.
- the timing of beam 1 with respect to beam 2 was set to create a temporal gradient from approximately ⁇ 200 fs to 400 fs across the beam waist, corresponding to approximately 0.6 fs/pixel at the detector.
- Beam 4 was attenuated to avoid unwanted pump-probe signals and delayed by ⁇ (y) such that the center of the wavefront arrives approximately 1.3 ps before beam 3.
- the relative timing between pulse pairs was derived by measuring the scatter of beams 1 and 3 at the position of the sample in the direction of beam 4.
- beam 2 was aligned such that it is parallel to beam 3 to within better than 2 ⁇ 10 ⁇ 4 radians; this measurement provided a more accurate upper bound of t 23 (y) than possible with spectral interferometry in the presence of noise. Since the interference between the scattered light and beam 4 at the sample position was imaged onto the spectrometer slit and then spectrally resolved by a diffraction grating prior to detection by the CCD, it was possible to simultaneously measure several scattering events along the spatially encoded axis.
- ⁇ / ⁇ N 0.57 ⁇ 0.05 fs/Pixel and ⁇ T/ ⁇ N ⁇ 0.01 fs/Pixel, where N is pixels.
- This value of ⁇ / ⁇ N allowed frequencies as high as 11.0 rad/fs (170 nm) to be detected, well above the optical frequencies of visible light.
- a low value of a ⁇ T/ ⁇ N ensures that the population time across the sample remains constant. In the experiments here, the population time was constant to less than 4 fs across the sample, sufficient to resolve population dynamics of IR 144 in methanol.
- the crossing point can be positioned anywhere across the unfocused beam waist.
- the crossing point was chosen such that the majority of the signal resulted from positive values (beam 1 before beam 2), which corresponded to rephasing signal pathways.
- the range of ⁇ values selected to lie within the full-width half max (FWHM) of the beam waist along the spatially encoded direction was approximately ⁇ 50 fs ⁇ 230 fs.
- Negative values ensure that pulse overlap is taken into account.
- an additional mirror may be used to collect the non-rephasing signal for further analysis.
- the raw signal in the phase matched direction k s ⁇ k 1 +k 2 +k 3 was heterodyned with a reference beam, k 4 and imaged onto a CCD detector.
- the raw signal recorded by the CCD camera of IR 144 at ambient temperature is shown in FIG. 11B .
- a sequence of shuttered images to record the scatter of beams 1, 2, and 3 in the direction of the signal.
- a data analysis using a modified procedure of that used for multi-scan two-dimensional spectroscopy as described in detail by Brixner et al. Brixner, T., et al. 2004. Phase-stabilized two-dimensional electronic spectroscopy. J. Chem. Phys. 121:4221-4236), may be used.
- the scatter-subtracted heterodyne-detected signal is Fourier transformed in the wavelength dimension to create a time vs. ⁇ ⁇ 1 data set containing the homodyne and photon echo.
- the scattering data is used to convert pixels in the y direction into ⁇ values, and a Fourier interpolation algorithm is used to convert the wavelength dimension to evenly spaced time points.
- a windowing function is then applied to isolate the photon echo signal.
- a cut through the echo shows oscillations corresponding to phase evolution of the signal during the coherence time ⁇ as expected. Due to the rotating frame detection scheme, only the difference frequencies in the oscillations are detected, rather than the optical frequency itself.
- a two-dimensional Fourier transform is applied to the entire ⁇ t data set, resulting in a 2D spectrum for each population time. The absolute phase of the spectra was then determined by fitting to a separately recorded pump-probe signal.
- the relative phase of pulses comprising the 2D pulse sequence is generally unknown.
- Knowledge of the absolute phase of the spectra is necessary to separate dispersive and absorptive components of the lineshape. Since electronic spectra are generally very broad, eliminating dispersive lineshape contributions is necessary for optimizing spectral resolution, even in the present photon echo spectroscopy techniques where the homogeneous linewidth along the anti-diagonal direction is recovered.
- ‘phasing’ procedures are routinely accomplished by multiplying the spectrum by a zero-order and first-order phase term until negative features disappear, indicating purely absorptive lineshapes.
- a projection-slice theorem may be used. This theorem states that the Fourier transform of a slice through the center of a function, f, is equal to the projection of the two-dimensional Fourier transform of f along a line parallel to that slice.
- Pump-probe signals tend to be very weak in the visible region of the spectrum because of the large probe background signal relative to the very small pump-probe effect. Therefore, one could resort to using a lock-in amplifier and monochromator to record weak pump-probe signals at each desired wavelength. However, such long integration times and slow point-by-point acquisitions makes this approach undesirable. Furthermore, it would largely negate the benefits of single-shot spectroscopy for anything but absolute value 2D spectra. Very poor signal-to-noise of a spectrally resolved pump-probe may be circumvented by employing a variation of the GRAPE method. In order to measure the pump-probe signal one can utilize beam 2 as the pump and beam 3 as the probe.
- Phasing the 2D spectrum then proceeds by multiplying the projection of the real part of the 2D spectrum by a phase factor, ⁇ 0 +( ⁇ t ⁇ 0 ) d ⁇ 1 /d ⁇ +( ⁇ t ⁇ 0 ) 2 d 2 ⁇ 1 /d ⁇ 2 (2) to match the pump-probe signal.
- the zero-order term corresponds to an overall phase constant correction, while the linear term corrects for uncertainties in the t 34 (y) timing.
- a small quadratic term is applied to correct for minor dispersive terms owing to pulse chirp and dispersion in the system.
- the real part of the 2D spectra and separately recorded pump probe spectra are in excellent agreement at all population times measured after this phasing procedure.
- the technique was used to measure the two-dimensional spectrum of a solvatochromic dye, IR 144 in methanol, for a range of waiting times. Because of the extensive studies on the ultrafast dynamics of dye molecules, IR 144 provides an important benchmark to compare the present techniques to the multi-scan acquisition schemes that have been employed in 2D optical spectroscopy in the condensed phase.
- the laser dye IR-144 was dissolved in methanol to create a 0.4 mM solution with an optical density of approximately 0.3 at 800 nm in a 200 ⁇ m flow cell. All measurements were taken at the ambient temperature of 21° C. The raw signal was recorded by the CCD camera of IR 144 at ambient temperature.
- the vertical stripes are a result of interference between the signal and the local oscillator, k 4 , for each position along the unfocused beam diameter.
- a Fourier transformation along the horizontal frequency (or wavelength) axis of the CCD two-dimensional data lead to a ⁇ t plot that contains the spatially encoded photon echo.
- Pump-probe fits show a nearly perfect fit to the projection of the real part of the 2D spectrum in accordance with the projection-slice theorem.
- the wedged optic already provides a beam in the position of the phase-matched geometry corresponding to the non-rephasing signal. Therefore, incorporating an additional pulse is relatively straightforward. Furthermore, since only a small area of the CCD sensor is used for rephasing signal detection, another area of the sensor can be used to record the nonrephasing signal simultaneously. Owing to the reduced phase stability requirements needed with the GRAPE method, addition of a local oscillator does not require the use of common mirrors and can be done with conventional beam splitters and steering optics. An additional mirror may be introduced to collect the nonrephasing signal. This approach provides an additional savings in signal acquisition time.
- the real part of the rephasing spectra is generated as shown in FIG. 7A and FIGS. 8A and 8B .
- This feature can be attributed to four-level contributions that involve vibrationally excited states on the ground electronic surface.
- cross peaks are poorly resolved due to fast relaxation relative to the pulse duration resulting from strong coupling of the vibronic levels to the solvent.
- GRAPE can achieve high SNR even in a single laser shot.
- SNR signal-to-noise
- GRAPE offers several important advantages over multi-scan approaches. Besides the decrease in acquisition time by a factor of about 500, a gain in signal-to-noise of the single-shot 2D spectrum over the multi-scan 2D spectrum exists due to an actual reduction of the overall noise from the sample.
- the indirect dimension is susceptible to what is known in magnetic resonance (MR) as t 1 noise, so named because it primarily affects the indirect dimension (i.e. ⁇ dimension in 2D PE) of 2D spectroscopic experiments.
- MR magnetic resonance
- t 1 noise may be transferred to the emitted signal.
- This noise is especially important to consider in Fourier experiments where phase errors cause distortion of the spectrum, primarily in the form of line broadening and reduced signal-to-noise. These phase errors may arise from non-uniform temporal sampling or fluctuations in laser power, temperature, alignment, index of refraction, or laser spectrum.
- GRAPE is inherently phase stable because of its single-shot nature. All other 2D methods to date must maintain phase stability of the pulses that generate the 2D spectrum to reduce the t 1 noise, either passively or actively, which can significantly increase the complexity of the experimental apparatus.
- the most pressing limitation of these multi-scan methods is the stringent environmental stability needed throughout the duration of the sampling, specifically with regard to temperature, humidity and vibration. GRAPE significantly relaxes the otherwise necessary environmental controls since all the simultaneously sampled points in the sample experience identical environments during any given laser pulse. Additionally, many important biological samples are either not viable for more than a few minutes at room temperature or demonstrate interesting dynamics on these timescales, precluding interrogation with multi-scan acquisition schemes.
- GRAPE has the potential to bring 2D optical spectroscopy into the kind of widespread use currently enjoyed by multidimensional magnetic resonance spectroscopy.
- MRI which partitions the sample using magnetic field gradients
- GRAPE spectroscopy achieves no loss in signal compared to multi-scan approaches.
- the orders of magnitude reduction in acquisition time will permit practical implementation of three-dimensional optical spectroscopy to resolve obscured spectral features as well as real-time monitoring of chemical dynamics with fast imaging detectors.
- the present techniques demonstrate a single-shot method to obtain two-dimensional electronic spectra in real-time.
- the acquisition time has been shortened from several minutes to a fraction of a second, without loss in signal.
- the present techniques are able to achieve a gain in signal-to-noise in the 2D spectrum, e.g., of IR 144, allowing one to observe features previously undetected using point-by-point methods.
- the inherent phase stability of the present techniques in some examples can eliminate the need for passive and active phase stabilization. Combined with a significantly simplified optical setup, the techniques have the potential to bring 2D optical spectroscopy into the kind of widespread use enjoyed by multidimensional NMR.
- the present techniques may be used for spectroscopic analysis of any number of sample materials.
- sample materials include biologic materials and non-biologic materials, including carbon materials, semiconductors, and various crystalline structures.
- the techniques may be used to characterize samples formed of small molecules, such as metabolites, fragments of DNA, protein cofactors, as well as samples formed of large molecules, such as proteins, enzymes, double-stranded DNA, carbon nanotubes, and semiconductors nanocrystals.
- sample materials include quantum dots, synthetic polymers, and solar cells.
- Coherent multidimensional optical spectroscopy resolves spectral features hidden or obscured in lower dimensional spectroscopies to access detailed information about couplings, energy transport, solvation dynamics, and coherent dynamics.
- multidimensional optical spectroscopy extracts electronic or vibrational molecular information by separating the polarization response into multiple spectral dimensions. The most common two-dimensional implementation measures correlations among transition energies. Coupled states can then be resolved using cross-peaks in distinct locations on the correlation diagram.
- Two-dimensional optical spectroscopy is well established in the infrared spectral region. Infrared wavelengths relax the technical requirements for phase stability enabling higher-order (with respect to the electric field) correlation experiments.
- transient 2DIR which performs two-dimensional infrared spectroscopy of a non-equilibrium ensemble created by an actinic pulse, has been used to watch protein folding dynamics and to probe higher order-correlation functions involved in solvation dynamics.
- fifth-order three-dimensional experiments have probed high lying vibrational states to measure the anharmonicity in several model systems.
- Fifth-order three-dimensional spectroscopies offer superior spectral resolution by separating peaks that overlap in lower dimensional signals into a third spectral dimension, resolving individual contributions from overtones and combination bands.
- the information accessed in fifth-order three-dimensional experiments cannot be obtained from lower order measurements.
- phase stability In the visible spectral regime, maintaining the required phase stability among all four pulses presents a challenge for three-dimensional Fourier transform spectroscopies due to the long acquisition time.
- phase stability In two-dimensional spectroscopy, phase stability must be maintained only within the first and second pairs of pulses, thereby relaxing experimental constraints.
- Many strategies have been developed to experimentally maintain phase stability for the duration of these experiments.
- Diffractive optics have been used to create pairs of phase locked pulses in passively phase stabilized systems, and active phase stabilization strategies using piezoelectric-actuated mirrors and a reference beam to compensate for phase errors have been used. More recently, a diffractive optic in conjunction with a pulse shaper was used to generate four coherent beams maintained for the duration of a ten hour experiment.
- FIG. 10 illustrates another example implementation of GRAPE technique.
- GRAPE technique By tilting the pulse fronts of each beam relative to one another we can spatially encode a time delay across a homogeneous sample and spectrally resolve the resulting line of emitted signal onto a two-dimensional CCD array.
- similar approaches using two pulses have been developed for pulse characterization in single-shot autocorrelators and single-shot frequency resolved optical gating.
- the present techniques include approaches incorporating multiple pulse and heterodyne detection for phase resolved measurements in the Fourier domain.
- Other single-shot methods also exist that can provide complementary information on coherence and population dynamics using directional filtering.
- the present techniques differ, in part, because they directly provide a means to acquire a fully phase-resolved two-dimensional electronic spectrum in a single acquisition.
- the GRAPE method enables two-dimensional slices of the signal to be acquired by averaging over a few laser shots.
- the acquisition rate may be limited by the frame rate of the camera rather than by the signal-to-noise of the data.
- a three-dimensional experiment therefore requires only eight minutes of phase stability to acquire an entire data set, instead of roughly sixteen hours using a point by point acquisition scheme.
- the optical spectroscopy presented here is directly analogous to three-dimensional infrared methods but in the electronic regime.
- a six wave mixing experiment is conducted with only four pulses by exploiting multiple interactions with the pump beams.
- the first matter-field interaction promotes the system into a coherent superposition between the ground and excited state, which evolves for a time t 1 .
- the second pulse directly converts the system to the conjugate superposition by interacting twice with the sample, which again evolves for a time t 2 .
- the final pulse converts the system back to a third coherence which radiates the fifth-order polarization in the phase matched direction.
- Heterodyne-detection is used to measure the magnitude and phase of the emitted signal.
- FIG. 16 Shown in FIG. 16 are isosurfaces of the absolute value of the data. Phase resolved data is necessary to enable the Fourier transform along the indirect dimensions even though the absolute value of the fifth order spectrum is presented here.
- This signal falls mainly on the diagonal, which indicates a strong autocorrelation.
- the slight displacement of the maximum from the diagonal results from a dynamic Stokes shift.
- a vibronic cross-peak located below the diagonal at ⁇ 20% of the maximum signal strength is fully resolved.
- This spectral feature which was unresolved in lower dimensional spectra, indicates weak coupling of the electronic transition to high frequency vibrational modes.
- the cross peak arises when the system is in a vibrationally excited state during the first and second coherence times.
- Elongation of the signal along the diagonal indicates inhomogeneous broadening signifying that the absorption and emission events are strongly correlated through all three coherence periods.
- a projection of a three-dimensional spectrum along the ⁇ 2 axis yields a zero population time fifth-order two-dimensional spectrum correlating absorption and emission events.
- the vibrational cross peak is lost when integrating over the new dimension, appearing as a shoulder in the fifth-order two-dimensional spectrum.
- Inertial solvent dynamics are modeled as a Gaussian with a 160 fs time constant and coupling strength of 350 cm ⁇ 1 .
- Diffusive solvent modes are treated as two exponentials with time constants 1400 fs and 11 ps with coupling strengths of 290 cm ⁇ 1 and 280 cm ⁇ 1 respectively.
- Previous resonance Raman studies are used for the intramolecular vibrational modes and coupling. We adjust the coupling strengths of the two highest modes to be 210 cm ⁇ 1 and 195 cm ⁇ 1 .
- the vibronic contribution is altered to account for vibrational dephasing via the introduction of a phenomenological damping constant.
- the fifth-order polarization is then calculated with equation (4), in which we have assumed no population evolution within the pulse.
- FIG. 16 Shown in FIG. 16 are isosurfaces of the absolute value of the model calculations.
- the vibronic cross-peak appearing in the signal is reproduced in the model, but the spectral location differs.
- the cross peak arises when pathways involving three distinct coherence frequencies are observed, corresponding to an electronic state coupled to at least one vibrational states.
- Cross-peaks corresponding to lower vibrational states are most likely present as well, but are not separated sufficiently from the diagonal to be resolved.
- cascades occur when a third-order polarization response acts as a pump for a second third-order polarization response, which is radiated in the same phase matched direction as the desired fifth-order signal. In some instances these pathways can compete effectively with the signal such as in early fifth-order Raman experiments of neat liquids.
- Several strategies have been developed for dealing with lower order cascades. Cascades appear in the same phase matched direction as the desired signal, but the relative magnitude of the process is controlled by the phase matching geometry and optical density of the sample. The cascade pathway requires interactions with two different chromophores; therefore, minimizing the optical density of the sample reduces the contributions from unwanted cascades.
- the concentration dependence also provides a definitive test for the relative contribution of lower order cascades because cascades increase quadratically with sample concentration while the desired fifth-order signal is linearly dependent on the concentration, for a fixed path length.
- Our signal intensity as a function of concentration ( FIG. 17 ) definitively shows that cascades do not contribute significantly to the measured signal. Re-absorption of the nonlinear signal as it propagates through the sample causes the deviation from linearity at high concentrations.
- the plotted theoretical fit to the data includes absorptive effects and provides a good agreement between the measurement and model.
- Multidimensional optical spectroscopy provides a useful method for peering underneath featureless absorbance spectra to extract detailed dynamical and coupling information. This work shows that higher order experiments can further increase spectral resolution by separating peaks that overlap in lower order multidimensional spectra.
- Application of this technique to more complicated multichromophoric systems should reveal couplings between electronic states. For example, in photosynthetic light harvesting complexes, high symmetry leads to many degenerate and near degenerate states. This technique improves resolution and permits detailed interrogation of patterns within the static and dynamics disorder.
- Combining imaging techniques with spectroscopic methods enables a practical implementation of more sophisticated experiments by greatly reducing the acquisition time. Extension of this method by the addition of two more pulses would allow for non-zero population times and extraction of kinetic data. This data permits interrogation of pathway-specific energy transfer mechanisms.
- a seeded Ti:Sapphire regenerative amplifier (Coherent, Legend Elite USP) was used to produce near transform-limited pulses centered at 800 nm (FWHM 30 nm) and of 37 fs duration.
- the energy per pulse was 220 nJ, and the flux onto the sample was 62 uJ/cm 2 .
- the pulse was characterized using FROG to ensure the pulse was free of spatial chirp and pulse front tilt.
- GRAPE spatially images the pulse front of the beam, implying that spatial pulse distortion effects will result in lower quality spectra if not resolved.
- IR144 was obtained from Exciton; and a 0.4 mM solution in methanol was prepared immediately before measurements to avoid sample degradation.
- the flowing sample was pumped through a 200 ⁇ m path length flow cell, resulting in an optical density of 0.3. All measurements were performed at ambient temperature of 21 degrees. Timings between pulses were measured using spectral interferometry. A scattering element was placed at the sample location and was then vertically translated to measure the time delay across the sample. This method proved to provide a more accurate measure of the timings as opposed to a single scattering element to measure the timings simultaneously. All timings were measured with respect to beam 4. We note that any error in measuring the temporal gradient between the first two beams simply results in an error in the scale of the frequency axis that is spatially resolved ( ⁇ 1 ) and errors in the timing between beams 3 and 4 results in a rotation of the spectra along the ⁇ 2 axis.
- the varying spatial intensity across the beam acts as an apodization function, and this effect can be largely removed in post-processing of the data.
- the timing between beam three and the local oscillator is not constant due to geometric phase matching conditions. While this difference could be eliminated by routing the local oscillator around the sample, such an approach would result in a more complicated apparatus and would be detrimental to the phase stability.
- the GRAPE techniques acquire the entire 2D spectrum of a compound 2-3 orders of magnitude faster than by ‘conventional’ point-by-point methods without any sacrifice in signal and lower overall noise.
- the single-shot nature of the GRAPE technique we are able to utilize unstable coherent light sources to serve as both pump and probe pulses. Using supercontinuum generation we extend the spectral bandwidth of our Ti:Sapphire laser system to over 100 nm FWHM from 30 nm FWHM, sufficient to capture the dynamics between the B800 and B850 rings of the LH2 complex.
- the absorption spectrum of LH2 consists of two prominent bands at roughly 800 and 850 nm. These bands are attributed to two rings composed of bacteriochlorophyll molecules sandwiched between the alpha and beta apoproteins of the LH2 nonamer.
- the B800 ring consists of 9 BChls which lie parallel to the membrane plane, while the B850 ring consists of 18 strongly-coupled BChls which lie perpendicular to the membrane plane.
- the LH2 complex serves as a broadband accessory antenna to absorb energy from the sun and transfer excitation to the reaction center (RC) where charge separation occurs. Light absorbed at 800 nm is funneled from the B800 ring to the B850 ring before transfer to the LH1/RC complex.
- FIG. 18 Another example implementation of a GRAPE spectroscopy technique is shown schematically in FIG. 18 .
- a single 6 mm diameter pulse from the output of a Titanium Sapphire laser (40 fs, 5 kHz, 800 nm) is focused into a flowing stream of argon gas with a backing pressure of approximately 5 psi to generate a supercontinuum of coherent light.
- the continuum pulse is compressed to under 25 fs using chirped mirrors.
- the pulse is split into two beams by a beam splitter with a variable delay, T, introduced between the pulses by a standard delay stage. Each of these beams is further split using Fresnel reflections from uncoated glass wedges.
- the four resulting beams impinge on a mirror assembly in a distorted boxcar geometry.
- the energy density at the sample was measured at approximately 200 ⁇ J/cm 2 per pulse to avoid multi-exciton generation.
- the timings between pulses were determined using spectral interferometry as described by Lepetit et al. Using non-resonant transient grating measurements, we found no evidence for spatial chirp.
- the timing of beam 1 with respect to beam 2 was set to create a temporal gradient from approximately ⁇ 200 fs to 400 fs across the beam waist, corresponding to approximately 0.6 fs/pixel at the detector.
- the intensity profiles of all beams are relatively flat near the 0 fs to 150 fs region of the spatially encoded temporal gradient.
- Beam 3 was aligned parallel to beam 2 to keep population time constant for each single-shot experiment.
- beam 4 was aligned to have an opposite gradient relative to the sample compared to beam 1, in accordance with the necessary phase-matched geometry.
- the first pulse, k 1 creates a single-quantum coherence between ground and excited states of the molecule.
- a second pulse, k 2 converts the quantum state of the system into a zero-quantum coherence which reflects population dynamics during a waiting time, T.
- a third pulse, k 3 excites the system back into a single-quantum coherence but with opposite phase relative to the coherence created during the first evolution period.
- This particular phase matching choice in the ⁇ k 1 +k 2 +k 3 direction creates a macroscopic polarization in the sample which is emitted as an echo signal.
- the signal is then interfered with a local oscillator pulse to retrieve the complex phase evolution during the coherence times.
- the interference pattern is then spectrally-resolved and detected by a CCD camera.
- the signal, which is now emitted as a line, is imaged onto the slit of the spectrometer and a two-dimensional map S( ⁇ ,T, ⁇ ) is recorded.
- suitable data analysis which includes removing homodyne components of the signal, Fourier transformation about the coherence time axis results in a two-dimensional photon echo spectrum S( ⁇ ⁇ ,T, ⁇ t ).
- LH2 was isolated from Rhodobacter sphaeroides cultures as described by Frank et al. Sufficiently pure samples suitable for spectroscopic investigation required two sequential runs through a DEAE-Sephacel column and elute between 500-600 mM NaCl. Samples were subsequently concentrated down to 0.2-0.3 OD at 850 nm in a 200 ⁇ m cuvette. A single pulse from the regenerative amplifier was triggered by manually firing the output Pockel cell inside the amplifier cavity. The camera shutter was open for 1 second to allow capture of the signal with only manual triggering.
- the two-dimensional rephasing spectrum of LH2 is shown in FIG. 19 at two waiting times, 100 fs and 800 fs. Qualitatively, these spectra are in good agreement with those obtained under lower power and with 100 milliseconds of averaging at 5 kHz.
- the peaks along the diagonal of the spectrum are representative of the linear absorption spectrum of LH2 convolved with the laser spectrum. A slight shift of the peaks away from the diagonal is representative of a Stokes shift. Note that the coherence frequency was measured in the rotating frame such that uncertainty in the carrier frequency ⁇ 0 led to uncertainty in the position of the diagonal of the 2D spectrum.
- GRAPE is capable of recording the non-rephasing spectrum in parallel by utilizing another area of the CCD detector and a separate local oscillator in the appropriate phase matched direction.
- the first 2D photon echo spectrum simultaneously capturing both the B800 and B850 bands for LH2 was achieved.
- the use of GRAPE spectroscopy allows for the acquisition of the spectrum in only one laser shot, completely eliminating the need for phase stability and opening up the opportunity of excitation by continuum-generated pulses. Such broadband excitation will allow a host of new applications where broad linewidths have precluded the use of multidimensional optical spectroscopy to date.
- GRAPE spectroscopy requires no specialized optical components such as diffractive optics, pulse shapers, and active or passive phase stabilization. We see this simplification as a large step in making multidimensional spectroscopy accessible to a broader scientific community. Future work will focus on using fast frame rate cameras to capture 2D spectra in real time to observe changes of electronic structure during photodegradation on a millisecond timescale.
- the light harvesting antenna complexes transfer energy from sunlight to the photosynthetic reaction center where charge separation drives cellular metabolism.
- pigments transfer excitation energy efficiently in a complex choreography of coherent and incoherent processes mediated by the surrounding protein and solvent environment.
- Efforts to increase the quantum efficiency of synthetic devices stand to benefit greatly from understanding the interplay between pigment, protein, and solvent interactions in natural photosynthetic organisms.
- LH2 the peripheral antenna pigment-protein complex of Rhodobacter sphaeroides , a purple non-sulfur bacteria, is composed of two rings of BChI a pigments known as the B800 and B850 rings according to their respective room-temperature absorption bands in the infrared region of the spectrum ( FIG. 20 ). These pigments are held in place by noncovalent interactions with pairs of low-molecular weight apoproteins.
- the LH2 complex consists of eight or nine of these protein heterodimers ( ⁇ ) arranged in a ring with a remarkable degree of structural symmetry and organization. LH2 increases the effective cross-section for photon absorption from the solar spectrum in the membrane of purple bacteria.
- the energy absorbed by LH2 passes through another light-harvesting complex (LH1) tightly associated with the photosynthetic reaction center, wherein a stable charge separated state forms that ultimately drives the production of ATP.
- FRET Förster resonance energy transfer
- 2D PES two-dimensional photon echo spectroscopy
- the GRAPE spectroscopy technique was also compatible with supercontinuum-generated white light excitation. Instability in the continuum source leads to detrimental phase errors that hinder point-by-point acquisition schemes. This critical advantage of capturing the 2D spectrum in a single-shot results in a sufficient signal-to-noise ratio (SNR) to observe the small amplitude beating in our data.
- SNR signal-to-noise ratio
- the 2D power spectra of LH2 at different waiting times are shown in FIG. 21 .
- the B800 and B850 bands are clearly visible along the diagonal of the spectrum.
- features above and below the diagonal become visible.
- the B800 band diminishes relative to the B850 band concomitant with the appearance of a prominent cross-peak below the diagonal, reflecting downhill energy transfer between the rings.
- Analysis of the signal on the main diagonal and of the cross-peak below the diagonal is consistent with other time-resolved measurements on energy transfer in LH2 at room temperature (see FIG. 25 through FIG. 27 and discussions thereof).
- the cross-peak signal above the diagonal does not result from incoherent energy transfer.
- J is the electronic coupling strength between the two chromophores with energies ⁇ 1 and ⁇ 2 .
- the cross-peak above the diagonal exactly vanishes. While this upper cross-peak could also arise from a vibrational manifold of the first electronically excited state in individual BChI a molecules composing the pigments in LH2, its influence on the beating signal at such large values of the detuning is expected to be negligible at room temperature.
- Kruger, Scholes, and Fleming B. P. Krueger, G. D. Scholes, R.
- FIG. 22 A closer look at the upper cross-peak on a different scale is shown in FIG. 22 .
- Contour lines are reliable to well-below the 1% value of the maximum signal in the spectrum.
- T waiting time
- S ′( ⁇ ⁇ , ⁇ t ,T ) A ( ⁇ ⁇ , ⁇ t )sin( ⁇ ( ⁇ ⁇ , ⁇ t ) T + ⁇ ( ⁇ ⁇ , ⁇ t )) e ⁇ ( ⁇ ⁇ , ⁇ t )T (6)
- A( ⁇ ⁇ , ⁇ t ), ⁇ ( ⁇ ⁇ , ⁇ t ), ⁇ ( ⁇ ⁇ , ⁇ t ), and ⁇ ( ⁇ ⁇ , ⁇ t ) are the amplitude, detuning, phase, and dephasing maps, respectively.
- FIG. 23A maps of the dephasing time ( ⁇ ⁇ 1 ), amplitude, and phase of the fits are shown for the same region of the cross peak above the diagonal as in FIG. 22B .
- the small deviation on the red end of the coherence axis reflects the contribution from the phase term in this region of the spectrum.
- Two prominent extrema are visible along the coherence frequency axis at 845 nm and 860 nm.
- the amplitude map is indicative of electronic coupling.
- the beating signal in the upper cross-peak arises from interference between two Feynman response pathways, one from a ground-state bleach and the other from excited state absorption. These pathways carry opposite signs. In the absence of coupling, the pathways exactly cancel.
- the amplitude map therefore, provides a mapping of the electronic coupling terms between excitons at a given frequency weighted by the dipolar interactions with the fields.
- the third-order response includes the product of dipole transition terms and contributions from finite pulse durations, these contributions weigh the photon echo signal relatively equally in this region of the 2D spectrum.
- the amplitude maps provides a relative measure of the off-diagonal elements in the coupling Hamiltonian between the two rings.
- the absolute coupling strength however, remains an unknown parameter although previous theoretical work suggests that these values lie in the range of tens of wavenumbers.
- the field-matter interaction persists only for the duration of the pulse, while the system-bath interactions are present at all times. To avoid complications arising from pulse overlap during the excitation, we neglected waiting times under 40 fs in our analysis.
- the system-bath interaction in addition to inducing electronic coupling between excitons, also causes the quantum beating to dephase.
- the dephasing map therefore, is a direct measure of the degree of decoherence between excitons owing to these interactions.
- the dephasing and amplitude map show very strong anti-correlation meaning that system-bath interactions which link particular excitons on each ring are also responsible for rapid decoherence. In essence, the bath fluctuations increase the coupling, which causes increase energetic splitting between the excitons and therefore induces dephasing.
- the environment can, in fact, assist in the efficiency of transport through an interplay of coherent effects and dephasing—an idea supported by recent theoretical work.
- the protein fluctuation either brings regions of BChI a pigments on each ring close together promoting exciton coupling or alternately gives rise to a change in the dielectric environment which promotes stronger coupling.
- the probability of relaxation would simply be the sum of the probabilities of relaxation through each pathway. Quantum mechanically, the probability of relaxation will be the square of the sum of the amplitudes. This distinction gives rise to a new mechanism for control of excitonic dynamics. In essence, if the complex makes use of such interference, it is acting as a molecular interferometer. The interference is controlled by the phase of the coupling term and leads to a particular pattern of constructively and destructively interfering transfer pathways. Silbey et al. (J. S. Cao, R. J. Silbey, Journal of Physical Chemistry A 113, 13825 (Dec. 17, 2009)), and separately, Plenio et al. (F. Caruso, A. W. Chin, A.
- the relative phase of this coupling term is equal within the margin of error to that between the ⁇ 1 850 and ⁇ 800 states.
- the two states are not equally coupled to the trap and show a larger dephasing rate with stronger coupling. Because the transfer time is dependent on the coupling strength, this anti-correlation allows the system to avoid back transfer from the trap state. A different coupling strength and dephasing rate connecting these three states will strongly affect the relative phase terms that give rise to maximum efficiency for trapping. Because the system-bath interactions determine the phase, amplitude, and dephasing rates, these results highlight the importance the protein has in optimizing transfer between pigments.
- a model of the supermolecular interferometery used by LH2 based on the scheme described above is shown in FIG. 24 .
- LH2 offers a paradigm from nature that suggests quantum interference may be of benefit in artificial systems. While it is not obvious whether or not other solutions exist that capitalize on environment interactions for efficient transfer, the particular scheme utilized by nature for LH2 provides near 100% quantum efficiency and represents a successful design strategy for photosynthetic organisms. Further theoretical work will have to examine the efficiency of this scheme relative to correlated or uncorrelated amplitude and dephasing maps. The non-uniformity of the phase maps linking the B800 and B850 units of LH2 hints that optimal design strategies may be utilized to enhance energy transfer in artificial systems using non-intuitive structure-function relationships between the pigments and their surroundings.
- the output of the regenerative amplifier (40 fs, 5 kHz, 800 nm) is focused into a flowing stream of Argon gas to generate a high-power continuum pulse.
- the 750-870 nm region of the white light spectrum is selected.
- the pulse is compressed by two pairs of chirped mirrors (total GVD is ⁇ 360 fs2).
- Total GVD is ⁇ 360 fs2).
- Single-shot non-resonant transient grating measurements off an optical flat estimate the pulse duration at fewer than 40 fs with a slight degree of positive chirp.
- Chirp affects the line shapes of the 2D spectrum only slightly for population times less than the pulse duration (45)
- the ultrabroadband pulse is split by a 50:50 beam splitter, and the delay between the two beams, corresponding to the population time, T, is controlled by a motorized translation stage.
- T population time
- Optical flats are employed to balance the dispersion in each path.
- These four beams are then incident on a mirror assembly to form a distorted boxcar geometry.
- the LO beam is attenuated by approximately three orders of magnitude and adjusted to arrive ⁇ 1.5 ps prior to the signal.
- the four beams are vertically aligned such that the overlap at the sample generates tilted wavefronts that spatially encode the temporal delays across the sample and permit acquisition of the echo signal in the rotating frame.
- An imaging spectrometer resolves the resulting heterodyned signal onto a 2048 ⁇ 2048 pixel thermoelectrically cooled CCD camera.
- the resulting interference pattern allows the determination of the phase and magnitude of the third-order rephasing signal.
- the timings between pulses were determined using spectral interferometry as described by Joffre et al.
- LH2 was isolated from Rhodobacter sphaeroides cultures as described by Frank et al. Sufficiently pure samples suitable for spectroscopic investigation required two sequential runs through a DEAE-Sephacel column and eluted between 500-600 mM NaCl. Samples were subsequently concentrated down to 0.2 OD at 850 nm in a 200 ⁇ m cuvette.
- Diagonal and Lower Cross-peak Analysis The waiting time dependence of the diagonal and lower cross-peak are shown in FIG. 25 along with fits to a sum of two exponential decays and a single exponential growth.
- the 2D spectrum represents the nonlinear response convolved with the laser spectrum, which causes a red shift in the position of the B850 bands.
- the first 150 fs of the signal are discarded in the fits because of large Stokes' shifts arising from solvent reorganization following excitation. These decay curves are in good agreement with previous transient absorption measurements on LH2 with excitation at 800 nm and either a white light continuum probe or 850 nm probe.
- the inset of FIG. 25 shows the effects of laser intensity fluctuations, which are correlated (or anti-correlated) at each waiting time. These arise because the waiting times are sampled parametrically so that at the instant the 2D spectrum is recorded, the spectrally resolved signal fluctuates with the laser intensity fluctuation at each frequency component of the pulse. We regularly observed both integrated laser intensity fluctuations as well as spectral profile changes during the course of the experiment. We estimated that these fluctuations result in roughly 10-20% change in the magnitude of the signal. The effects of such large signal variations would be magnified by orders of magnitude in a point-by-point sampling of the coherence times because the phase of the signal oscillates with the energy level difference between ground and excited states. This is in contrast to the amplitude changes observed during the waiting period, which oscillate with the energy level difference between excitons.
- the quantum-beating signal at the upper diagonal cross-peak can arise from two fundamentally different sources—electronic coherence and vibrational coherence as shown in FIG. 26 .
- the former originates from a superposition state of two or more excitons formed by coupled BChI a molecules.
- Vibrational coherences which can arise from vibrational states on a single chromophore, also give rise to a quantum-beating signal. In general, these two pathways cannot be distinguished solely based on their spectral position on the 2D spectrum.
- vibrational coherence does not show beating frequencies greater than a few hundred wavenumbers even when higher frequencies are supported by the excitation bandwidth. While vibrational states on both the ground and excited surfaces are evident at higher energies from Raman spectra of BChI a solutions, the decay rate of nuclear coherent oscillations is expected to increase with higher vibrational modes, while the amplitude of the beating is expected to decrease. At room temperature, low frequency modes owing to the presence of intermolecular modes with clustered solvent molecules have been observed, but these only occur in the 100 cm-1 regime.
- vibrational coherences would be even less likely to be observed owing to rapid dephasing.
- large amplitude quantum beating signals at room temperature that persist for up to 400 fs with frequencies that range from 800-1000 cm ⁇ 1 cannot arise from intramolecular vibrations on individual BCh a molecules or intermolecular modes resulting from solvent interactions.
- vibrational coherences will decay even faster than for an individual chromophore, precluding their origin as the beating signal we observe in this work.
- Photosynthetic antenna complexes absorb radiation and guide the excitation energy to the reaction center where the energy results in charge separation that ultimately drives cellular metabolism. While the molecular structure of reaction centers is highly conserved across many different species, antenna complexes vary greatly, and the underlying mechanisms of how energy is guided through these systems is currently not fully understood. Recent phase sensitive experiments in a variety of antenna complexes have revealed that coherent mechanisms, in which the system is found in a superposition of excited electronic states, may contribute to the overall transfer efficiency of the complex, and coherence has been shown to persist longer than the initial timescales for energy transfer even at physiological temperatures.
- the ensemble experiments contain two mechanisms that contribute to the observed dephasing rate.
- Static disorder across the ensemble caused by differences in the microenvironments of the chromophores that do not vary appreciably over the timescale of the experiment, results in a distribution of transition frequencies and is referred to as inhomogeneous broadening.
- homogeneous broadening occurs from interactions of the system with the environment occurring on timescales faster than or commensurate with the experimental timescale, causing the transition frequency of all members of the ensemble to appear identical. This form of broadening provides a true measure of the lifetime of the coherence in question.
- inhomogeneous dephasing implies that although the ensemble dephases rapidly, individual elements of the ensemble, if measured separately, might dephase much more slowly. Distinguishing whether the coherence is inhomogeneously or homogeneously broadened will reveal if the measured coherence lifetime represents either a lower bound or both an upper and lower bound for the timescale of the dephasing. This distinction will aid in the understanding of the relative contribution of coherent mechanisms in photosynthesis.
- spectroscopic methods are capable of directly quantifying inhomogeneity for excited states in the single-quantum coherence manifold.
- Hole-burning spectroscopy and the closely related fluorescence line narrowing spectroscopy have been used at low temperatures to measure the inhomogeneous linewidths for a variety of samples.
- These techniques rely on the approximation of slow spectral diffusion (which is not applicable at room temperature) where homogeneous linewidths tend to dominate broadening in the condensed phase.
- Photon echo peak shift experiments have also been shown to be capable of separating homogeneous and inhomogeneous spectral diffusion by rephasing of the static inhomogeneity.
- the present techniques use a closely related method, two-dimensional spectroscopy, which correlates absorption events with emission events as a function of a waiting time.
- a closely related method two-dimensional spectroscopy, which correlates absorption events with emission events as a function of a waiting time.
- four non-collinear femtosecond laser pulses are incident on the sample, generating a degenerate four-wave mixing signal in a phase matched direction.
- the system is prepared into a superposition between the ground and resonant electronic excited states, which evolve phase as a function of coherence time, ⁇
- the next pulse promotes the coherence to a population or zero-quantum coherence which is then allowed to evolve for a waiting time, T.
- the finial pulse stimulates the emission of the third order response and the time delay between the final pulse and emitted signal is detected a time, t, later.
- the timings between beams are then parametrically scanned and a two-dimensional Fourier transform is performed over ⁇ and t to generate a two-dimensional correlation spectrum.
- Coherent signatures between electronic states can be observed in this spectrum by examining how the cross peak amplitude changes with waiting time. If coherence is maintained, the cross peak amplitude will beat at the frequency difference between the excited states damped by the dephasing rate in addition to decaying or growing due to population dynamics (incoherent energy transfer).
- S( ⁇ ⁇ ,T, ⁇ t ) exp(i( ⁇ ⁇ ⁇ T ) fast .
- the frequency of the beating should follow the energy difference between the ⁇ ⁇ and ⁇ ⁇ axes.
- broadening will occur via both mechanisms.
- FIG. 28 Shown in FIG. 28 is data taken from the FMO antenna complex of green sulfur bacteria Chlorobium tepidum at 77 K. A 100 cm ⁇ 1 ⁇ 100 cm ⁇ 1 region centered around the exciton 1-2 cross peak was then investigated, using the exciton values of Hayes and Engel. (Dugan Hayes, Gregory S. Engel, Extracting the Excitonic Hamiltonian of the Fenna-Matthews-Olson Complex Using Three-Dimensional Third-Order Electronic Spectroscopy, Biophysical Journal, 100(8), 20 Apr. 2011). Slow population dynamics were first removed by fitting to two exponential decays and subtracting the fit from the signal.
- the residual was then fit to two exponentially decaying sinusoids corresponding to the 1-2 and 1-3 coherence and this procedure was repeated for every point within the selected region.
- a two-dimensional beating map can then be created, which reveals how the beating frequency changes throughout the selected region of the cross peak. Examining the 1-2 beat frequency fit reveals that over the 100 cm ⁇ 1 square the beat frequency changes by only ⁇ 9 cm ⁇ 1 which is 9% of the predicted inhomogeneous range. We therefore conclude that at 77 K, the zero-quantum coherence between excitons one and two can be characterized as predominantly homogeneously broadened.
- the amount of inhomogeneous broadening in the zero-quantum manifold is a measure of the static degree of correlation between the excitonic transitions, as shown in FIG. 29 .
- the FMO complex in which we observe little change in the beat frequency, requires that while different members of the ensemble have different mean energy levels, the gap between them remains roughly constant across the ensemble.
- the states are highly correlated across the inhomogeneous ensemble.
- LH2 the static disorder between the B800 and 850 states appears uncorrelated, causing the energy difference between these states to change appreciably for different members of the ensemble.
- We attribute this difference between FMO and LH2 to be largely due to the remarkably different molecular structure.
- the average chromophore separation within a monomer is ⁇ 12 ⁇
- the closest separation between the B850 and B800 chromophores is ⁇ 18 ⁇ and can be as far as 60 ⁇ .
- the protein environment for the B850 and B800 chromophores are quite different, varying in their degree of exposure to the solvent and differing nearby residues, while for FMO the chromophores are held within a similar environment, all being pinned between two large beta sheets. In this way, the protein environment in FMO correlates the static excitonic energy levels, causing the energy difference to remain constant.
- FMO coherence in FMO is homogeneously broadened while it is inhomogeneously broadened in LH2 if we consider the relative contributions to the single-quantum manifold.
- the homogeneous linewidth of FMO has previously been found to be 245 cm ⁇ 1 which is significantly greater than the inhomogeneous contribution to the linewidth of ⁇ 100 cm ⁇ 1 .
- LH2 is in the opposite regime, where the homogenous and inhomogeneous linewidths have both been found to be on the order of ⁇ 200 cm ⁇ 1 .
- Dephasing of zero-quantum coherences sets a lower bound for the timescales of coherent quantum dynamics, and two-dimensional spectroscopy can determine if this lower bound also represents an upper bound for the coherence lifetime or not. While we can distinguish between the limiting cases, our spectroscopy currently cannot directly measure the homogeneous and inhomogeneous linewidths. It should be possible to rephase the zero-quantum coherence at short time delays, for example in a higher-order MUPPETS-like experiment, in much the same way that two-dimensional spectroscopy rephases the one-quantum coherences. This approach would permit complete characterization of the relative contributions to the dephasing of the zero-quantum coherence.
- FMO isolated from C. tepidum in a 800 mM tris/HCL buffer was dissolved in 35:65 vol/vol glycerol water solution with 0.1% laurydimethylamine oxide detergent resulting in an optical density of 0.32 at 809 nm in a 200- ⁇ m fused silica cell.
- a cryostat was used to cool the sample to 77 K and 2D spectra were collected using a diffractive optics based setup utilizing the output from a regenerative amplifier resulting in an energy of 1.6 nJ/pulse with 38 fs per pulse.
- the coherence time was sampled from ⁇ 500 to 500 fs with a step size of 4 fs and the waiting time was sampled in steps of 20 fs. Scatter subtraction and data analysis have been described previously.
- LH2 was isolated from Rhodobacter sphaeroides and dissolved in a 20 mM Tris-HCl Solution with 1.3% LDAO resulting in an optical density of 0.2-0.3 in a 200- ⁇ m fused silica flow cell.
- the output from a regenerative amplifier was focused into argon to produce a spectrally broadened pulse spanning from ⁇ 750-850 nm that was compressed to 25 fs with chirped mirrors.
- the GRAPE technique was then used to acquire rephasing two-dimensional spectra with the waiting time sampled at 10 fs. Scatter subtraction and data analysis have been described previously.
- Quantum dots exhibit rich and complex electronic structure that makes them ideal for studying the basic physics of semiconductors in the intermediate regime between bulk materials and single atoms. The remarkable nonlinear optical properties of these nanostructures make them strong candidates for photonics applications.
- QDs Semiconductor nanocrystal quantum dots
- the direct-band gap lies at four equivalent L points in the Brillouin zone, creating a 64-dimensional excitonic manifold when spin is included.
- minor deviations from spherical symmetry as well as band anisotropy may give rise to splitting of degenerate energy levels, especially for small QDs.
- Intervalley coupling and interband coupling as well as electron-hole Coulomb and exchange interactions offer additional splittings of the excitonic energy levels.
- the linear absorption spectrum of 2-3 nm PbS quantum dots is shown in FIG. 31 alongside the distribution of sizes as determined by transmission electron microscopy (TEM). At the band edge, near 1.55 eV, only a broad absorption band is visible.
- the distribution of dot sizes as determined by TEM measurements results in significant inhomogeneous broadening as predicted by the known band gap dependence on the dot size.
- the broad absorption spectrum acts to completely mask any splitting of the excitonic energy levels ( ⁇ 100 meV) or exciton-biexciton transitions ( ⁇ 50 meV red shift) which are significantly smaller than the >300 meV absorption line width at the band edge.
- Transient absorption (TA) measurements ( FIG. 31C ) also fail to reveal any excitonic fine structure, again due to the large degree of inhomogeneous broadening in the linear absorption, precluding the use of this technique in elucidating many of the most important features of the dynamics.
- a single-shot approach of the GRAPE techniques relaxes the phase stability requirement of conventional multidiversified techniques by 2-3 orders of magnitude, allowing us to utilize continuum generation that covers over 200 meV of bandwidth compared with ⁇ 60 meV with conventional kHz amplified laser sources.
- Another example of the GRAPE technique is shown schematically in FIG. 32 . Encoding all the requisite temporal delays (i.e. coherence times) of the 2D pulse sequence along a spatial axis of a macroscopically homogeneous sample is shown. The emitted photon echo signal is then imaged onto the slit of an imaging spectrometer and detected with a two-dimensional CCD.
- the resultant 2D spectrum obtained after Fourier transformation along the temporally encoded spatial axis, achieves a 2-3 order of magnitude reduction in acquisition time at a higher SNR than is achievable with multi-scan methods (see the discussion below in this Example for details of the experimental setup).
- the 2D spectrum, generated by the third-order nonlinear polarization of the system links the dipole oscillation frequency during an initial coherence period, ⁇ , with that of a final rephasing period, t, for each population time, T. Peaks that appear on the diagonal provide a measure of the ‘memory’ of the system, while cross-peaks provide information on electronic coupling.
- the 2D spectrum measures system relaxation such as energy transfer or spectral diffusion originating, for example, from exciton-phonon interactions.
- each band has a different rate of relaxation allows for spectral differentiation in the 2D spectrum at early times.
- the lowest and highest energy peaks are significantly elongated along the diagonal indicating a large degree of inhomogeneous broadening, while the central peak shows sub-25 fs spectral diffusion arising from dynamical disorder, i.e. exciton-phonon interactions that cause the transition energy to sample values within the line width.
- the degree to which the lowest and highest energy bands contaminate the central feature line shape appears to be minimal as its shape changes only slightly during the range of population times measured.
- the appearance of multiple peaks along the diagonal is consistent with recent calculations by Zunger (A. Franceschetti, J. M. An, and A.
- the transition energies of the lowest energy peak experience significant dynamic disorder as manifested by a round peak shape, which may arise from exciton-phonon interactions.
- the highest-energy peak becomes unresolved underneath the broad tail of the central peak at [1.57, 1.55] eV at a population time of 50 fs. By 75 fs, several prominent features appear both above and below this peak.
- the cross-peak appearing at [1.60, 1.55] eV is consistent with transfer of energy from the higher energy level to a lower energy band originating from intervalley splitting. Since the higher energy band is undergoing rapid relaxation, its change in dipole moment likely allows coupling to the band-edge state and facilitates ultrafast energy transfer.
- Another cross-peak at [1.59, 1.51] eV appears to form between the lowest energy peak that is experiencing the Stokes shift and both high energy peaks. Its position midway between the position of the two possible cross-peaks, and its movement to lower stimulated emission energy with the Stokes shifted peak supports this assignment. After 100 fs, the 2D spectrum does not show significant changes for at least 3 ps, the maximum population time measured.
- the narrow stimulated emission bands are a result of relatively long-lived single-quantum coherences experienced by the lone exciton.
- the data would suggest that the transition frequency of one exciton experiences perturbations arising from the field created by another, separate exciton, causing an energy splitting during the coherence period of the 2D pulse sequence.
- the output of the regenerative amplifier (40 fs, 5 kHz, 800 nm) is focused into a flowing stream of Argon gas to generate a high-power continuum pulse.
- Using broadband dielectric mirrors only the 750-870 nm (1.42-1.65 eV) region of the white light spectrum is selected.
- the pulse is compressed by two pairs of chirped mirrors (total GVD is ⁇ 360 fs2).
- Total GVD is ⁇ 360 fs2).
- the ultrabroadband pulse is split by a 50:50 beam splitter, and the delay between the two beams, corresponding to the population time, T, is controlled by a motorized translation stage.
- An uncoated wedged optic further split each pulse into a pair by the use of Fresnel reflections from the front and back surfaces of the optic.
- These four beams are then incident on a mirror assembly to form a distorted boxcar geometry.
- the LO beam is attenuated by approximately three orders of magnitude and adjusted to arrive ⁇ 1.5 ps prior to the signal.
- the four beams After focusing in the horizontal direction by a cylindrical lens, the four beams are vertically aligned such that their wavefronts overlap at the sample generating the spatially encoded temporal delays and permitting acquisition of the echo signal in the rotating frame.
- the timings between pulses were determined using spectral interferometry as described by Joffre et al.
- An imaging spectrometer resolves the resulting heterodyned signal onto a 2048 ⁇ 2048 pixel thermoelectrically cooled CCD camera.
- the resulting interference pattern allows the determination of the phase and magnitude of the third-order rephasing signal.
- Our data analysis uses a modified procedure of that used for multi-scan two-dimensional spectroscopy as described in detail by Brixner et al. However, without adequate pump-probe data or other external reference, we cannot assign an absolute phase to the 2D spectrum. Due to the sensitivity of the third-order response to the laser fluence, we can only present absolute value spectra with confidence.
- Transient absorption measurements were performed using a 2 kHz amplified Ti:Sapphire laser with a white light probe pulse produced in a 2 mm-thick sapphire plate and a tunable pump pulse generated using an optical parametric amplifier. Data was collected from ⁇ 500 fs to 200 ps and probed from about 1.3 eV to 1.9 eV across a wide range of pump fluencies (0.08-1.36 mJ/cm2) and energies (1.46 to 1.60 eV).
Abstract
Description
F t,τ P ω
where F, P, and S are Fourier transform, projection, and slice operators respectively. The term on the left is equal to the projection of the real part of the two-dimensional spectrum, ƒ(ωτ, ωt), while the term on the right is equivalent to the spectrally resolved pump probe signal. Therefore, a separate measurement of the pump-probe signal provides an independent means of determining the absolute phase of the 2D spectrum.
Φ0+(ωt−ω0)dΦ 1 /dω+(ωt−ω0)2 d 2Φ1 /dω 2 (2)
to match the pump-probe signal. The zero-order term corresponds to an overall phase constant correction, while the linear term corrects for uncertainties in the t34(y) timing. A small quadratic term is applied to correct for minor dispersive terms owing to pulse chirp and dispersion in the system. The real part of the 2D spectra and separately recorded pump probe spectra are in excellent agreement at all population times measured after this phasing procedure.
Φ′0+(ωτ−ω0)τc (3)
where τc corrects for the timing error in the determination of τ=0.
2D Spectra of IR 144
J is the electronic coupling strength between the two chromophores with energies ∈1 and ∈2.
S′(λτ,λt ,T)=A(λτ,λt)sin(Ω(λτ,λt)T+Φ(λτ,λt))e −Γ(λ
where A(λτ, λt), Ω(λτ, λt), Φ(λτ, λt), and Γ(λτ, λt) are the amplitude, detuning, phase, and dephasing maps, respectively. Some regions of the upper cross-peak fit slightly better to a sum of two exponentially decaying sinusoidal functions, but we have not pursued this point further in the analysis below. The frequency of beating at each point in the map matches well with the detuning (within ˜75%, not including the uncertainty in the carrier frequency of excitation),
Claims (11)
Priority Applications (1)
| Application Number | Priority Date | Filing Date | Title |
|---|---|---|---|
| US13/814,427 US9001320B2 (en) | 2010-08-16 | 2011-08-16 | Real-time mapping of electronic structure with single-shot two-dimensional electronic spectroscopy |
Applications Claiming Priority (3)
| Application Number | Priority Date | Filing Date | Title |
|---|---|---|---|
| US40161010P | 2010-08-16 | 2010-08-16 | |
| PCT/US2011/048001 WO2012024347A1 (en) | 2010-08-16 | 2011-08-16 | Real-time mapping of electronic structure with single-shot two-dimensional electronic spectroscopy |
| US13/814,427 US9001320B2 (en) | 2010-08-16 | 2011-08-16 | Real-time mapping of electronic structure with single-shot two-dimensional electronic spectroscopy |
Publications (2)
| Publication Number | Publication Date |
|---|---|
| US20130222801A1 US20130222801A1 (en) | 2013-08-29 |
| US9001320B2 true US9001320B2 (en) | 2015-04-07 |
Family
ID=45605421
Family Applications (1)
| Application Number | Title | Priority Date | Filing Date |
|---|---|---|---|
| US13/814,427 Active US9001320B2 (en) | 2010-08-16 | 2011-08-16 | Real-time mapping of electronic structure with single-shot two-dimensional electronic spectroscopy |
Country Status (2)
| Country | Link |
|---|---|
| US (1) | US9001320B2 (en) |
| WO (1) | WO2012024347A1 (en) |
Cited By (9)
| Publication number | Priority date | Publication date | Assignee | Title |
|---|---|---|---|---|
| US20140198198A1 (en) * | 2011-06-14 | 2014-07-17 | Ecole Polytechnique Federale De Lausanne (Epfl) | Cumulant microscopy |
| US20180231416A1 (en) * | 2014-06-20 | 2018-08-16 | Carl Zeiss Microscopy Gmbh | Method and Apparatus for Actuating an Acousto-Optical Component |
| KR102158203B1 (en) * | 2019-10-24 | 2020-09-22 | 울산과학기술원 | Heterodyne type two-dimensional infrared spectroscopy device and spectroscopy method using the same |
| WO2021034456A3 (en) * | 2019-08-16 | 2021-04-01 | Paul Bartholomew | Raman spectroscopy for minerals identification |
| US20210164841A1 (en) * | 2016-10-05 | 2021-06-03 | Government Of The United States, As Represented By The Secretary Of The Air Force | Systems and Methods for High-Speed, Spectroscopic, Gas-Phase Thermometry |
| US11099129B2 (en) * | 2017-09-14 | 2021-08-24 | Brown University | Spatially resolved standoff trace chemical sensing using backwards transient absorption spectroscopy |
| US11156553B2 (en) * | 2017-11-07 | 2021-10-26 | The University Of Chicago | Systems and methods for optical resonance imaging |
| US11181480B2 (en) | 2018-08-22 | 2021-11-23 | Paul Bartholomew | Raman spectroscopy for minerals identification |
| WO2023053896A1 (en) * | 2021-09-29 | 2023-04-06 | 国立大学法人京都大学 | Quantum absorption spectroscopy system, and quantum absorption spectroscopy method |
Families Citing this family (14)
| Publication number | Priority date | Publication date | Assignee | Title |
|---|---|---|---|---|
| JP5502564B2 (en) * | 2010-03-31 | 2014-05-28 | 浜松ホトニクス株式会社 | Electromagnetic wave detection device |
| US8757871B2 (en) * | 2010-08-16 | 2014-06-24 | The Board Of Trustees Of The University Of Illinois | Particle dynamics microscopy using temperature jump and probe anticorrelation/correlation techniques |
| AU2012309158B2 (en) * | 2011-06-24 | 2016-06-30 | Northeastern University | Phase correction to compensate for reflective distortions of optical spectra |
| US20150374246A1 (en) * | 2014-06-26 | 2015-12-31 | Technion R&D Foundation Ltd. | Blood velocity measurement using correlative spectrally encoded flow cytometry |
| EP3180582A2 (en) * | 2014-08-12 | 2017-06-21 | ADOM Advanced Optical Technologies Ltd. | System for analyzing optical properties of an object |
| EP3034463B1 (en) * | 2014-12-18 | 2019-03-27 | Centre National De La Recherche Scientifique (Cnrs) | Coherent spectroscopic methods with extended interrogation times and systems implementing such |
| CN106483076B (en) * | 2015-08-27 | 2019-10-25 | 中国科学院物理研究所 | Two-dimension spectrum device |
| US11314067B2 (en) * | 2016-11-11 | 2022-04-26 | Leica Microsystems Cms Gmbh | Illumination arrangement and method for illumination in a microscope and microscope |
| FI20195947A1 (en) * | 2019-11-05 | 2021-05-06 | Timegate Instr Oy | Apparatus for measuring raman spectrum and method thereof |
| CN111239090A (en) * | 2020-02-13 | 2020-06-05 | 华东师范大学重庆研究院 | Method and system for measuring single-pulse laser-induced transient molecular fluorescence spectrum |
| JP2023534233A (en) | 2020-07-17 | 2023-08-08 | ケムイメージ コーポレーション | Systems and methods for improved spectral processing in spatial heterodyne spectroscopy |
| EP4214562A1 (en) * | 2020-09-20 | 2023-07-26 | The Regents Of The University Of California | Transverse sheet illumination microscopy (transim) |
| CN113654653B (en) * | 2021-08-13 | 2023-06-09 | 中国工程物理研究院激光聚变研究中心 | Single measurement method for ultrafast laser space-time coupling characteristic |
| CN113899703B (en) * | 2021-09-29 | 2022-07-05 | 安徽农业大学 | Linear broadening eliminating method under wavelength deviation |
Citations (11)
| Publication number | Priority date | Publication date | Assignee | Title |
|---|---|---|---|---|
| US20030025911A1 (en) * | 2001-07-23 | 2003-02-06 | Walmsley Ian A. | Optical pulse measurement |
| US20060192969A1 (en) * | 2005-02-28 | 2006-08-31 | Marks Daniel L | Distinguishing non-resonant four-wave-mixing noise in coherent stokes and anti-stokes Raman scattering |
| US20060243890A1 (en) | 2003-12-19 | 2006-11-02 | Micron Technology, Inc. | Pixel binning in an image sensor |
| US20070152154A1 (en) * | 2005-06-03 | 2007-07-05 | Decamp Matthew F | Method and apparatus for two-dimensional spectroscopy |
| US20090161092A1 (en) * | 2007-12-21 | 2009-06-25 | Martin Thomas Zanni | Multidimensional spectrometer |
| WO2009143957A1 (en) * | 2008-05-26 | 2009-12-03 | Julius-Maximilians-Universität Würzburg | Device and method for coherent multi-dimensional optical spectroscopy |
| WO2009147425A1 (en) | 2008-06-02 | 2009-12-10 | Ian Mercer | Apparatus and method for sample analysis |
| US20100041987A1 (en) | 2006-12-21 | 2010-02-18 | Universiteit Twente | Imaging Apparatus And Method |
| US20100171952A1 (en) | 2007-09-07 | 2010-07-08 | Deflores Lauren | Two-dimensional fourier transform spectrometer |
| US7771938B2 (en) | 2004-09-20 | 2010-08-10 | Wisconsin Alumni Research Foundation | Nonlinear spectroscopic methods for identifying and characterizing molecular interactions |
| US20130141606A1 (en) | 2011-12-01 | 2013-06-06 | Canon Kabushiki Kaisha | Solid state apparatus |
-
2011
- 2011-08-16 WO PCT/US2011/048001 patent/WO2012024347A1/en active Application Filing
- 2011-08-16 US US13/814,427 patent/US9001320B2/en active Active
Patent Citations (14)
| Publication number | Priority date | Publication date | Assignee | Title |
|---|---|---|---|---|
| US20030025911A1 (en) * | 2001-07-23 | 2003-02-06 | Walmsley Ian A. | Optical pulse measurement |
| US20060243890A1 (en) | 2003-12-19 | 2006-11-02 | Micron Technology, Inc. | Pixel binning in an image sensor |
| US7771938B2 (en) | 2004-09-20 | 2010-08-10 | Wisconsin Alumni Research Foundation | Nonlinear spectroscopic methods for identifying and characterizing molecular interactions |
| US20060192969A1 (en) * | 2005-02-28 | 2006-08-31 | Marks Daniel L | Distinguishing non-resonant four-wave-mixing noise in coherent stokes and anti-stokes Raman scattering |
| US20070152154A1 (en) * | 2005-06-03 | 2007-07-05 | Decamp Matthew F | Method and apparatus for two-dimensional spectroscopy |
| US20100041987A1 (en) | 2006-12-21 | 2010-02-18 | Universiteit Twente | Imaging Apparatus And Method |
| US20100171952A1 (en) | 2007-09-07 | 2010-07-08 | Deflores Lauren | Two-dimensional fourier transform spectrometer |
| US8526002B2 (en) | 2007-09-07 | 2013-09-03 | Massachusetts Institute Of Technology | Two-dimensional fourier transform spectrometer |
| US7760342B2 (en) | 2007-12-21 | 2010-07-20 | Wisconsin Alumni Research Foundation | Multidimensional spectrometer |
| US20090161092A1 (en) * | 2007-12-21 | 2009-06-25 | Martin Thomas Zanni | Multidimensional spectrometer |
| WO2009143957A1 (en) * | 2008-05-26 | 2009-12-03 | Julius-Maximilians-Universität Würzburg | Device and method for coherent multi-dimensional optical spectroscopy |
| US20110141467A1 (en) * | 2008-05-26 | 2011-06-16 | Julius-Maximilians-Universität Würzburg | Apparatus and method for coherent multi-dimensional optical spectroscopy |
| WO2009147425A1 (en) | 2008-06-02 | 2009-12-10 | Ian Mercer | Apparatus and method for sample analysis |
| US20130141606A1 (en) | 2011-12-01 | 2013-06-06 | Canon Kabushiki Kaisha | Solid state apparatus |
Non-Patent Citations (18)
Cited By (13)
| Publication number | Priority date | Publication date | Assignee | Title |
|---|---|---|---|---|
| US9658442B2 (en) * | 2011-06-14 | 2017-05-23 | Ecole Polytechnique Federale De Lausanne (Epfl) | Cumulant microscopy |
| US20140198198A1 (en) * | 2011-06-14 | 2014-07-17 | Ecole Polytechnique Federale De Lausanne (Epfl) | Cumulant microscopy |
| US20180231416A1 (en) * | 2014-06-20 | 2018-08-16 | Carl Zeiss Microscopy Gmbh | Method and Apparatus for Actuating an Acousto-Optical Component |
| US10302490B2 (en) * | 2014-06-20 | 2019-05-28 | Carl Zeiss Microscopy Gmbh | Method and apparatus for actuating an acousto-optical component |
| US20210164841A1 (en) * | 2016-10-05 | 2021-06-03 | Government Of The United States, As Represented By The Secretary Of The Air Force | Systems and Methods for High-Speed, Spectroscopic, Gas-Phase Thermometry |
| US11499872B2 (en) * | 2016-10-05 | 2022-11-15 | United States Of America As Represented By The Secretary Of The Air Force | Systems and methods for high-speed, spectroscopic, gas-phase thermometry |
| US11099129B2 (en) * | 2017-09-14 | 2021-08-24 | Brown University | Spatially resolved standoff trace chemical sensing using backwards transient absorption spectroscopy |
| US11156553B2 (en) * | 2017-11-07 | 2021-10-26 | The University Of Chicago | Systems and methods for optical resonance imaging |
| US11181480B2 (en) | 2018-08-22 | 2021-11-23 | Paul Bartholomew | Raman spectroscopy for minerals identification |
| WO2021034456A3 (en) * | 2019-08-16 | 2021-04-01 | Paul Bartholomew | Raman spectroscopy for minerals identification |
| WO2021080232A1 (en) * | 2019-10-24 | 2021-04-29 | 울산과학기술원 | Heterodyne type two-dimensional infrared spectroscopy device, and spectroscopy method using same |
| KR102158203B1 (en) * | 2019-10-24 | 2020-09-22 | 울산과학기술원 | Heterodyne type two-dimensional infrared spectroscopy device and spectroscopy method using the same |
| WO2023053896A1 (en) * | 2021-09-29 | 2023-04-06 | 国立大学法人京都大学 | Quantum absorption spectroscopy system, and quantum absorption spectroscopy method |
Also Published As
| Publication number | Publication date |
|---|---|
| WO2012024347A1 (en) | 2012-02-23 |
| US20130222801A1 (en) | 2013-08-29 |
Similar Documents
| Publication | Publication Date | Title |
|---|---|---|
| US9001320B2 (en) | Real-time mapping of electronic structure with single-shot two-dimensional electronic spectroscopy | |
| Donaldson et al. | A 100 kHz pulse shaping 2D-IR spectrometer based on dual Yb: KGW amplifiers | |
| Biswas et al. | Coherent two-dimensional and broadband electronic spectroscopies | |
| Lagutchev et al. | Compact broadband vibrational sum-frequency generation spectrometer with nonresonant suppression | |
| Schlau-Cohen et al. | Two-dimensional electronic spectroscopy and photosynthesis: Fundamentals and applications to photosynthetic light-harvesting | |
| Teo et al. | Invited Article: Single-shot THz detection techniques optimized for multidimensional THz spectroscopy | |
| Harel et al. | Single-shot gradient-assisted photon echo electronic spectroscopy | |
| Zheltikov | Coherent anti‐Stokes Raman scattering: from proof‐of‐the‐principle experiments to femtosecond CARS and higher order wave‐mixing generalizations | |
| US7760342B2 (en) | Multidimensional spectrometer | |
| Tollerud et al. | Coherent multi-dimensional spectroscopy: Experimental considerations, direct comparisons and new capabilities | |
| WO2020077735A1 (en) | Dual-frequency comb spectral focusing coherent anti-stokes raman spectroscopy detection system | |
| Anderson et al. | SPIDER: A decade of measuring ultrashort pulses | |
| Thämer et al. | Detecting weak signals from interfaces by high accuracy phase-resolved SFG spectroscopy | |
| US9267893B2 (en) | Triple sum frequency coherent multidimensional imaging | |
| Spokoyny et al. | Mapping the vibronic structure of a molecule by few-cycle continuum two-dimensional spectroscopy in a single pulse | |
| Preda et al. | Linear and nonlinear spectroscopy by a common-path birefringent interferometer | |
| US8860939B2 (en) | Method and system for optical spectroscopy | |
| Tapping et al. | Two-dimensional electronic spectroscopy using rotating optical flats | |
| Tollerud | Understanding quantum processes in semiconductors through the use of selective multidimensional spectroscopy | |
| Röding | Coherent multidimensional spectroscopy in molecular beams and liquids using incoherent observables | |
| Moore et al. | B2. 1 Ultrafast spectroscopy | |
| Nieva Perez | Towards the development of time-resolved optical activity spectroscopy | |
| CRISAFI | Innovative techniques for coherent Raman microscopy | |
| Ostic | Fiber optics for terahertz detection: Toward single-pulse terahertz detection using the dispersive Fourier transform | |
| Moss | Terahertz from Electrons, Electronics from Terahertz |
Legal Events
| Date | Code | Title | Description |
|---|---|---|---|
| AS | Assignment |
Owner name: THE UNIVERSITY OF CHICAGO, ILLINOIS Free format text: ASSIGNMENT OF ASSIGNORS INTEREST;ASSIGNORS:ENGEL, GREGORY S.;HAREL, ELAD;SIGNING DATES FROM 20130502 TO 20130503;REEL/FRAME:030420/0644 |
|
| STCF | Information on status: patent grant |
Free format text: PATENTED CASE |
|
| FEPP | Fee payment procedure |
Free format text: ENTITY STATUS SET TO SMALL (ORIGINAL EVENT CODE: SMAL) |
|
| MAFP | Maintenance fee payment |
Free format text: PAYMENT OF MAINTENANCE FEE, 4TH YR, SMALL ENTITY (ORIGINAL EVENT CODE: M2551); ENTITY STATUS OF PATENT OWNER: SMALL ENTITY Year of fee payment: 4 |
|
| AS | Assignment |
Owner name: NATIONAL SCIENCE FOUNDATION, VIRGINIA Free format text: CONFIRMATORY LICENSE;ASSIGNOR:UNIVERSITY OF CHICAGO;REEL/FRAME:055026/0737 Effective date: 20201006 |
|
| MAFP | Maintenance fee payment |
Free format text: PAYMENT OF MAINTENANCE FEE, 8TH YR, SMALL ENTITY (ORIGINAL EVENT CODE: M2552); ENTITY STATUS OF PATENT OWNER: SMALL ENTITY Year of fee payment: 8 |
|
| AS | Assignment |
Owner name: NATIONAL SCIENCE FOUNDATION, VIRGINIA Free format text: CONFIRMATORY LICENSE;ASSIGNOR:UNIVERSITY OF CHICAGO;REEL/FRAME:063729/0840 Effective date: 20201006 |