Pursuant to 37 C.F.R. §1.78(a)(4), this application claims the benefit of and priority to prior filed Provisional Application Ser. No. 61/894,112, filed 22 Oct. 2013, and co-pending International Application No. PCT/GB2014/053144, filed 21 Oct. 2014. This application is also related to U.S. application Ser. No. 14/520,545, entitled ROSE BENGAL FOR DETECTION OF OXIDATIVE DECOMPOSITION OF CONTAMINANTS filed on even date herewith. The disclosure of each co-pending application is expressly incorporated herein by reference, in its entirety.
RIGHTS OF THE GOVERNMENT
The invention described herein may be manufactured and used by or for the Government of the United States for all governmental purposes without the payment of any royalty.
FIELD OF THE INVENTION
The present invention relates generally to decontamination of substrates and assets and, more particularly, to methods and systems for detecting, decontaminating, and monitoring decontamination of substrates and assets.
BACKGROUND OF THE INVENTION
Traditional chemical warfare agent simulants and other problematic contaminants, such as pesticides, are difficult to detect and decontaminate, either by removal or decomposition. The U.S. Department of Defense has expended considerable effort in developing what are called “decontamination assurance sprays,” which indicate a presence of contamination, such as by a colorimetric change. However, the conventional decontamination assurance sprays do not decompose the contaminants, nor do the decontamination assurance sprays provide any information on when the contaminant is effectively removed or neutralized without reapplication.
Thus, there remains a need for decontamination assurance sprays that can remove or decompose a contaminant, provide feedback as to removal effectiveness, or, preferably, both.
SUMMARY OF THE INVENTION
The present invention overcomes the foregoing problems and other shortcomings, drawbacks, and challenges of conventional decontamination assurance sprays. While the invention will be described in connection with certain embodiments, it will be understood that the invention is not limited to these embodiments. To the contrary, this invention includes all alternatives, modifications, and equivalents as may be included within the spirit and scope of the present invention.
A method of detecting the presence of a contaminant includes treating a substrate with Rose Bengal and exposing the substrate to a light having a wavelength within the visible spectrum. A response of the Rose Bengal is monitored during the light exposure. When a contaminant is present and is exposed to the light, Rose Bengal undergoes conversion between a quinoid form and a lactone form.
In accordance with some aspects of the present invention, the method of detecting the presence of the contaminant may further comprise a decomposition of the contaminant by a Rose Bengal induced photocatalytic oxidation mechanism.
Other embodiments of the present invention include a method of detoxifying a contaminated substrate by applying Rose Bengal to the contaminated substrate. The contaminant is photocatalyzed by exposing the contaminated substrate with of Rose Bengal to light having a wavelength within the visible spectrum.
Additional objects, advantages, and novel features of the invention will be set forth in part in the description which follows and, in part, will become apparent to those skilled in the art upon examination of the following or may be learned by practice of the invention. The objects and advantages of the invention may be realized and attained by means of the instrumentalities and combinations particularly pointed out in the appended claims.
BRIEF DESCRIPTION OF THE DRAWINGS
The accompanying drawings, which are incorporated in and constitute a part of this specification, illustrate embodiments of the present invention and, together with a general description of the invention given above, and the detailed description of the embodiments given below, serve to explain the principles of the present invention.
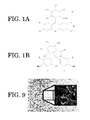
FIGS. 1A and 1B are skeletal formulae of two isomer forms of Rose Bengal, suitable for use with embodiments of the present invention.
FIG. 2 is the absorption spectrum of Rose Bengal in the presence of daylight (dashed line), ultraviolet radiation (solid line) and cool white light (dotted line).
FIG. 3 is the absorption spectrum of Rose Bengal over the visible light spectrum for various concentrations of Rose Bengal (5 μM to 25 μM).
FIG. 4 is a flowchart illustrating a method of using Rose Bengal in accordance with an embodiment of the present invention.
FIG. 5 is a bar graph illustrating a percent change in a concentration of Demeton-S (illustrated as “[DEM]”) resulting from light exposure.
FIG. 6 is a skeletal formula illustrating a mechanism of Rose Bengal photocatalytic oxidation of Demeton-S.
FIGS. 7A-7C are bar graphs illustrating percentage of end products resulting from the Rose-Bengal included photocatalytic oxidation of contaminants at 10,000 LUX, 4,000 LUX, and Dark conditions, respectively.
FIGS. 8A-8F are chromatographs of end products of the photocatalytic oxidation of Demeton-S over a 24 hr residence time.
FIG. 9 is an exemplary Scanning Electron Microscopy image of nanoparticles produced in accordance with an embodiment of the present invention.
FIGS. 10A-10F are spectra of 0.25 R560+1.00 RB+3.00 R640 nanoparticles exposed to Demeton-S, diisopropyl fluorophosphates, and bis(2-chloroethyl)sulfide for 50 min with data collection every 10 min.
FIGS. 11A-11F are spectra of 0.50 R560+1.00 RB+3.00 R640 nanoparticles exposed to Demeton-S, diisopropyl fluorophosphates, and bis(2-chloroethyl)sulfide for 50 min with data collection every 10 min.
FIGS. 12A-12F are spectra of 0.75 R560+1.00 RB+3.00 R640 nanoparticles exposed to Demeton-S, diisopropyl fluorophosphates, and bis(2-chloroethyl)sulfide for 50 min with data collection every 10 min.
FIGS. 13A-13F are spectra of 1.00 R560+1.00 RB+1.00 R640 nanoparticles exposed to Demeton-S, DFP and Mustard for 50 min with data collection every 10 min.
FIGS. 14A-14F are spectra of 1.00 R560+1.00 RB+2.00 R640 nanoparticles exposed to Demeton-S, diisopropyl fluorophosphates, and bis(2-chloroethyl)sulfide for 50 min with data collection every 10 min.
FIGS. 15A-15F are spectra of 1.00 R560+1.00 RB+3.00 R640 nanoparticles exposed to Demeton-S, diisopropyl fluorophosphates, and bis(2-chloroethyl)sulfide for 50 min with data collection every 10 min.
FIGS. 16A-16C are spectra of 1.00 RB nanoparticles exposed to Demeton-S, diisopropyl fluorophosphates, and bis(2-chloroethyl)sulfide, respectively, for 30 min with data collection every 10 min and with an excitation wavelength of about 485 nm.
FIGS. 17A-17C are spectra of 2.00 RB nanoparticles exposed to Demeton-S, diisopropyl fluorophosphates, and bis(2-chloroethyl)sulfide, respectively for 30 min with data collection every 10 min and with an excitation wavelength of about 485 nm.
FIGS. 18A-18C are spectra of 3.00 RB nanoparticles exposed to Demeton-S, diisopropyl fluorophosphates, and bis(2-chloroethyl)sulfide for 30 min with data collection every 10 min and with an excitation wavelength of about 485 nm.
FIGS. 19A-19C are spectra of 4.00 RB nanoparticles exposed to Demeton-S, diisopropyl fluorophosphates, and bis(2-chloroethyl)sulfide for 30 min with data collection every 10 min and with an excitation wavelength of about 485 nm.
FIGS. 20A-20C are spectra of 6.00 RB nanoparticles exposed to Demeton-S, diisopropyl fluorophosphates, and bis(2-chloroethyl)sulfide for 30 min with data collection every 10 min and with an excitation wavelength of about 485 nm.
FIGS. 21A-21C are spectra of 1.00 RB against Demeton-S, diisopropyl fluorophosphates, and bis(2-chloroethyl)sulfide, respectively.
FIGS. 22A-22C are spectra of 2.00 RB against Demeton-S, diisopropyl fluorophosphates, and bis(2-chloroethyl)sulfide, respectively.
FIGS. 23A-23C are spectra of 3.00 RB against Demeton-S, diisopropyl fluorophosphates, and bis(2-chloroethyl)sulfide, respectively.
FIGS. 24A-24C are spectra of 4.00 RB against Demeton-S, diisopropyl fluorophosphates, and bis(2-chloroethyl)sulfide, respectively.
FIGS. 25A-25C are spectra of 6.00 RB against Demeton-S, diisopropyl fluorophosphates, and bis(2-chloroethyl)sulfide, respectively.
FIGS. 26A-26C are spectra of 3.00 RB, 4.00 RB, and 6.00 RB, respectively, in a 1:2 dilution with Demeton-S.
FIGS. 27A-27C are spectra of 3.00 RB, 4.00 RB, and 6.00 RB, respectively, in a 1:5 dilution with Demeton-S.
FIGS. 28A-28C are spectra of 3.00 RB, 4.00 RB, and 6.00 RB, respectively, in a 1:10 dilution with Demeton-S.
FIGS. 29-29C are spectra of 2.00 RB, 4.00 RB, and 6.00 RB, respectively, in a 1:20 dilution with diisopropyl fluorophosphates.
FIGS. 30A-30C are spectra of 3.00 RB, 4.00 RB, and 6.00 RB, respectively, in a 1:30 dilution with diisopropyl fluorophosphates.
FIGS. 31A-31C are spectra of 3.00 RB, 4.00 RB, and 6.00 RB, respectively, in a 1:10 dilution with diisopropyl fluorophosphates.
FIGS. 32A-32C are spectra of 3.00 RB, 4.00 RB, and 6.00 RB, respectively, in a 1:20 dilution with bis(2-chloroethyl)sulfide.
FIGS. 33A-33C are spectra of 3.00 RB, 4.00 RB, and 6.00 RB, respectively, in a 1:40 dilution with bis(2-chloroethyl)sulfide.
FIGS. 34A-34C are spectra of 3.00 RB, 4.00 RB, and 6.00 RB, respectively, in a 1:60 dilution with bis(2-chloroethyl)sulfide.
FIGS. 35A-35C are spectra of 3.00 RB, 4.00 RB, and 6.00 RB, respectively, in a 1:40 dilution with bis(2-chloroethyl)sulfide.
FIGS. 36A-36C are spectra of 3.00 RB, 4.00 RB, and 6.00 RB, respectively, in a 1:160 dilution with bis(2-chloroethyl)sulfide.
It should be understood that the appended drawings are not necessarily to scale, presenting a somewhat simplified representation of various features illustrative of the basic principles of the invention. The specific design features of the sequence of operations as disclosed herein, including, for example, specific dimensions, orientations, locations, and shapes of various illustrated components, will be determined in part by the particular intended application and use environment. Certain features of the illustrated embodiments have been enlarged or distorted relative to others to facilitate visualization and clear understanding. In particular, thin features may be thickened, for example, for clarity or illustration.
DETAILED DESCRIPTION OF THE INVENTION
Turning now to the figures, and in particular to FIGS. 1A and 1B, two isomer forms of Rose Bengal (“RB”), a simple fluorescein analog, are shown. RB is generally non-toxic, relatively inexpensive, commercially-available, and FDA approved for, primarily medical, applications. RB further possesses unique chemical properties, described in greater detail below, that neutralize some contaminants, such as chemical warfare agent simulants and pesticides, (collectively referred to as “contaminants”) while providing a mechanism (such as absorption/color change and fluorescent emission characteristics) by which the presence of contaminants may be detected and decomposition of the contamination may be monitored. Moreover, RB shows strong dependence of absorption and fluorescence spectra on pH such that spectra intensity decreases with a drop in pH.
RB provides excellent fluorescence and absorbance (colorimetric) response to contaminants and, in the presence of light, effectively and efficiently decomposes the contaminants through a photocatalytic oxidation mechanism. In particular, the RB molecule consists of a benzene moiety, a xanthene moiety, and substituents that determine the photochemical and physical properties. One derivative has the substituent R═NH(C2H5)3 attached to a negatively charged oxygen as well as to a carboxylic group to form a salt, which is referred to as a quinoid form (“q”) of RB and is shown in FIG. 1A. While not wishing to be bound by theory, when q-RB is exposed to acidic environments, as provided by most contaminants (including, chemical warfare agent simulants, pesticides, and many toxic industrial chemicals), q-RB undergoes a conformational change from the quinoid form to a lactone form (“l”), which is shown in FIG. 1B. When l-RB is exposed to alkaline conditions, the conformational change reverses to q-RB.
The conformational change between the isomer forms of FIGS. 1A and 1B is accompanied by a visual, colorimetric change, wherein l-RB is visually colorless and q-RB is visually perceived as bright pink.
Both forms of RB are also known photocatalyst and, in the presence of visible light (absorption spectrum is shown in FIG. 2), converts ambient triplet state oxygen to the more active and oxidative singlet state, which is a known decontaminant for a number of contaminants.
With reference now to FIG. 4, and in use in accordance with an embodiment of the present invention, RB may be applied to a substrate or asset (Block 100) after or before exposing the substrate or asset to at least one contaminant in order to detect the contaminant, and to monitor its decomposition ( Blocks 102, 104, respectively). The exposure need not be intentional.
RB may be applied neat, such as an additive to aqueous- or solvent-based systems and for application to contaminated substrate or asset. According to another embodiment, RB may be cross-linked into fabrics, polymers, or coatings at least partially comprising the substrate or asset and via established crosslinking methods for contamination detection and self-decontamination. In still other embodiments, RB may be cross-linked into nanoparticles for industrial or remediation applications. Suitable cross-linking methods and mechanisms are known by the skilled artisan and may include, for example, thermal attachments, microwave attachment, physical adsorption, polymeric attachment, or cross-linking agents (such as acrylates, silanes, epoxides, vinyl groups, and so forth). Cross-linking to nanoparticles may alternatively be accomplished according to the methods taught in U.S. Provisional Application No. 61/829,557, filed May 31, 2013, and entitled CONTROLLED MICROWAVE ASSISTED-SYNTHESIS OF FUNCTIONALIZED SILICA NANOPARTICLES; International Application No. PCT/GB2014/051644, filed 29 May 2014, and entitled CONTROLLED MICROWAVE ASSISTED SYNTHESIS OF FUNCTIONALIZED SILICA NANOPARTICLES; and U.S. Non-Provisional application Ser. No. 14/290,336, filed 29 May 2014, and entitled CONTROLLED MICROWAVE ASSISTED SYNTHESIS OF FUNCTIONALIZED SILICA NANOPARTICLES. The disclosure of each application is incorporated herein by reference, in its entirety. Due to its high solubility in water, RB may alternatively be bind to a porous surface of the nanoparticle though functionalization, encapsulation, or trapping dye molecules. Functionalization or trapping may prevent dilution of dye molecules in water or water-based solutions and subsequent escape of the molecules from the surface upon removal of water.
According to yet other embodiments, RB may be directly integrated into a coating or into fluids to provide chemical warfare agent simulant detection, decontamination, and decontamination assurance sprays.
In Block 106, the contaminated substrate or asset may then be exposed to radiation having a wavelength ranging from 400 nm to 700 nm for detection of at least contaminant. For purposes of decontamination, exposure to light may continue, while monitoring a fluorescent signature, absorbance signature, or both, of the substrate or asset under exposure to radiation (“Yes” branch of Decision Block 108). Otherwise, if monitoring for detection, contamination, or both is complete (“No” branch of Decision Block 108), then exposing the substrate or asset to radiation may be terminated (Block 110) and the process ends.
Use of RB may also include, according to some embodiments of the present invention, additional dyes for additional, enhanced, or alternative detections.
The following examples illustrate particular properties and advantages of some of the embodiments of the present invention. Furthermore, these are examples of reduction to practice of the present invention and confirmation that the principles described in the present invention are therefore valid but should not be construed as in any way limiting the scope of the invention.
Example 1
RB was purchased in its pure form (Pfaltz & Bauer, Waterbury, Conn.) and added in 0.5 wt. %, 1.0 wt. %, 2.0 wt. %, and 5.0 wt. % loadings to commercially-available, MIL-PRF-85285 compliant, aerospace coatings (obtained from PPG Industries, Irvine, Calif.) and tested against chemical warfare agent simulants under simulated light and dark conditions.
As shown in FIG. 3, all compositions containing RB demonstrated high levels of agent and simulant decomposition. In FIG. 5, changes in a percent concentration of DEM resulting from light and dark conditions are shown as bar graphs for each coating tested.
Example 2
The coatings of Example 1 were subjected to 4 g/m2 Demeton-S (“DEM”) for 24 hr in complete darkness, simulated indirect sun, and simulated direct sun conditions.
FIG. 6 illustrates a RB-based photocatalytic oxidation mechanism of Demeton-S 112 into an elimination product and while FIGS. 7A-7C are graphical representations of data obtained when coatings having RB as described above and exposed to DEM are irradiated at 10,000 LUX, 4,000 LUX, and Dark conditions, respectively. Each graph illustrates a relative percentage of unreacted Demeton-S (“% DEM”), the elimination product (“% ELIM”), and the neutralized Demeton-S Sulfone (“% SULF”).
FIGS. 8A-8F are graphical representations of chromatographs of the 24 hr residence time photoactivity versus Demeton-S. The internal standard, tetralin, is the predominate peak appearing at about 3.85 hr. More particularly, FIG. 8A is a graphical representation of the chromatograph of 1.0 wt. % RB photocatalytic oxidation of DEM in MIL-PRF-85285 paint (obtained from PPG Industries) under dark conditions; FIG. 8B a graphical representation of the chromatograph of 1.0 wt. % RB photocatalytic oxidation of DEM in MIL-PRF-85285 under indirect light (4,000 LUX) conditions; and FIG. 8C a graphical representation of the chromatograph of 1.0 wt. % RB photocatalytic oxidation of DEM in MIL-PRF-85285 under direct light (10,000 LUX) conditions.
FIGS. 8D-8F are similar to FIGS. 8A-8C, but demonstrate synergistic effects of 0.5 wt. % RB with 0.5 wt. % 1,2-benzisothiaole-3(2H)-one (“BIT”).
Example 3
RB was cross-linked into silica nanoparticles fabricated in accordance with the methods described in U.S. Provisional Application No. 61/829,557; International Application No. PCT/GB2014/051644; U.S. Non-Provisional application Ser. No. 14/290,336, which are discussed above. One particular method is described in detail below. Subsequently, the RB-cross-linked silica nanoparticles were cross-linked onto cotton fibers using microwave assisted synthesis methods. RB was also combined with at least one secondary dye, Rhodamine 560 (“R560”), Rhodamine 640 (“R640”), or both, which were also cross-linked into silica nanoparticles and cotton fibers employing similar methods. The silica nanoparticles were tested using absorbance and fluorescent spectra in the presence of each of three chemical agent simulants: Demeton-S, diisopropyl fluorophosphates (“DFP”), and bis(2-chloroethyl)sulfide (“Mustard,” or otherwise known to those skilled in the art as “sulfur mustard”).
According to one example, 0.7 mL of H2O is mixed with 1 mL of HCl and 1 mL of tetraethyl orthosilicate (“TEOS”). The solution was mixed for 30 sec. X mg (0.25 mg to 0.75 mg) of R560, 1.00 mg of RB, and Z mg (1.00 mg to 3.00 mg) of R640 were added to 40 mL of acetone and mixed. 0.35 mL of the hydrolyzed TEOS solution were added to the dye solution and mixed for 30 sec. 5 mL of the final solution were placed in a 10 mL CEM vial and subjected to microwave field (300 W) until the surface of the vial has reached 125° C., which was then maintained for 60 sec.
Diameters of resultant particles ranged from about 200 nm to about 300 nm, as measured by a scanning electron microscope (“SEM”) (S-2600N, Hitachi, Ltd., Tokyo, Japan) and dynamic light scattering (“DLS”) (Nano-ZS90, Malvern Instruments Ltd., Worcestershire, UK). An exemplary SEM image of the resultant nanoparticles is shown in FIG. 9.
Example 4
A 100 μL suspension of nanoparticles formed according to the method described in Example 3 was injected into each well of a 96-well plate and mixed with 200 μL of water. 1 μL of a contaminant (either Demeton-S or DFP) was carefully placed on top of the suspension surface without mixing. Time dependent spectra were collected using a plate reader (BioTek Synergy™ 4 Hybrid Microplate Reader (BioTek Instruments, Inc., Winooski, Vt.)) using 2 excitation wavelengths: 450 nm and 485 nm. Each run was 50 min long with 10 min time intervals between measurements. Each plot was normalized with respect to a corresponding reference sample.
0.25 R560+1.00 RB+3.00 R640:
FIGS. 10A-10F are spectra from a sample comprising 0.25 R560+1.00 RB+3.00 R640 nanoparticles and exposed to Demeton-S, DFP, and Mustard for 50 min with data collection every 10 min. FIGS. 10A and 10B illustrate results versus Demeton-S at 450 nm and 485 nm, respectively; FIGS. 10C and 10D illustrate results versus DFP at 450 nm and 485 nm, respectively; and FIGS. 10E and 10F illustrate results versus Mustard at 450 nm and 485 nm, respectively. These data demonstrate that the nanoparticles respond to the presence of simulants for both excitation wavelengths. The spectra produced by excitation at 485 nm shows similar response to each of the three simulants with stabilization time at about 20 min.
0.50 R560+1.00 RB+3.00 R640:
FIGS. 11A-11F are spectra of a sample comprising 0.50 R560+1.00 RB+3.00 R640 nanoparticles and exposed to Demeton-S, DFP, and Mustard for 50 min with data collection every 10 min. FIGS. 11A and 11B illustrate results versus Demeton-S at 450 nm and 485 nm, respectively; FIGS. 11C and 11D illustrate results versus DFP at 450 nm and 485 nm, respectively; and FIGS. 11E and 11F illustrate results versus Mustard at 450 nm and 485 nm, respectively. The 0.50 R560+RB+3 R640 nanoparticles show responses (FIGS. 11A-11F) similar the responses of the 0.25 R560+1.00 RB+3.00 R640 nanoparticles (FIG. 10A-10F); however, the change in fluorescent spectra is not as dramatic exhibiting equilibration time closer to 10 min rather than 20 min as in the case of the 0.25 R560+1.00 RB+3.00 R640 nanoparticles.
0.75 R560+1.00 RB+3.00 R640:
FIGS. 12A-12F are spectra of a sample comprising 0.75 R560+1.00 RB+3.00 R640 nanoparticles and exposed to Demeton-S, DFP, and Mustard for 50 min with data collection every 10 min. FIGS. 12A and 12B illustrate results versus Demeton-S at 450 nm and 485 nm, respectively; FIGS. 12C and 12D illustrate results versus DFP at 450 nm and 485 nm, respectively; and FIGS. 12E and 12F illustrate results versus Mustard at 450 nm and 485 nm, respectively. The 0.75 R560+1.00 RB+3.00 R640 nanoparticles show even less dramatic change in fluorescence spectra with exception of Mustard. The 0.75 R560+1.00 RB+3.00 R640 nanoparticles response time was under 10 min with dramatic change in intensity of the spectra.
1.00 R560+1.00 RB+1.00 R640:
FIGS. 13A-13F are spectra of a sample comprising 1.00 R560+1.00 RB+1.00 R640 nanoparticles and exposed to Demeton S, DFP, and Mustard for 50 min with data collection every 10 min. FIGS. 13A and 13B illustrate results versus Demeton-S at 450 nm and 485 nm, respectively; FIGS. 13C and 13D illustrate results versus DFP at 450 nm and 485 nm, respectively; and FIGS. 13E and 13F illustrate results versus Mustard at 450 nm and 485 nm, respectively. The R560+RB+R640 nanoparticles show good response for DFP regardless of the excitation wavelength; however, a response to Mustard takes under 20 min with 450 nm exposure and 50 min with 485 nm exposure.
1.00 R560+1.00 RB+2.00 R640:
FIGS. 14A-14F are spectra of a sample comprising 1.00 R560+1.00 RB+2.00 R640 nanoparticles and exposed to Demeton-S, DFP, and Mustard for 50 min with data collection every 10 min. FIGS. 14A and 14B illustrate results versus Demeton-S at 450 nm and 485 nm, respectively; FIGS. 14C and 14D illustrate results versus DFP at 450 nm and 485 nm, respectively; and FIGS. 14E and 14F illustrate results versus Mustard at 450 nm and 485 nm, respectively.
1.00 R560+1.00 RB+3.00 R640:
FIGS. 15A-15F are spectra of 1.00 R560+1.00 RB+3.00 R640 nanoparticles and exposed to Demeton-S, DFP, and Mustard for 50 min with data collection every 10 min. FIGS. 15A and 15B illustrate results versus Demeton-S at 450 nm and 485 nm, respectively; FIGS. 15C and 135 illustrate results versus DFP at 450 nm and 485 nm, respectively; and FIGS. 15E and 15F illustrate results versus Mustard at 450 nm and 485 nm, respectively. The 1.00 R560+1.00 RB+3.00 R640 nanoparticles show significant response if excited at 485 nm for all three simulants, exhibiting stabilization times under 10 min.
Example 5
1.00 RB
FIGS. 16A-16C are spectra of a sample comprising 1.00 RB nanoparticles exposed to Demeton-S, DFP, and Mustard, respectively, for 30 min with data collection every 10 min and with an excitation wavelength of about 485 nm. The single dye nanoparticles were exposed only to 485 nm excitation wavelength due to very weak light absorption at 450 nm. The 1.00 RB nanoparticles demonstrated a response to DFP (FIG. 16B) and Mustard (FIG. 16C) with stabilization times ranging from 10 min to 20 min respectively. Demeton-S (FIG. 16A) caused an initial rise in the spectrum upon addition of the chemical warfare agent simulant, followed by a decrease of the intensity to below the reference line.
2.00 RB:
FIGS. 17A-17C are spectra of a sample comprising 2.00 RB nanoparticles exposed to Demeton-S, DFP, and Mustard, respectively for 30 min with data collection every 10 min and with an excitation wavelength of about 485 nm. The 2.00 RB nanoparticles demonstrate an “oscillating” behavior of the spectra, with an initial increase above reference line followed by a drop below the reference line.
3.00 RB:
FIGS. 18A-18C are spectra of a sample comprising 3.00 RB nanoparticles exposed to Demeton-S, DFP, and Mustard for 30 min with data collection every 10 min and with an excitation wavelength of about 485 nm. The 3.00 RB nanoparticles were very responsive to Demeton-S (FIG. 18A) and DFP (FIG. 18B) while the 3.00 RB nanoparticles with Mustard (FIG. 18C) had spectra coinciding with reference spectra after 30 min. The presence of DFP caused the fluorescence peak to split.
4.00 RB:
FIGS. 19A-19C are spectra of a sample comprising 4.00 RB nanoparticles exposed to Demeton-S, DFP, and Mustard for 30 min with data collection every 10 min and with an excitation wavelength of about 485 nm. The 4.00 RB nanoparticles were very responsive to Demeton-S (FIG. 19A) and DFP (FIG. 19B) while the 4.00 RB nanoparticles with Mustard (FIG. 19C) had spectra coinciding with reference spectra after 30 min. The presence of DFP caused the fluorescence peak to split.
6.00 RB:
FIGS. 20A-20C are spectra of a sample comprising 6.00 RB nanoparticles exposed to Demeton-S, DFP, and Mustard for 30 min with data collection every 10 min and with an excitation wavelength of about 485 nm. The 6.00 RB nanoparticles were very responsive to Demeton-S (FIG. 20A) and DFP (FIG. 20B) while the 6.00 RB nanoparticles with Mustard (FIG. 20C) had spectra coinciding with reference spectra after 30 min. The presence of any of one of the chemical warfare agent simulants caused the fluorescence peak to split.
Example 6
X RB
FIGS. 21A-25C demonstrate a high response with fast stabilization time of under 10 min (except for Demeton-S) for X RB nanoparticles, wherein X ranges from 1.00 to 6.00.
FIGS. 21A-21C are spectra of 1.00 RB against Demeton-S, DFP, and Mustard, respectively.
FIGS. 22A-22C are spectra of 2.00 RB against Demeton-S, DFP, and Mustard, respectively.
FIGS. 23A-23C are spectra of 3.00 RB against Demeton-S, DFP, and Mustard, respectively.
FIGS. 24A-24C are spectra of 4.00 RB against Demeton-S, DFP, and Mustard, respectively.
FIGS. 25A-25C are spectra of 6.00 RB against Demeton-S, DFP, and Mustard, respectively.
All samples responded to the presence of simulants and have fast stabilization time under 10 min.
Example 7
X RB Dilutions
FIGS. 26A-36C demonstrate the response of RB versus various dilutions with each chemical warfare agent simulant, wherein X ranges from 3.00 to 6.00.
100 μL aliquots of samples each comprising one of 3.00 RB nanoparticles, 4.00 RB nanoparticles, and 6.00 RB nanoparticles were mixed with 200 μL of water and either 0.5 μL or 0.25 μL (i.e., 1-to-2 and 1-to-5 dilutions, respectively) of Demeton-S. FIGS. 26A-26C are spectra of 3.00 RB, 4.00 RB, and 6.00 RB, respectively, in a 1:2 dilution with Demeton-S; FIGS. 27A-27C are spectra of 3.00 RB, 4.00 RB, and 6.00 RB, respectively, in a 1:5 dilution with Demeton-S; and FIGS. 28A-28C are spectra of 3.00 RB, 4.00 RB, and 6.00 RB, respectively, in a 1:10 dilution with DFP. A detection limit of 0.5 μL per 300 μL (100 μL of each sample with 200 μL of water) was determined.
100 μL of samples each comprising one of 2.00 RB nanoparticles, 3.00 RB nanoparticles, 4.00 RB nanoparticles, and 6.00 RB nanoparticles were mixed with 200 μL of water and 0.1 μL, 0.05 μL, or 0.03 μL of DFP. FIGS. 29A-29C are spectra of 2.00 RB, 4.00 RB, and 6.00 RB, respectively, in a 1:20 dilution with DFP; FIGS. 30A-30C are spectra of 3.00 RB, 4.00 RB, and 6.00 RB, respectively, in a 1:30 dilution with DFP; and FIGS. 31A-31C are spectra of 3.00 RB, 4.00 RB, and 6.00 RB, respectively, in a 1:10 dilution with DFP.
100 μL of samples each comprising one of 3.00 mg RB nanoparticles, 4.00 mg RB nanoparticles, and 6.00 mg of RB nanoparticles sample were mixed with 200 μL of water and 0.1 μL, 0.05 μL, or 0.03 μL of Mustard. FIGS. 32A-32C are spectra of 3.00 RB, 4.00 RB, and 6.00 RB, respectively, in a 1:20 dilution with Mustard; FIGS. 33A-33C are spectra of 3.00 RB, 4.00 RB, and 6.00 RB, respectively, in a 1:40 dilution with Mustard; FIGS. 34A-34C are spectra of 3.00 RB, 4.00 RB, and 6.00 RB, respectively, in a 1:60 dilution with Mustard; FIGS. 35A-35C are spectra of 3.00 RB, 4.00 RB, and 6.00 RB, respectively, in a 1:40 dilution with Mustard; and FIGS. 36A-36C are spectra of 3.00 RB, 4.00 RB, and 6.00 RB, respectively, in a 1:160 dilution with Mustard. A detection limit as low as 0.006 μL per 300 μL (100 μL of sample with 200 μL of water) for Mustard was determined.
While the present invention has been illustrated by a description of one or more embodiments thereof and while these embodiments have been described in considerable detail, they are not intended to restrict or in any way limit the scope of the appended claims to such detail. Additional advantages and modifications will readily appear to those skilled in the art. The invention in its broader aspects is therefore not limited to the specific details, representative apparatus and method, and illustrative examples shown and described. Accordingly, departures may be made from such details without departing from the scope of the general inventive concept.