US9488578B2 - Single particle detection device, single particle detection method, and computer program for single particle detection, using optical analysis - Google Patents
Single particle detection device, single particle detection method, and computer program for single particle detection, using optical analysis Download PDFInfo
- Publication number
- US9488578B2 US9488578B2 US14/162,142 US201414162142A US9488578B2 US 9488578 B2 US9488578 B2 US 9488578B2 US 201414162142 A US201414162142 A US 201414162142A US 9488578 B2 US9488578 B2 US 9488578B2
- Authority
- US
- United States
- Prior art keywords
- light
- detection region
- single particle
- light detection
- particle
- Prior art date
- Legal status (The legal status is an assumption and is not a legal conclusion. Google has not performed a legal analysis and makes no representation as to the accuracy of the status listed.)
- Active
Links
Images


Classifications
-
- G—PHYSICS
- G01—MEASURING; TESTING
- G01N—INVESTIGATING OR ANALYSING MATERIALS BY DETERMINING THEIR CHEMICAL OR PHYSICAL PROPERTIES
- G01N21/00—Investigating or analysing materials by the use of optical means, i.e. using sub-millimetre waves, infrared, visible or ultraviolet light
- G01N21/62—Systems in which the material investigated is excited whereby it emits light or causes a change in wavelength of the incident light
- G01N21/63—Systems in which the material investigated is excited whereby it emits light or causes a change in wavelength of the incident light optically excited
- G01N21/64—Fluorescence; Phosphorescence
-
- G—PHYSICS
- G01—MEASURING; TESTING
- G01N—INVESTIGATING OR ANALYSING MATERIALS BY DETERMINING THEIR CHEMICAL OR PHYSICAL PROPERTIES
- G01N15/00—Investigating characteristics of particles; Investigating permeability, pore-volume, or surface-area of porous materials
- G01N15/10—Investigating individual particles
- G01N15/14—Electro-optical investigation, e.g. flow cytometers
- G01N15/1429—Electro-optical investigation, e.g. flow cytometers using an analyser being characterised by its signal processing
-
- G—PHYSICS
- G01—MEASURING; TESTING
- G01N—INVESTIGATING OR ANALYSING MATERIALS BY DETERMINING THEIR CHEMICAL OR PHYSICAL PROPERTIES
- G01N15/00—Investigating characteristics of particles; Investigating permeability, pore-volume, or surface-area of porous materials
- G01N15/10—Investigating individual particles
- G01N15/14—Electro-optical investigation, e.g. flow cytometers
- G01N15/1434—Electro-optical investigation, e.g. flow cytometers using an analyser being characterised by its optical arrangement
-
- G—PHYSICS
- G01—MEASURING; TESTING
- G01N—INVESTIGATING OR ANALYSING MATERIALS BY DETERMINING THEIR CHEMICAL OR PHYSICAL PROPERTIES
- G01N21/00—Investigating or analysing materials by the use of optical means, i.e. using sub-millimetre waves, infrared, visible or ultraviolet light
- G01N21/17—Systems in which incident light is modified in accordance with the properties of the material investigated
- G01N21/47—Scattering, i.e. diffuse reflection
- G01N21/49—Scattering, i.e. diffuse reflection within a body or fluid
- G01N21/51—Scattering, i.e. diffuse reflection within a body or fluid inside a container, e.g. in an ampoule
-
- G—PHYSICS
- G01—MEASURING; TESTING
- G01N—INVESTIGATING OR ANALYSING MATERIALS BY DETERMINING THEIR CHEMICAL OR PHYSICAL PROPERTIES
- G01N21/00—Investigating or analysing materials by the use of optical means, i.e. using sub-millimetre waves, infrared, visible or ultraviolet light
- G01N21/62—Systems in which the material investigated is excited whereby it emits light or causes a change in wavelength of the incident light
- G01N21/63—Systems in which the material investigated is excited whereby it emits light or causes a change in wavelength of the incident light optically excited
- G01N21/64—Fluorescence; Phosphorescence
- G01N21/6408—Fluorescence; Phosphorescence with measurement of decay time, time resolved fluorescence
-
- G—PHYSICS
- G01—MEASURING; TESTING
- G01N—INVESTIGATING OR ANALYSING MATERIALS BY DETERMINING THEIR CHEMICAL OR PHYSICAL PROPERTIES
- G01N21/00—Investigating or analysing materials by the use of optical means, i.e. using sub-millimetre waves, infrared, visible or ultraviolet light
- G01N21/62—Systems in which the material investigated is excited whereby it emits light or causes a change in wavelength of the incident light
- G01N21/63—Systems in which the material investigated is excited whereby it emits light or causes a change in wavelength of the incident light optically excited
- G01N21/64—Fluorescence; Phosphorescence
- G01N21/645—Specially adapted constructive features of fluorimeters
- G01N21/6452—Individual samples arranged in a regular 2D-array, e.g. multiwell plates
-
- G—PHYSICS
- G01—MEASURING; TESTING
- G01N—INVESTIGATING OR ANALYSING MATERIALS BY DETERMINING THEIR CHEMICAL OR PHYSICAL PROPERTIES
- G01N21/00—Investigating or analysing materials by the use of optical means, i.e. using sub-millimetre waves, infrared, visible or ultraviolet light
- G01N21/62—Systems in which the material investigated is excited whereby it emits light or causes a change in wavelength of the incident light
- G01N21/63—Systems in which the material investigated is excited whereby it emits light or causes a change in wavelength of the incident light optically excited
- G01N21/64—Fluorescence; Phosphorescence
- G01N21/645—Specially adapted constructive features of fluorimeters
- G01N21/6456—Spatial resolved fluorescence measurements; Imaging
- G01N21/6458—Fluorescence microscopy
-
- G—PHYSICS
- G02—OPTICS
- G02B—OPTICAL ELEMENTS, SYSTEMS OR APPARATUS
- G02B21/00—Microscopes
- G02B21/0004—Microscopes specially adapted for specific applications
- G02B21/002—Scanning microscopes
- G02B21/0024—Confocal scanning microscopes (CSOMs) or confocal "macroscopes"; Accessories which are not restricted to use with CSOMs, e.g. sample holders
- G02B21/0032—Optical details of illumination, e.g. light-sources, pinholes, beam splitters, slits, fibers
-
- G—PHYSICS
- G02—OPTICS
- G02B—OPTICAL ELEMENTS, SYSTEMS OR APPARATUS
- G02B21/00—Microscopes
- G02B21/0004—Microscopes specially adapted for specific applications
- G02B21/002—Scanning microscopes
- G02B21/0024—Confocal scanning microscopes (CSOMs) or confocal "macroscopes"; Accessories which are not restricted to use with CSOMs, e.g. sample holders
- G02B21/0052—Optical details of the image generation
- G02B21/0076—Optical details of the image generation arrangements using fluorescence or luminescence
-
- G—PHYSICS
- G02—OPTICS
- G02B—OPTICAL ELEMENTS, SYSTEMS OR APPARATUS
- G02B21/00—Microscopes
- G02B21/0004—Microscopes specially adapted for specific applications
- G02B21/002—Scanning microscopes
- G02B21/0024—Confocal scanning microscopes (CSOMs) or confocal "macroscopes"; Accessories which are not restricted to use with CSOMs, e.g. sample holders
- G02B21/008—Details of detection or image processing, including general computer control
Definitions
- This invention relates to a single particle detection technique capable of detecting a particulate object, e.g. an atom, a molecule or an aggregate thereof (Hereafter, these are called a “particle”.), such as a biological molecule, for example, protein, peptide, nucleic acid, lipid, sugar chain, amino acid or these aggregate, virus and cell, etc., or a non-biological particle, dispersed or dissolved in a solution, by using an optical system, such as the optical system of a confocal microscope or a multiphoton microscope, which can detect light from a micro region in a solution, to acquire useful information in an analysis of conditions (interaction, binding or dissociating condition, etc.) of particles, and more specifically, relates to a single particle detection device, a single particle detection method and a computer program for single particle detection, measuring with an optical system as described above a light intensity change because of an existence of a single particle to detect a single particle, and thereby enabling various analyses.
- patent documents 1-3 and non-patent documents 1-3 by means of the optical system of a laser confocal microscope and a photon counting technique, there is performed the measurement of fluorescence intensity of fluorescent molecules or fluorescently labeled molecules (fluorescent molecules, etc.), entering into and exiting out of a micro region (the focal region to which the laser light of the microscope is condensed, called a “confocal volume”) in a sample solution, and based on the average dwell time (translational diffusion time) of the fluorescent molecules, etc.
- a micro region the focal region to which the laser light of the microscope is condensed
- patent document 5 there is generated a histogram of fluorescence intensity of fluorescent molecules, etc., entering into and exiting out of a confocal volume, measured similarly to FCS; and the average value of the characteristic brightness of the fluorescent molecules, etc. and the average number of molecules dwelling in the confocal volume are calculated by fitting a statistical model formula to the distribution of the histogram, so that, based on the information thereof, the structure or size changes, binding or dissociative conditions or dispersion and aggregation conditions of molecules can be estimated.
- patent documents 6 and 7 there are proposed methods of detecting fluorescent substances based on a time progress of fluorescence signals of a sample solution measured using the optical system of a confocal microscope.
- Patent document 8 has proposed a signal calculation processing technique for measuring faint light from fluorescent fine particles flowing through a flow cytometer or fluorescent fine particles fixed on a substrate by a photon counting technique to detect the existences of the fluorescent fine particles in the flow or on the substrate.
- patent documents 9 has disclosed, as one manner of FCS, a method, wherein, in a system of a solution which contains a lot of dissolved light-emitting substances so that the entry of a non-light-emitting particle, dispersed in the solution, into a confocal volume will cause the reduction of detected light intensity, the translational diffusion time in the confocal volume and the average of dwelling particle counts of non-light-emitting particles are computed through computation of the autocorrelation function value of the fluorescence intensity (inverted FCS(iFCS)).
- a sample amount required for the measurement may be extremely small (an amount used in one measurement is at most several tens of ⁇ L), and its concentration is extremely low as compared with the prior art, and the measuring time is also shortened extremely (In one measurement, a measuring process for time of order of seconds is repeated several times.).
- those techniques are expected to be a strong tool enabling an experiment or a test at low cost and/or quickly in comparison with conventional biochemical methods, especially in conducting an analysis of a rare or expensive sample often used in the field of the medical or biological research and development or in conducting tests of a large number of specimens, such as sick clinical diagnosis or the screening of bioactive substances.
- the concentration or number density of a single particle to be an observation object in the sample solution should be at such a level that single particles of the number enabling a statistical process will enter in and exit from a micro region in one measuring term of a length of order of seconds in an equilibrium, preferably at such a level that about one single particle will be always present in the micro region.
- the concentration of a single particle in a sample solution used in the above-mentioned optical analysis technique is typically at the level of 1 nM or more, and at much less than 1 nM, there is produced a term in which no single particles are present in the confocal volume so that no statistically significant analysis result will be obtained.
- the detection methods of single particles described in patent documents 6-8 no statistical computation processes of fluorescence intensity fluctuation are included so that a single particle even at less than 1 nM in a sample solution can be detected, but, it has not been achieved to compute quantitatively the concentration or number density of a single particle moving at random in a solution.
- Applicant of the present application has proposed an optical analysis technique based on a new principle which makes it possible to observe quantitatively a condition or characteristic of a particle emitting light to be an observation object (light-emitting particle) in a sample solution where the concentration or number density of the light-emitting particle is lower than the level at which the analysis techniques including statistical procedures, such as FCS and FIDA, etc. are used.
- an optical system which can detect light from a micro region in a solution, such as an optical system of a confocal microscope or a multiphoton microscope, similarly to FCS, FIDA, etc., and additionally, the position of the micro region, i.e.
- the detection region of light (called “light detection region” in the following) is moved in the sample solution, namely, the inside of the sample solution is scanned with the light detection region, and when the light detection region encompasses a light-emitting particle, dispersed and moving at random in the sample solution, the light emitted from the light-emitting particle is detected, and thereby each of the light-emitting particles in the sample solution is detected individually so that it becomes possible to perform the counting of light-emitting particles and the acquisition of the information about the concentration or number density of the light-emitting particle in the sample solution.
- a sample amount necessary for measurement may be small (for example, about several 10 ⁇ L) and the measuring time is short similarly to optical analysis techniques, such as FCS and FIDA, but also, it becomes possible to detect the presence of a light-emitting particle and to quantitatively detect its characteristic, such as a concentration, a number density, etc., at a lower concentration or number density, as compared with the case of optical analysis techniques, such as FCS and FIDA.
- the scanning molecule counting method which detects individually the light of a single particle emitting light as described above, since the light from a single particle is weak, it is liable to be affected by the influence of stray light or Raman scattering light of water. Accordingly, in the case of the analytical way of identifying an increase of the light intensity value indicating the light emitted from a light-emitting particle as a signal of the light-emitting particle, it is possible that the light owing to stray light or Raman scattering light of water is erroneously identified as a signal of a light-emitting particle.
- the particle to be an observation object is limited to a light-emitting particle.
- a light emitting label a fluorescent indicator, a phosphorescent indicator, etc.
- the main object of the present invention is to provide a scanning molecule counting method which is not liable to be affected by influences of stray light or Raman scattering light of water and enables the observation of a particle which does not emit light, namely, a single particle detection technique according to a new principle which makes it possible to detect individually a single particle which does not emit light in a sample solution and to observe the condition or characteristic of the particle quantitatively.
- a single particle detection device which detects light from a single particle dispersed and moving at random in a sample solution using an optical system of a confocal microscope or a multiphoton microscope, comprising: a light detection region mover which moves a position of a light detection region of the optical system of the microscope in the sample solution; a light detector which detects light from the light detection region; and a signal processor which generates time series light intensity data of the light from the light detection region detected with the light detector with moving the position of the light detection region in the sample solution and detects a signal indicating the existence of each single particle individually in the time series light intensity data; wherein the light from the light detection region includes substantially constant background light; and the signal indicating an existence of each single particle is a reduction of the light intensity detected with the light detector, which reduction occurs when the single particle enters into the light detection region.
- a single particle particle dispersed and moving at random in a sample solution may be a single particle, such as an atom, a molecule or an aggregate of these, which is dispersed or dissolved in a sample solution, and it may be an arbitrary particulate matter making the Brownian motion freely in a solution without being fixed on a substrate, etc.
- the single particle to be an object to be observed in the present invention may be a particle which significantly reduces the light amount from the light detection region when the particle exists in the light detection region, and thus, basically it is a single particle which does not emit light, but, it should be understood that it may be a particle whose emitting light intensity is lower than the background light in the detected light wavelength band.
- the “light detection region” of the optical system of the confocal microscope or multiphoton microscope is the micro region where light is detected in those microscopes, which region corresponds to the region to which illumination light is condensed when the illumination light is given from an objective (Especially in the confocal microscope, this region is determined in accordance with the spatial relationship of an objective and a pinhole.).
- a signal of a single particle means “a signal indicating the existence of a single particle” unless noted otherwise.
- the detection of light is sequentially performed with moving the position of the light detection region in the sample solution, i.e., with scanning the inside of the sample solution with the light detection region.
- the light intensity or the light amount of the background light which reaches from the light detection region to the light detector is reduced because of the existence of the single particle.
- such a reduction of the light intensity or light amount of the background light is individually detected as a signal of a single particle in the sequentially detected light, and thereby, the existences of particles is sequentially and individually detected, so that diverse information on the conditions of particles in the solution will be acquired. That is, in the inventive device, a single particle is detected individually by detecting the shadow of a single particle in the region where the background light exists. According to this structure, even in a case that a single particle to be an observation object emits no light or its emitting light intensity is low, it is not necessary to give a light emitting label to the single particle, and also, erroneous judgments of stray light and Raman scattering light as a signal of a particle to be observed are avoided.
- the substantially constant background light to be included in the light from the light detection region may be fluorescence, phosphorescence, chemiluminescence, bioluminescence, or scattered light by substance dispersed in the sample solution.
- substance emitting or scattering light when no substance emitting or scattering light is dispersed in a solution used as a sample solution, substance emitting or scattering light may be dissolved or dispersed into this solution positively.
- the autofluorescence may be used as the above-mentioned background light.
- the microscope device is equipped with a light source and an optical system for the illumination light.
- the background light may be illumination light by transmitted illumination, etc. if it is reduced when a single particle exists in the light detection region.
- the degree of the background light reduction depends on the relation between the size of the single particle and the size of the light detection region.
- the outer diameter of a single particle to be an observation object is not less than 15% of diameter of the light detection region, and more preferably, the outer diameter of a single particle to be an observation object is not less than 35% of diameter of the light detection region.
- the moving speed of the position of the light detection region in the sample solution may be appropriately changed based on the characteristics, number density or concentration of the single particle in the sample solution. Especially when the moving speed of the light detection region becomes quick, the degree of reduction of the light intensity or light amount because of the existence of a single particle will decrease, and thus, in order to make it possible to precisely and sensitively measure a reduction of the light intensity or light amount because of a single particle, it is preferable that the moving speed of the light detection region is changeable appropriately.
- the moving speed of the position of the light detection region in the sample solution is preferably set to be higher than the diffusional moving velocity of a single particle to be a detected object (the average moving speed of a particle owing to the Brownian motion).
- a single particle will be detected individually by detecting a background light reduction because of the existence of the single particle when the light detection region passes through the existence position of the single particle.
- the single particle moves at random owing to the Brownian motion to move into and out of the light detection region multiple times, it is possible that the signal from one single particle showing its existence will be detected multiple times, and therefore it would become difficult to make the existence of one single particle associated with the detected signal.
- the moving speed of the light detection region is set higher than the diffusional moving velocity of a single particle, and thereby it becomes possible to make one light-emitting particle correspond to one signal (indicating the single particle).
- the inventive device is so designed that the moving speed of the light detection region can be changed appropriately according to the characteristics (especially, the diffusion constant) of the single particle as described above.
- the moving of the position of the light detection region may be done in an arbitrary way.
- the position of the light detection region may be changed by changing the optical path, such as by using a galvanomirror employed in a laser scan type optical microscope, or the relative position of the light detection region in the sample solution may be moved by moving the position of the sample solution, such as by moving the stage of the microscope.
- the movement track of the position of the light detection region may be set arbitrarily, for example, which is selectable from circular, elliptical, rectangular, straight and curvilinear ones.
- the position of the light detection region is moved by changing the optical path of the optical system of the microscope, it is advantageous in that the movement of the light detection region is quick without substantial generation of mechanical vibration and hydrodynamic effect in the sample solution, and therefore, the measurement of light can be performed under a stable condition without dynamic action affecting the single particle to be an object to be detected in the sample solution.
- the judgment of whether or not one particle has entered into the light detection region by means of signals of successive detected values from the light detector may be done based on the shapes of the time series signals indicating light detected in the light detector. In an embodiment, typically, when a signal whose light intensity is lower than a predetermined threshold value measured from the background light intensity is detected, it may be judged that one single particle has entered into the light detection region.
- the signal processor of the inventive device may be designed to detect a downwardly convex, pulse form bell shaped signal descending below a predetermined threshold value measured from a background light intensity as a signal indicating the existence of a single particle in time series light intensity data.
- the “predetermined threshold value” can be experimentally set to an adequate value.
- the light intensity obtained by the inventive device is comparatively weak, in which small increases and decreases, causing deterioration of the detection accuracy of a signal indicating the existence of a single particle, are generated.
- the signal processor may be designed to conduct the smoothing of the time series light intensity data for processing the data where small increases and decreases in the light intensity can be disregarded, and then to detect in the smoothed time series light intensity data a downwardly convex bell-shaped pulse form signal whose intensity descends below a predetermined threshold value measured from the background light intensity as a signal indicating the existence of a single particle.
- the number of single particles encompassed in the light detection region may be counted by counting the number of the selectively detected signals (The counting of particles). In that case, by associating the number of the detected single particles with the moving amount of the position of the light detection region, the information on the number density or concentration of the single particle identified in the sample solution will be acquired.
- the ratio of number densities or concentrations of two or more sample solutions or a relative ratio of a number density or concentration to a standard sample solution to be the reference of a concentration or a number density may be computed, or an absolute number density value or concentration value may be determined using a relative ratio of a number density or concentration to a standard sample solution to be the reference of a concentration or a number density.
- an absolute number density value or concentration value may be determined using a relative ratio of a number density or concentration to a standard sample solution to be the reference of a concentration or a number density.
- the number of the signals of single particles obtained in the measuring time set arbitrarily is counted.
- the number of the detected signals of the single particles changes with the length of the set measuring time, and especially, in a case of a low single particle concentration, the scattering of the single particle concentration values computed from the numbers of detected signals becomes large, so that its accuracy would be reduced.
- the measurement may be performed until the number of signals of single particles reaches the arbitrarily set number, and based on its measuring time, the single particle concentration value may be computed.
- the shortening of the measuring time for a sample solution of a high single particle concentration is expected, and the measurement for a sample solution of a low single particle concentration will be performed with spending sufficient time. That is, according to the above-mentioned structure, the measuring time is optimized in accordance with the single particle concentrations. Moreover, when the predetermined number is set to the number which attains the accuracy requested for the result, the scatterings in the time taken for the detection of the predetermined number of the single particles and an arbitrary result derived therefrom can be suppressed, making the accuracy of the result(s) satisfactory.
- the processes of the single particle detection technique of conducting the light detection in the presence of constant background light with moving the position of the light detection region in a sample solution, detecting individually a reduction of the light intensity or light amount of the background light as a signal of a single particle, thereby detecting sequentially and individually the existence of each particle in the above-mentioned inventive device can be realized with a general-purpose computer, also.
- a computer readable storage device having a computer program product including programmed instructions for single particle detection of detecting light from a light-emitting particle dispersed and moving at random in a sample solution using an optical system of a confocal microscope or a multiphoton microscope, said programmed instructions causing a computer to perform steps of: moving a position of a light detection region of the optical system of the microscope in the sample solution; detecting light including substantially constant background light from the light detection region with moving the position of the light detection region in the sample solution, and generating time series light intensity data; and detecting in the time series light intensity data individually a reduction of the light intensity occurring when the single particle has entered into the light detection region as a signal indicating an existence of each single particle.
- “computer readable storage device” does not cover transitory propagating signal per se.
- a computer reads out the program memorized in the storage device and realizes the above-mentioned steps by performing the processing and calculations of information.
- a computer readable storage device may be a magnetic disc, a magnetic optical disk, a CD-ROM, a DVD-ROM, a semiconductor memory, etc.
- the above-mentioned program may be distributed to a computer through communication line, and the computer which received this distribution may be made to execute the program.
- the background light may be fluorescence, phosphorescence, chemiluminescence, bioluminescence, scattered light owing to substances dispersed in the sample solution or illumination light.
- the outer diameter of the single particle is preferably not less than 15% of the diameter of the light detection region, and more preferably not less than 35% of the diameter of the light detection region.
- the single particle to be an object to be observed is a particle which significantly reduces the light amount from the light detection region because of its existence in the light detection region, namely, a particle emitting no light or a particle whose emitting light intensity is lower than the background light in the detected light wavelength band.
- the individual detection of a signal indicating the existence of each single particle may be done based on the shape of the time series signal.
- it may be judged that one single particle has entered into the light detection region when a signal whose light intensity is lower than a predetermined threshold value measured from the intensity of the background light is detected.
- a downwardly convex, bell-shaped pulse form signal whose intensity is lower than a predetermined threshold value measured from the intensity of the background light in the time series light intensity data may be detected as the signal indicating the existence of the single particle, and in this case, the time series light intensity data may be smoothed and a downwardly convex, bell-shaped pulse form signal in the smoothed time series light intensity data may be detected as a signal indicating the existence of a single particle.
- the moving speed of the position of the light detection region in the sample solution may be appropriately changed based on the characteristics, number density or concentration of the single particle in the sample solution, and preferably, the moving speed of the position of the light detection region in the sample solution is set higher than the diffusion moving velocity of the single particle to be an object to be detected.
- the moving of the position of the light detection region in the sample solution may be done by an arbitrary way, and preferably, the position of the light detection region may be changed by changing the optical path of the optical system of the microscope or by moving the position of the sample solution.
- the movement track of the position of the light detection region may be set arbitrarily, for example, which is selectable from circular, elliptical, rectangular, straight and curvilinear ones.
- the above-mentioned computer readable storage device may also comprise a step of counting a number of the signals indicating the existences of the single particles individually detected during moving the position of the light detection region to count a number of the single particles and/or a step of determining a number density or concentration of the single particle in the sample solution based on the number of the detected single particles.
- the counting of particles is conducted by counting the number of signals of single particles obtained in a arbitrarily set measuring time; however, the measurement may be performed until the number of signals of single particles reaches an arbitrarily set number, and the single particle concentration value may be computed based on the measuring time.
- the above-mentioned computer readable storage device may be designed to repeat until the number of the signals indicating the existences of the single particles detected with the signal processor reaches a predetermined number the moving of the position of the light detection region of the optical system by the light detection region mover, the detecting of the light from the light detection region by the light detector and the detecting of the signals indicating the existences of the single particle by the signal processor; and to determine a concentration of the single particle in the sample solution based on the time taken for the number of the signals indicating the existences of the single particles to reach the predetermined number.
- a single particle detection method of detecting a single particle dispersed and moving at random in a sample solution using an optical system of a confocal microscope or a multiphoton microscope comprising steps of: moving a position of a light detection region of the optical system in the sample solution; detecting light including substantially constant background light from the light detection region with moving the position of the light detection region in the sample solution, and generating time series light intensity data; and detecting in the time series light intensity data individually a reduction of the light intensity occurring when the single particle has entered into the light detection region as a signal indicating an existence of each single particle.
- the background light may be fluorescence, phosphorescence, chemiluminescence, bioluminescence, scattered light owing to substances dispersed in the sample solution or illumination light.
- the outer diameter of the single particle is preferably not less than 15% of the diameter of the light detection region, and more preferably not less than 35% of the diameter of the light detection region.
- the single particle to be an object to be observed is a particle which significantly reduces the light amount from the light detection region because of its existence in the light detection region, namely, a particle emitting no light or a particle whose emitting light intensity is lower than the background light in the detected light wavelength band.
- the individual detection of a signal indicating the existence of each single particle may be done based on the shape of the time series signal.
- it may be judged that one single particle has entered into the light detection region when a signal whose light intensity is lower than a predetermined threshold value measured from the intensity of the background light is detected.
- a downwardly convex, bell-shaped pulse form signal whose intensity is lower than a predetermined threshold value measured from the intensity of the background light in the time series light intensity data may be detected as the signal indicating the existence of the single particle, and in this case, the time series light intensity data may be smoothed and a downwardly convex, bell-shaped pulse form signal in the smoothed time series light intensity data may be detected as a signal indicating the existence of a single particle.
- the moving speed of the position of the light detection region in the sample solution may be appropriately changed based on the characteristics, number density or concentration of the single particle in the sample solution, and preferably, the moving speed of the position of the light detection region in the sample solution is set higher than the diffusion moving velocity of the single particle to be an object to be detected.
- the moving of the position of the light detection region in the sample solution may be done by an arbitrary way, and preferably, the position of the light detection region may be changed by changing the optical path of the optical system of the microscope or by moving the position of the sample solution.
- the movement track of the position of the light detection region may be set arbitrarily, for example, which is selectable from circular, elliptical, rectangular, straight and curvilinear ones.
- the above-mentioned method may also comprise a step of counting a number of the signals indicating the existences of the single particles individually detected during moving the position of the light detection region to count a number of the single particles and/or a step of determining a number density or concentration of the single particle in the sample solution based on the number of the detected single particles.
- the counting of particles is conducted by counting the number of signals of single particles obtained in a arbitrarily set measuring time; however, the measurement may be performed until the number of signals of single particles reaches an arbitrarily set number, and the single particle concentration value may be computed based on the measuring time.
- the above-mentioned method may be designed to repeat until the number of the signals indicating the existences of the single particles detected with the signal processor reaches a predetermined number the moving of the position of the light detection region of the optical system by the light detection region mover, the detecting of the light from the light detection region by the light detector and the detecting of the signals indicating the existences of the single particle by the signal processor; and to determine a concentration of the single particle in the sample solution based on the time taken for the number of the signals indicating the existences of the single particles to reach the predetermined number.
- the optical analysis technique of the above-mentioned present invention is used, typically, for an analysis of a condition in a solution of a biological particulate object, such as a biological molecule, e.g. a protein, a peptide, a nucleic acid, a lipid, a sugar chain, an amino acid or these aggregate, a virus and a cell, etc., but it may be used for an analysis of a condition in a solution of a non-biological particle (for example, an atom, a molecule, a micelle, a liposome, metallic colloid, a bead (a magnetic bead, a polystyrene bead, a latex bead, etc.), a quencher (azobenzenes (dabcyl, BHQ, etc.), a metallic particle etc.), and it should be understood that such a case belongs to the scope of the present invention also.
- a biological particulate object such as a biological molecule,
- the inventive single particle detection technique employs the principle of the scanning molecule counting method to enable the detection of a single particle which does not emit light (or a particle whose emitted light intensity is lower than background light in a detected light wavelength band) dispersed in the solution.
- its light detection mechanism itself is constituted to detect light from a light detection region of a confocal microscope or a multiphoton microscope similarly to the usual scanning molecule counting method, and therefore, the amount of a sample solution may be small similarly.
- the inventive single particle detection technique is applicable to a sample solution whose single particle number density or concentration is substantially lower than the level required in optical analysis techniques, such as FCS, FIDA and PCH.
- a light emitting label it is not necessary to attach a light emitting label to a single particle, and thus, even a particle which is denaturalized by attaching a light emitting label thereto can be chosen as a particle to be observed. Furthermore, according to the manner of detecting, as a signal indicating the existence of a single particle, a background light reduction in the presence of a certain degree of background light, erroneous detections of stray light and Raman scattering light as a signal of a particle to be observed would be eliminated.
- FIG. 1A is a schematic diagram of the internal structure of a single particle detection device performing the inverted scanning molecule counting method in accordance with the present invention.
- FIG. 1 (B) is a schematic diagram of a confocal volume (a light detection region of a confocal microscope).
- FIG. 1 (C) is a schematic diagram of the mechanism for changing the direction of the mirror 7 to move the position of a light detection region in a sample solution.
- FIG. 1 (D) is a schematic diagram of the mechanism for moving the horizontal position of a micro plate to move the position of the light detection region in a sample solution.
- FIGS. 2A and 2B are a schematic diagram explaining the principle of detecting the existence of a single particle and a schematic diagram of the variation of the measured light intensity with time in the inverted scanning molecule counting method of the present invention, respectively.
- FIG. 2C is a diagram explaining the principle of the reduction of the detected light amount at the time of a single particle entering into a light detection region
- FIG. 2D is a diagram showing the relation between the diameter ratios of a light detection region and a single particle and the ratios of a reduction of the detected light amount.
- FIG. 3 is a diagram showing the procedures of the inverted scanning molecule counting method performed in accordance with the present invention in the form of a flow chart.
- FIGS. 4A and 4B are drawings of models in a case that a single particle crosses a light detection region owing to the Brownian motion and in a case that a single particle crosses a light detection region by moving the position of the light detection region in a sample solution at a velocity quicker than the diffusional moving velocity of the single particle.
- FIG. 4C shows drawings explaining an example of the signal processing step of the detected signals in the procedure for detecting the existence of a single particle from the measured time series light intensity data (change in time of photon count) in accordance with the inverted scanning molecule counting method.
- FIG. 5 is a diagram showing another manner of the procedures of the inverted scanning molecule counting method performed according to the present invention in the form of a flow chart.
- FIGS. 6A and 6B is a diagram showing the yet other manner of the procedures of the inverted scanning molecule counting method performed according to the present invention in the form of a flow chart.
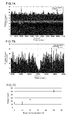
- FIG. 7A is an example of time series light intensity data (photon count data) obtained in accordance with the inverted scanning molecule counting method using a solution where fluorescent dye was dissolved, containing magnetic beads at 10 mg/ml
- FIG. 7B is its enlarged view of a part in which a signal indicating the existence of a magnetic bead is observed.
- a curve obtained by smoothing data values and fitting curves to the signal of a magnetic bead are superimposed.
- FIG. 7C shows a relation between the magnetic bead concentrations in the solution and the numbers of signals indicating the existences of the magnetic beads detected in the time series light intensity data obtained in accordance with the inverted scanning molecule counting method.
- a single particle detection device which realizes the single particle detection technique according to the present invention can be a device constructed by associating the optical system of a confocal microscope and a photodetector, enabling FCS, FIDA, etc., as schematically illustrated in FIG. 1A .
- the single particle detection device 1 consists of an optical system 2 - 17 and a computer 18 for acquiring and analyzing data together with controlling the operation of each part in the optical system.
- the optical system of the single particle detection device 1 may be the same as the optical system of a usual confocal microscope, where laser light, emitted from a light source 2 and transmitted through the inside of a single mode fiber 3 (Ex), forms light diverging to be radiated at the angle decided by an inherent NA at the emitting end of the fiber; and after forming a parallel beam with a collimator 4 , the light is reflected on a dichroic mirror 5 and reflective mirrors 6 and 7 , entering into an objective 8 .
- a single mode fiber 3 Ex
- the objective 8 typically, there is placed a sample container or a micro plate 9 having wells 10 arranged thereon, to which one to several tens of ⁇ L of a sample solution is dispensed, and the laser light emitted from the objective 8 is focused in the sample solution in the sample container or well 10 , forming a region having strong light intensity (excitation region).
- excitation region typically, single particles to be objects to be observed and arbitrary light-emitting substance which produces background light are dispersed or dissolved, and when no single particle has entered into the excitation region, the light-emitting substance is excited so that substantially constant light is emitted, becoming the background light; and when a single particle enters into the excitation region, the background light decreases.
- the pinhole 13 is located at a conjugate position of the focal position of the objective 8 , and thereby only the light emitted from the focal region of the laser light, i.e., the excitation region, as schematically shown in FIG. 1B , passes through the pinhole 13 while the light from regions other than the excitation region is blocked.
- the focal region of the laser light illustrated in FIG. 1B is a light detection region, whose effective volume is usually about 1-10 fL in this optical analysis device (typically, the light intensity is spread in accordance with a Gaussian distribution having the peak at the center of the region.
- the effective volume is a volume of an approximate ellipsoid bordering a surface where the light intensity is reduced to 1/e 2 of the peak intensity.), which is called as “confocal volume”.
- confocal volume a volume of an approximate ellipsoid bordering a surface where the light intensity is reduced to 1/e 2 of the peak intensity.
- a light amount reduction because of the existence of a single particle in the background light which consists of faint light from several number of fluorescent dye molecules is detected, and thus, for the photodetector 16 , preferably, a super high sensitive photodetector, usable for the photon counting, is used.
- the detection of light is performed by the photon counting, the measurement of light intensity is performed for a predetermined time in a manner of measuring the number of photons which have sequentially arrived at a photodetector in every predetermined unit time (BIN TIME).
- the time series light intensity data is time series photon count data.
- a stage position changing apparatus 17 a for moving the horizontal position of the micro plate 9 , in order to change the well 10 to be observed.
- the operation of the stage position changing apparatus 17 a may be controlled by the computer 18 . According to this structure, in the presences of two or more specimens, quick measurements are achievable.
- a mechanism for scanning the inside of the sample solution with the light detection region namely for moving the position of the focal region i.e. the light detection region, within the sample solution.
- a mirror deflector 17 which changes the direction of the reflective mirror 7 , as schematically illustrated in FIG. 1C (the way of moving the absolute position of the light detection region).
- This mirror deflector 17 may be the same as that of a galvanomirror device equipped on a usual laser scan type microscope.
- FIG. 1C the way of moving the absolute position of the light detection region.
- the stage position changing apparatus 17 a may be operated to move the horizontal position of the container 10 (micro plate 9 ) in which the sample solution is dispensed, thereby moving the relative position of the light detection region in a sample solution (the way of moving the absolute position of a sample solution.). Even in either of cases, in order to attain a desired moving pattern of the position of the light detection region, the mirror deflector 17 or stage position changing apparatus 17 a is driven in harmony with the light detection of the photodetector 16 under the control of the computer 18 .
- the movement track of the position of the light detection region may be arbitrarily selected from circular, elliptical, rectangular, straight and curvilinear ones, or a combination of these (The program in the computer 18 may be designed so that various moving patterns can be selected.). Moreover, by combining the way of moving the absolute position of the light detection region and the way of moving the absolute position of the sample solution, the absolute position of the light detection region may be moved together with moving the position of the sample solution. In this case, it is avoided that the same single particle is repetitively detected because of the light detection region passing through the same region in a short time.
- the improvement in the accuracy of signals may be achieved.
- the position of the light detection region may be moved in the vertical direction by moving the objective 8 up and down, so that the track of the position of the light detection region is developed in three dimensions within the sample solution.
- the above-mentioned optical system is used as a multiphoton microscope. In that case, since the light is emitted only from the focal region of the excitation light (light detection region), the pinhole 13 may be removed.
- the optical system 2 - 5 for generating excitation light may be omitted.
- the above-mentioned optical system of the confocal microscope is used as it is.
- two or more excitation light sources 2 may be provided so that the wavelength of the excitation light can be appropriately selected in accordance with the wavelength of the light for exciting light-emitting substance.
- two or more photodetectors 16 may also be provided so that separate detection can be performed depending upon the wavelengths.
- background light may be provided by illumination light. In that case, the sample solution is illuminated with transmitted illumination (which may be Koehler illumination.) from above the objective.
- the computer 18 has performs a CPU and a memory, and the inventive procedures are performed through the CPU executing various operational processings. In this regard, each procedure may be done with hardware.
- All or a part of processes explained in this embodiment may be performed by the computer 18 with a computer readable storage device having memorized the programs to realize those processes. Accordingly, the computer 18 may read out the program memorized in the storage device and realize the above-mentioned steps by performing the processing and calculations of information.
- a computer readable storage device may be a magnetic disc, a magnetic optical disk, a CD-ROM, a DVD-ROM, a semiconductor memory, etc.
- the above-mentioned program may be distributed to a computer through communication line, and the computer which received this distribution may be made to execute the program.
- Spectral analysis techniques such as FCS, FIDA, etc.
- FCS fluorescence intensity fluctuation
- the concentration or number density of the light-emitting particle in a sample solution should be at a level where about one light-emitting particle always exists in a light detection region CV during the fluorescence intensity measurement so that significant light intensity (photon count) can be always detected in the measuring term.
- the concentration or number density of the light-emitting particle is lower than that, for example, at the level where the light-emitting particle rarely enters into the light detection region CV, no significant light intensity signal (photon count) would appear in a part of the measuring term, and thus, accurate computation of light intensity fluctuation would become difficult. Also, when the concentration of the light-emitting particle is significantly lower than the level where about one light-emitting particle always exists in the inside of the light detection region during the measurement, the calculation of light intensity fluctuation would become subject to the influence of the background, and the measuring time should be made long in order to obtain the significant quantity of the light intensity data (photon count) sufficient for the calculation.
- a scanning molecule counting method based on a new principle which enables the detection of characteristics of a light-emitting particle, such as its number density or concentration, even when the concentration of the light-emitting particle is lower than the level requested in the above-mentioned spectral analysis techniques, such as FCS and FIDA.
- a particle to be an observation object is a light-emitting particle dispersed in a sample solution, and, in the above-mentioned single particle detection device, measurement of light intensity is performed with moving the position of the light detection region.
- the particles to be observation objects are particles which emit light in a detected light wavelength band, and the particles which do not emit light in the detected light wavelength band cannot be detected.
- a particle which does not emit light essentially is an observation object, it is required to attach a light emitting label, such as a fluorescent indicator, to the particle.
- a light emitting label such as a fluorescent indicator
- the detection of a single particle is achieved by making background light emitted from the light detection region (or illuminating the light detection region with illumination light) and catching a reduction of the detected background light when a particle to be an observation object enter into the light detection region in the light measurement by the above-mentioned scanning molecule counting method.
- the light detection is performed with moving the position of the light detection region CV in the sample solution, namely, scanning the inside of the sample solution with the light detection region CV, by driving the mechanism for moving the position of the light detection region to change the optical path (the mirror deflector 17 ), or to move the horizontal position of the container 10 (micro plate 9 ) to which the sample solution has been dispensed, as schematically drawn in FIG. 2A .
- the moving light detection region CV when the moving light detection region CV is passing through a region where one non light emitting light particle (or a particle having a low emitting light intensity in a detected light wavelength band) (t 1 ), the volume of the region occupied by the light-emitting substance decreases so that the total amount of the light emitted by the light-emitting substance will decrease and a bell-shaped pulse form significant reduction of the light intensity (Em) will appear on the time series light intensity data as drawn on FIG. 2B .
- Em light intensity
- the single particles are individually detected, and by counting their number, the information about the number, concentration or the number density of the single particle which exists in the measured region can be acquired.
- the degree of the above-mentioned reduction of the light intensity can be estimated from the relation between the diameter of a single particle and the diameter of a light detection region.
- the light intensity distribution in a light detection region has the maximum strength Imax at the center, and the distribution has the bell-shaped profile f(r) reducing in the direction of radius r as shown by the solid line in the drawing.
- the ratio of reduction of light intensity can be estimated as ⁇ / ⁇ .
- FIG. 2D is a graph of plotting the ratios of light intensity reduction ⁇ / ⁇ against to radius ratios b/a using Expression (3).
- the ratio of background light variation is about 1% and the ratio of the light intensity reduction because of a single particle is 1% or less, no signals would become detectable, and thus, the ratio of the radius of a single particle to the radius of a light detection region, b/a, should be made 0.15 or more.
- the ratio of the light intensity reduction owing to a single particle is made not less than 10%, the ratio of the detectable single particle radius to the radius of the light detection region, b/a, becomes 0.35.
- the detectable single particle radius can be smaller than the radius as illustrated above.
- the radius as illustrated above is a value in case that a single particle to be observation object does not emit light substantially in a detected light wavelength band, and thus, when a single particle emits the light at a certain degree in a detected light wavelength band, the detectable single particle radius can be larger than the illustrated radius.
- FIG. 3 shows the processes in this embodiment in form of the flow chart.
- the particle to be an object to be observed in the inventive single particle detection technique may be an arbitrary particle as long as it is dispersed in a sample solution and moving at random in the solution and has a particle diameter of preferably not less than 15% and more preferably not less than 35% of the diameter of the light detection region; and the particle may be, for instance, a biological molecule, i.e. a protein, a peptide, a nucleic acid, a lipid, a sugar chain, an amino acid, etc.
- a virus for example, an atom, a molecule, a micelle, a liposome, a metallic colloid, a bead (a magnetic bead, a polystyrene bead, a latex bead, etc.), a quencher (azobenzenes (dabcyl, BHQ, etc.), a metallic particle, etc.)
- a non-biological particle for example, an atom, a molecule, a micelle, a liposome, a metallic colloid, a bead (a magnetic bead, a polystyrene bead, a latex bead, etc.), a quencher (azobenzenes (dabcyl, BHQ, etc.), a metallic particle, etc.
- the single particle may be a particle whose emitting light intensity is lower than the background light in the detected light wavelength band.
- an arbitrary light-emitting molecule for example, a fluorescent molecule, a phosphorescent molecule, and a chemi- or a bioluminescent molecule may be used, and the light-emitting substance is dissolved or dispersed in a sample solution at a concentration which makes several molecules to always exist in the light detection region.
- the sample solution is typically an aqueous solution, but not limited to this, and it may be an organic solvent or other arbitrary liquids.
- the light intensity measurement in the optical analysis by the inverted scanning molecule counting method of the present embodiment may be performed in a manner similar to the measuring process of light intensity in FCS or FIDA except that the moving of the position of the light detection region in a sample solution (scanning in a sample solution) is conducted by driving the mirror deflector 17 or stage position changing apparatus 17 a during the measurement.
- the computer 18 executes programs memorized in a storage device (not shown) (the process of moving the position of the light detection region in the sample solution, and the process of detecting light from the light detection region during the moving of the position of the light detection region) to start radiating the excitation light and measuring the light intensity in the light detection region.
- the mirror deflector 17 or stage position changing apparatus 17 a drives the mirror 7 (galvanomirror) or the micro plate 9 on the stage of the microscope to move the position of the light detection region in the well 10 , and simultaneously with this, the photodetector 16 sequentially converts the detected light into electric signals and transmits it to the computer 18 , which generates the time series light intensity data from the transmitted signals and stores it in an arbitrary manner.
- the photodetector 16 is typically a super high sensitive photodetector which can detect the presence or absence of an arrival of a single photon, and thus, when the light detection is conducted by the photon counting, the time series light intensity data will be a time series photon count data.
- the moving speed of the position of the light detection region during the measurement of the light intensity may be a predetermined velocity set arbitrarily, for example, experimentally or in order to meet the purpose of an analysis.
- the region size or volume through which the light detection region has passed is required, and therefore, the moving of the position of the light detection region is performed in a manner enabling the grasping of the moving distance.
- the moving speed is constant, although not limited thereto.
- the moving speed of the position of the light detection region in order to perform quantitatively precisely individual detection of a single particle to be observed from the measured time series light intensity data or the counting of the number of single particles, it is preferable that the moving speed is set to a value quicker than the moving speed in the random motion, i.e., the Brownian motion of a single particle.
- the particle to be observed in the inventive single particle detection technique is a particle dispersed or dissolved in a solution and moving at random freely, its position moves with time owing to the Brownian motion.
- the moving speed of the position of the light detection region is slower than the movement of a particle owing to the Brownian motion, the particle moves at random in the region as schematically drawn in FIG.
- the moving speed of the position of the light detection region is set to be quicker than the average moving speed of a particle by the Brownian motion (diffusional moving velocity) so that the particle will cross the light detection region in an approximately straight line and thereby the profile of the change of the light intensity corresponding to each particle becomes almost uniform in the time series light intensity data as illustrated in the most upper row of FIG. 4C (When a single particle passes through the light detection region in an approximately straight line, the profile of the light intensity change is similar to the inverted form of the excitation light intensity distribution.) and the correspondence between each particle and light intensity can be easily determined.
- the moving speed of the position of the light detection region may be set to a value sufficiently quicker than Vdif.
- Vdif will be 1.0 ⁇ 10 ⁇ 3 m/s
- supposing Wo is about 0.62 ⁇ m
- the moving speed of the position of the light detection region may be set to its 10 times or more, such as 15 mm/s.
- an appropriate moving speed of the position of the light detection region may be determined by repeating the executions of a preliminary experiment with setting various moving speeds of the position of the light detection region in order to find the condition that the profile of a light intensity variation becomes an expected profile (typically, similar to the excitation light intensity distribution).
- time series light intensity data in the sample solution is obtained by the above-mentioned processes, there are performed detection of a signal of a single particle, counting of single particles, and various analyses, such as concentration calculation, etc. in the computer 18 through processes in accordance with programs memorized in a storage device.
- the light intensity variation in the signal corresponding to the particle in the time series light intensity data has a downwardly convex, almost bell shaped profile reflecting the light intensity distribution in the light detection region (determined by the optical system) (see the most upper row of FIG. 4C ).
- the signal having the profile of the light intensity reduction may be judged to correspond to one particle having passed through the light detection region, and thereby one particle is detected.
- a smoothing treatment is performed to the time series light intensity data ( FIG. 4C , the most upper row “detected result (unprocessed)”) ( FIG. 3 —step 110 , FIG. 4C mid-upper row “smoothing”).
- the light emission by light-emitting substance is stochastic and the light intensity is comparatively weak so that small increase and decrease of the light intensity will occur, and such small increases and decreases (fluctuation) in the light intensity would deteriorate the detection accuracy of a signal indicating the existence of a single particle.
- the smoothing makes it possible to disregard such small increases and decreases on the data.
- the smoothing treatment may be done, for example, by the moving average method, etc.
- parameters in performing the smoothing treatment e.g., the number of datum points in one time of the averaging, the number of times of the moving average, etc. in the moving averages method, may be appropriately set in accordance with the moving speed (scanning speed) of the position of the light detection region and/or BIN TIME in the light intensity data acquisition.
- the first differential values with time of the time series light intensity data after the smoothing treatment is computed (step 120 ).
- the mid-low row “time differential”, in the time differential values of time series light signal data the variation of the values increases at the time of the signal value change, and thereby, the start point and the end point of a significant signal can be determined advantageously by referring to the time differential value.
- a significant pulse signal is detected sequentially on the time series light intensity data, and it is judged whether or not the detected signal is a signal corresponding to a single particle.
- the start point and the end point of one pulse signal are searched and determined by referring to the time differential values sequentially, so that a pulse existing region will be specified (step 130 ).
- the fitting of a downwardly convex, bell-shaped function is applied to the smoothed time series light intensity data in the pulse existing region ( FIG.
- the lower row “bell-shaped function fitting” the lower row “bell-shaped function fitting”
- parameters of the pulse of the bell-shaped function such as the peak intensity (Maximum reduction amount from the background light), Ipeak; the pulse width (full width at half maximum), Wpeak; the correlation coefficient in the fitting (of the least square method), etc. are computed (step 140 ).
- the bell-shaped function to be used in the fitting is typically Gauss function, it may be Lorentz type function.
- step 150 it is judged whether or not the computed parameters of the bell shaped function are within the ranges assumed for the parameters of the bell-shaped profile drawn by a pulse signal detected when one particle passes the light detection region, namely, whether or not the peak intensity, pulse width and the correlation coefficient of the pulse are in the predetermined ranges, respectively, for instance, whether or not the following conditions: 20 ⁇ sec. ⁇ pulse width ⁇ 400 ⁇ sec. Peak intensity>4.0[pc/10 ⁇ sec.] Correlation coefficient>0.95 (A) are satisfied, etc. (step 150 ) Then, a signal whose computed parameters of the bell shaped function are within the ranges assumed for a signal corresponding to one signal is judged as a signal corresponding to one particle. On the other hand, a pulse signal whose computed parameters of the bell type function are not within the assumed ranges is disregarded as noise.
- the searching and judgment of a pulse signal in the above-mentioned processes of steps 130 - 150 may be repetitively performed over the whole region of time series light intensity data (Step 160 ).
- the processes for detecting individually a signal of a single particle from the time series light intensity data may be performed by an arbitrary way, other than the above-mentioned procedures.
- the determination of the number of particles may be done (counting of particles). Also, when the volume of the whole region which the light detection region has passed through is computed in an arbitrary way, the number density or concentration of a single particle in the sample solution can be determined from its volume value and the number of particles (Step 170 ).
- the whole volume of the region which the light detection region has passed through may be theoretically computed based upon the excitation light or detected light wavelength the numerical aperture of lenses, the adjustment conditions of the optical system, it may be experimentally determined, for instance, from the number of particles, which have been detected by conducting, with a solution having a known light-emitting particle concentration (reference solution) under the same condition as that for the measurement of a sample solution to be tested, the light intensity measurement, the detection of particles and the counting thereof, and the concentration of the particle in the reference solution.
- a solution having a known light-emitting particle concentration (reference solution) under the same condition as that for the measurement of a sample solution to be tested, the light intensity measurement, the detection of particles and the counting thereof, and the concentration of the particle in the reference solution.
- the plurality of solutions of different single particle concentrations are prepared as reference solutions and the measurement is performed for each of the solutions, and then, the average value of the computed Vt is determined as the whole volume Vt of the region which the light detection region has passed through.
- the volume of the light detection region and the volume of the whole region which the light detection region has passed through may be given by an arbitrary method, for instance, using FCS and FIDA, instead of the above-mentioned method.
- a storage apparatus of the computer 18 there may be previously memorized in a storage apparatus of the computer 18 the information on the relations (Expression (8)) between concentrations C and particle numbers N of various standard particles for assumed moving patterns of the light detection region, so that a user of the device can appropriately use the memorized information on the relation in conducting an optical analysis.
- the light intensity measurement with moving a light detection region and the detection of a signal of a single particle may be repeated until the number of signals reaches a predetermined number; the time taken for the number of signals to reach the predetermined number may be measured; and the particle concentration may be determined based on the time taken for the number of the signals of the single particles to reach the predetermined number.
- the time taken for the light intensity measurement can be shortened, while for a sample solution of a low particle concentration, it becomes possible to continue the light intensity measurement until the particle count which attains the accuracy required for a result (namely, particle concentration) is obtained.
- the particle count which achieves the accuracy required for the result will be reflected in the time taken for the number of signals of single particles to reach the predetermined number, and thus, it is expected that the concentration value of the particles determined based on that time has the allowable or satisfactory accuracy.
- a particle concentration value and a time taken for the number of signals to reach a predetermined number are associated with as follows:
- the particle concentration C is proportional to the detection rate V in the first-order so that the correspondence relation between the particle concentration C and the detection rate V is intelligible, and therefore, in an actual experiment, the particle concentration C may be determined using the detection rate V.
- the single particle detection process for detecting a fixed number of signals may be performed, for example, by the procedures shown in the flow chart of FIG. 5 .
- a series of processes the moving of the position of a light detection region, the detection of the light from the light detection region, the detection of signals of single particles and the counting of the detected particle signals are repetitively performed in every analytical time interval t (a predetermined time interval) until the detected particle count X reaches the end particle count XE (a predetermined number to which the number of single particle should reach).
- t a predetermined time interval
- XE a predetermined number to which the number of single particle should reach
- the computer 18 performs, as the initial setting, the setting of the end particle count XE (step 10 ) and the setting of the analytical time interval t (step 20 ).
- the end particle count XE and the analytical time interval t may be arbitrarily set by the user.
- the end particle count XE can be appropriately determined with reference to a result of a preliminary experiment using a solution having a known particle concentration.
- an arbitrary time interval enough shorter than the period until the number of particles (X) reaches the end particle count (XE) after starting the process may be appropriately set, considering the processing speed, etc. in the device 1 .
- a value, determined beforehand with reference to a result of a preliminary experiment using a solution having a known particle concentration may be memorized in the device 1 so that the memorized value can be used automatically or by a user's choice.
- the light intensity measuring process, the detection of signals of particles from measured light intensity data and detection of the number of particles x (step 30 ) in the analytical time interval t according to the scanning molecule counting method; and a process of accumulating the number of the particles x detected in step 30 and computing the total number X(tn) of the particles (step 40 ) are repetitively performed every analytical time interval t until the total number X(tn) of the particles reaches the end particle count XE (step 50 ) as described below.
- the starting time Ts of a series of processes may be memorized (step 25 ).
- the process of the light detection and particle count detection in step 30 may be the same as in the process shown in FIG. 3 .
- the light intensity measurement is conducted for the analytical time interval t with moving the position of the light detection region within the sample solution (scanning the inside of the sample solution), and then, in the time series light intensity data obtained in the analytical time interval t, the detection of a signal indicating the existence of a single particle and the counting of the detected number are performed in the computer 18 by the processes according to programs memorized in a storage device.
- X (t n ⁇ 1 ) is the total number of the particles detected till the last analytical time interval t, and its initial value is 0.
- steps 30 - 40 are repeated every analytical time interval t until the total number of the detected particles X(tn) reaches the end particle count XE, namely, X ( t n ) ⁇ XE (15) is established (step 50 ).
- the total number of the detected particles X(t n ) and/or the measurement end time TE or the measurement remaining time Tr may be indicated on a display, such as a monitor, etc. of the computer 18 . According to this structure, it is advantageous in that a user can predict when an executed measurement is ended by seeing those indications.
- Tr ( XE ⁇ X ( t n ))/ v (17)
- Step 56 the estimated measurement end time TE or the measurement remaining time Tr is indicated on the display (step 58 ).
- the already indicated values are updated.
- the above-mentioned processes of steps 30 - 50 in FIG. 5 are repeated every analytical time interval t.
- the light intensity measurement of step 100 of FIG. 3 may be continuously performed from the start of measurement to its end even during the execution of the signal processing steps other than step 100 .
- the processes of the light detection and particle count detection when the light intensity measurement for the analytical time interval t of one cycle is completed, the light intensity measurement in the analytical time interval t of the following cycle is performed continuously, and simultaneously, the processes of the detecting and counting of signals of particles from the light intensity data acquired in the analytical time interval t of the completed cycle are performed in the computer 18 . Thereby, the detecting and counting of particles will be achieved in real time.
- a particle detection rate V is computed with Expression (12) from the time T to reach the end particle count and the end particle count XE, and the particle concentration is determined from the particle detection rate V, using the relation of Expression (13).
- the cross sectional area S of the passing region of the light detection region in Expression (10)-(13) may be computed theoretically based on the wavelength of excitation light or detected light, the numerical aperture of a lens and the adjustment condition of the optical system, the cross sectional area S may be determined experimentally, for example, from the number of particles, detected by performing the light intensity measurement, the detecting and counting of particles as explained above for a solution having a known particle concentration (a control solution) under the same conditions as the measurement of a sample solution to be tested, and the particle concentration of the control solution.
- the average of computed Ss may be employed as the cross sectional area S of the light detection region.
- the analytical time interval t may not be a fixed value but may be modified according to the detecting condition of the particles.
- FIG. 6A shows in the form of a flow chart the processes of the light intensity measurement of a sample solution and the detecting and counting of particles, designed so as to include a process (step 20 ′) of modifying the analytical time interval t according to the condition of detecting particles, and FIG. 6B shows the process of calculating the analytical time interval t in step 20 ′ in the form of a flow chart.
- FIG. 6A the same processes as in FIG. 5 are provided with the same step numbers.
- the analytical time interval t is modified (step 20 ′). Further, especially the processes in the illustrated example are designed to execute the processing cycles of the light intensity measurement and the detecting and counting of particles only a predetermined number of times N (referred to as “number of times of scheduled updating” in the following.) in one measurement from its start until the number of particles reaches the end particle count XE.
- the detecting and counting of particles are performed in the beginning after the setting of the end particle count XE (step 10 ) and the memorizing of the start time Ts (step 25 ) for the initial setting, namely, when the execution times k of the processing cycle of the light intensity measurement and the detecting and counting of particles is 0, the initial value to, arbitrarily settable, is given as the analytical time interval t (see FIG. 6B steps 200 , 210 ). And, the execution times k of the processing cycle increases by one (step 270 ), and the processes of the light intensity measurement and the detecting and counting of particles for the analytical time interval t are performed (steps 30 - 50 ) similarly to the processes described in FIG. 5 .
- the particle detection rate v (step 54 ) and the measurement remaining time Tr (step 56 ) are computed sequentially.
- the total number of the detected particles X (t n ) and/or the measurement end time TE or the measurement remaining time Tr are indicated on a display, such as a monitor, etc. of the computer 18 (steps 52 and 58 ).
- the processes of the light intensity measurement and the detecting and counting of particles are ended (step 50 ).
- its lower limit may be set, and when the analytical time interval t is less than the lower limit tmin, the analytical time interval t may be set to the lower limit tmin (steps 250 , 260 ).
- the analytical time interval t As described above, according to the manner in which the analytical time interval t is modified, the condition of detecting the particles to be observation objects in the sample solution is reflected in the measurement remaining time Tr, and therefore, the analytical time interval t will be optimized according to the condition of detecting particles.
- Sample solutions were prepared by dissolving, in a solution of 10 mM Tris-HCl (pH 7.0), fluorescent dye, ATTO488 (ATTO-TEC) as light-emitting substance for generating background light at 12.5 ⁇ M or 15 nM and further dispersing magnetic beads of diameter of 1 ⁇ m (Dynabeads(registered trademark) MyOne Streptavidin C1:invitorgen) as single particles to be observed at various concentrations (the magnetic beads employed here are particles which do not emit light substantially.).
- a single molecule fluorescence measuring apparatus MF20 (Olympus Corporation), equipped with the optical system of a confocal fluorescence microscope and a photon counting system, was used, and time series light intensity data (photon count data) were acquired for each of the above-mentioned sample solutions containing the fluorescent dye and magnetic beads in accordance with the manner explained in the above-mentioned “(2) Measurement of Light Intensity of a Sample Solution”. Further, the diameter of the confocal volume (light detection region) is adjusted to 1 ⁇ m, and the moving speed of the position of the light detection region in the sample solution was set 15 mm/second, BIN TIME was set to 10 ⁇ seconds and measurements for 100 seconds were performed.
- the smoothing treatment was performed to the time series photon count data, and after determining the start point and the end point of a pulse signal in the smoothed data, the fitting of the downwardly convex Gauss function (Expression (7)) was carried out to each pulse signal by the least-squares method, and thus, the peak intensity (the reduction amount of light intensity), pulse width (full width at half maximum), and correlation coefficient (in the Gauss function) were determined. Then, only the pulse signals satisfying the following conditions: 20 ⁇ sec. ⁇ pulse width ⁇ 400 ⁇ sec. Peak intensity>4[pc/10 ⁇ sec.] Correlation coefficient>0.95 (A) were extracted as signals of single particles, and the number of the signals was counted.
- FIG. 7A shows a part of the time series photon count data (Raw) obtained using a 10 ⁇ W laser light of 488 nm as excitation light for the solution of the fluorescent dye concentration at 12.5 ⁇ M in which the magnetic beads were dispersed at 5 pM (5 mg/(ml)) as the sample solution.
- the detected light was detected with a band pass filter whose transmitting wavelength was 650-690 nm and a band pass filter whose transmitting wavelength was 660-710 nm.
- the smoothed data (Smoothing) and fitting curves (Fitting) are also shown.
- FIG. 7B is an enlarged view of the time series photon count data shown in FIG. 7A .
- the ratio of the intensity of the signal of a bead to the background light intensity was ⁇ 61% in the largest one and ⁇ 16% in the smallest one.
- the ratio of the intensity of the signal of a bead to the background light intensity was the value obtained by dividing the integrated intensity of the pulse signal acquired by integrating the differences between the fluorescence intensities and the background in the duration of 200 ⁇ sec. before and after the pulse signal with the integration value of the Gauss function whose height was the average of the background light intensity and whose full width at half maximum was 100 ⁇ sec.
- the lower limit of such a peak minimum value is decided depending on the accuracy of a peak detection algorithm or the stability of background, the upper limit of the peak maximum does not exist.
- FIG. 7C is a drawing of plotting against magnetic bead concentrations the numbers of signals obtained from time series photon count data acquired using a 50- ⁇ W laser light of 488-nm as the excitation light for the sample solutions in which the magnetic beads were dispersed at 0 fM, 10 fM, 20 fM, and 50 fM, respectively, in the solution of fluorescent dye concentration at 15 nM.
- the detected light was detected with a band pass filter whose transmitting wavelength was 510-560 nm.
- the sample container was moved at 1 mm/sec. along a circular track of diameter of 1 mm as well as the moving of the light detection region (at 15 mm/sec.) by changing the optical path.
- the signals having the S/N ratio of 0.35 or more were counted as particle signals among the pulse form signals which could be approximated with the Gauss function.
- the numbers of detection signals were almost proportional to the magnetic bead concentrations in the case of the magnetic bead concentrations of 10 fM or more.
- the light intensity reduction to which a downwardly convex bell shaped function can be fit is a signal indicating the existence of a single particle (magnetic bead) in the time series photon count data observed in FIG. 7B and the particle concentration in a sample solution can be determined by counting the light intensity reductions.
- the detection of a non-light-emitting single particle dispersed in a sample solution and the acquisition of the information on its concentration become possible.
- the signal of a single particle is detected individually, detection of a particle is possible even when the particle concentration in a sample solution is lower than the concentration range requested in optical analysis techniques, such as FCS, and this feature will be advantageous in conducting analysis of a rare or expensive sample often used in the field of medical or biological research and development.
- the particle to be observed is not a light-emitting particle, and therefore, since the attaching of a light emitting label is unnecessary, any artifact due to the attaching of a light emitting label is avoided.
Abstract
Description
- Patent document 1: Japanese Patent laid-open publication No. 2005-098876
- Patent document 2: Japanese Patent laid-open publication No. 2008-292371
- Patent document 3: Japanese Patent laid-open publication No. 2009-281831
- Patent document 4: Japanese Patent No. 4023523
- Patent document 5: WO 2008-080417
- Patent document 6: Japanese Patent laid-open publication No. 2007-20565
- Patent document 7: Japanese Patent laid-open publication No. 2008-116440
- Patent document 8: Japanese Patent laid-open publication No. 4-337446
- Patent documents 9: WO 2010-119098
- Non-patent document 1: Masataka Kaneshiro; “Protein, Nucleic acid, Enzyme” Vol. 44, No. 9, pages 1431-1438, 1999.
- Non-patent document 2: F. J. Meyer-Alms; “Fluorescence Correlation Spectroscopy” edt. R. Rigler, Springer, Berlin, pages 204-224, 2000.
- Non-patent document 3: Noriko Kato, et al. “Gene medicine”, Vol. 6, No. 2, pages 271-277.
- Non-patent document 4: P. Kask, K. Palo, D. Ullmann, K. Gall PNAS 96, 13756-13761 (1999)
- 1—Optical analysis device (confocal microscope)
- 2—Light source
- 3—Single mode optical fiber
- 4—Collimating lens
- 5—Dichroic mirror
- 6, 7, 11—Reflective mirror
- 8—Objective
- 9—Micro plate
- 10—Well (sample solution container)
- 12—Condenser lens
- 13—Pinhole
- 14 a—Dichroic mirror or polarization beam splitter
- 14—Barrier filter
- 15—Multi-mode optical fiber
- 16—Photodetector
- 17—Mirror deflector
- 17 a—Stage position changing apparatus
- 18—Computer
1. Principle of Inverted Scanning Molecule Counting Method
α=4π∫r 2 f(r)dr [Integration range is 0-a]. (1)
β=4π∫r 2 f(r)dr [Integration range is 0-b] (2)
f(r)=0.684exp(−2r 2) (3).
(2Wo)2=6D·Δt (4)
as:
Δt=(2Wo)2/6D (5),
and thus, the velocity of the particle moving by the Brownian motion (diffusional moving velocity) Vdif, becomes approximately
Vdif=2 Wo/Δt=3D/Wo (6)
I=Ibg−A·exp(−2t 2 /a 2) (7),
and when the intensity A and the width a, computed by fitting Expression (7) to the profile of a significant light intensity reduction (a profile which can be clearly judged not to be a fluctuation of the background light), are within the respective predetermined ranges, the profile of the light intensity may be judged to correspond to one particle having passed through the light detection region, and thereby the detection of one particle will be done (The signal with the intensity A and the width a out of the predetermined ranges may be judged as a noise or a contaminant signal and ignored in the later analysis, etc.).
20 μsec.<pulse width<400 μsec.
Peak intensity>4.0[pc/10 μsec.]
Correlation coefficient>0.95 (A)
are satisfied, etc. (step 150) Then, a signal whose computed parameters of the bell shaped function are within the ranges assumed for a signal corresponding to one signal is judged as a signal corresponding to one particle. On the other hand, a pulse signal whose computed parameters of the bell type function are not within the assumed ranges is disregarded as noise.
Vt=N/C (8).
c=n/Vt (9)
X=CSuτN A (10)
where NA is the Avogadro's number. Thus, supposing it takes a time T for the number of the signals to reach the predetermined number XE, the light-emitting particle concentration C is given as a function of the time T by:
C=XE/(STuN A) (11)
V=XE/T (12),
and therefore, the particle concentration C is represented by:
C=V/(SuN A) (13)
X(t n)=X(t n−1)+x (14)
(
X(t n)≧XE (15)
is established (step 50). Then, during the repeating of steps 30-50, when Expression (15) is established, the processes of the light intensity measurement of the sample solution and the detecting and counting of the particles are ended. When the repetitive operations of steps 30-50 are completed, the end time TE may be memorized (step 60).
(c) Indication of the Number of Particle and the Measurement End Time
v=X(t n)/(Tp−Ts) (16)
Tr=(XE−X(t n))/v (17)
TE=Tp+Tr (18)
S=N/(C·N A·uo·τo) (19)
t=Tr/(N−k) (20)
(step 240). In this connection, for the analytical time interval t to be computed, its lower limit may be set, and when the analytical time interval t is less than the lower limit tmin, the analytical time interval t may be set to the lower limit tmin (steps 250, 260). As described above, according to the manner in which the analytical time interval t is modified, the condition of detecting the particles to be observation objects in the sample solution is reflected in the measurement remaining time Tr, and therefore, the analytical time interval t will be optimized according to the condition of detecting particles.
20 μsec.<pulse width<400 μsec.
Peak intensity>4[pc/10 μsec.]
Correlation coefficient>0.95 (A)
were extracted as signals of single particles, and the number of the signals was counted.
Claims (33)
Priority Applications (1)
| Application Number | Priority Date | Filing Date | Title |
|---|---|---|---|
| US15/151,524 US20160252456A1 (en) | 2011-08-26 | 2016-05-11 | Single particle detection device, single particle detection method, and computer program for single particle detection, using optical analysis |
Applications Claiming Priority (3)
| Application Number | Priority Date | Filing Date | Title |
|---|---|---|---|
| JP2011-184635 | 2011-08-26 | ||
| JP2011184635 | 2011-08-26 | ||
| PCT/JP2012/063139 WO2013031309A1 (en) | 2011-08-26 | 2012-05-23 | Single-particle detector using optical analysis, single-particle detection method using same, and computer program for single-particle detection |
Related Parent Applications (1)
| Application Number | Title | Priority Date | Filing Date |
|---|---|---|---|
| PCT/JP2012/063139 Continuation WO2013031309A1 (en) | 2011-08-26 | 2012-05-23 | Single-particle detector using optical analysis, single-particle detection method using same, and computer program for single-particle detection |
Related Child Applications (1)
| Application Number | Title | Priority Date | Filing Date |
|---|---|---|---|
| US15/151,524 Division US20160252456A1 (en) | 2011-08-26 | 2016-05-11 | Single particle detection device, single particle detection method, and computer program for single particle detection, using optical analysis |
Publications (2)
| Publication Number | Publication Date |
|---|---|
| US20140134608A1 US20140134608A1 (en) | 2014-05-15 |
| US9488578B2 true US9488578B2 (en) | 2016-11-08 |
Family
ID=47755827
Family Applications (2)
| Application Number | Title | Priority Date | Filing Date |
|---|---|---|---|
| US14/162,142 Active US9488578B2 (en) | 2011-08-26 | 2014-01-23 | Single particle detection device, single particle detection method, and computer program for single particle detection, using optical analysis |
| US15/151,524 Abandoned US20160252456A1 (en) | 2011-08-26 | 2016-05-11 | Single particle detection device, single particle detection method, and computer program for single particle detection, using optical analysis |
Family Applications After (1)
| Application Number | Title | Priority Date | Filing Date |
|---|---|---|---|
| US15/151,524 Abandoned US20160252456A1 (en) | 2011-08-26 | 2016-05-11 | Single particle detection device, single particle detection method, and computer program for single particle detection, using optical analysis |
Country Status (5)
| Country | Link |
|---|---|
| US (2) | US9488578B2 (en) |
| EP (1) | EP2749868B1 (en) |
| JP (1) | JP6010033B2 (en) |
| CN (1) | CN103765195B (en) |
| WO (1) | WO2013031309A1 (en) |
Cited By (1)
| Publication number | Priority date | Publication date | Assignee | Title |
|---|---|---|---|---|
| US20160252456A1 (en) * | 2011-08-26 | 2016-09-01 | Olympus Corporation | Single particle detection device, single particle detection method, and computer program for single particle detection, using optical analysis |
Families Citing this family (25)
| Publication number | Priority date | Publication date | Assignee | Title |
|---|---|---|---|---|
| JP5904947B2 (en) | 2010-10-13 | 2016-04-20 | オリンパス株式会社 | Method for measuring particle diffusion characteristics using single luminescent particle detection |
| WO2012053355A1 (en) | 2010-10-19 | 2012-04-26 | オリンパス株式会社 | Optical analysis device for observing polarisation characteristics of single light-emitting particle, optical analysis method and optical analysis computer program therefor |
| EP2667183A4 (en) | 2011-01-20 | 2017-05-10 | Olympus Corporation | Photoanalysis method and photoanalysis device using detection of light from single light-emitting particle |
| WO2013031439A1 (en) | 2011-08-26 | 2013-03-07 | オリンパス株式会社 | Optical analyzer using single light-emitting particle detection, optical analysis method, and computer program for optical analysis |
| EP2778658A4 (en) | 2011-11-10 | 2015-12-02 | Olympus Corp | Spectroscopy device, spectroscopy method, and computer program for spectroscopy, employing individual light-emitting particle detection |
| US9291562B2 (en) * | 2011-11-15 | 2016-03-22 | Max-Planck-Gesellschaft Zur Foerderung Der Wissenschaften E.V. | Method and apparatus for tracking a particle, particularly a single molecule, in a sample |
| JP2015083922A (en) * | 2012-02-07 | 2015-04-30 | オリンパス株式会社 | Single particle detection device using photometric analysis, single particle detection method and single particle detection computer program |
| CN104115001B (en) | 2012-02-17 | 2016-08-24 | 奥林巴斯株式会社 | Light analytical equipment that single particle detects, light is utilized to analyze method |
| EP2840380A4 (en) * | 2012-04-18 | 2015-11-25 | Olympus Corp | Single-particle detection device using photoanalysis, single-particle detection method, and computer program for single-particle detection |
| CN104136915B (en) * | 2012-04-18 | 2016-07-13 | 奥林巴斯株式会社 | The detection method of intended particle |
| CN104736999B (en) * | 2012-10-25 | 2017-04-12 | 奥林巴斯株式会社 | Method for detecting target particles |
| US9677990B2 (en) | 2014-04-30 | 2017-06-13 | Particles Plus, Inc. | Particle counter with advanced features |
| US10352844B2 (en) | 2013-03-15 | 2019-07-16 | Particles Plus, Inc. | Multiple particle sensors in a particle counter |
| US10983040B2 (en) | 2013-03-15 | 2021-04-20 | Particles Plus, Inc. | Particle counter with integrated bootloader |
| US11579072B2 (en) | 2013-03-15 | 2023-02-14 | Particles Plus, Inc. | Personal air quality monitoring system |
| WO2015052965A1 (en) * | 2013-10-07 | 2015-04-16 | オリンパス株式会社 | Photometric analysis device employing single light-emitting particle detection, photometric analysis method, and computer program for photometric analysis |
| WO2015108023A1 (en) * | 2014-01-17 | 2015-07-23 | 株式会社ニコン | Particle analysis device, observation device, particle analysis program, and particle analysis method |
| JP6228858B2 (en) * | 2014-02-06 | 2017-11-08 | 日本電子株式会社 | Particle analysis apparatus and program |
| WO2017098597A1 (en) | 2015-12-09 | 2017-06-15 | オリンパス株式会社 | Optical analysis method and optical analysis device employing single light-emitting particle detection |
| US11204322B2 (en) * | 2016-06-20 | 2021-12-21 | Plair S.a. | Device and method for detecting and/or characterizing fluid-borne particles |
| WO2018105462A1 (en) * | 2016-12-08 | 2018-06-14 | 東京エレクトロン株式会社 | Signal processing method and program |
| JP7054343B2 (en) * | 2017-12-26 | 2022-04-13 | 川崎重工業株式会社 | Dispensing device and dispensing method |
| CN111060443B (en) * | 2019-12-24 | 2022-09-30 | 深圳开立生物医疗科技股份有限公司 | Interference pulse identification method and device, storage medium and cell counting equipment |
| CN113340894B (en) * | 2021-05-28 | 2023-04-07 | 上海睿钰生物科技有限公司 | Detection method of non-transparent particles |
| CN115046926A (en) * | 2022-06-29 | 2022-09-13 | 湖南超亟检测技术有限责任公司 | Scanning identification method and scanning identification system based on grouped in-line gratings |
Citations (65)
| Publication number | Priority date | Publication date | Assignee | Title |
|---|---|---|---|---|
| US4251733A (en) | 1978-06-29 | 1981-02-17 | Hirleman Jr Edwin D | Technique for simultaneous particle size and velocity measurement |
| JPH04337446A (en) | 1991-05-15 | 1992-11-25 | Hitachi Ltd | Method and device for measuring fine grain and constant quantity method |
| US5319575A (en) * | 1991-01-22 | 1994-06-07 | Trc Companies, Inc. | System and method for determining and outputting airborne particle concentration |
| WO1998016814A1 (en) | 1996-10-12 | 1998-04-23 | Evotec Biosystems Ag | Method of analysis of samples by determination of a function of specific brightness |
| US5866336A (en) | 1996-07-16 | 1999-02-02 | Oncor, Inc. | Nucleic acid amplification oligonucleotides with molecular energy transfer labels and methods based thereon |
| WO1999047963A1 (en) | 1998-03-16 | 1999-09-23 | Praelux Incorporated | Confocal microscopy imaging system |
| WO2000066985A1 (en) | 1999-04-29 | 2000-11-09 | Evotec Biosystems Ag | A method of characterizing fluorescent molecules or other particles using generating functions |
| WO2000071991A1 (en) | 1999-05-25 | 2000-11-30 | Biometric Imaging, Inc. | Apparatus and method for optical detection in a limited depth of field |
| US6280960B1 (en) | 1997-06-13 | 2001-08-28 | Robert Carr | Optical detection and analysis of sub-micron particles |
| US20010035954A1 (en) | 2000-03-10 | 2001-11-01 | Rahn John Richard | Method and apparatus for measuring particle size distributions using light scattering |
| US20020008211A1 (en) | 2000-02-10 | 2002-01-24 | Peet Kask | Fluorescence intensity multiple distributions analysis: concurrent determination of diffusion times and molecular brightness |
| WO2002012864A1 (en) | 2000-08-08 | 2002-02-14 | Carl Zeiss Jena Gmbh | Method and assembly for increasing the spectral and spatial resolution of a detector |
| US20020036775A1 (en) | 2000-08-08 | 2002-03-28 | Carl Zeiss Jena Gmbh | Method for increasing the spectral and spatial resolution of detectors |
| US6376843B1 (en) | 1999-06-23 | 2002-04-23 | Evotec Oai Ag | Method of characterizing fluorescent molecules or other particles using generating functions |
| US6388788B1 (en) | 1998-03-16 | 2002-05-14 | Praelux, Inc. | Method and apparatus for screening chemical compounds |
| US6388746B1 (en) | 1998-02-06 | 2002-05-14 | Cellectricon Ab | Method, apparatus and flow cell for high-sensitivity detection of fluorescent molecules |
| US6403338B1 (en) | 1997-04-04 | 2002-06-11 | Mountain View | Microfluidic systems and methods of genotyping |
| JP2002318188A (en) | 2001-01-02 | 2002-10-31 | Becton Dickinson & Co | Measuring method of volume of particle in liquid |
| US20030036855A1 (en) | 1998-03-16 | 2003-02-20 | Praelux Incorporated, A Corporation Of New Jersey | Method and apparatus for screening chemical compounds |
| US20030218746A1 (en) | 2002-05-21 | 2003-11-27 | Sampas Nicholas M. | Imaging systems for signals on a surface |
| US20040022684A1 (en) | 2000-07-20 | 2004-02-05 | Katrin Heinze | Method and device for multicolour 2-photon fluorescence coincidence analysis |
| US20040051051A1 (en) | 2000-12-14 | 2004-03-18 | Olympus Optical Co., Ltd. | Fluorescence analysis apparatus and fluorescence analysis method |
| US6710871B1 (en) | 1997-06-09 | 2004-03-23 | Guava Technologies, Inc. | Method and apparatus for detecting microparticles in fluid samples |
| US20040150880A1 (en) | 2002-12-27 | 2004-08-05 | Olympus Corporation | Confocal microscope |
| US6782297B2 (en) | 2001-05-24 | 2004-08-24 | Eric Paul Tabor | Methods and apparatus for data smoothing |
| US6856391B2 (en) | 2000-11-17 | 2005-02-15 | Garab Gyozo | Method and apparatus for determining the polarization properties of light emitted, reflected or transmitted by a material using a laser scanning microscope |
| JP2005099662A (en) | 2002-12-27 | 2005-04-14 | Olympus Corp | Confocal microscope |
| JP2005098876A (en) | 2003-09-25 | 2005-04-14 | Institute Of Physical & Chemical Research | Analytical method of analyzing interaction between two components |
| US20050130122A1 (en) | 2002-12-09 | 2005-06-16 | Advanced Fluidix Laboratories, Llc | Male fertility assay method and device |
| US20050260660A1 (en) | 2002-11-07 | 2005-11-24 | Erasmus Universiteit Rotterdam | FRET probes and methods for detecting interacting molecules |
| US20060078998A1 (en) | 2004-09-28 | 2006-04-13 | Singulex, Inc. | System and methods for sample analysis |
| WO2006084283A2 (en) | 2005-01-31 | 2006-08-10 | The Board Of Trustees Of The University Of Illinois | Methods and devices for characterizing particles in clear and turbid media |
| WO2007010803A1 (en) | 2005-07-15 | 2007-01-25 | Olympus Corporation | Light measuring instrument |
| JP2007020565A (en) | 2005-06-13 | 2007-02-01 | Kansai Bunri Sogo Gakuen | Method and system for detecting virus in specimen |
| WO2007118209A2 (en) | 2006-04-07 | 2007-10-18 | Kim Laboratories | Apparatus and method for rapid detection of analytes |
| WO2007147159A2 (en) | 2006-06-16 | 2007-12-21 | Cornell Research Foundation, Inc. | Functional nucleic acid ligands to fluorescent proteins |
| WO2008007580A1 (en) | 2006-07-13 | 2008-01-17 | Olympus Corporation | Method for analyzing fine particles |
| US20080052009A1 (en) | 2006-08-23 | 2008-02-28 | Washington, University Of | Method for deconvolving single-molecule intensity distributions for quantitative biological measurements |
| US20080067133A1 (en) | 2006-09-18 | 2008-03-20 | Bryant Robert L | Method for selectively sampling particulates in boiler/steam cycle corrosion transport |
| JP2008116440A (en) | 2006-10-13 | 2008-05-22 | Shiga Pref Gov | Method and system for detecting fluorescent substance in sample |
| US20080158561A1 (en) | 2006-12-29 | 2008-07-03 | Abbott Laboratories | Method and apparatus for rapidly counting and identifying biological particles in a flow stream |
| JP2008523376A (en) | 2004-12-10 | 2008-07-03 | ジーイー・ヘルスケア・ユーケイ・リミテッド | Biological imaging method, and apparatus and computer software therefor |
| WO2008080417A1 (en) | 2006-12-28 | 2008-07-10 | Flult Biosystems Gmbh | A method of determining characteristic properties of a sample containing particles |
| JP2008292371A (en) | 2007-05-25 | 2008-12-04 | Institute Of Physical & Chemical Research | Method for analyzing interaction by a plurality of components by fluorescence correlated spectroscopy and method for screening compound for controlling interaction |
| US20090159812A1 (en) | 2007-12-19 | 2009-06-25 | Singulex, Inc | Scanning analyzer for single molecule detection and methods of use |
| JP2009145242A (en) | 2007-12-14 | 2009-07-02 | Olympus Corp | Light measuring device |
| CN101503734A (en) | 2008-11-27 | 2009-08-12 | 苏州纳米技术与纳米仿生研究所 | Biomolecular high-sensitivity detecting method |
| WO2009106322A1 (en) | 2008-02-29 | 2009-09-03 | Eberhard-Karls-Universitaet Tuebingen | Method for the enrichment or analysis of dna fragments from a complex genomic dna sample |
| JP2009281831A (en) | 2008-05-21 | 2009-12-03 | Hamamatsu Photonics Kk | Fluorescence analyzer and analysis method |
| JP2009288161A (en) | 2008-05-30 | 2009-12-10 | Olympus Corp | Optical measurement apparatus and optical measurement method |
| US20100033718A1 (en) | 1999-05-28 | 2010-02-11 | Yokogawa Electric Corporation | Biochip reader and electrophoresis system |
| US20100177190A1 (en) | 2008-12-16 | 2010-07-15 | Ann-Shyn Chiang | Microscopy system with revolvable stage |
| US20100202043A1 (en) | 2007-02-14 | 2010-08-12 | Nikon Corporation | Slit-scanning confocal microscope |
| JP2010190730A (en) | 2009-02-18 | 2010-09-02 | Olympus Corp | Method of correlation spectroscopic analysis and device for correlation spectroscopic analysis |
| WO2010119098A1 (en) | 2009-04-15 | 2010-10-21 | Stefan Wennmalm | Inverse-fluorescence correlation spectroscopy |
| JP2011002415A (en) | 2009-06-22 | 2011-01-06 | Olympus Corp | Fluorescence correlation spectroscopic device |
| WO2011108370A1 (en) | 2010-03-01 | 2011-09-09 | オリンパス株式会社 | Optical analysis device, optical analysis method, and computer program for optical analysis |
| WO2012039352A1 (en) | 2010-09-21 | 2012-03-29 | オリンパス株式会社 | Photometric analysis method using single light-emitting particle detection |
| US8284484B2 (en) | 2006-09-14 | 2012-10-09 | PerkinElmer Singapore PTE, Ltd. | Relating to scanning confocal microscopy |
| WO2013031309A1 (en) | 2011-08-26 | 2013-03-07 | オリンパス株式会社 | Single-particle detector using optical analysis, single-particle detection method using same, and computer program for single-particle detection |
| US20130302906A1 (en) | 2011-01-20 | 2013-11-14 | Olympus Corporation | Optical analysis method and optical analysis device using the detection of light from a single light-emitting particle |
| EP2840381A1 (en) | 2012-04-18 | 2015-02-25 | Olympus Corporation | Method for detecting target particles |
| US9068944B2 (en) * | 2011-04-13 | 2015-06-30 | Olympus Corporation | Optical analysis device, optical analysis method and computer program for optical analysis using single light-emitting particle detection |
| US20150218628A1 (en) | 2012-10-25 | 2015-08-06 | Olympus Corporation | Target particle determining method |
| US9188535B2 (en) | 2012-04-18 | 2015-11-17 | Olympus Corporation | Single particle detection device, single particle detection method, and computer program for single particle detection, using optical analysis |
Family Cites Families (2)
| Publication number | Priority date | Publication date | Assignee | Title |
|---|---|---|---|---|
| US4284355A (en) * | 1979-10-29 | 1981-08-18 | Ortho Diagnostics, Inc. | Automated method for cell volume determination |
| US20040090613A1 (en) * | 2002-07-17 | 2004-05-13 | Goix Philippe J. | Method for measuring the volume of cells or particles |
-
2012
- 2012-05-23 JP JP2013531130A patent/JP6010033B2/en active Active
- 2012-05-23 CN CN201280041717.XA patent/CN103765195B/en active Active
- 2012-05-23 WO PCT/JP2012/063139 patent/WO2013031309A1/en unknown
- 2012-05-23 EP EP12828640.8A patent/EP2749868B1/en active Active
-
2014
- 2014-01-23 US US14/162,142 patent/US9488578B2/en active Active
-
2016
- 2016-05-11 US US15/151,524 patent/US20160252456A1/en not_active Abandoned
Patent Citations (85)
| Publication number | Priority date | Publication date | Assignee | Title |
|---|---|---|---|---|
| US4251733A (en) | 1978-06-29 | 1981-02-17 | Hirleman Jr Edwin D | Technique for simultaneous particle size and velocity measurement |
| US5319575A (en) * | 1991-01-22 | 1994-06-07 | Trc Companies, Inc. | System and method for determining and outputting airborne particle concentration |
| JPH04337446A (en) | 1991-05-15 | 1992-11-25 | Hitachi Ltd | Method and device for measuring fine grain and constant quantity method |
| US5308990A (en) | 1991-05-15 | 1994-05-03 | Hitachi, Ltd. | Method for measuring microparticles, quantitative measuring method therefor and instrument for measuring microparticles |
| US5866336A (en) | 1996-07-16 | 1999-02-02 | Oncor, Inc. | Nucleic acid amplification oligonucleotides with molecular energy transfer labels and methods based thereon |
| JP4023523B2 (en) | 1996-10-12 | 2007-12-19 | オリンパス株式会社 | How to analyze samples by determining specific brightness function |
| WO1998016814A1 (en) | 1996-10-12 | 1998-04-23 | Evotec Biosystems Ag | Method of analysis of samples by determination of a function of specific brightness |
| US6403338B1 (en) | 1997-04-04 | 2002-06-11 | Mountain View | Microfluidic systems and methods of genotyping |
| US6710871B1 (en) | 1997-06-09 | 2004-03-23 | Guava Technologies, Inc. | Method and apparatus for detecting microparticles in fluid samples |
| US6280960B1 (en) | 1997-06-13 | 2001-08-28 | Robert Carr | Optical detection and analysis of sub-micron particles |
| US6388746B1 (en) | 1998-02-06 | 2002-05-14 | Cellectricon Ab | Method, apparatus and flow cell for high-sensitivity detection of fluorescent molecules |
| US6400487B1 (en) | 1998-03-16 | 2002-06-04 | Praelux, Inc. | Method and apparatus for screening chemical compounds |
| JP2002507762A (en) | 1998-03-16 | 2002-03-12 | プリーラックス・インコーポレイテッド | Confocal microscope imaging system |
| US6388788B1 (en) | 1998-03-16 | 2002-05-14 | Praelux, Inc. | Method and apparatus for screening chemical compounds |
| US20030036855A1 (en) | 1998-03-16 | 2003-02-20 | Praelux Incorporated, A Corporation Of New Jersey | Method and apparatus for screening chemical compounds |
| WO1999047963A1 (en) | 1998-03-16 | 1999-09-23 | Praelux Incorporated | Confocal microscopy imaging system |
| US6927401B1 (en) | 1999-04-29 | 2005-08-09 | Evotec Oai Ag | Method of characterizing fluorescent molecules or other particles using generating functions |
| WO2000066985A1 (en) | 1999-04-29 | 2000-11-09 | Evotec Biosystems Ag | A method of characterizing fluorescent molecules or other particles using generating functions |
| JP2002543414A (en) | 1999-04-29 | 2002-12-17 | エボテック オーアーイー アクチェンゲゼルシャフト | Method of characterizing fluorescent molecules or other particles using generation functions |
| WO2000071991A1 (en) | 1999-05-25 | 2000-11-30 | Biometric Imaging, Inc. | Apparatus and method for optical detection in a limited depth of field |
| US20100033718A1 (en) | 1999-05-28 | 2010-02-11 | Yokogawa Electric Corporation | Biochip reader and electrophoresis system |
| US6376843B1 (en) | 1999-06-23 | 2002-04-23 | Evotec Oai Ag | Method of characterizing fluorescent molecules or other particles using generating functions |
| US20020008211A1 (en) | 2000-02-10 | 2002-01-24 | Peet Kask | Fluorescence intensity multiple distributions analysis: concurrent determination of diffusion times and molecular brightness |
| US20010035954A1 (en) | 2000-03-10 | 2001-11-01 | Rahn John Richard | Method and apparatus for measuring particle size distributions using light scattering |
| US20040022684A1 (en) | 2000-07-20 | 2004-02-05 | Katrin Heinze | Method and device for multicolour 2-photon fluorescence coincidence analysis |
| JP2004506192A (en) | 2000-08-08 | 2004-02-26 | カール ツァイス イエナ ゲゼルシャフト ミット ベシュレンクテル ハフツング | Method for increasing the spectroscopic and spatial resolution of a detector |
| WO2002012864A1 (en) | 2000-08-08 | 2002-02-14 | Carl Zeiss Jena Gmbh | Method and assembly for increasing the spectral and spatial resolution of a detector |
| US20020036775A1 (en) | 2000-08-08 | 2002-03-28 | Carl Zeiss Jena Gmbh | Method for increasing the spectral and spatial resolution of detectors |
| US6856391B2 (en) | 2000-11-17 | 2005-02-15 | Garab Gyozo | Method and apparatus for determining the polarization properties of light emitted, reflected or transmitted by a material using a laser scanning microscope |
| US20040051051A1 (en) | 2000-12-14 | 2004-03-18 | Olympus Optical Co., Ltd. | Fluorescence analysis apparatus and fluorescence analysis method |
| JP2002318188A (en) | 2001-01-02 | 2002-10-31 | Becton Dickinson & Co | Measuring method of volume of particle in liquid |
| US6782297B2 (en) | 2001-05-24 | 2004-08-24 | Eric Paul Tabor | Methods and apparatus for data smoothing |
| US20030218746A1 (en) | 2002-05-21 | 2003-11-27 | Sampas Nicholas M. | Imaging systems for signals on a surface |
| US20050260660A1 (en) | 2002-11-07 | 2005-11-24 | Erasmus Universiteit Rotterdam | FRET probes and methods for detecting interacting molecules |
| US20050130122A1 (en) | 2002-12-09 | 2005-06-16 | Advanced Fluidix Laboratories, Llc | Male fertility assay method and device |
| US20040150880A1 (en) | 2002-12-27 | 2004-08-05 | Olympus Corporation | Confocal microscope |
| US20060158721A1 (en) | 2002-12-27 | 2006-07-20 | Olympus Optical Co., Ltd | Confocal microscope |
| JP2005099662A (en) | 2002-12-27 | 2005-04-14 | Olympus Corp | Confocal microscope |
| JP2005098876A (en) | 2003-09-25 | 2005-04-14 | Institute Of Physical & Chemical Research | Analytical method of analyzing interaction between two components |
| US20060078998A1 (en) | 2004-09-28 | 2006-04-13 | Singulex, Inc. | System and methods for sample analysis |
| JP2008523376A (en) | 2004-12-10 | 2008-07-03 | ジーイー・ヘルスケア・ユーケイ・リミテッド | Biological imaging method, and apparatus and computer software therefor |
| WO2006084283A2 (en) | 2005-01-31 | 2006-08-10 | The Board Of Trustees Of The University Of Illinois | Methods and devices for characterizing particles in clear and turbid media |
| US20060256338A1 (en) | 2005-01-31 | 2006-11-16 | The Board Of Trustees Of The University Of Iilinois | Methods and devices for characterizing particles in clear and turbid media |
| JP2008536093A (en) | 2005-01-31 | 2008-09-04 | ザ ボード オブ トラスティーズ オブ ザ ユニヴァーシティー オブ イリノイ | Method and device for characterizing particles in transparent and suspending media |
| JP2007020565A (en) | 2005-06-13 | 2007-02-01 | Kansai Bunri Sogo Gakuen | Method and system for detecting virus in specimen |
| EP1906172A1 (en) | 2005-07-15 | 2008-04-02 | Olympus Corporation | Light measuring instrument |
| WO2007010803A1 (en) | 2005-07-15 | 2007-01-25 | Olympus Corporation | Light measuring instrument |
| WO2007118209A2 (en) | 2006-04-07 | 2007-10-18 | Kim Laboratories | Apparatus and method for rapid detection of analytes |
| WO2007147159A2 (en) | 2006-06-16 | 2007-12-21 | Cornell Research Foundation, Inc. | Functional nucleic acid ligands to fluorescent proteins |
| WO2008007580A1 (en) | 2006-07-13 | 2008-01-17 | Olympus Corporation | Method for analyzing fine particles |
| US20080052009A1 (en) | 2006-08-23 | 2008-02-28 | Washington, University Of | Method for deconvolving single-molecule intensity distributions for quantitative biological measurements |
| US8284484B2 (en) | 2006-09-14 | 2012-10-09 | PerkinElmer Singapore PTE, Ltd. | Relating to scanning confocal microscopy |
| US20080067133A1 (en) | 2006-09-18 | 2008-03-20 | Bryant Robert L | Method for selectively sampling particulates in boiler/steam cycle corrosion transport |
| JP2008116440A (en) | 2006-10-13 | 2008-05-22 | Shiga Pref Gov | Method and system for detecting fluorescent substance in sample |
| WO2008080417A1 (en) | 2006-12-28 | 2008-07-10 | Flult Biosystems Gmbh | A method of determining characteristic properties of a sample containing particles |
| US20080158561A1 (en) | 2006-12-29 | 2008-07-03 | Abbott Laboratories | Method and apparatus for rapidly counting and identifying biological particles in a flow stream |
| US20100202043A1 (en) | 2007-02-14 | 2010-08-12 | Nikon Corporation | Slit-scanning confocal microscope |
| JP2008292371A (en) | 2007-05-25 | 2008-12-04 | Institute Of Physical & Chemical Research | Method for analyzing interaction by a plurality of components by fluorescence correlated spectroscopy and method for screening compound for controlling interaction |
| JP2009145242A (en) | 2007-12-14 | 2009-07-02 | Olympus Corp | Light measuring device |
| US20090159812A1 (en) | 2007-12-19 | 2009-06-25 | Singulex, Inc | Scanning analyzer for single molecule detection and methods of use |
| WO2009117033A2 (en) | 2007-12-19 | 2009-09-24 | Singulex, Inc. | Scanning analyzer for single molecule detection and methods of use |
| JP2011508219A (en) | 2007-12-19 | 2011-03-10 | シンギュレックス・インコーポレイテッド | Single molecule scanning analyzer and method of use thereof |
| WO2009106322A1 (en) | 2008-02-29 | 2009-09-03 | Eberhard-Karls-Universitaet Tuebingen | Method for the enrichment or analysis of dna fragments from a complex genomic dna sample |
| JP2009281831A (en) | 2008-05-21 | 2009-12-03 | Hamamatsu Photonics Kk | Fluorescence analyzer and analysis method |
| JP2009288161A (en) | 2008-05-30 | 2009-12-10 | Olympus Corp | Optical measurement apparatus and optical measurement method |
| CN101503734A (en) | 2008-11-27 | 2009-08-12 | 苏州纳米技术与纳米仿生研究所 | Biomolecular high-sensitivity detecting method |
| US20100177190A1 (en) | 2008-12-16 | 2010-07-15 | Ann-Shyn Chiang | Microscopy system with revolvable stage |
| JP2010190730A (en) | 2009-02-18 | 2010-09-02 | Olympus Corp | Method of correlation spectroscopic analysis and device for correlation spectroscopic analysis |
| WO2010119098A1 (en) | 2009-04-15 | 2010-10-21 | Stefan Wennmalm | Inverse-fluorescence correlation spectroscopy |
| JP2011002415A (en) | 2009-06-22 | 2011-01-06 | Olympus Corp | Fluorescence correlation spectroscopic device |
| US8541759B2 (en) * | 2010-03-01 | 2013-09-24 | Olympus Corporation | Optical analysis device, optical analysis method and computer program for optical analysis |
| WO2011108370A1 (en) | 2010-03-01 | 2011-09-09 | オリンパス株式会社 | Optical analysis device, optical analysis method, and computer program for optical analysis |
| WO2011108369A1 (en) | 2010-03-01 | 2011-09-09 | オリンパス株式会社 | Optical analysis device, optical analysis method, and computer program for optical analysis |
| WO2011108371A1 (en) | 2010-03-01 | 2011-09-09 | オリンパス株式会社 | Optical analysis device, optical analysis method, and computer program for optical analysis |
| US8710413B2 (en) * | 2010-03-01 | 2014-04-29 | Olympus Corporation | Optical analysis device, optical analysis method and computer program for optical analysis |
| US8471220B2 (en) * | 2010-03-01 | 2013-06-25 | Olympus Corporation | Optical analysis device, optical analysis method and computer program for optical analysis |
| WO2012039352A1 (en) | 2010-09-21 | 2012-03-29 | オリンパス株式会社 | Photometric analysis method using single light-emitting particle detection |
| US8680485B2 (en) | 2010-09-21 | 2014-03-25 | Olympus Corporation | Optical analysis method using the detection of a single light-emitting particle |
| US20130302906A1 (en) | 2011-01-20 | 2013-11-14 | Olympus Corporation | Optical analysis method and optical analysis device using the detection of light from a single light-emitting particle |
| US9068944B2 (en) * | 2011-04-13 | 2015-06-30 | Olympus Corporation | Optical analysis device, optical analysis method and computer program for optical analysis using single light-emitting particle detection |
| WO2013031309A1 (en) | 2011-08-26 | 2013-03-07 | オリンパス株式会社 | Single-particle detector using optical analysis, single-particle detection method using same, and computer program for single-particle detection |
| US20140134608A1 (en) | 2011-08-26 | 2014-05-15 | Olympus Corporation | Single particle detection device, single particle detection method, and computer program for single particle detection, using optical analysis |
| EP2840381A1 (en) | 2012-04-18 | 2015-02-25 | Olympus Corporation | Method for detecting target particles |
| US9188535B2 (en) | 2012-04-18 | 2015-11-17 | Olympus Corporation | Single particle detection device, single particle detection method, and computer program for single particle detection, using optical analysis |
| US20150218628A1 (en) | 2012-10-25 | 2015-08-06 | Olympus Corporation | Target particle determining method |
Non-Patent Citations (53)
| Title |
|---|
| Carlsson, K. et al., "Three-dimensional Microscopy Using a Confocal Laser Scanning Microscope", Optics Letters, Optical Society of America, Feb. 1985, vol. 10, No. 2, p. 53-55, XP007922413. |
| Chinese Office Action dated Aug. 13, 2013, issued in related Chinese application No. 201180011655.3; w/ English Translation (16 pages). |
| Chinese Office Action dated Aug. 3, 2016, issued in related Chinese application No. 201280041717.X; with English Translation. |
| Chinese Office Action dated Aug. 9, 2013, issued in related Chinese application No. 201180011640.7; w/ English Translation (16 pages). |
| Chinese Office Action dated Feb. 7, 2013, issued in related Chinese application No. 201180011644.5; w/ English Translation (18 pages). |
| English translation of Written Opinion by ISA of International Application No. PCT/JP2013/056600 (Form PCT/ISA/237) mailed Jun. 18, 2013 with ISR (Form PCT/ISA/210) (6 pages). |
| Extended (Supplementary) European Search Report (EESR) dated May 27, 2016, issued in counterpart European Patent Application No. 13849687.2. (6 pages). |
| Extended European Search Report dated Mar. 28, 2013, issued in related EP application No. 11750481.1. |
| Extended European Search Report dated Oct. 20, 2014, issued in related EP Application No. 12770835.2 (10 pages). |
| Extended European Search Report dated Oct. 26, 2015, issued in counterpart European Patent Application No. 13777928.6 (7 pages). |
| Final Office Action dated Sep. 28, 2015, issued in U.S. Appl. No. 13/746,968 (24 pages). |
| Final Office Action dated Sep. 29, 2015, issued in U.S. Appl. No. 13/946,091 (23 pages). |
| Goodwin, Peter et al., "Rapid Sizing of Individual Fluorescently Stained DNA Fragments by Flow Cytometry," Nucleic Acids Research, 1993, vol. 21, No. 4 (p. 803-806). |
| International Preliminary Report on Patentability (PCT/IPEA/409) issued in related PCT/JP2011/053481, Jun. 15, 2012. |
| International Preliminary Report on Patentability (PCT/IPEA/409) issued in related PCT/JP2011/053482 Mar. 3, 2012. |
| International Preliminary Report on Patentability (PCT/IPEA/409) issued in related PCT/JP2011/053483, Mar. 30, 2012. |
| International Search Report dated Apr. 16, 2013, issued in related PCT/JP2013/050025. |
| International Search Report dated Jun. 18, 2013, issued in related PCT/JP2013/056600. |
| International Search Report dated Mar. 29, 2011, issued in related PCT/JP2011/053481. |
| International Search Report dated Mar. 29, 2011, issued in related PCT/JP2011/053483. |
| International Search Report dated Nov. 29, 2011, issued in related PCT/JP2011/072939. |
| International search Report for PCT/JP2012/063139, Mailing Date of Jul. 24, 2012. |
| International Search Report for PCT/JP2013/052110, mailing date of May 7, 2013. |
| International Search Report for PCT/JP2013/068406, mailing date of Oct. 15, 2013. |
| International Search Report Mar. 29, 2011, issued in related PCT/JP2011/053482. |
| Itoh et al., "A New Method for Detection of Influenza Viruses by Single Particle-Recognition Based on the Principle of Fluorescence Correlation Spectroscopy," Chemistry and Biology, 2009, vol. 47, No. 12, (p. 823-830). |
| Japanese Office Action dated Dec. 18, 2012 issued in related JP application No. 2012-503060; w/ English Translation (6 pages). |
| Kask, Peet et al., "Two-Dimensional Fluorescence Intensity Distribution Analysis: Theory and Applications", Biophysical Journal, Apr. 2000, vol. 78, (p. 1703-1713). |
| Katoh, Noriko et al., "A single molecule analyzer that enable new analysis of DNA and protein interaction", Genetic Medicine, 2002, vol. 6, No. 2, pp. 271-277. |
| Keller, Richard et al., "Single-Molecule Fluorescence Analysis in Solution," Applied Spectroscopy, 1996, vol. 50, No. 7, (p. 12A-32A). |
| Kinjo, Masataka, "Single molecule protein, nucleic acid, and enzyme assays and their procedures; Single molecule detection by fluorescence correlation spectroscopy", Proteins, Nucleic Acids and Enzymes, 1999, vol. 44, No. 9, pp. 1431-1438, w/ English translation. |
| Lee, Yuan-Hsiang et al., "Laser-Induced Fluorescence Detection of a Single Molecule in a Capillary," Analytical Chemistry, dated Dec. 1, 1994, vol. 66, No. 23, (p. 4142-4149). |
| Li, Haitao et al., "Ultrasensitive Coincidence Fluorescence Detection of Single DNA Molecules," Analytical Chemistry, dated Apr. 1, 2003, vol. 75, No. 7, (p. 1664-1670). |
| Meyer-Almes, F.J., "Nanoparticle Immunoassays: A new Method for Use in Molecular Diagnostics and High Throughput Pharmaceutical Screening based on Fluorescence Correlation Spectroscopy", edit. R. Rigler, Springer, Berlin, 2000, pp. 204-224. |
| Nie, Shuming et al., "Probing Individual Molecules with Confocal Fluorescence Microscopy," Science, dated Nov. 11, 1994, vol. 266, (p. 1018-1021). |
| Office Action dated Jan. 27, 2016, issued in Chinese Patent Application No. 201280041717.X, w/English translation. |
| Office Action dated Jun. 1, 2015, issued in counterpart Chinese Patent Application No. 201280041717.X, w/English translation (26 pages). |
| Office Action dated Mar. 22, 2016, issued in Japanese Patent Application No. 2013-531130, w/English translation. |
| P. Kask et al., "Fluorescence-intensity distribution analysis and its application in biomolecular detection technology", PNAS, Nov. 23, 1999, vol. 96, No. 24, pp. 13756-13761. |
| Park, Mira et al., "Counting the Number of Fluorophores Labeled in Biomolecules by Observing the Fluorescence-Intensity Transient of a Single Molecule" Bulletin of the Chemical Society of Japan, dated Aug. 30, 2005, vol. 78, No. 9, (p. 1612-1618). |
| Related co-pending U.S. Appl. No. 14/465,208. |
| Related co-pending U.S. Appl. No. 14/496,177. |
| SupplementaryEuropean Search Report dated Apr. 23, 2015, issued in related European Patent Application No. 12828640.8 (16 pages). |
| Tahari, Abdel. "Fluorescence Correlation Spectroscopy: Ultrasensitive Detection in Clear and Turbid Media," University of Illinois, 2006, (p. 1-88). |
| U.S. Non-Final Office Action dated May 11, 2016, issued in U.S. Appl. No. 14/465,208. |
| U.S. Notice of Allowance dated Mar. 27, 2013, issued in related U.S. Appl. No. 13/597,825 (8 pages). |
| U.S. Office Action dated Apr. 2, 2013, issued in related U.S. Appl. No. 13/596,280. |
| U.S. Office Action dated Feb. 9, 2015, issued in U.S. Appl. No. 14/496,177 (7 pages). |
| U.S. Office Action dated Jan. 3, 2013, issued in related U.S. Appl. No. 13/597,825. |
| U.S. Office Action dated Oct. 4, 2013, issued in related U.S. Appl. No. 13/596,243. |
| Wennmalm et al., "Inverse-Fluorescence Cross-Correlation Spectroscopy," Analytical Chemistry, vol. 82, No. 13, Jul. 1, 2010, pp. 5646-5651 (6 pages). |
| With English translation of Chinese Office Action dated Dec. 2, 2015, issued in related Chinese Patent Application No. 201380020726.5. |
| Wu, Alan et al., "Development and Preliminary Clinical Validation of a High Sensitivity Assay for Cardiac Troponin Using a Capillary Flow (Single Molecule) Fluorescence Detector," Clinical Chemistry, 2006, vol. 52, No. 11, (p. 2157-2159). |
Cited By (1)
| Publication number | Priority date | Publication date | Assignee | Title |
|---|---|---|---|---|
| US20160252456A1 (en) * | 2011-08-26 | 2016-09-01 | Olympus Corporation | Single particle detection device, single particle detection method, and computer program for single particle detection, using optical analysis |
Also Published As
| Publication number | Publication date |
|---|---|
| CN103765195B (en) | 2018-06-01 |
| EP2749868A1 (en) | 2014-07-02 |
| EP2749868B1 (en) | 2019-02-27 |
| JP6010033B2 (en) | 2016-10-19 |
| US20140134608A1 (en) | 2014-05-15 |
| US20160252456A1 (en) | 2016-09-01 |
| WO2013031309A1 (en) | 2013-03-07 |
| JPWO2013031309A1 (en) | 2015-03-23 |
| EP2749868A4 (en) | 2015-05-27 |
| CN103765195A (en) | 2014-04-30 |
Similar Documents
| Publication | Publication Date | Title |
|---|---|---|
| US9488578B2 (en) | Single particle detection device, single particle detection method, and computer program for single particle detection, using optical analysis | |
| US8541759B2 (en) | Optical analysis device, optical analysis method and computer program for optical analysis | |
| US9435727B2 (en) | Optical analysis device, optical analysis method and computer program for optical analysis using single light-emitting particle detection | |
| US9188535B2 (en) | Single particle detection device, single particle detection method, and computer program for single particle detection, using optical analysis | |
| US9068944B2 (en) | Optical analysis device, optical analysis method and computer program for optical analysis using single light-emitting particle detection | |
| US9863806B2 (en) | Optical analysis method and optical analysis device using the detection of light from a single light-emitting particle | |
| US8680485B2 (en) | Optical analysis method using the detection of a single light-emitting particle | |
| EP2749867B1 (en) | Optical analysing device and method using individual light-emitting particle detection | |
| US20140231619A1 (en) | Optical analysis device, optical analysis method and computer program for optical analysis using single light-emitting particle detection | |
| US9528923B2 (en) | Optical analysis device, optical analysis method and computer program for optical analysis using single light-emitting particle detection | |
| US9103718B2 (en) | Optical analysis device and optical analysis method using a wavelength characteristic of light of a single light-emitting particle |
Legal Events
| Date | Code | Title | Description |
|---|---|---|---|
| AS | Assignment |
Owner name: OLYMPUS CORPORATION, JAPAN Free format text: ASSIGNMENT OF ASSIGNORS INTEREST;ASSIGNORS:HANASHI, TAKUYA;TANABE, TETSUYA;REEL/FRAME:032138/0749 Effective date: 20131118 |
|
| AS | Assignment |
Owner name: OLYMPUS CORPORATION, JAPAN Free format text: CHANGE OF ADDRESS;ASSIGNOR:OLYMPUS CORPORATION;REEL/FRAME:040223/0561 Effective date: 20160425 |
|
| STCF | Information on status: patent grant |
Free format text: PATENTED CASE |
|
| MAFP | Maintenance fee payment |
Free format text: PAYMENT OF MAINTENANCE FEE, 4TH YEAR, LARGE ENTITY (ORIGINAL EVENT CODE: M1551); ENTITY STATUS OF PATENT OWNER: LARGE ENTITY Year of fee payment: 4 |