US9528876B2 - Solid state broad band near-infrared light source - Google Patents
Solid state broad band near-infrared light source Download PDFInfo
- Publication number
- US9528876B2 US9528876B2 US14/860,259 US201514860259A US9528876B2 US 9528876 B2 US9528876 B2 US 9528876B2 US 201514860259 A US201514860259 A US 201514860259A US 9528876 B2 US9528876 B2 US 9528876B2
- Authority
- US
- United States
- Prior art keywords
- light source
- led
- light
- sapphire
- blue
- Prior art date
- Legal status (The legal status is an assumption and is not a legal conclusion. Google has not performed a legal analysis and makes no representation as to the accuracy of the status listed.)
- Active
Links
- 239000007787 solid Substances 0.000 title claims description 11
- 239000010980 sapphire Substances 0.000 claims abstract description 110
- 229910052594 sapphire Inorganic materials 0.000 claims abstract description 110
- 230000003287 optical effect Effects 0.000 claims abstract description 61
- 239000008393 encapsulating agent Substances 0.000 claims abstract description 35
- 239000000463 material Substances 0.000 claims abstract description 32
- 239000000843 powder Substances 0.000 claims abstract description 30
- 239000013078 crystal Substances 0.000 claims abstract description 10
- 238000004020 luminiscence type Methods 0.000 claims abstract description 6
- 238000001228 spectrum Methods 0.000 claims description 38
- 230000003595 spectral effect Effects 0.000 claims description 28
- 230000005540 biological transmission Effects 0.000 claims description 13
- 229910052782 aluminium Inorganic materials 0.000 claims description 11
- XAGFODPZIPBFFR-UHFFFAOYSA-N aluminium Chemical compound [Al] XAGFODPZIPBFFR-UHFFFAOYSA-N 0.000 claims description 11
- 238000005259 measurement Methods 0.000 claims description 11
- 238000012545 processing Methods 0.000 claims description 8
- 239000002096 quantum dot Substances 0.000 claims description 8
- 239000013307 optical fiber Substances 0.000 claims description 7
- 238000004611 spectroscopical analysis Methods 0.000 claims description 7
- 150000001875 compounds Chemical class 0.000 claims description 6
- 230000003321 amplification Effects 0.000 claims description 4
- 238000004458 analytical method Methods 0.000 claims description 4
- 239000010931 gold Substances 0.000 claims description 4
- 229910052737 gold Inorganic materials 0.000 claims description 4
- 238000000034 method Methods 0.000 claims description 4
- 238000003199 nucleic acid amplification method Methods 0.000 claims description 4
- PCHJSUWPFVWCPO-UHFFFAOYSA-N gold Chemical compound [Au] PCHJSUWPFVWCPO-UHFFFAOYSA-N 0.000 claims description 3
- 238000011002 quantification Methods 0.000 claims description 2
- 229910001404 rare earth metal oxide Inorganic materials 0.000 claims 2
- 238000013480 data collection Methods 0.000 claims 1
- 238000013500 data storage Methods 0.000 claims 1
- OAICVXFJPJFONN-UHFFFAOYSA-N Phosphorus Chemical compound [P] OAICVXFJPJFONN-UHFFFAOYSA-N 0.000 abstract description 28
- 230000005284 excitation Effects 0.000 abstract description 10
- 238000001055 reflectance spectroscopy Methods 0.000 abstract description 8
- 239000004593 Epoxy Substances 0.000 abstract description 5
- 229920001296 polysiloxane Polymers 0.000 abstract description 5
- 238000002188 infrared transmission spectroscopy Methods 0.000 abstract description 4
- 229910010272 inorganic material Inorganic materials 0.000 abstract description 3
- 239000011147 inorganic material Substances 0.000 abstract description 3
- 239000002131 composite material Substances 0.000 abstract description 2
- 230000004044 response Effects 0.000 abstract description 2
- 229910052736 halogen Inorganic materials 0.000 description 37
- 239000000523 sample Substances 0.000 description 35
- -1 tungsten halogen Chemical class 0.000 description 20
- 239000000835 fiber Substances 0.000 description 19
- 229910052721 tungsten Inorganic materials 0.000 description 19
- 239000010937 tungsten Substances 0.000 description 19
- 238000000295 emission spectrum Methods 0.000 description 15
- 238000005286 illumination Methods 0.000 description 15
- 229920000995 Spectralon Polymers 0.000 description 13
- 238000013461 design Methods 0.000 description 11
- RZVAJINKPMORJF-UHFFFAOYSA-N Acetaminophen Chemical compound CC(=O)NC1=CC=C(O)C=C1 RZVAJINKPMORJF-UHFFFAOYSA-N 0.000 description 9
- 229940079593 drug Drugs 0.000 description 9
- 239000003814 drug Substances 0.000 description 9
- 238000002835 absorbance Methods 0.000 description 8
- HEFNNWSXXWATRW-UHFFFAOYSA-N Ibuprofen Chemical compound CC(C)CC1=CC=C(C(C)C(O)=O)C=C1 HEFNNWSXXWATRW-UHFFFAOYSA-N 0.000 description 6
- 230000008878 coupling Effects 0.000 description 6
- 238000010168 coupling process Methods 0.000 description 6
- 238000005859 coupling reaction Methods 0.000 description 6
- 238000000862 absorption spectrum Methods 0.000 description 5
- 238000010586 diagram Methods 0.000 description 5
- 239000000975 dye Substances 0.000 description 5
- 229940072709 motrin Drugs 0.000 description 5
- 229940072651 tylenol Drugs 0.000 description 5
- 230000009102 absorption Effects 0.000 description 4
- 238000010521 absorption reaction Methods 0.000 description 4
- 238000004433 infrared transmission spectrum Methods 0.000 description 4
- 239000012071 phase Substances 0.000 description 4
- 238000005424 photoluminescence Methods 0.000 description 4
- 238000005070 sampling Methods 0.000 description 4
- 239000000203 mixture Substances 0.000 description 3
- 230000009103 reabsorption Effects 0.000 description 3
- 238000011896 sensitive detection Methods 0.000 description 3
- 230000001360 synchronised effect Effects 0.000 description 3
- 238000000411 transmission spectrum Methods 0.000 description 3
- 239000004698 Polyethylene Substances 0.000 description 2
- 238000000149 argon plasma sintering Methods 0.000 description 2
- 238000003491 array Methods 0.000 description 2
- UHYPYGJEEGLRJD-UHFFFAOYSA-N cadmium(2+);selenium(2-) Chemical compound [Se-2].[Cd+2] UHYPYGJEEGLRJD-UHFFFAOYSA-N 0.000 description 2
- 239000002178 crystalline material Substances 0.000 description 2
- 238000000695 excitation spectrum Methods 0.000 description 2
- 239000007850 fluorescent dye Substances 0.000 description 2
- 239000011521 glass Substances 0.000 description 2
- 238000002329 infrared spectrum Methods 0.000 description 2
- 239000004615 ingredient Substances 0.000 description 2
- 230000002452 interceptive effect Effects 0.000 description 2
- 238000000386 microscopy Methods 0.000 description 2
- 230000004048 modification Effects 0.000 description 2
- 238000012986 modification Methods 0.000 description 2
- 229960005489 paracetamol Drugs 0.000 description 2
- 239000004033 plastic Substances 0.000 description 2
- 229920003023 plastic Polymers 0.000 description 2
- 229920000573 polyethylene Polymers 0.000 description 2
- 229920000642 polymer Polymers 0.000 description 2
- 238000002310 reflectometry Methods 0.000 description 2
- 239000011343 solid material Substances 0.000 description 2
- 239000000126 substance Substances 0.000 description 2
- 238000002235 transmission spectroscopy Methods 0.000 description 2
- WQZGKKKJIJFFOK-GASJEMHNSA-N Glucose Natural products OC[C@H]1OC(O)[C@H](O)[C@@H](O)[C@@H]1O WQZGKKKJIJFFOK-GASJEMHNSA-N 0.000 description 1
- 238000004497 NIR spectroscopy Methods 0.000 description 1
- 229930006000 Sucrose Natural products 0.000 description 1
- 239000004809 Teflon Substances 0.000 description 1
- 229920006362 Teflon® Polymers 0.000 description 1
- 239000004480 active ingredient Substances 0.000 description 1
- AZDRQVAHHNSJOQ-UHFFFAOYSA-N alumane Chemical class [AlH3] AZDRQVAHHNSJOQ-UHFFFAOYSA-N 0.000 description 1
- LSQZJLSUYDQPKJ-NJBDSQKTSA-N amoxicillin Chemical group C1([C@@H](N)C(=O)N[C@H]2[C@H]3SC([C@@H](N3C2=O)C(O)=O)(C)C)=CC=C(O)C=C1 LSQZJLSUYDQPKJ-NJBDSQKTSA-N 0.000 description 1
- 229960003022 amoxicillin Drugs 0.000 description 1
- 239000011230 binding agent Substances 0.000 description 1
- 230000015556 catabolic process Effects 0.000 description 1
- 238000006243 chemical reaction Methods 0.000 description 1
- 229910001602 chrysoberyl Inorganic materials 0.000 description 1
- 238000010276 construction Methods 0.000 description 1
- 239000012611 container material Substances 0.000 description 1
- 238000001816 cooling Methods 0.000 description 1
- 238000006731 degradation reaction Methods 0.000 description 1
- 238000001514 detection method Methods 0.000 description 1
- 230000000694 effects Effects 0.000 description 1
- 230000008030 elimination Effects 0.000 description 1
- 238000003379 elimination reaction Methods 0.000 description 1
- 238000005538 encapsulation Methods 0.000 description 1
- 238000005516 engineering process Methods 0.000 description 1
- 239000008103 glucose Substances 0.000 description 1
- 238000009499 grossing Methods 0.000 description 1
- 229960001680 ibuprofen Drugs 0.000 description 1
- 238000010348 incorporation Methods 0.000 description 1
- 239000000976 ink Substances 0.000 description 1
- 229910052500 inorganic mineral Inorganic materials 0.000 description 1
- XCAUINMIESBTBL-UHFFFAOYSA-N lead(ii) sulfide Chemical compound [Pb]=S XCAUINMIESBTBL-UHFFFAOYSA-N 0.000 description 1
- 239000007788 liquid Substances 0.000 description 1
- 239000011344 liquid material Substances 0.000 description 1
- 239000007791 liquid phase Substances 0.000 description 1
- 239000011707 mineral Substances 0.000 description 1
- 238000002537 optical extinction spectroscopy Methods 0.000 description 1
- 238000000399 optical microscopy Methods 0.000 description 1
- LSQZJLSUYDQPKJ-UHFFFAOYSA-N p-Hydroxyampicillin Natural products O=C1N2C(C(O)=O)C(C)(C)SC2C1NC(=O)C(N)C1=CC=C(O)C=C1 LSQZJLSUYDQPKJ-UHFFFAOYSA-N 0.000 description 1
- 239000003973 paint Substances 0.000 description 1
- 230000000737 periodic effect Effects 0.000 description 1
- 239000004038 photonic crystal Substances 0.000 description 1
- 239000000049 pigment Substances 0.000 description 1
- 239000012254 powdered material Substances 0.000 description 1
- 230000008569 process Effects 0.000 description 1
- 229910052761 rare earth metal Inorganic materials 0.000 description 1
- 230000009467 reduction Effects 0.000 description 1
- 238000000985 reflectance spectrum Methods 0.000 description 1
- 239000010979 ruby Substances 0.000 description 1
- 229910001750 ruby Inorganic materials 0.000 description 1
- 239000004065 semiconductor Substances 0.000 description 1
- 238000000926 separation method Methods 0.000 description 1
- 230000035939 shock Effects 0.000 description 1
- 239000007790 solid phase Substances 0.000 description 1
- 229910001220 stainless steel Inorganic materials 0.000 description 1
- 239000010935 stainless steel Substances 0.000 description 1
- 239000005720 sucrose Substances 0.000 description 1
- 125000000185 sucrose group Chemical group 0.000 description 1
- 230000007704 transition Effects 0.000 description 1
- 229910052723 transition metal Inorganic materials 0.000 description 1
- 150000003624 transition metals Chemical class 0.000 description 1
- WFKWXMTUELFFGS-UHFFFAOYSA-N tungsten Chemical compound [W] WFKWXMTUELFFGS-UHFFFAOYSA-N 0.000 description 1
Images


Classifications
-
- G—PHYSICS
- G01—MEASURING; TESTING
- G01J—MEASUREMENT OF INTENSITY, VELOCITY, SPECTRAL CONTENT, POLARISATION, PHASE OR PULSE CHARACTERISTICS OF INFRARED, VISIBLE OR ULTRAVIOLET LIGHT; COLORIMETRY; RADIATION PYROMETRY
- G01J3/00—Spectrometry; Spectrophotometry; Monochromators; Measuring colours
- G01J3/02—Details
- G01J3/10—Arrangements of light sources specially adapted for spectrometry or colorimetry
- G01J3/108—Arrangements of light sources specially adapted for spectrometry or colorimetry for measurement in the infrared range
-
- G—PHYSICS
- G01—MEASURING; TESTING
- G01J—MEASUREMENT OF INTENSITY, VELOCITY, SPECTRAL CONTENT, POLARISATION, PHASE OR PULSE CHARACTERISTICS OF INFRARED, VISIBLE OR ULTRAVIOLET LIGHT; COLORIMETRY; RADIATION PYROMETRY
- G01J3/00—Spectrometry; Spectrophotometry; Monochromators; Measuring colours
- G01J3/02—Details
- G01J3/0205—Optical elements not provided otherwise, e.g. optical manifolds, diffusers, windows
- G01J3/0216—Optical elements not provided otherwise, e.g. optical manifolds, diffusers, windows using light concentrators or collectors or condensers
-
- G—PHYSICS
- G01—MEASURING; TESTING
- G01J—MEASUREMENT OF INTENSITY, VELOCITY, SPECTRAL CONTENT, POLARISATION, PHASE OR PULSE CHARACTERISTICS OF INFRARED, VISIBLE OR ULTRAVIOLET LIGHT; COLORIMETRY; RADIATION PYROMETRY
- G01J3/00—Spectrometry; Spectrophotometry; Monochromators; Measuring colours
- G01J3/02—Details
- G01J3/0205—Optical elements not provided otherwise, e.g. optical manifolds, diffusers, windows
- G01J3/024—Optical elements not provided otherwise, e.g. optical manifolds, diffusers, windows using means for illuminating a slit efficiently (e.g. entrance slit of a spectrometer or entrance face of fiber)
-
- G—PHYSICS
- G01—MEASURING; TESTING
- G01N—INVESTIGATING OR ANALYSING MATERIALS BY DETERMINING THEIR CHEMICAL OR PHYSICAL PROPERTIES
- G01N21/00—Investigating or analysing materials by the use of optical means, i.e. using sub-millimetre waves, infrared, visible or ultraviolet light
- G01N21/17—Systems in which incident light is modified in accordance with the properties of the material investigated
- G01N21/25—Colour; Spectral properties, i.e. comparison of effect of material on the light at two or more different wavelengths or wavelength bands
- G01N21/255—Details, e.g. use of specially adapted sources, lighting or optical systems
-
- G—PHYSICS
- G01—MEASURING; TESTING
- G01N—INVESTIGATING OR ANALYSING MATERIALS BY DETERMINING THEIR CHEMICAL OR PHYSICAL PROPERTIES
- G01N21/00—Investigating or analysing materials by the use of optical means, i.e. using sub-millimetre waves, infrared, visible or ultraviolet light
- G01N21/17—Systems in which incident light is modified in accordance with the properties of the material investigated
- G01N21/25—Colour; Spectral properties, i.e. comparison of effect of material on the light at two or more different wavelengths or wavelength bands
- G01N21/31—Investigating relative effect of material at wavelengths characteristic of specific elements or molecules, e.g. atomic absorption spectrometry
- G01N21/35—Investigating relative effect of material at wavelengths characteristic of specific elements or molecules, e.g. atomic absorption spectrometry using infrared light
- G01N21/359—Investigating relative effect of material at wavelengths characteristic of specific elements or molecules, e.g. atomic absorption spectrometry using infrared light using near infrared light
Definitions
- This disclosure relates to a light source, and more specifically to a near-infrared light source for use in near infrared transmission and reflection spectroscopy.
- Optical transmission and reflection spectroscopy in the short wavelength near-infrared range of 700-1050 nm has been used extensively in the past for important applications including identification of solid, powdered, and liquid materials and compounds, and quantification of the concentration of specific chemical compounds in solids, powders, and liquids.
- Spectroscopic analysis in the short wavelength near-infrared range is based on molecular vibrational overtone absorptions and light scattering effects in the 700-1050 nm wavelength range.
- the standard light source that is used for both reflection and transmission sampling modes in most of the near-infrared spectrometer systems that operate in the 700-1050 nm range is the tungsten-halogen lamp, which emits over a very broad wavelength range of about 350-3,000 nm.
- Single crystal Ti +3 -Sapphire circular and rectangular cross-seciont rods and disks have been used as a broadly tunable laser medium.
- This material which emits photoluminescence in the 600-1050 nm range and absorbs light from 400-620 nm, with 90% of the peak absorption within the range of 465-510 nm, has a high photoluminescent quantum efficiency in the range of 0.8 to 0.86.
- the excitation spectrum for Ti-Sapphire is expected to be very close to that of the absorption spectrum based on reported excitation and absorption spectra for ruby (Cr +3 doped Sapphire).
- Examples of other types of solid state broad-band light sources used for optical spectroscopy and microscopy include: white LEDs, and laser based nonlinear plasma solid state sources, and nonlinear photonic crystal fiber based continuum lasers. With the exception of the white LED, which does not emit at wavelengths longer than 700 nm, these other broad band solid state light sources are not always suitable due to size and expense.
- U.S. Pat. No. 6,836,502 (Canady et al., Dec. 28, 2004) describes a design for a broadband near-infrared light source for spectroscopy applications that consists of a LED excitation source together with a phosphor element based on either a CdS semiconductor crystal or polycrystal, or one or more fluorescent organic dyes dissolved in a clear polymer block, or one or more sizes of fluorescent quantum dots embedded in a clear polymer block. These three phosphor element design options have some drawbacks.
- CdS has a broad luminescence emission spectrum that covers a near-infrared wavelength range, it has been reported to have low photoluminescence quantum efficiencies of 0.22, with an even lower quantum efficiency implied from reported temperature dependence of photoluminescence between room temperature and low temperatures.
- Phosphor elements based on organic dyes have problems with photochemical degradation and also from reabsorption of luminescence due to insufficient separation between the peak absorbance wavelengths and the emission wavelength range for the dyes that emit at the longer wavelengths in the 850-1050 nm range.
- the organic fluorescent dyes only emit light in limited width wavelength bands of about 100 to 150 nm, which requires a mixture of several dyes to cover the desired 350 nm range of 700-1050 nm.
- quantum dots include a very high material price, and also the close proximity of the absorption bands to the emission bands, which leads to reabsorption of luminescent emission light. Such reabsorption results in lowering of the effective quantum efficiency.
- quantum dots have limited spectral emission bands on the order of about 100-150 nm which requires a mixture of several sizes of quantum dots to cover desired the 700-1050 nm range.
- a light source for near-infrared transmission and reflection spectroscopy can be constructed from a combination of a high power blue or blue-green light emitting diode (LED) and a phosphor element based on an inorganic material.
- the phosphor element absorbs the blue or blue-green LED light and, in response to the LED excitation, emits luminescence in the 700-1050 nm range or at least the 700-1000 nm range.
- One possible material that can be used for such a near-infrared emitting phosphor element is a single crystal rod of Ti +3 doped Sapphire, where the rod can be of circular or rectangular cross section.
- An alternative near-infrared emitting phosphor material is a round or rectangular shaped disk consisting of a composite of Ti +3 doped Sapphire powder embedded in a clear optical epoxy or silicone encapsulant.
- a blue LED for excitation of a phosphor element that emits in a broad wavelength band has been widely used in white LEDs where the emission is in the 400-700 nm range.
- the LED plus inorganic phosphor based near-infrared light source has substantial advantages over a tungsten halogen source for field portable near-infrared transmission and reflection spectroscopy:
- the LED plus Ti-Sapphire phosphor near-infrared light source also has applications as a light source for optical microscopy. These applications in microscopy include use with samples stained with near-infrared absorbing and near-infrared emitting fluorescent dyes.
- the photoluminescent material Ti-Sapphire has excellent potential as a solid-state near-infrared light source because of the following factors: 1) high quantum efficiency, 2) photoluminescence emission range of 600-1050 nm, and 3) peak absorption that coincides with the emission band of blue LEDs that are available with small LED chip diameters of about 1 mm and high optical emission power levels of about 0.5 W.
- the Ti-Sapphire light source can be fabricated with a small output diameter of about 1-3 mm which is very well suited for efficient coupling to fiberoptic bundles that are used for illumination in bifurcated fiber-optic reflection probes that are often employed for near-infrared spectroscopy in the reflection mode.
- FIG. 1 is a diagram of a blue LED excited Ti-Sapphire rod near-infrared light source.
- FIG. 2 is a diagram of an alternative optical configuration for coupling the light emitted from a blue LED to a Ti-Sapphire rod.
- FIG. 3 is a diagram of application of the light source from FIG. 1 for reflectance spectroscopy.
- FIG. 4 is a diagram of application of the light source from FIG. 1 for transmission spectroscopy.
- FIG. 5 shows a variation of FIG. 4 for transmission sampling of a transparent sample.
- FIG. 6 shows a variation of FIG. 1 adding a clear optical encapsulant layer.
- FIG. 7 shows a variation of FIG. 6 using a mounted LED chip without a lens.
- FIG. 8 shows a variation of FIG. 1 replacing the Ti-Sapphire rod with Ti-Sapphire powder embedded in a clear optical encapsulant.
- FIG. 9 shows a variation of FIG. 8 using a mounted LED chip without a molded-in lens.
- FIG. 10 shows a variation of FIG. 6 combining the light output of from the blue LED/Ti-Sapphire light source with a near-infrared LED to achieve more light intensity in the 920-1100 nm range.
- FIG. 11 shows a diagram of a near-infrared optical spectrometer system with an embodiment of the T-Sapphire near-infrared light source that is square or sine-wave modulated to allow removal of interfering sunlight or room-light that might enter the optical spectrometer without passing through or interacting with the sample being measured.
- FIG. 12 shows a graph comparing the absorbance spectrum of a Ti-Sapphire rod with approximately 0.5% Ti +3 concentration against the emission spectrum of a Cree high power blue LED.
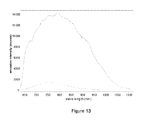
- FIG. 13 shows a graph comparing the short wavelength near-infrared emission spectra of a commercial spectroscopic tungsten halogen light source with that of a blue LED excited Ti-Sapphire light source.
- FIG. 14 shows a modification of FIG. 13 with the Ti-Sapphire source spectrum rescaled to have the same peak intensity as the tungsten halogen source.
- FIG. 15 shows a graph of near-infrared reflection spectra of four drug ingredient powders, each separately contained in clear polyethylene bags, and measured using a ultra-miniature diffraction grating spectrometer, a fiber-optic reflection probe, and a blue LED excited Ti-sapphire light source.
- FIG. 16 shows a graph of reflection spectra of the same four drug ingredient powders shown in FIG. 15 using a commercial tungsten halogen fiber-optic light source that uses 15 W of electrical power, together with the same spectrometer used for the FIG. 15 spectra.
- FIG. 17 shows a graph of the emission spectra measured through a 4.5 mm thick Spectralon disk for a blue LED excited Ti-Sapphire light source and a commercial 15 W tungsten halogen source, both plotted on the same vertical scale.
- FIG. 18 shows a graph of near-infrared transmission spectrum (in absorbance units) of Tylenol and Motrin drug tablets measured using a blue LED excited Ti-Sapphire light source and an ultra-miniature diffraction grating spectrometer.
- FIG. 19 shows a graph of near-infrared transmission spectrum of Tylenol and Motrin tablets measured using a commercial tungsten-halogen fiber-optic light source using 15 W of power and the same spectrometer used for the spectra in FIG. 18 .
- a design of the Ti-Sapphire based light source includes an excitation light source consisting of high power (0.2-1.0 Watt) blue or blue-green LED 100 with a center wavelength between 560 to 490 nm, with a molded-in plastic lens positioned against Ti +3 doped sapphire laser rod 110 , with small air space 120 between the LED lens and the Ti-Sapphire rod due to curvature of the lens.
- the air space between the LED lens and the Ti-Sapphire rod may be filled with a clear optical encapsulant such as an optical epoxy or optical grade silicone encapsulant to reduce solid material/air interface optical reflection losses.
- the dashed arrows indicate the output light 130 emitted from this solid state light source.
- the LED may be mounted onto printed circuit board 140 , with laminated aluminum heat-sink plate 150 on one side, providing electrical and thermal contacts to the LED.
- Aluminum mount 160 may include a drilled hole to contain the LED and Ti-Sapphire rod.
- the light source in this configuration may be coupled to an illumination fiber bundle for reflection spectroscopy or directly coupled to a solid or liquid phase sample for transmission mode spectroscopy.
- the concentration of Ti +3 in the Sapphire rod should be in the range of 0.4-5%.
- FIG. 2 shows an alternative optical configuration for coupling of the exciting LED emission to the Ti-Sapphire rod with an ellipsoidal reflector.
- High power blue LED 100 is positioned at one foci of ellipsoidal reflector 200 , such as by mounting and positioning the LED on aluminum heat-sink mount 210 .
- Ti-Sapphire rod 110 is positioned at the opposite foci of the ellipsoidal reflector, and connects to illumination fiber-optic bundle 220 , which may be positioned for connection through aluminum tube 230 .
- the light source is coupled to illumination fiber bundle 220 that is part of bifurcated fiber-optic reflection probe 300 , where reflection probe tip 310 couples to sample 320 .
- Illumination fiber bundle 220 contains illumination optical fibers 330 , which at tip 310 surround single receiving fiber 340 .
- a single illumination fiber may be used.
- Receiving fiber 340 delivers reflected light to spectrometer module 350 .
- the spectrometer module may be a miniature diffraction grating spectrometer module with a Si-array detector that is used to measure the reflection spectra and is connected to computer 360 for control of spectral collection and processing.
- both of the light source designs in FIGS. 1 and 2 can be similarly used as the illumination source for a hand held or portable NIR spectrometer system that employs a Si array detector micro-spectrometer module to measure near-infrared spectra.
- the light source is either directly coupled to the sample, as shown in FIG. 4 , or coupled to the sample through a collimating lens for transparent samples as shown in FIG. 5 .
- the sample may be positioned immediately after the Ti-Sapphire rod, and followed by receiving fiber 340 to direct transmitted light to the spectrometer module. With this latter configuration, no collimating or focusing optical elements are needed past the laser rod.
- the sample is located between a pair of lenses 500 .
- a collimating lens directs light from the light source to the sample, and then a focusing lens focuses the collimated light that is transmitted through the sample onto receiving fiber 340 that connects to spectrometer module optical input.
- a single lens can be used instead of the separate collimating and focusing lenses in FIG. 5 , where the single lens (placed either before or after the sample) is used both to collect the light emitted from the Ti-Sapphire source and to send it through the sample as a converging optical beam, and then onto the spectrometer receiving fiber.
- the Ti-Sapphire phosphor material for the solid-state near-infrared light source is in form of a single crystal or polycrystalline rod or disk. This is the configuration shown in FIGS. 1-5 , where the LED has a molded-in lens and there is an air gap between the LED lens and the Ti-Sapphire rod.
- FIGS. 1-5 the configuration shown in FIGS. 1-5 , where the LED has a molded-in lens and there is an air gap between the LED lens and the Ti-Sapphire rod.
- optical encapsulant 600 such as an optical grade epoxy or silicone encapsulant, fills in the air gap between the high power blue or blue-green LED molded-in lens (typically a surface mount high power LED package) and the Ti-Sapphire rod.
- This configuration produces a higher efficiency of coupling of the LED light to the Ti-Sapphire rod than the configuration configurations without the optical encapsulant, such as the configuration shown in FIG. 1 .
- the higher LED light coupling efficiency is the result of a reduction of the reflection losses from the air gap after the gap is filled with an encapsulant material having an index refraction more closely matching that of the LED encapsulant material and Sapphire than air.
- an alternative configuration of the Ti-Sapphire light source has a LED without a molded in lens and the space between the LED chip and the Ti-Sapphire rod is filled in with a clear optical encapsulant.
- Some surface mount packaged LEDs have no molded-in lens and have a flat optical encapsulant layer over the LED chip, and in this case a second optical encapsulant layer may be added, on top of the optical encapsulant that is part of the original LED package, in order to fill the space between the LED structure and the Ti-Sapphire rod.
- the LED chip also can be custom encapsulated with a single optical encapsulant layer between the LED chip and the Ti-Sapphire rod.
- Embodiments with the Phosphor Material in Form of Powdered Ti-Sapphire Together with a Transparent Optical Encapsulant/Binder Material Deposited on Top of LED Die (Similar to Typical White LED Design).
- FIG. 8 another alternative configuration for a near-infrared light source based on Ti-Sapphire is to embed uniformly dispersed Ti-Sapphire powder in a layer of clear optical encapsulant material 800 such as optical grade epoxy or silicone.
- the optical encapsulant layer containing the Ti-Sapphire powder can be applied on top of the blue or blue-green LED molded-in lens, as shown in FIG. 8 .
- Aluminum or aluminum-coated tube 810 may be used as a border container for the encapsulant layer.
- Aluminum is a preferred material for the border container because of the high reflectivity of aluminum in the near-infrared and the low cost of the material.
- the encapsulant layer with embedded Ti-Sapphire powder can also be used on top of the flat optical encapsulant layer in the case of a surface mount LED package without a lens or to directly encapsulate a bare LED chip in the case of custom encapsulation.
- An alternative embodiment is to replace the LED optical excitation light source with a blue diode laser diode emitting at about 470 nm or a near-infrared diode laser pumped frequency doubled Nd-YAG laser emitting at 532 nm.
- Another alternative embodiment is to use lenses or concave mirrors or a combination of lenses together with concave mirrors to couple the light from the LED excitation source to the Ti-Sapphire rod.
- Another alternative embodiment is to use lenses or concave mirrors or a combination of a lens or lenses with a concave mirror or mirrors to couple the output light from the Ti-Sapphire rod to an illumination optical fiber bundle, or to the sample in the case of transmission sampling.
- Another alternative embodiment is to add a second luminescent material to the primary NIR phosphor material, where the primary phosphor element is in the form of a powdered phosphor element embedded in a clear optical encapsulant.
- a two component near-infrared phosphor element may be a mixture of Ti-Sapphire powder plus a second powder embedded in a clear optical encapsulant, where the second powder consists of or a quantum dot material such as: PbS, PbS(core)/CdSe(shell), CdS, CdSe, Si, Au, or other photoluminescent quantum dot materials with an appropriate size range to emit within the wavelength range of 930-1050 nm.
- the second luminescent material enhances the emission of the solid state light source in the 920-1100 nm range, where the emission from Ti-Sapphire is weaker.
- the second phosphor powder may be a powdered form of another transition metal or rare earth element doped crystalline material, to provide a combined phosphor material with greater emission intensity in the 920-1100 nm spectral range than Ti-Sapphire alone.
- a layer of a second luminescent material such as PbS quantum dots, in the form of a layer of powder embedded in a clear optical encapsulant, may be added to the end of a single crystal rod of Ti-Sapphire. More than one additional luminescent powder may also be used.
- another alternative embodiment combines the optical emission from the blue LED excited Ti-Sapphire element (either Ti-Sapphire rod or Ti-Sapphire powder embedded in optical encapsulant) with the optical emission from high power near-infrared LED 1000 with center emission wavelength of the LED in the range of 920 to 1050 nm to provide more optical power in the 920-1100 nm range where the Ti-Sapphire emission is weaker.
- the light from the Blue LED/Ti-Sapphire element may be combined with the light from the near-infrared LED using dichroic beamsplitter 1010 .
- the dichroic beamsplitter transmits light from one source at one wavelength range and reflects light at 45 degrees to the normal incidence for another complimentary wavelength range, where the transmitted wavelength range is 700-940 nm and the reflected range is 950-1050 nm.
- a dichroic beamsplitter with these latter transmitted and reflected wavelength ranges reversed, together with a reversal of the positions of the near-infrared LED and the Ti-Sapphire light source, is an alternative option. It is preferred to include a pair of plano-convex lenses 1020 to relay the combined light to either the sample or a fiber-optic bundle that is part of a bifurcated fiber-optic reflection probe. As shown in FIG.
- the dichroic beamsplitter may be located in-between the two plano-convex lenses in the preferred optical configuration.
- a third external convex lens may follow the near-infrared LED or be bonded to this near-infrared LED with a clear optical encapsulant to better collimate the light emitted by the near-infrared LED.
- Such an additional lens may be located in the near-infrared LED beam path between the LED and the second lens before the dichroic beamsplitter.
- Another alternative embodiment combines the optical emission of the blue LED excited Ti-Sapphire element with the emission from a white LED using a dichroic beamsplitter to provide a solid state light source covering the 400-1050 nm spectral range.
- This design follows the design shown in FIG. 10 , with near-infrared LED 1000 replaced with a white LED.
- the dichroic beamsplitter has the appropriate construction to transmit light in the 710-1050 nm range from the Ti-Sapphire source and reflects light in the 400-700 nm range from the white LED source.
- a combined visible/near-infrared solid state light source may be useful for identification of materials that have important spectral features in both visible and near-infrared wavelength ranges such as minerals and paint or ink pigments.
- a variation applicable to all alternative embodiments includes square-wave or sine-wave modulation of the blue or blue-green LED driving current.
- the spectral collection uses phase sensitive detection signal processing (also referred to as lock-in amplification) together with the square or sine-wave modulated Ti-Sapphire light source to allow elimination of interference in the measured spectra from sunlight or room lights that enters the spectrometer optical input.
- the phase sensitive signal processing means is synchronized with the square-wave or sine-wave modulation of the Ti-Sapphire based light source.
- the modulation frequency is in the range of 10 Hz-10 KHz and the amplitude modulation of the light source is between 90-100%.
- electronic modulation circuit module 1030 has a first electrical output that connects to and drives the blue LED excitation light source with square or sine-wave modulation, and a second output for triggering or synchronizing the spectral collection electronics of the optical spectrometer module to the modulation waveform.
- the modulation of the near-infrared light emitted by the T-Sapphire phosphor element follows the blue LED modulation for modulation frequencies up to at least 1,000 Hz.
- the removal of interfering sunlight or room light from near-infrared spectra collected by spectrometer module 350 can be achieved by modulating the near-infrared light source with square or sine-wave modulation and then processing the resulting signal in the spectrometer detection system using lock-in amplification, which is also referred to as phase sensitive detection.
- lock-in amplification which is also referred to as phase sensitive detection.
- One way to effectively achieve lock-in amplification with an optical spectrometer having a photodiode, CCD, or CMOS array detector is to gate the collection of the detector array data from the spectrometer detector array in synchronous with the on/off square wave modulation of the near-infrared light source.
- averaged spectra are collected in two arrays, with one array corresponding to the periodic modulation intervals occurring when the near-infrared light source is on, and a second array corresponding to modulation cycle when the near-infrared light source is off.
- the two spectral data arrays corresponding to the light source on and light source off are subtracted, the resulting spectrum has contributions removed that originate from non-synchronous light sources such as sunlight or room-light.
- crystalline photoluminescent inorganic materials that emit over a wide wavelength band in NIR may be used instead of Ti 3+ -sapphire.
- examples of other possible photoluminescent inorganic crystalline materials include: Cr +3 -LiSrAlF 6 (emits in 750-950 nm range) and Ti +3 BeAl 2 O 4 (emits in 700-900 nm range).
- the range of applicable samples, sample holders, spectrometer modules, and computer or microprocessor to control spectral data acquisition, analysis, and processing are as detailed U.S. Pat. No. 8,859,969 and U.S. Pat. Pub. No. 2013/0265568.
- the diffuser shown in FIG. 23 of the co-pending applications is not used for coupling the Ti-Sapphire/LED light source to the illumination fiber bundle of the fiber-optic probe.
- the results of using the Ti-Sapphire light source in such systems, such as shown in FIGS. 3-5 are discussed below, as well as comparisons between the Ti-Sapphire light source and a tungsten-halogen light source.
- the absorbance spectrum (transmission spectrum in absorbance units) of a Ti +3 -Sapphire rod with a Ti +3 concentration of about 0.5% by weight and a rod length of 4 mm and diameter of 3 mm) is shown as the upper line in FIG. 12 .
- the lower line shows the emission spectrum of a Cree high power blue LED with peak emission at about 475 nm, which can be seen as being a good match to the wavelength region of 465-510 nm where the Ti-Sapphire absorbance is within 90% of its peak absorbance.
- the absorbance of a 4 mm long Ti-Sapphire rod at the peak blue LED wavelength is about 0.35, which corresponds to 55% of the LED light being absorbed by the Ti-Sapphire rod.
- the design of the fiber-optic reflection probe is as shown in FIG. 3 , except using thirteen fibers in the illumination fiber bundle.
- FIG. 13 and 14 show the emission spectrum of the Ti-Sapphire source that diffusely reflects from the Spectralon block, and also the emission spectrum (reflected from the Spectralon block) of a commercial fiber-optic tungsten-halogen light source that was designed for use with miniature optical spectrometers having fiber-optic inputs.
- the spectrum measured for the tungsten-halogen source was taken with the same bifurcated fiber-optic reflection probe and Spectralon block used for the Ti-Sapphire source spectrum.
- the emitted light from the tungsten-halogen source was filtered with a long pass optical filter that limits transmitted light to wavelengths longer than 645 nm to avoid saturation of the spectrometer with strong shorter wavelength emission in the 350-645 nm range.
- FIGS. 15 and 16 show near-infrared reflection spectra of 4 different powdered compounds contained in small 5 ⁇ 8 cm clear polyethylene plastic bags that were measured with both the Ti-Sapphire and tungsten-halogen light sources with a bifurcated fiber-optic reflection probe and a ultra-miniature optical spectrometer module.
- FIG. 15 shows the measurements of these powder spectra with the Ti-Sapphire light source configured as shown in FIG. 3 .
- a spectral collection time of 10 seconds was used and the blue LED driving current was 550 mA resulting in 1.9 W power usage.
- the spectrum in FIG. 15 was processed with a 21 point Savitsky-Golay smoothing routine.
- FIG. 15 shows near-infrared reflection spectra of 4 different powdered compounds contained in small 5 ⁇ 8 cm clear polyethylene plastic bags that were measured with both the Ti-Sapphire and tungsten-halogen light sources with a bifurcated fiber-optic reflection probe and a ultra-miniature
- FIGS. 15 and 16 show the measurements with the same setup but with a 15 W tungsten-halogen light source, and again using a 10 second collection time.
- the fiber-optic reflection probe used for the spectral measurements in both FIGS. 15 and 16 included a 2 mm thick anti-reflection coated glass window to protect the probe tip, which also provided a small stand-off distance from the sample surface.
- a Spectralon block was employed to record light source reference reflectance spectra that is used to produce the ⁇ log(reflectance) spectra plotted.
- the top spectrum is sucrose
- the second spectrum from the top is glucose
- the third spectrum is acetaminophen
- the bottom spectrum is amoxicillin.
- These compounds exhibit distinct spectral patterns that can easily be differentiated by eye or by standard multivariate calibration algorithms such as Partial Least Squares discriminate analysis or Principle Component Discriminant analysis.
- the spectral patterns shown in FIG. 15 as measured with the Ti-Sapphire near-infrared light source, have the same shape as those measured using the tungsten-halogen light source and shown in FIG. 16 .
- the configuration shown in FIG. 4 was used to measure transmission spectra (plotted in absorbance units) of two different types of drug tablets with the Ti-Sapphire light source together with a ultra-miniature diffraction grating spectrometer module.
- Light source reference spectra were measured using a Spectralon (compressed and sintered Teflon powder) disk with a thickness of 4.5 mm in place of the tablet sample.
- the Spectralon disk produces about the same average optical attenuation from light scattering in the 700-1050 nm range as a typical drug tablet, but without any spectral features.
- the receiving optical fiber for the ultra-miniature spectrometer module was placed just after the tablet sample or the Spectralon disk for spectral measurement.
- Transmission spectra were also measured using a 15 W commercial fiber-optic tungsten halogen light source filtered with a 645 nm (50% cutoff point) longpass glass filter that transmits at wavelengths longer than about 640 nm and blocks ultraviolet and visible wavelength light.
- the optical configuration illustrated in FIG. 4 was used, with the Ti-Sapphire source replaced with the 15 W tungsten halogen light source.
- the commercial 15 W tungsten-halogen fiber-optic light source couples light emitted by the tungsten filament to an SMA fiber optic connector using a convex focusing lens.
- the commercial fiber-optic tungsten halogen source used for the transmission mode spectral measurements was modified by replacing the focusing lens and SMA fiber-optic connector assembly with an external convex lens of slightly larger focal length and diameter to focus the tungsten-halogen light onto the front surface plane of the sample.
- This modification of the tungsten halogen source increased the light intensity level transmitted through the samples or the Spectralon disk by more than a factor 10 .
- FIG. 17 shows a comparison of the emission spectrum of the blue LED excited Ti-Sapphire light source (upper spectrum) with that of the modified 15 W tungsten halogen source (lower spectrum).
- the emission spectra in FIG. 17 were measured using the optical arrangement shown in FIG. 4 with a 4.5 mm thick Spectralon disk as the sample, where the emission spectra were measured after transmission through the Spectralon disk.
- the Ti-Sapphire source has higher intensity in the 700-900 nm range while the tungsten-halogen source is stronger in the 900-1050 nm range.
- Spectral collection times of 9 seconds and 10 seconds were used respectively for the Ti-Sapphire source and the tungsten-halogen source.
- FIGS. 18 and 19 show near-infrared transmission spectra (in absorbance units) of two different drug tablets measured with both the Ti-Sapphire ( FIG. 18 ) and the 15 W tungsten halogen ( FIG. 19 ) near-infrared light sources.
- the tablets were coated Motrin (top spectrum) and uncoated 325 mg Tylenol (bottom spectrum).
- the major chemical component in Motrin is ibuprofen, while the major chemical component in Tylenol is acetaminophen.
- the drug tablet spectra were measured with the light from the near-infrared light sources transmitted all the way through the tablets.
- Both Tylenol and Motrin have distinct spectral signatures in the 700-1000 nm range that are related to the vibrational spectral transitions in these materials which depend primarily on the molecular structure of the active ingredients of these tablets.
- the Ti-Sapphire light source collection time was 9 seconds, and power consumption was 2.5 W.
- the tungsten-halogen light source collection time was 10 seconds, and power consumption was 15 W.
- the spectra in FIGS. 18 and 19 show that the spectral patterns for both drug tablets appear to be identical when measured using the two different near-infrared light sources. The signal/noise in the spectra is also very similar between the spectra measured with the two light sources.
Abstract
A light source for near-infrared transmission and reflection spectroscopy can be constructed from a combination of a high power blue or blue-green light emitting diode (LED) and a phosphor element based on an inorganic material. The phosphor element absorbs the LED light and, in response to the LED excitation, emits luminescence that continuously covers the 700-1050 nm range. One possible material that can be used for such a near-infrared emitting phosphor element is a single crystal rod of Ti+3 doped Sapphire. An alternative near-infrared emitting phosphor material is a disk or rectangular shaped composite of Ti+3 doped Sapphire powder embedded in a clear optical epoxy or silicone encapsulant. Such a combination of a blue LED for excitation of a phosphor element that emits in a broad wavelength band has been widely used in white LEDs where the emission is in the 400-700 nm range.
Description
This utility patent application claims priority from U.S. provisional patent application Ser. No. 62/056,941, filed Sep. 29, 2014, titled “Solid State Broad Band Near-Infrared Light Source” naming inventor Ronald H. Micheels. The disclosures herein can be used in various applications, including the systems described in U.S. Pat. Pub. No. 2013/0265568, “OPTICAL ANALYZER FOR IDENTIFICATION OF MATERIALS USING TRANSMISSION SPECTROSCOPY”, published Oct. 10, 2013, naming inventors Ronald H. Micheels and Don J. Lee, and U.S. Pat. No. 8,859,969, “OPTICAL ANALYZER FOR IDENTIFICATION OF MATERIALS USING REFLECTANCE SPECTROSCOPY”, issued Oct. 14, 2014, naming inventors Ronald H. Micheels and Don J. Lee, both of which are hereby fully incorporated by reference.
A portion of the disclosure of this patent document contains material that is subject to copyright protection. The copyright owner has no objection to the facsimile reproduction by anyone of the patent document or the patent disclosure, as it appears in the Patent and Trademark Office patent file or records, but otherwise reserves all copyright rights whatsoever. Copyright 2015 Innovative Science Tools, Inc.
Field of Technology
This disclosure relates to a light source, and more specifically to a near-infrared light source for use in near infrared transmission and reflection spectroscopy.
Background
Optical transmission and reflection spectroscopy in the short wavelength near-infrared range of 700-1050 nm has been used extensively in the past for important applications including identification of solid, powdered, and liquid materials and compounds, and quantification of the concentration of specific chemical compounds in solids, powders, and liquids. Spectroscopic analysis in the short wavelength near-infrared range is based on molecular vibrational overtone absorptions and light scattering effects in the 700-1050 nm wavelength range. The standard light source that is used for both reflection and transmission sampling modes in most of the near-infrared spectrometer systems that operate in the 700-1050 nm range is the tungsten-halogen lamp, which emits over a very broad wavelength range of about 350-3,000 nm.
Single crystal Ti+3-Sapphire circular and rectangular cross-seciont rods and disks have been used as a broadly tunable laser medium. This material, which emits photoluminescence in the 600-1050 nm range and absorbs light from 400-620 nm, with 90% of the peak absorption within the range of 465-510 nm, has a high photoluminescent quantum efficiency in the range of 0.8 to 0.86. The excitation spectrum for Ti-Sapphire is expected to be very close to that of the absorption spectrum based on reported excitation and absorption spectra for ruby (Cr+3 doped Sapphire). Examples of other types of solid state broad-band light sources used for optical spectroscopy and microscopy include: white LEDs, and laser based nonlinear plasma solid state sources, and nonlinear photonic crystal fiber based continuum lasers. With the exception of the white LED, which does not emit at wavelengths longer than 700 nm, these other broad band solid state light sources are not always suitable due to size and expense.
U.S. Pat. No. 6,836,502 (Canady et al., Dec. 28, 2004) describes a design for a broadband near-infrared light source for spectroscopy applications that consists of a LED excitation source together with a phosphor element based on either a CdS semiconductor crystal or polycrystal, or one or more fluorescent organic dyes dissolved in a clear polymer block, or one or more sizes of fluorescent quantum dots embedded in a clear polymer block. These three phosphor element design options have some drawbacks. Although CdS has a broad luminescence emission spectrum that covers a near-infrared wavelength range, it has been reported to have low photoluminescence quantum efficiencies of 0.22, with an even lower quantum efficiency implied from reported temperature dependence of photoluminescence between room temperature and low temperatures. Phosphor elements based on organic dyes have problems with photochemical degradation and also from reabsorption of luminescence due to insufficient separation between the peak absorbance wavelengths and the emission wavelength range for the dyes that emit at the longer wavelengths in the 850-1050 nm range. The organic fluorescent dyes only emit light in limited width wavelength bands of about 100 to 150 nm, which requires a mixture of several dyes to cover the desired 350 nm range of 700-1050 nm. Disadvantages of quantum dots include a very high material price, and also the close proximity of the absorption bands to the emission bands, which leads to reabsorption of luminescent emission light. Such reabsorption results in lowering of the effective quantum efficiency. Like the organic dyes, quantum dots have limited spectral emission bands on the order of about 100-150 nm which requires a mixture of several sizes of quantum dots to cover desired the 700-1050 nm range.
A light source for near-infrared transmission and reflection spectroscopy can be constructed from a combination of a high power blue or blue-green light emitting diode (LED) and a phosphor element based on an inorganic material. The phosphor element absorbs the blue or blue-green LED light and, in response to the LED excitation, emits luminescence in the 700-1050 nm range or at least the 700-1000 nm range. One possible material that can be used for such a near-infrared emitting phosphor element is a single crystal rod of Ti+3 doped Sapphire, where the rod can be of circular or rectangular cross section. An alternative near-infrared emitting phosphor material is a round or rectangular shaped disk consisting of a composite of Ti+3 doped Sapphire powder embedded in a clear optical epoxy or silicone encapsulant. Such a combination of a blue LED for excitation of a phosphor element that emits in a broad wavelength band has been widely used in white LEDs where the emission is in the 400-700 nm range. The LED plus inorganic phosphor based near-infrared light source has substantial advantages over a tungsten halogen source for field portable near-infrared transmission and reflection spectroscopy:
-
- 1. increased electrical to light conversion efficiency resulting in longer battery life when used in portable/handheld spectroscopic analyzer applications
- 2. longer life of the emitting element (approximately 25,000 hours for Ti-Sapphire source vs. 2,000 hours for tungsten halogen)
- 3. resistance to failure from exposure to mechanical shock
- 4. ability to be modulated at 100% modulation amplitude at frequencies up to about 10 kHz which permits phase sensitive detection processing for removal of sunlight and roomlight interference
- 5. no need for a cooling fan, which is normally required with tungsten-halogen lamps, allowing for easier incorporation into a waterproof package desirable for a ruggedized handheld spectroscopic analyzer.
The LED plus Ti-Sapphire phosphor near-infrared light source also has applications as a light source for optical microscopy. These applications in microscopy include use with samples stained with near-infrared absorbing and near-infrared emitting fluorescent dyes.
The photoluminescent material Ti-Sapphire has excellent potential as a solid-state near-infrared light source because of the following factors: 1) high quantum efficiency, 2) photoluminescence emission range of 600-1050 nm, and 3) peak absorption that coincides with the emission band of blue LEDs that are available with small LED chip diameters of about 1 mm and high optical emission power levels of about 0.5 W. The Ti-Sapphire light source can be fabricated with a small output diameter of about 1-3 mm which is very well suited for efficient coupling to fiberoptic bundles that are used for illumination in bifurcated fiber-optic reflection probes that are often employed for near-infrared spectroscopy in the reflection mode.
In the drawings, closely related figures and items have the same number but different alphabetic suffixes. Processes, states, statuses, and databases are named for their respective functions.
In the following detailed description, reference is made to the accompanying drawings which form a part hereof, and in which are shown, by way of illustration, specific embodiments in which the invention may be practiced. It is to be understood that other embodiments may be used, and structural changes may be made without departing from the scope of the present invention.
Reflection Spectral Measurements
A design of the Ti-Sapphire based light source, as shown in FIG. 1 , includes an excitation light source consisting of high power (0.2-1.0 Watt) blue or blue-green LED 100 with a center wavelength between 560 to 490 nm, with a molded-in plastic lens positioned against Ti+3 doped sapphire laser rod 110, with small air space 120 between the LED lens and the Ti-Sapphire rod due to curvature of the lens. Optionally, the air space between the LED lens and the Ti-Sapphire rod may be filled with a clear optical encapsulant such as an optical epoxy or optical grade silicone encapsulant to reduce solid material/air interface optical reflection losses. The dashed arrows indicate the output light 130 emitted from this solid state light source. The LED may be mounted onto printed circuit board 140, with laminated aluminum heat-sink plate 150 on one side, providing electrical and thermal contacts to the LED. Aluminum mount 160 may include a drilled hole to contain the LED and Ti-Sapphire rod. The light source in this configuration may be coupled to an illumination fiber bundle for reflection spectroscopy or directly coupled to a solid or liquid phase sample for transmission mode spectroscopy. The concentration of Ti+3 in the Sapphire rod should be in the range of 0.4-5%.
As shown in FIG. 3 , when the Ti-Sapphire light source is used for spectroscopic reflection measurements, the light source is coupled to illumination fiber bundle 220 that is part of bifurcated fiber-optic reflection probe 300, where reflection probe tip 310 couples to sample 320. Illumination fiber bundle 220 contains illumination optical fibers 330, which at tip 310 surround single receiving fiber 340. As an alternative to the illumination fiber bundle, a single illumination fiber may be used. Receiving fiber 340 delivers reflected light to spectrometer module 350. The spectrometer module may be a miniature diffraction grating spectrometer module with a Si-array detector that is used to measure the reflection spectra and is connected to computer 360 for control of spectral collection and processing. While the light source from FIG. 1 is shown in FIG. 3 , both of the light source designs in FIGS. 1 and 2 can be similarly used as the illumination source for a hand held or portable NIR spectrometer system that employs a Si array detector micro-spectrometer module to measure near-infrared spectra.
Transmission Spectral Measurements
When the Ti-Sapphire light source is used for transmission spectroscopic measurements, the light source is either directly coupled to the sample, as shown in FIG. 4 , or coupled to the sample through a collimating lens for transparent samples as shown in FIG. 5 . As shown in FIG. 4 , the sample may be positioned immediately after the Ti-Sapphire rod, and followed by receiving fiber 340 to direct transmitted light to the spectrometer module. With this latter configuration, no collimating or focusing optical elements are needed past the laser rod. In FIG. 5 , the sample is located between a pair of lenses 500. First, a collimating lens directs light from the light source to the sample, and then a focusing lens focuses the collimated light that is transmitted through the sample onto receiving fiber 340 that connects to spectrometer module optical input. Alternatively, for transparent samples, a single lens can be used instead of the separate collimating and focusing lenses in FIG. 5 , where the single lens (placed either before or after the sample) is used both to collect the light emitted from the Ti-Sapphire source and to send it through the sample as a converging optical beam, and then onto the spectrometer receiving fiber.
Ti-Sapphire Near-Infrared Phosphor Material and LED Light Source
Phosphor Consisting of Single Piece of Ti-Sapphire Material
In the simplest configuration, the Ti-Sapphire phosphor material for the solid-state near-infrared light source is in form of a single crystal or polycrystalline rod or disk. This is the configuration shown in FIGS. 1-5 , where the LED has a molded-in lens and there is an air gap between the LED lens and the Ti-Sapphire rod. There are several other possible phosphor configurations that are described in the following sections.
An LED with a Molded-in Lens and the Air Gap between the LED Lens and the Ti-Sapphire Rod Filled with a Clear Optical Encapsulant
Referring to FIG. 6 , optical encapsulant 600, such as an optical grade epoxy or silicone encapsulant, fills in the air gap between the high power blue or blue-green LED molded-in lens (typically a surface mount high power LED package) and the Ti-Sapphire rod. This configuration produces a higher efficiency of coupling of the LED light to the Ti-Sapphire rod than the configuration configurations without the optical encapsulant, such as the configuration shown in FIG. 1 . The higher LED light coupling efficiency is the result of a reduction of the reflection losses from the air gap after the gap is filled with an encapsulant material having an index refraction more closely matching that of the LED encapsulant material and Sapphire than air.
Ti-Sapphire Light Source Configuration with an LED Chip Without a Lens and the Air Gap Filled with an Optical Encapsulant
Referring to FIG. 7 , an alternative configuration of the Ti-Sapphire light source has a LED without a molded in lens and the space between the LED chip and the Ti-Sapphire rod is filled in with a clear optical encapsulant. Some surface mount packaged LEDs have no molded-in lens and have a flat optical encapsulant layer over the LED chip, and in this case a second optical encapsulant layer may be added, on top of the optical encapsulant that is part of the original LED package, in order to fill the space between the LED structure and the Ti-Sapphire rod. The LED chip also can be custom encapsulated with a single optical encapsulant layer between the LED chip and the Ti-Sapphire rod.
Embodiments with the Phosphor Material in Form of Powdered Ti-Sapphire Together with a Transparent Optical Encapsulant/Binder Material Deposited on Top of LED Die (Similar to Typical White LED Design).
Referring to FIG. 8 , another alternative configuration for a near-infrared light source based on Ti-Sapphire is to embed uniformly dispersed Ti-Sapphire powder in a layer of clear optical encapsulant material 800 such as optical grade epoxy or silicone. The optical encapsulant layer containing the Ti-Sapphire powder can be applied on top of the blue or blue-green LED molded-in lens, as shown in FIG. 8 . Aluminum or aluminum-coated tube 810 may be used as a border container for the encapsulant layer. Aluminum is a preferred material for the border container because of the high reflectivity of aluminum in the near-infrared and the low cost of the material. Gold coated stainless steel or gold coated aluminum may also be used for the border container material, and has slightly higher reflectivity than aluminum, but would have a higher cost. Referring also to FIG. 9 , the encapsulant layer with embedded Ti-Sapphire powder can also be used on top of the flat optical encapsulant layer in the case of a surface mount LED package without a lens or to directly encapsulate a bare LED chip in the case of custom encapsulation.
An alternative embodiment is to replace the LED optical excitation light source with a blue diode laser diode emitting at about 470 nm or a near-infrared diode laser pumped frequency doubled Nd-YAG laser emitting at 532 nm.
Another alternative embodiment is to use lenses or concave mirrors or a combination of lenses together with concave mirrors to couple the light from the LED excitation source to the Ti-Sapphire rod.
Another alternative embodiment is to use lenses or concave mirrors or a combination of a lens or lenses with a concave mirror or mirrors to couple the output light from the Ti-Sapphire rod to an illumination optical fiber bundle, or to the sample in the case of transmission sampling.
Another alternative embodiment is to add a second luminescent material to the primary NIR phosphor material, where the primary phosphor element is in the form of a powdered phosphor element embedded in a clear optical encapsulant. For example, such a two component near-infrared phosphor element may be a mixture of Ti-Sapphire powder plus a second powder embedded in a clear optical encapsulant, where the second powder consists of or a quantum dot material such as: PbS, PbS(core)/CdSe(shell), CdS, CdSe, Si, Au, or other photoluminescent quantum dot materials with an appropriate size range to emit within the wavelength range of 930-1050 nm. The second luminescent material enhances the emission of the solid state light source in the 920-1100 nm range, where the emission from Ti-Sapphire is weaker. Alternatively, the second phosphor powder may be a powdered form of another transition metal or rare earth element doped crystalline material, to provide a combined phosphor material with greater emission intensity in the 920-1100 nm spectral range than Ti-Sapphire alone. As another alternative, a layer of a second luminescent material, such as PbS quantum dots, in the form of a layer of powder embedded in a clear optical encapsulant, may be added to the end of a single crystal rod of Ti-Sapphire. More than one additional luminescent powder may also be used.
Referring to FIG. 10 , another alternative embodiment combines the optical emission from the blue LED excited Ti-Sapphire element (either Ti-Sapphire rod or Ti-Sapphire powder embedded in optical encapsulant) with the optical emission from high power near-infrared LED 1000 with center emission wavelength of the LED in the range of 920 to 1050 nm to provide more optical power in the 920-1100 nm range where the Ti-Sapphire emission is weaker. The light from the Blue LED/Ti-Sapphire element may be combined with the light from the near-infrared LED using dichroic beamsplitter 1010. The dichroic beamsplitter transmits light from one source at one wavelength range and reflects light at 45 degrees to the normal incidence for another complimentary wavelength range, where the transmitted wavelength range is 700-940 nm and the reflected range is 950-1050 nm. Using a dichroic beamsplitter with these latter transmitted and reflected wavelength ranges reversed, together with a reversal of the positions of the near-infrared LED and the Ti-Sapphire light source, is an alternative option. It is preferred to include a pair of plano-convex lenses 1020 to relay the combined light to either the sample or a fiber-optic bundle that is part of a bifurcated fiber-optic reflection probe. As shown in FIG. 10 , the dichroic beamsplitter may be located in-between the two plano-convex lenses in the preferred optical configuration. Optionally, a third external convex lens may follow the near-infrared LED or be bonded to this near-infrared LED with a clear optical encapsulant to better collimate the light emitted by the near-infrared LED. Such an additional lens may be located in the near-infrared LED beam path between the LED and the second lens before the dichroic beamsplitter.
Another alternative embodiment combines the optical emission of the blue LED excited Ti-Sapphire element with the emission from a white LED using a dichroic beamsplitter to provide a solid state light source covering the 400-1050 nm spectral range. This design follows the design shown in FIG. 10 , with near-infrared LED 1000 replaced with a white LED. The dichroic beamsplitter has the appropriate construction to transmit light in the 710-1050 nm range from the Ti-Sapphire source and reflects light in the 400-700 nm range from the white LED source. Using a dichroic beamsplitter with these latter transmitted and reflected wavelength ranges reversed, together with a reversal of the positions of the white LED and the Ti-Sapphire light source, is an alternative option. A combined visible/near-infrared solid state light source may be useful for identification of materials that have important spectral features in both visible and near-infrared wavelength ranges such as minerals and paint or ink pigments.
A variation applicable to all alternative embodiments includes square-wave or sine-wave modulation of the blue or blue-green LED driving current. In this design and method the spectral collection uses phase sensitive detection signal processing (also referred to as lock-in amplification) together with the square or sine-wave modulated Ti-Sapphire light source to allow elimination of interference in the measured spectra from sunlight or room lights that enters the spectrometer optical input. The phase sensitive signal processing means is synchronized with the square-wave or sine-wave modulation of the Ti-Sapphire based light source. The modulation frequency is in the range of 10 Hz-10 KHz and the amplitude modulation of the light source is between 90-100%. Interference from sunlight or room lights can be a problem in measuring reflection spectra with a fiber-optic reflection probe or other means for reflection sampling when samples with very non-planar surfaces are measured or when a significant sample standoff distance is required. In FIG. 11 , electronic modulation circuit module 1030 has a first electrical output that connects to and drives the blue LED excitation light source with square or sine-wave modulation, and a second output for triggering or synchronizing the spectral collection electronics of the optical spectrometer module to the modulation waveform. The modulation of the near-infrared light emitted by the T-Sapphire phosphor element follows the blue LED modulation for modulation frequencies up to at least 1,000 Hz. The removal of interfering sunlight or room light from near-infrared spectra collected by spectrometer module 350 can be achieved by modulating the near-infrared light source with square or sine-wave modulation and then processing the resulting signal in the spectrometer detection system using lock-in amplification, which is also referred to as phase sensitive detection. One way to effectively achieve lock-in amplification with an optical spectrometer having a photodiode, CCD, or CMOS array detector is to gate the collection of the detector array data from the spectrometer detector array in synchronous with the on/off square wave modulation of the near-infrared light source. In this signal processing scheme, averaged spectra are collected in two arrays, with one array corresponding to the periodic modulation intervals occurring when the near-infrared light source is on, and a second array corresponding to modulation cycle when the near-infrared light source is off. When the two spectral data arrays corresponding to the light source on and light source off are subtracted, the resulting spectrum has contributions removed that originate from non-synchronous light sources such as sunlight or room-light.
Other Inorganic Phosphor Materials
Other crystalline photoluminescent inorganic materials that emit over a wide wavelength band in NIR may be used instead of Ti3+-sapphire. Examples of other possible photoluminescent inorganic crystalline materials include: Cr+3-LiSrAlF6 (emits in 750-950 nm range) and Ti+3BeAl2O4 (emits in 700-900 nm range).
Experimental Results
With the light source and optics configurations as discussed above, the range of applicable samples, sample holders, spectrometer modules, and computer or microprocessor to control spectral data acquisition, analysis, and processing are as detailed U.S. Pat. No. 8,859,969 and U.S. Pat. Pub. No. 2013/0265568. The diffuser shown in FIG. 23 of the co-pending applications is not used for coupling the Ti-Sapphire/LED light source to the illumination fiber bundle of the fiber-optic probe. The results of using the Ti-Sapphire light source in such systems, such as shown in FIGS. 3-5 , are discussed below, as well as comparisons between the Ti-Sapphire light source and a tungsten-halogen light source.
Ti-Sapphire Absorbance Spectrum Together with Blue LED Emission Spectrum
The absorbance spectrum (transmission spectrum in absorbance units) of a Ti+3-Sapphire rod with a Ti+3 concentration of about 0.5% by weight and a rod length of 4 mm and diameter of 3 mm) is shown as the upper line in FIG. 12 . The lower line shows the emission spectrum of a Cree high power blue LED with peak emission at about 475 nm, which can be seen as being a good match to the wavelength region of 465-510 nm where the Ti-Sapphire absorbance is within 90% of its peak absorbance. For the 0.5% Ti+3 concentration, the absorbance of a 4 mm long Ti-Sapphire rod at the peak blue LED wavelength is about 0.35, which corresponds to 55% of the LED light being absorbed by the Ti-Sapphire rod.
Near-Infrared Emission Spectrum of the Blue LED Excited Ti-Sapphire Laser Rod, and Comparison with Tungsten Halogen Lamp
The emission spectrum from a Ti-Sapphire rod, 4 mm in length, that was excited with a high power blue LED (475 nm) and directed into an illumination fiber bundle that is part of a bifurcated fiber-optic reflection probe, was measured as the reflected light spectrum from a white Spectralon block. The light from the illumination fiber bundle reflected off of the Spectralon block and was picked up by a single 400 μm optic fiber at the tip of the bifurcated fiber-optic reflection probe. The design of the fiber-optic reflection probe is as shown in FIG. 3 , except using thirteen fibers in the illumination fiber bundle. FIGS. 13 and 14 show the emission spectrum of the Ti-Sapphire source that diffusely reflects from the Spectralon block, and also the emission spectrum (reflected from the Spectralon block) of a commercial fiber-optic tungsten-halogen light source that was designed for use with miniature optical spectrometers having fiber-optic inputs. The spectrum measured for the tungsten-halogen source was taken with the same bifurcated fiber-optic reflection probe and Spectralon block used for the Ti-Sapphire source spectrum. The emitted light from the tungsten-halogen source was filtered with a long pass optical filter that limits transmitted light to wavelengths longer than 645 nm to avoid saturation of the spectrometer with strong shorter wavelength emission in the 350-645 nm range. In FIG. 13 , where the emission spectra of both the Ti-Sapphire light source and the tungsten-halogen light sources are plotted on the same emission intensity scale (after transmission through the illumination fiber bundle), it can be seen that the tungsten-halogen light source (upper spectrum) peak near-infrared emission intensity is about 10 times that of the Ti-Sapphire near-infrared light source (lower spectrum) peak. The tungsten halogen source used 15 W of electrical power while the blue LED excited Ti-Sapphire light source only used 2.5 W. FIG. 14 shows the same results with the Ti-Sapphire source spectrum rescaled to have the same peak intensity as the tungsten halogen source, where the dashed line spectrum is the tungsten halogen source and the solid line spectrum is the Ti-Sapphire source. These results show that both light sources cover a similar wavelength range, with the Ti-Sapphire emission spectrum similar to that of the tungsten-halogen lamp in the 700-950 nm range but weaker in the 950-1100 nm range. The design of the Ti-Sapphire light source used for the emission spectral measurements plotted in FIGS. 13 and 14 is as shown in FIG. 1 and more optimal designs such as those shown in FIGS. 6 and 7 , or with the use of a Ti-Sapphire rod with a longer length or higher Ti+3 concentration, would lead to substantial increases in the emission intensity of the Ti-Sapphire light source.
Reflection Spectra Measured with Ti-Sapphire and Tungsten Halogen Light Sources for Powdered Samples
In both FIGS. 15 and 16 , the top spectrum is sucrose, the second spectrum from the top is glucose, the third spectrum is acetaminophen, and the bottom spectrum is amoxicillin. These compounds exhibit distinct spectral patterns that can easily be differentiated by eye or by standard multivariate calibration algorithms such as Partial Least Squares discriminate analysis or Principle Component Discriminant analysis. The spectral patterns shown in FIG. 15 , as measured with the Ti-Sapphire near-infrared light source, have the same shape as those measured using the tungsten-halogen light source and shown in FIG. 16 .
Near-Infrared Transmission Spectra of Drug Tablets Measured with the Ti-Sapphire and Tungsten-Halogen Light Sources
The configuration shown in FIG. 4 was used to measure transmission spectra (plotted in absorbance units) of two different types of drug tablets with the Ti-Sapphire light source together with a ultra-miniature diffraction grating spectrometer module. Light source reference spectra were measured using a Spectralon (compressed and sintered Teflon powder) disk with a thickness of 4.5 mm in place of the tablet sample. The Spectralon disk produces about the same average optical attenuation from light scattering in the 700-1050 nm range as a typical drug tablet, but without any spectral features. The receiving optical fiber for the ultra-miniature spectrometer module was placed just after the tablet sample or the Spectralon disk for spectral measurement. Transmission spectra were also measured using a 15 W commercial fiber-optic tungsten halogen light source filtered with a 645 nm (50% cutoff point) longpass glass filter that transmits at wavelengths longer than about 640 nm and blocks ultraviolet and visible wavelength light. For the tungsten halogen spectra, the optical configuration illustrated in FIG. 4 was used, with the Ti-Sapphire source replaced with the 15 W tungsten halogen light source. The commercial 15 W tungsten-halogen fiber-optic light source couples light emitted by the tungsten filament to an SMA fiber optic connector using a convex focusing lens. The commercial fiber-optic tungsten halogen source used for the transmission mode spectral measurements was modified by replacing the focusing lens and SMA fiber-optic connector assembly with an external convex lens of slightly larger focal length and diameter to focus the tungsten-halogen light onto the front surface plane of the sample. This modification of the tungsten halogen source increased the light intensity level transmitted through the samples or the Spectralon disk by more than a factor 10.
It is to be understood that the above description is intended to be illustrative, and not restrictive. Many other embodiments will be apparent to those of skill in the art upon reviewing the above description. The scope of the invention should, therefore, be determined with reference to the appended claims, along with the full scope of equivalents to which such claims are entitled.
Claims (12)
1. A light source for use in spectroscopy comprising:
a single blue or blue-green high-power LED with center wavelength between 460 and 490 nm; and
a Ti+3-Sapphire luminescent element selected from the group consisting of: a single crystal rod, a single crystal disk, a polycrystalline rod, a polycrystalline disk, a layer of Ti+3-Sapphire powder embedded in a clear optical encapsulant, and a layer of Ti+3-Sapphire powder mixed with one or more luminescent powders and embedded in a clear optical encapsulant;
wherein the LED light passes through the luminescent element to produce luminescent emission with continuous coverage of at least the 700-1000 nm wavelength range which is used to illuminate a sample for spectroscopic measurement.
2. The light source of claim 1 , further comprising a reflector surrounding the LED and luminescent element, the reflector selected from the group consisting of a cylindrical aluminum coated reflector, a cylindrical gold coated reflector, and a cylindrical solid aluminum reflector.
3. The light source of claim 1 , further comprising a transmission element positioned to relay light from the luminescent element to the sample, the transmission element selected from a single optical fiber or an optical fiber bundle.
4. The light source of claim 2 , further comprising a transmission element positioned to relay light from the luminescent element to the sample, the transmission element selected from a single optical fiber or an optical fiber bundle.
5. The light source of claim 1 , wherein the luminescent element is the Ti+3-Sapphire powder mixed with one or more additional luminescent powders and embedded in a clear optical encapsulant, and the one or more additional luminescent powders are rare-earth oxides or fluorescent quantum dots and that emit luminescence in the 930-1050 nm spectral range.
6. The light source of claim 2 , wherein the luminescent element is the Ti+3-Sapphire powder mixed with one or more additional luminescent powders and embedded in a clear optical encapsulant, and the additional luminescent powders are rare-earth oxides or fluorescent quantum dots and that emit luminescence in the 930-1050 nm spectral range.
7. The light source of claim 1 , further comprising:
a near-infrared LED with center emission wavelength in the 900-1050 nm range; and
a dichroic beamsplitter positioned to combine light from the near-infrared LED with light from the luminescent element before reaching the sample.
8. The light source of claim 1 , further comprising:
a white LED with emission wavelength in the 400-700 nm range; and
a dichroic beamsplitter;
wherein the dichroic beamsplitter is positioned to combine light from the white LED with light from the luminescent element before reaching the sample.
9. The light source of claim 1 , further comprising an electronic circuit included to drive the blue or blue-green LED with square or sine-wave modulated current, and wherein the light source output is square or sine-wave modulated near-infrared light.
10. A analyzer system for spectroscopy comprising:
the light source of claim 1 ;
a sample positioned to receive light from the light source;
a spectrometer positioned to receive light transmitted through or reflected from the sample; and
a microprocessor or computer connected to the spectrometer controlling spectral data collection and storage, wherein the microprocessor or computer stores or accesses multivariate calibration algorithms to identify materials or quantify the concentration of compounds present in the sample from spectral data acquired from the spectrometer.
11. A method of spectroscopy, comprising:
powering, with a continuous DC current, a single blue or blue-green LED having a center wavelength between 460 to 490 nm;
exciting a Ti+3-Sapphire luminescent element with the light output of the blue or blue-green LED to produce luminescent emission continuously covering at least the 700-1000 nm wavelength range, the luminescent element selected from the group consisting of: a single crystal rod, a single crystal disk, a polycrystalline rod, a polycrystalline disk, a layer of Ti+3-Sapphire powder embedded in a clear optical encapsulant, and a layer of Ti+3-Sapphire powder mixed with one or more luminescent powders and embedded in a clear optical encapsulant; and
directing light output of the luminescent element transmitted through or reflected from a sample to a spectrometer coupled to a microprocessor or computer for collection, storage, and analysis of spectral data for identification or quantification of one or more materials or compounds present in the sample.
12. The method of claim 11 , wherein powering the blue or blue-green LED is conducted with square or sine-wave modulated current, with a modulation frequency within the 10 Hz to 10 KHz range, and further comprising synchronizing the spectrometer collection with the square or sine-wave modulation of the LED for implementation of lock-in amplification signal processing for removal of interference in the measured spectra from sunlight or room light entering the spectrometer optical input.
Priority Applications (3)
| Application Number | Priority Date | Filing Date | Title |
|---|---|---|---|
| US14/860,259 US9528876B2 (en) | 2014-09-29 | 2015-09-21 | Solid state broad band near-infrared light source |
| EP15847395.9A EP3201583B1 (en) | 2014-09-29 | 2015-09-24 | Solid state broad band near-infrared light source |
| PCT/IB2015/057368 WO2016051318A2 (en) | 2014-09-29 | 2015-09-24 | Solid state broad band near-infrared light source |
Applications Claiming Priority (2)
| Application Number | Priority Date | Filing Date | Title |
|---|---|---|---|
| US201462056941P | 2014-09-29 | 2014-09-29 | |
| US14/860,259 US9528876B2 (en) | 2014-09-29 | 2015-09-21 | Solid state broad band near-infrared light source |
Publications (2)
| Publication Number | Publication Date |
|---|---|
| US20160091367A1 US20160091367A1 (en) | 2016-03-31 |
| US9528876B2 true US9528876B2 (en) | 2016-12-27 |
Family
ID=55584068
Family Applications (1)
| Application Number | Title | Priority Date | Filing Date |
|---|---|---|---|
| US14/860,259 Active US9528876B2 (en) | 2014-09-29 | 2015-09-21 | Solid state broad band near-infrared light source |
Country Status (3)
| Country | Link |
|---|---|
| US (1) | US9528876B2 (en) |
| EP (1) | EP3201583B1 (en) |
| WO (1) | WO2016051318A2 (en) |
Cited By (7)
| Publication number | Priority date | Publication date | Assignee | Title |
|---|---|---|---|---|
| WO2020236902A1 (en) * | 2019-05-20 | 2020-11-26 | Quantum Photonics Corporation | A system and a method for providing a turnkey neurological solution |
| US11587673B2 (en) | 2012-08-28 | 2023-02-21 | Delos Living Llc | Systems, methods and articles for enhancing wellness associated with habitable environments |
| US11649977B2 (en) | 2018-09-14 | 2023-05-16 | Delos Living Llc | Systems and methods for air remediation |
| US11668481B2 (en) | 2017-08-30 | 2023-06-06 | Delos Living Llc | Systems, methods and articles for assessing and/or improving health and well-being |
| US11763401B2 (en) | 2014-02-28 | 2023-09-19 | Delos Living Llc | Systems, methods and articles for enhancing wellness associated with habitable environments |
| US11844163B2 (en) | 2019-02-26 | 2023-12-12 | Delos Living Llc | Method and apparatus for lighting in an office environment |
| US11898898B2 (en) | 2019-03-25 | 2024-02-13 | Delos Living Llc | Systems and methods for acoustic monitoring |
Families Citing this family (8)
| Publication number | Priority date | Publication date | Assignee | Title |
|---|---|---|---|---|
| CN107166330A (en) * | 2017-06-13 | 2017-09-15 | 东北大学 | A kind of adaptive photoelectric mixed optical fiber illuminator and method |
| US10473581B2 (en) | 2017-08-09 | 2019-11-12 | Raytheon Company | Irradiation of lead based quantum dots to generate near infrared phosphorescence as part of a compact, thin profile, on-demand calibration source |
| CN108828756B (en) * | 2018-06-07 | 2020-05-19 | 浙江大学 | Surface plasma nonlinear structured light illumination super-resolution microscopic imaging method and device |
| DE102018213377A1 (en) | 2018-08-09 | 2020-02-13 | Robert Bosch Gmbh | Spectrometer and spectrometer calibration method |
| DE102019125429B3 (en) * | 2019-09-20 | 2020-12-10 | Motherson Innovations Company Limited | Detection system and a vehicle with this system |
| CN110783235A (en) * | 2019-11-04 | 2020-02-11 | 黄倩倩 | LED wafer detects equipment of choosing based on light sense component |
| CN113349740A (en) * | 2021-08-05 | 2021-09-07 | 清华大学 | Micro head-mounted microscope imaging device and method based on depth optics |
| JP2023137889A (en) * | 2022-03-18 | 2023-09-29 | 株式会社トプコン | Grain component sensor and grain component analyzer |
Citations (28)
| Publication number | Priority date | Publication date | Assignee | Title |
|---|---|---|---|---|
| US5218609A (en) * | 1990-09-19 | 1993-06-08 | Tosoh Corporation | Solid laser oscillator |
| US5966393A (en) | 1996-12-13 | 1999-10-12 | The Regents Of The University Of California | Hybrid light-emitting sources for efficient and cost effective white lighting and for full-color applications |
| US6417019B1 (en) | 2001-04-04 | 2002-07-09 | Lumileds Lighting, U.S., Llc | Phosphor converted light emitting diode |
| US20020167485A1 (en) * | 2001-03-02 | 2002-11-14 | Innovative Solutions & Support, Inc. | Image display generator for a head-up display |
| US20020185603A1 (en) | 2001-02-22 | 2002-12-12 | Daly James T. | Absorption spectroscopy apparatus and method |
| US6670748B2 (en) | 2001-09-25 | 2003-12-30 | Patent-Treuhand-Gesellschaft für elektrische Glühlampen mbH | Illumination unit having at least one LED as light source |
| US6850013B1 (en) | 1998-07-04 | 2005-02-01 | Qinetiq Limited | Infrared light emitting diodes |
| US20050161694A1 (en) | 1996-06-26 | 2005-07-28 | Osram Gmbh | Light-radiating semiconductor component with a luminescence conversion element |
| US7682848B2 (en) | 1996-07-29 | 2010-03-23 | Nichia Corporation | Light emitting device with blue light LED and phosphor components |
| US20100102707A1 (en) | 2008-10-29 | 2010-04-29 | Kabushiki Kaisha Toshiba | Red fluorescent substance and light-emitting device employing the same |
| WO2010053341A1 (en) | 2008-11-07 | 2010-05-14 | Uab "Hortiled" | Phosphor conversion light-emitting diode for meeting photomorphogenetic needs of plants |
| US7795625B2 (en) | 2006-01-16 | 2010-09-14 | Panasonic Corporation | Semiconductor light-emitting device |
| US7887718B2 (en) | 2005-03-04 | 2011-02-15 | Dowa Electronics Materials Co., Ltd. | Phosphor and manufacturing method therefore, and light emission device using the phosphor |
| US20120099102A1 (en) | 2010-10-26 | 2012-04-26 | Bello Job M | Dual and multi-wavelength sampling probe for raman spectroscopy |
| US20120300432A1 (en) | 2010-03-01 | 2012-11-29 | Panasonic Corporation | Led lamp, led illumination device, and led module |
| US20130050980A1 (en) | 2011-08-24 | 2013-02-28 | Masahiro Kato | Luminescent material |
| US20130056775A1 (en) | 2011-05-20 | 2013-03-07 | Yasuyuki Kawakami | Light source device and lighting device |
| US20130127333A1 (en) | 2010-12-28 | 2013-05-23 | Beijing Yuji Science And Technology Co. Ltd | Oxynitride luminescent material, preparation method thereof and illumination light source made from such material |
| US8471459B2 (en) | 2010-09-02 | 2013-06-25 | Kabushiki Kaisha Toshiba | Fluorescent substance and light-emitting device employing the same |
| US20130160855A1 (en) * | 2010-06-29 | 2013-06-27 | Dyenamo Ab | High efficiency dye-sensitized solar cells |
| US8475682B2 (en) | 2005-09-27 | 2013-07-02 | Mitsubishi Chemical Corporation | Phosphor and manufacturing method therefore, and light emission device using the phosphor |
| US20130314893A1 (en) * | 2012-05-24 | 2013-11-28 | Lumen Dynamics Group Inc. | High brightness illumination system and wavelength conversion module for microscopy and other applications |
| US20130326941A1 (en) | 2012-04-05 | 2013-12-12 | Nanoco Technologies Ltd. | Quantum Dot LED's to Enhance Growth in Photosynthetic Organisms |
| CN103450894A (en) | 2013-10-05 | 2013-12-18 | 上海科润光电技术有限公司 | Infrared light-emitting material motivated by blue light |
| US20140084782A1 (en) | 2012-09-25 | 2014-03-27 | Kabushiki Kaisha Toshiba | Fluorescent substance, light-emitting device and method for producing fluorescent substance |
| US20140265818A1 (en) | 2013-03-15 | 2014-09-18 | Kabushiki Kaisha Toshiba | Fluorescent substance and light-emitting device employing the same |
| US8853712B2 (en) | 2008-11-18 | 2014-10-07 | Cree, Inc. | High efficacy semiconductor light emitting devices employing remote phosphor configurations |
| US20160027969A1 (en) * | 2013-01-16 | 2016-01-28 | Koninklijke Philips N.V. | Led using luminescent sapphire as down-converter |
Family Cites Families (2)
| Publication number | Priority date | Publication date | Assignee | Title |
|---|---|---|---|---|
| WO2003062775A1 (en) * | 2002-01-17 | 2003-07-31 | Hutchinson Technology Inc. | Spectroscopy light source |
| US9297749B2 (en) * | 2012-03-27 | 2016-03-29 | Innovative Science Tools, Inc. | Optical analyzer for identification of materials using transmission spectroscopy |
-
2015
- 2015-09-21 US US14/860,259 patent/US9528876B2/en active Active
- 2015-09-24 EP EP15847395.9A patent/EP3201583B1/en active Active
- 2015-09-24 WO PCT/IB2015/057368 patent/WO2016051318A2/en active Application Filing
Patent Citations (28)
| Publication number | Priority date | Publication date | Assignee | Title |
|---|---|---|---|---|
| US5218609A (en) * | 1990-09-19 | 1993-06-08 | Tosoh Corporation | Solid laser oscillator |
| US20050161694A1 (en) | 1996-06-26 | 2005-07-28 | Osram Gmbh | Light-radiating semiconductor component with a luminescence conversion element |
| US7682848B2 (en) | 1996-07-29 | 2010-03-23 | Nichia Corporation | Light emitting device with blue light LED and phosphor components |
| US5966393A (en) | 1996-12-13 | 1999-10-12 | The Regents Of The University Of California | Hybrid light-emitting sources for efficient and cost effective white lighting and for full-color applications |
| US6850013B1 (en) | 1998-07-04 | 2005-02-01 | Qinetiq Limited | Infrared light emitting diodes |
| US20020185603A1 (en) | 2001-02-22 | 2002-12-12 | Daly James T. | Absorption spectroscopy apparatus and method |
| US20020167485A1 (en) * | 2001-03-02 | 2002-11-14 | Innovative Solutions & Support, Inc. | Image display generator for a head-up display |
| US6417019B1 (en) | 2001-04-04 | 2002-07-09 | Lumileds Lighting, U.S., Llc | Phosphor converted light emitting diode |
| US6670748B2 (en) | 2001-09-25 | 2003-12-30 | Patent-Treuhand-Gesellschaft für elektrische Glühlampen mbH | Illumination unit having at least one LED as light source |
| US7887718B2 (en) | 2005-03-04 | 2011-02-15 | Dowa Electronics Materials Co., Ltd. | Phosphor and manufacturing method therefore, and light emission device using the phosphor |
| US8475682B2 (en) | 2005-09-27 | 2013-07-02 | Mitsubishi Chemical Corporation | Phosphor and manufacturing method therefore, and light emission device using the phosphor |
| US7795625B2 (en) | 2006-01-16 | 2010-09-14 | Panasonic Corporation | Semiconductor light-emitting device |
| US20100102707A1 (en) | 2008-10-29 | 2010-04-29 | Kabushiki Kaisha Toshiba | Red fluorescent substance and light-emitting device employing the same |
| WO2010053341A1 (en) | 2008-11-07 | 2010-05-14 | Uab "Hortiled" | Phosphor conversion light-emitting diode for meeting photomorphogenetic needs of plants |
| US8853712B2 (en) | 2008-11-18 | 2014-10-07 | Cree, Inc. | High efficacy semiconductor light emitting devices employing remote phosphor configurations |
| US20120300432A1 (en) | 2010-03-01 | 2012-11-29 | Panasonic Corporation | Led lamp, led illumination device, and led module |
| US20130160855A1 (en) * | 2010-06-29 | 2013-06-27 | Dyenamo Ab | High efficiency dye-sensitized solar cells |
| US8471459B2 (en) | 2010-09-02 | 2013-06-25 | Kabushiki Kaisha Toshiba | Fluorescent substance and light-emitting device employing the same |
| US20120099102A1 (en) | 2010-10-26 | 2012-04-26 | Bello Job M | Dual and multi-wavelength sampling probe for raman spectroscopy |
| US20130127333A1 (en) | 2010-12-28 | 2013-05-23 | Beijing Yuji Science And Technology Co. Ltd | Oxynitride luminescent material, preparation method thereof and illumination light source made from such material |
| US20130056775A1 (en) | 2011-05-20 | 2013-03-07 | Yasuyuki Kawakami | Light source device and lighting device |
| US20130050980A1 (en) | 2011-08-24 | 2013-02-28 | Masahiro Kato | Luminescent material |
| US20130326941A1 (en) | 2012-04-05 | 2013-12-12 | Nanoco Technologies Ltd. | Quantum Dot LED's to Enhance Growth in Photosynthetic Organisms |
| US20130314893A1 (en) * | 2012-05-24 | 2013-11-28 | Lumen Dynamics Group Inc. | High brightness illumination system and wavelength conversion module for microscopy and other applications |
| US20140084782A1 (en) | 2012-09-25 | 2014-03-27 | Kabushiki Kaisha Toshiba | Fluorescent substance, light-emitting device and method for producing fluorescent substance |
| US20160027969A1 (en) * | 2013-01-16 | 2016-01-28 | Koninklijke Philips N.V. | Led using luminescent sapphire as down-converter |
| US20140265818A1 (en) | 2013-03-15 | 2014-09-18 | Kabushiki Kaisha Toshiba | Fluorescent substance and light-emitting device employing the same |
| CN103450894A (en) | 2013-10-05 | 2013-12-18 | 上海科润光电技术有限公司 | Infrared light-emitting material motivated by blue light |
Non-Patent Citations (2)
| Title |
|---|
| Faulkner et al. "Lanthanide Complexes for Luminescence Imaging Applications." Applied Spectroscopy Reviews, vol. 40, 2005, pp. 1-31, online: http://www.bioee.ee.columbia.edu/courses/upload/Bibliography/faulker-appliedspectroscopy-2005.pdf. |
| Punke et al. "High-repetition-rate white-fight pump probe spectroscopy with a tapered fiber." Optics Letters vol. 31, No. 8, Apr. 15, 2006; pp. 1157-1159, online: http://www.dmphotonics.com/Punke-OL-2006.pdf. |
Cited By (8)
| Publication number | Priority date | Publication date | Assignee | Title |
|---|---|---|---|---|
| US11587673B2 (en) | 2012-08-28 | 2023-02-21 | Delos Living Llc | Systems, methods and articles for enhancing wellness associated with habitable environments |
| US11763401B2 (en) | 2014-02-28 | 2023-09-19 | Delos Living Llc | Systems, methods and articles for enhancing wellness associated with habitable environments |
| US11668481B2 (en) | 2017-08-30 | 2023-06-06 | Delos Living Llc | Systems, methods and articles for assessing and/or improving health and well-being |
| US11649977B2 (en) | 2018-09-14 | 2023-05-16 | Delos Living Llc | Systems and methods for air remediation |
| US11844163B2 (en) | 2019-02-26 | 2023-12-12 | Delos Living Llc | Method and apparatus for lighting in an office environment |
| US11898898B2 (en) | 2019-03-25 | 2024-02-13 | Delos Living Llc | Systems and methods for acoustic monitoring |
| WO2020236902A1 (en) * | 2019-05-20 | 2020-11-26 | Quantum Photonics Corporation | A system and a method for providing a turnkey neurological solution |
| US11413424B2 (en) | 2019-05-20 | 2022-08-16 | Quantum Chromatics Corporation | System and a method for turnkey neurological solution |
Also Published As
| Publication number | Publication date |
|---|---|
| EP3201583A4 (en) | 2017-11-22 |
| WO2016051318A2 (en) | 2016-04-07 |
| EP3201583A2 (en) | 2017-08-09 |
| EP3201583B1 (en) | 2019-10-30 |
| US20160091367A1 (en) | 2016-03-31 |
| WO2016051318A3 (en) | 2016-08-25 |
Similar Documents
| Publication | Publication Date | Title |
|---|---|---|
| US9528876B2 (en) | Solid state broad band near-infrared light source | |
| US20070262714A1 (en) | Illumination source including photoluminescent material and a filter, and an apparatus including same | |
| US20070262294A1 (en) | Light source including quantum dot material and apparatus including same | |
| US7557925B2 (en) | Optical instrument and parts thereof for optimally defining light pathways | |
| CN110869750A (en) | Optical fiber coupling broadband light source | |
| US7764421B2 (en) | Wavelength-converted light generating apparatus and generating method | |
| EP2525703B1 (en) | Phosphor device and lighting apparatus comprising the same | |
| CN102798621A (en) | Multi-piece reflection type ultraviolet induced biological fluorescence detection system | |
| US10722157B2 (en) | Apparatus and method for monitoring biometric parameters using an ambient light collector | |
| US6836502B2 (en) | Spectroscopy light source | |
| US20190142287A1 (en) | Optical Heart Rate Sensor | |
| Nourry-Martin et al. | Light recycling in LED-pumped Ce: YAG luminescent concentrators | |
| CN111157140B (en) | Photoelectric conversion structure of fluorescent optical fiber temperature sensor | |
| KR100737170B1 (en) | Portable quantum dot flurescent detector | |
| US20210293620A1 (en) | Spectrometer and Method for Calibrating the Spectrometer | |
| CN201611335U (en) | Underwater fluorescent detector for yellow substances | |
| US11428573B2 (en) | Light emitting structure, photo-acoustic spectroscopy sensing device, method | |
| CN206450590U (en) | A kind of mobile terminal and the analysis system based on mobile terminal | |
| CN110702264A (en) | Detection system for quantum dot optical fiber illumination | |
| WO2019107281A1 (en) | Light emitting device and illumination device | |
| CN206370607U (en) | A kind of narrow bandwidth 750nm laser source systems excited for medicine | |
| CN219957303U (en) | Light source with constant illumination intensity and photoelectric measuring device | |
| US20080100839A1 (en) | Method and system for measuring light propagating at multiple wavelengths | |
| WO2023008028A1 (en) | Light-emitting device and electronic apparatus | |
| EP4296333A1 (en) | Light-emitting device and electronic apparatus using same |
Legal Events
| Date | Code | Title | Description |
|---|---|---|---|
| STCF | Information on status: patent grant |
Free format text: PATENTED CASE |
|
| MAFP | Maintenance fee payment |
Free format text: PAYMENT OF MAINTENANCE FEE, 4TH YR, SMALL ENTITY (ORIGINAL EVENT CODE: M2551); ENTITY STATUS OF PATENT OWNER: SMALL ENTITY Year of fee payment: 4 |
|
| MAFP | Maintenance fee payment |
Free format text: PAYMENT OF MAINTENANCE FEE, 8TH YR, SMALL ENTITY (ORIGINAL EVENT CODE: M2552); ENTITY STATUS OF PATENT OWNER: SMALL ENTITY Year of fee payment: 8 |