WO1995020681A1 - Comparative gene transcript analysis - Google Patents
Comparative gene transcript analysis Download PDFInfo
- Publication number
- WO1995020681A1 WO1995020681A1 PCT/US1995/001160 US9501160W WO9520681A1 WO 1995020681 A1 WO1995020681 A1 WO 1995020681A1 US 9501160 W US9501160 W US 9501160W WO 9520681 A1 WO9520681 A1 WO 9520681A1
- Authority
- WO
- WIPO (PCT)
- Prior art keywords
- sequences
- transcript
- library
- gene
- biological
- Prior art date
Links
Classifications
-
- C—CHEMISTRY; METALLURGY
- C12—BIOCHEMISTRY; BEER; SPIRITS; WINE; VINEGAR; MICROBIOLOGY; ENZYMOLOGY; MUTATION OR GENETIC ENGINEERING
- C12Q—MEASURING OR TESTING PROCESSES INVOLVING ENZYMES, NUCLEIC ACIDS OR MICROORGANISMS; COMPOSITIONS OR TEST PAPERS THEREFOR; PROCESSES OF PREPARING SUCH COMPOSITIONS; CONDITION-RESPONSIVE CONTROL IN MICROBIOLOGICAL OR ENZYMOLOGICAL PROCESSES
- C12Q1/00—Measuring or testing processes involving enzymes, nucleic acids or microorganisms; Compositions therefor; Processes of preparing such compositions
- C12Q1/68—Measuring or testing processes involving enzymes, nucleic acids or microorganisms; Compositions therefor; Processes of preparing such compositions involving nucleic acids
- C12Q1/6809—Methods for determination or identification of nucleic acids involving differential detection
-
- C—CHEMISTRY; METALLURGY
- C12—BIOCHEMISTRY; BEER; SPIRITS; WINE; VINEGAR; MICROBIOLOGY; ENZYMOLOGY; MUTATION OR GENETIC ENGINEERING
- C12Q—MEASURING OR TESTING PROCESSES INVOLVING ENZYMES, NUCLEIC ACIDS OR MICROORGANISMS; COMPOSITIONS OR TEST PAPERS THEREFOR; PROCESSES OF PREPARING SUCH COMPOSITIONS; CONDITION-RESPONSIVE CONTROL IN MICROBIOLOGICAL OR ENZYMOLOGICAL PROCESSES
- C12Q1/00—Measuring or testing processes involving enzymes, nucleic acids or microorganisms; Compositions therefor; Processes of preparing such compositions
- C12Q1/68—Measuring or testing processes involving enzymes, nucleic acids or microorganisms; Compositions therefor; Processes of preparing such compositions involving nucleic acids
-
- G—PHYSICS
- G16—INFORMATION AND COMMUNICATION TECHNOLOGY [ICT] SPECIALLY ADAPTED FOR SPECIFIC APPLICATION FIELDS
- G16B—BIOINFORMATICS, i.e. INFORMATION AND COMMUNICATION TECHNOLOGY [ICT] SPECIALLY ADAPTED FOR GENETIC OR PROTEIN-RELATED DATA PROCESSING IN COMPUTATIONAL MOLECULAR BIOLOGY
- G16B20/00—ICT specially adapted for functional genomics or proteomics, e.g. genotype-phenotype associations
-
- G—PHYSICS
- G16—INFORMATION AND COMMUNICATION TECHNOLOGY [ICT] SPECIALLY ADAPTED FOR SPECIFIC APPLICATION FIELDS
- G16B—BIOINFORMATICS, i.e. INFORMATION AND COMMUNICATION TECHNOLOGY [ICT] SPECIALLY ADAPTED FOR GENETIC OR PROTEIN-RELATED DATA PROCESSING IN COMPUTATIONAL MOLECULAR BIOLOGY
- G16B30/00—ICT specially adapted for sequence analysis involving nucleotides or amino acids
- G16B30/10—Sequence alignment; Homology search
-
- G—PHYSICS
- G16—INFORMATION AND COMMUNICATION TECHNOLOGY [ICT] SPECIALLY ADAPTED FOR SPECIFIC APPLICATION FIELDS
- G16B—BIOINFORMATICS, i.e. INFORMATION AND COMMUNICATION TECHNOLOGY [ICT] SPECIALLY ADAPTED FOR GENETIC OR PROTEIN-RELATED DATA PROCESSING IN COMPUTATIONAL MOLECULAR BIOLOGY
- G16B30/00—ICT specially adapted for sequence analysis involving nucleotides or amino acids
- G16B30/20—Sequence assembly
-
- G—PHYSICS
- G16—INFORMATION AND COMMUNICATION TECHNOLOGY [ICT] SPECIALLY ADAPTED FOR SPECIFIC APPLICATION FIELDS
- G16B—BIOINFORMATICS, i.e. INFORMATION AND COMMUNICATION TECHNOLOGY [ICT] SPECIALLY ADAPTED FOR GENETIC OR PROTEIN-RELATED DATA PROCESSING IN COMPUTATIONAL MOLECULAR BIOLOGY
- G16B35/00—ICT specially adapted for in silico combinatorial libraries of nucleic acids, proteins or peptides
- G16B35/10—Design of libraries
-
- G—PHYSICS
- G16—INFORMATION AND COMMUNICATION TECHNOLOGY [ICT] SPECIALLY ADAPTED FOR SPECIFIC APPLICATION FIELDS
- G16B—BIOINFORMATICS, i.e. INFORMATION AND COMMUNICATION TECHNOLOGY [ICT] SPECIALLY ADAPTED FOR GENETIC OR PROTEIN-RELATED DATA PROCESSING IN COMPUTATIONAL MOLECULAR BIOLOGY
- G16B35/00—ICT specially adapted for in silico combinatorial libraries of nucleic acids, proteins or peptides
- G16B35/20—Screening of libraries
-
- G—PHYSICS
- G16—INFORMATION AND COMMUNICATION TECHNOLOGY [ICT] SPECIALLY ADAPTED FOR SPECIFIC APPLICATION FIELDS
- G16B—BIOINFORMATICS, i.e. INFORMATION AND COMMUNICATION TECHNOLOGY [ICT] SPECIALLY ADAPTED FOR GENETIC OR PROTEIN-RELATED DATA PROCESSING IN COMPUTATIONAL MOLECULAR BIOLOGY
- G16B30/00—ICT specially adapted for sequence analysis involving nucleotides or amino acids
-
- G—PHYSICS
- G16—INFORMATION AND COMMUNICATION TECHNOLOGY [ICT] SPECIALLY ADAPTED FOR SPECIFIC APPLICATION FIELDS
- G16B—BIOINFORMATICS, i.e. INFORMATION AND COMMUNICATION TECHNOLOGY [ICT] SPECIALLY ADAPTED FOR GENETIC OR PROTEIN-RELATED DATA PROCESSING IN COMPUTATIONAL MOLECULAR BIOLOGY
- G16B35/00—ICT specially adapted for in silico combinatorial libraries of nucleic acids, proteins or peptides
-
- G—PHYSICS
- G16—INFORMATION AND COMMUNICATION TECHNOLOGY [ICT] SPECIALLY ADAPTED FOR SPECIFIC APPLICATION FIELDS
- G16B—BIOINFORMATICS, i.e. INFORMATION AND COMMUNICATION TECHNOLOGY [ICT] SPECIALLY ADAPTED FOR GENETIC OR PROTEIN-RELATED DATA PROCESSING IN COMPUTATIONAL MOLECULAR BIOLOGY
- G16B50/00—ICT programming tools or database systems specially adapted for bioinformatics
-
- G—PHYSICS
- G16—INFORMATION AND COMMUNICATION TECHNOLOGY [ICT] SPECIALLY ADAPTED FOR SPECIFIC APPLICATION FIELDS
- G16C—COMPUTATIONAL CHEMISTRY; CHEMOINFORMATICS; COMPUTATIONAL MATERIALS SCIENCE
- G16C20/00—Chemoinformatics, i.e. ICT specially adapted for the handling of physicochemical or structural data of chemical particles, elements, compounds or mixtures
- G16C20/60—In silico combinatorial chemistry
Definitions
- the present invention is in the field of molecular biology and computer science; more particularly, the present invention describes methods of analyzing gene transcripts and diagnosing the genetic expression of cells and tissue.
- a third methodology involves sequencing only the transcripts encoding the cellular machinery actively involved in making protein, namely the mRNA.
- the advantage is that the cell has already edited out all the non-coding DNA, and it is relatively easy to identify the protein-coding portion of the RNA.
- the utility of this approach was not immediately obvious to genomic researchers.
- the method was roundly denounced by those committed to genomic sequencing. For example, the head of the U.S. Human Genome project discounted CDNA sequencing as not valuable and refused to approve funding of projects.
- Nucleic acids are found in all living organisms including bacteria, fungi, viruses, plants and animals. It is of interest to determine the relative abundance of different discrete nucleic acids in different cells, tissues and organisms over time under various conditions, treatments and regimes.
- transcripts in different cells have only provided for the analysis of a few known genes at a time by standard molecular biology techniques such as PCR, northern blot analysis, or other types of DNA probe analysis such as in situ
- transcription is induced or otherwise regulated during cell processes such as activation, differentiation, aging, viral transformation, morphogenesis, and mitosis have been pursued for many years, using a variety of methodologies.
- One of the earliest methods was to isolate and analyze levels of the proteins in a cell, tissue, organ system, or even organisms both before and after the process of
- One method of analyzing multiple proteins in a sample is using 2-dimensional gel electrophoresis, wherein proteins can be, in principle, identified and quantified as individual bands, and ultimately reduced to a discrete signal.
- 2-dimensional analysis only resolves approximately 15% of the proteins.
- each band must be excised from the membrane and subjected to protein sequence analysis using Edman degradation.
- Edman degradation Unfortunately, most of the bands were present in quantities too small to obtain a reliable sequence, and many of those bands contained more than one discrete protein. An additional difficulty is that many of the proteins were blocked at the
- hybridization subtraction involves isolation of mRNA from the biological specimen before (B) and after (A) the developmental process of interest, transcribing one set of mRNA into cDNA, subtracting specimen B from specimen A (mRNA from cDNA) by hybridization, and constructing a cDNA library from the non-hybridizing mRNA fraction. Many different groups have used this strategy successfully, and a variety of procedures have been published and improved upon using this same basic scheme. Nucl. Acids Res. 19, 7097-7104 (1991); Nucl. Acids Res. 18, 4833-42 (1990);
- the ability of a given sequence to find a hybridization match is dependent on its unique CoT value.
- the CoT value is a function of the number of copies
- composition for a given sequence Those sequences rich in G + C form stronger duplexes than those with high contents of A + T. Therefore, the former sequences will tend to be removed selectively by hybridization subtraction. Seventh, it is possible that hybridization between nonexact matches can occur. When this happens, the expression of a
- homologous gene may "mask" expression of a gene of
- Matsubara and Okubo proposed using partial cDNA sequences to establish expression profiles of genes which could be used in functional analyses of the human genome.
- Matsubara and Okubo warned against using random priming, as it creates multiple unique DNA fragments from individual mRNAs and may thus skew the analysis of the number of particular mRNAs per library. They sequenced randomly selected members from a 3'-directed cDNA library and established the frequency of appearance of the various ESTs. They proposed comparing lists of ESTs from various cell types to classify genes. Genes expressed in many different cell types were labeled housekeepers and those selectively expressed in certain cells were labeled cellspecific genes, even in the absence of the full sequence of the gene or the biological activity of the gene product.
- the present invention offers several advantages over current protein discovery methods which attempt to isolate individual proteins based upon biological effects.
- the method of the instant invention provides for detailed diagnostic comparisons of cell profiles revealing numerous changes in the expression of individual transcripts.
- the instant invention provides several advantages over current subtraction methods including a more complex library analysis (10 6 to 10 7 clones as compared to 10 3 clones) which allows identification of low abundance messages as well as enabling the identification of messages which either increase or decrease in abundance. These large libraries are very routine to make in contrast to the libraries of previous methods. In addition, homologues can easily be distinguished with the method of the instant invention.
- the present invention provides several advantages over previous methods of electronic analysis of cDNA.
- the method is particularly powerful when more than 100 and preferably more than 1,000 gene transcripts are analyzed. In such a case, new low-frequency transcripts are
- High resolution analysis of gene expression can be used directly as a diagnostic profile or to identify disease-specific genes for the development of more classic diagnostic approaches.
- the invention is a method of analyzing a specimen containing gene transcripts comprising the steps of (a) producing a library of biological sequences; (b) generating a set of transcript sequences, where each of the transcript sequences in said set is indicative of a different one of the biological sequences of the library; (c) processing the transcript sequences in a programmed computer (in which a database of reference transcript sequences indicative of reference sequences is stored), to generate an identified sequence value for each of the transcript sequences, where each said identified sequence value is indicative of sequence annotation and a degree of match between one of the biological sequences of the library and at least one of the reference sequences; and (d) processing each said identified sequence value to generate final data values indicative of the number of times each identified sequence value is present in the library.
- the invention also includes a method of comparing two specimens containing gene transcripts.
- the first specimen is processed as described above.
- the second specimen is used to produce a second library of biological sequences, which is used to generate a second set of transcript sequences, where each of the transcript sequences in the second set is indicative of one of the biological sequences of the second library.
- the second set of transcript sequences is processed in a programmed computer to generate a second set of identified sequence values, namely the further identified sequence values, each of which is indicative of a sequence annotation and includes a degree of match between one of the biological sequences of the second library and at least one of the reference sequences.
- the further identified sequence values are processed to generate further final data values indicative of the number of times each further identified sequence value is present in the second library.
- the final data values from the first specimen and the further identified sequence values from the second specimen are processed to generate ratios of transcript sequences, which indicate the differences in the number of gene transcripts between the two specimens.
- the method includes
- mRNA transcripts quantifying the relative abundance of mRNA in a biological specimen by (a) isolating a population of mRNA transcripts from a biological specimen; (b) identifying genes from which the mRNA was transcribed by a sequence-specific method; (c) determining the numbers of mRNA transcripts corresponding to each of the genes; and (d) using the mRNA transcript numbers to determine the relative abundance of mRNA transcripts within the population of mRNA transcripts.
- transcript image analysis by first obtaining a mixture of mRNA, from which cDNA copies are made.
- the cDNA is
- transfected with cDNA is isolated.
- Each clone in the population is identified by a sequence-specific method which identifies the gene from which the unique mRNA was transcribed. The number of times each gene is identified to a clone is determined to evaluate gene transcript abundance. The genes and their abundances are listed in order of abundance to produce a gene transcript image.
- the relative abundance of the gene transcripts in one cell type or tissue is compared with the relative abundance of gene transcript numbers in a second cell type or tissue in order to identify the
- the method includes a system for analyzing a library of biological sequences including a means for receiving a set of transcript sequences, where each of the transcript sequences is indicative of a
- transcript sequences of the library and a means for processing the transcript sequences in a computer system in which a database of reference transcript sequences indicative of reference sequences is stored, wherein the computer is programmed with software for generating an identified sequence value for each of the transcript sequences, where each said identified sequence value is indicative of a sequence annotation and the degree of match between a different one of the biological
- sequences of the library and at least one of the reference sequences and for processing each said identified sequence value to generate final data values indicative of the number of times each identified sequence value is present in the library.
- the invention is a method and system for quantifying the relative abundance of gene transcripts in a biological specimen.
- the invention provides a method for comparing the gene transcript image from two or more different biological specimens in order to distinguish between the two specimens and identify one or more genes which are differentially expressed between the two
- this gene transcript image and its comparison can be used as a diagnostic.
- One embodiment of the method generates high-throughput sequence-specific analysis of multiple RNAs or their corresponding cDNAs: a gene transcript image.
- Another embodiment of the method produces the gene transcript imaging analysis by the use of high-throughput cDNA sequence analysis.
- two or more gene transcript images can be compared and used to detect or diagnose a particular biological state, disease, or condition which is correlated to the relative abundance of gene transcripts in a given cell or population of cells.
- Table 1 presents a detailed explanation of the letter codes utilized in Tables 2-5.
- transcripts It is a partial list of isolates from the HUVEC cDNA library prepared and sequenced as described below.
- the left-hand column refers to the sequence's order of abundance in this table.
- number is the clone number of the first HUVEC sequence identification reference matching the sequence in the
- N indicates the total number of cDNAs which have the same degree of match with the sequence of the reference transcript in the "entry" column.
- Table 3 is a comparison of the top fifteen most abundant gene transcripts in normal monocytes and activated macrophage cells.
- Table 4 is a detailed summary of library subtraction analysis summary comparing the THP-1 and human macrophage cDNA sequences.
- Table 4 the same code as in Table 2 is used. Additional columns are for "bgfreq” (abundance number in the subtractant library), “rfend” (abundance number in the target library) and “ratio” (the target abundance number divided by the subtractant abundance number) .
- the abundance number in the subtractant library is "0”
- the target abundance number is divided by 0.05. This is a way of obtaining a result (not possible dividing by 0) and distinguishing the result from ratios of subtractant numbers of 1.
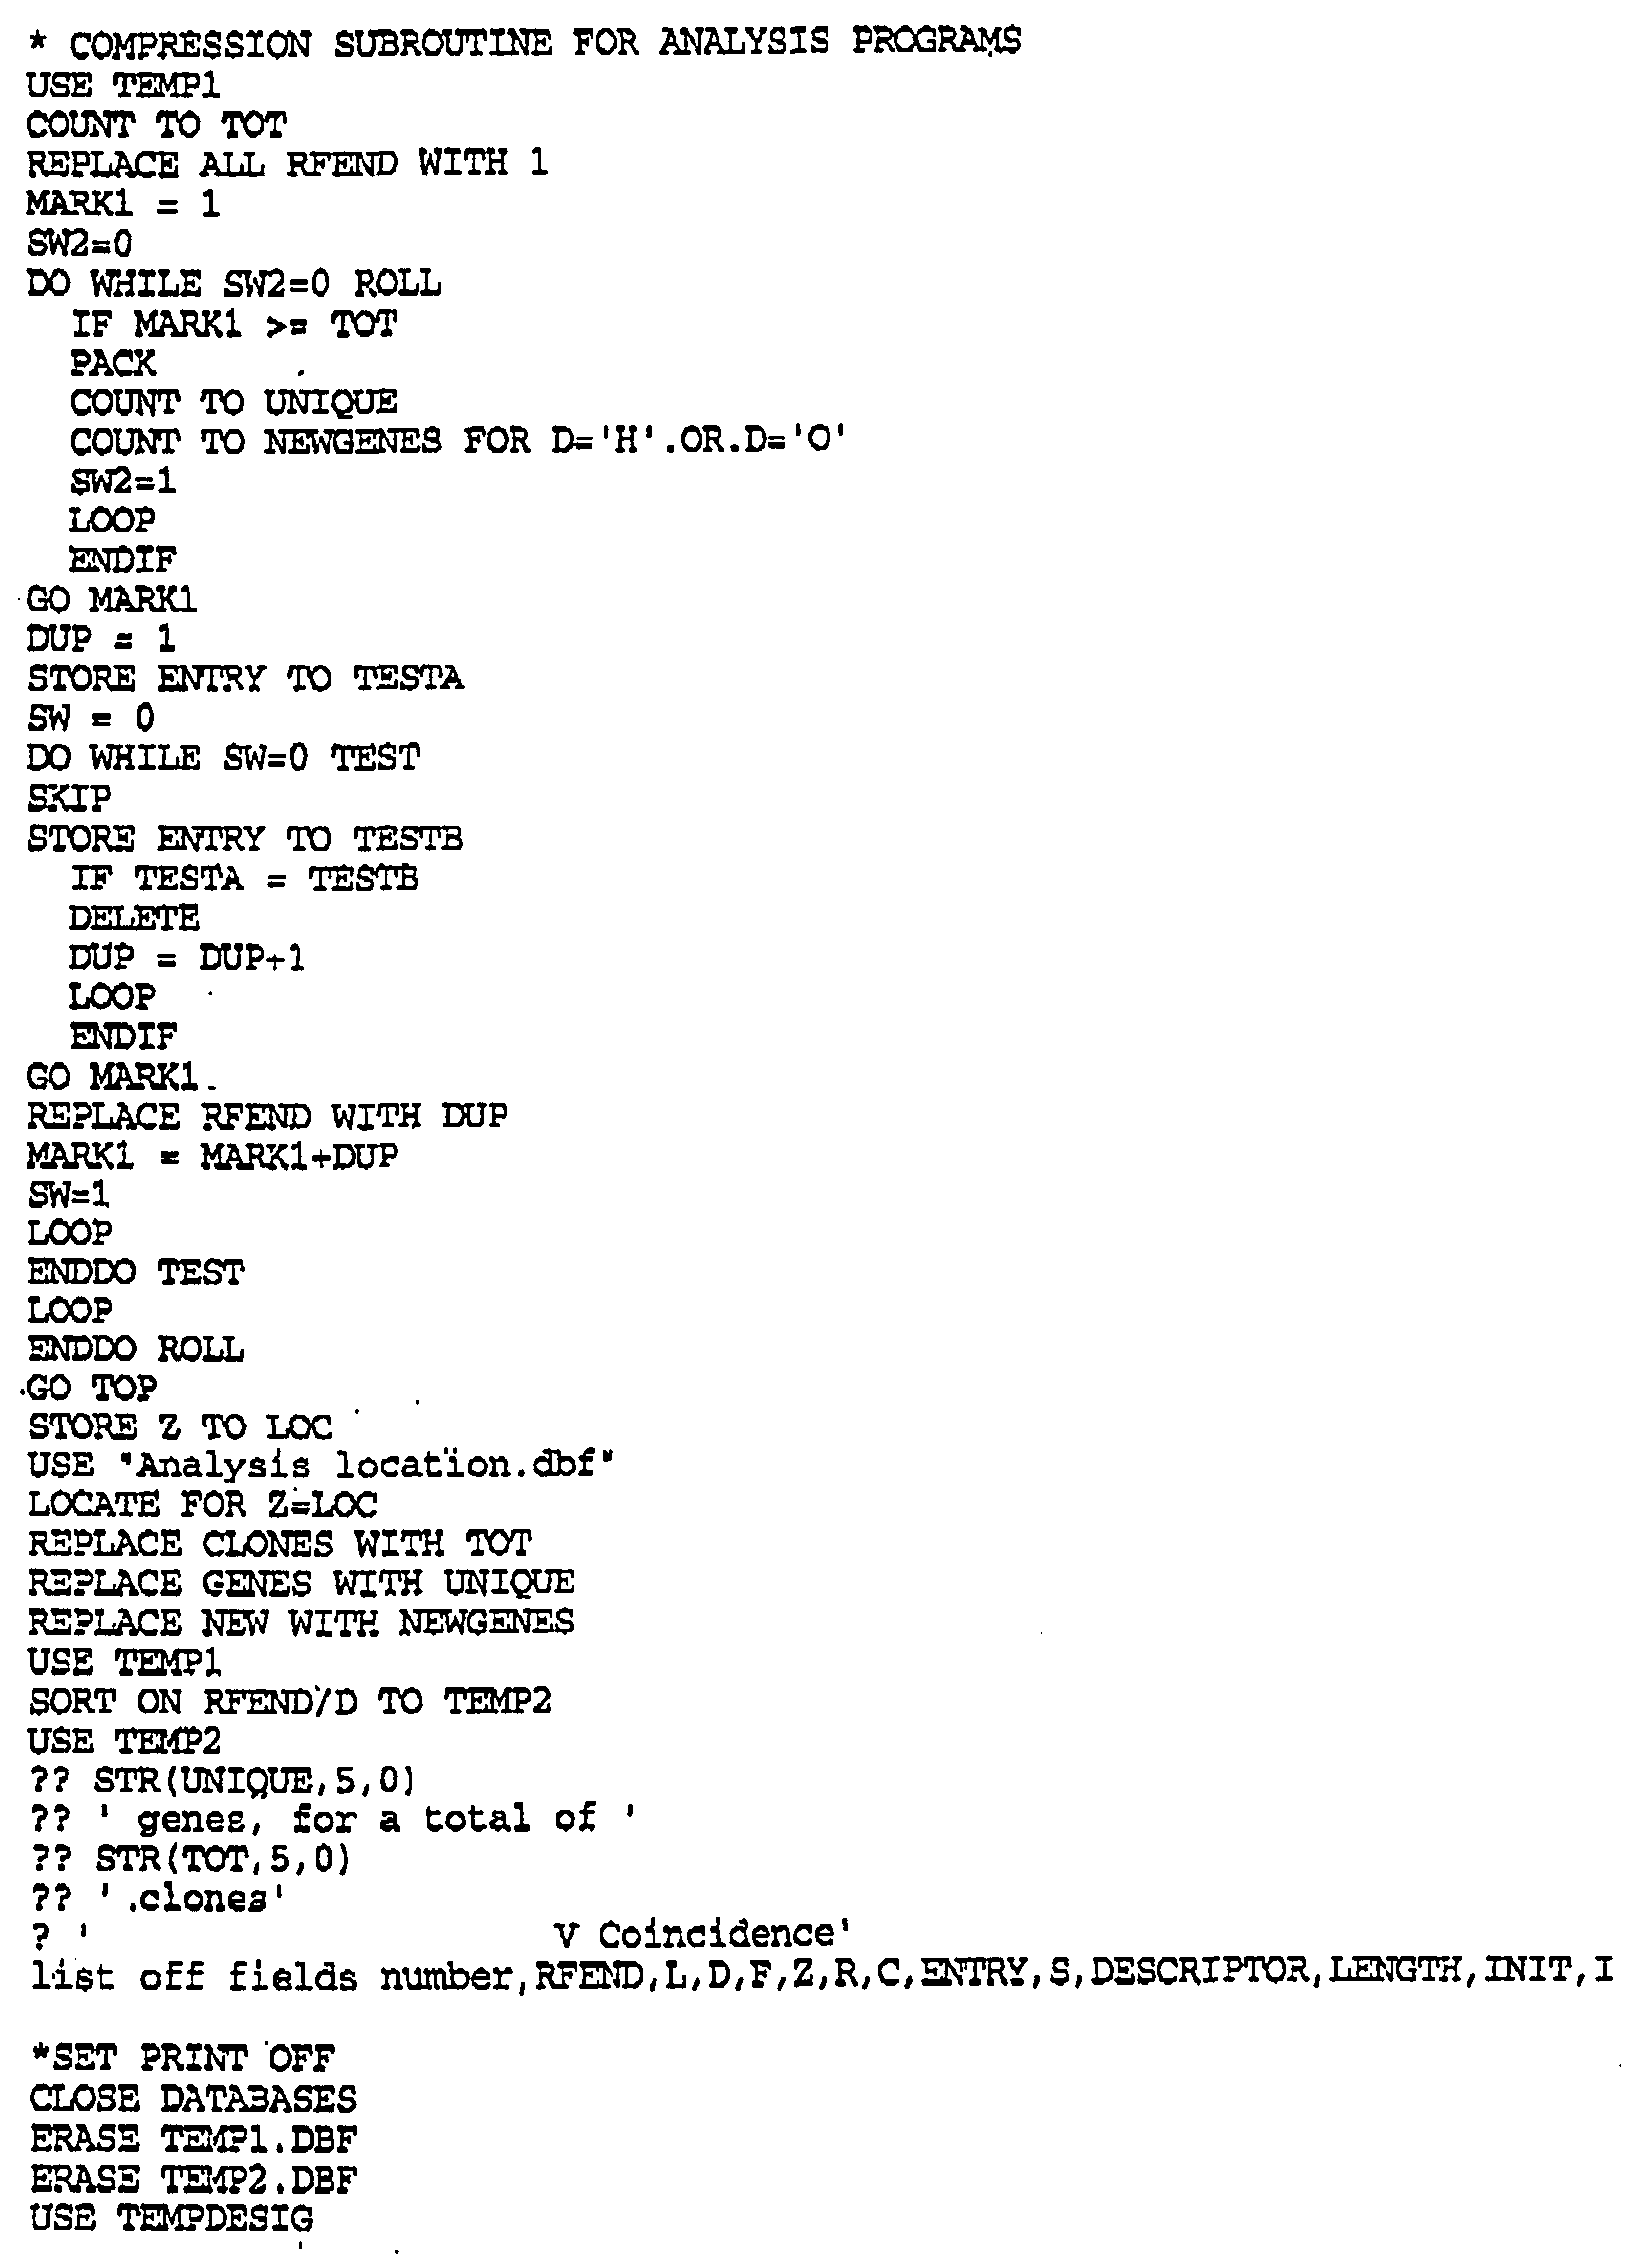
- Table 5 is the computer program, written in source code, for generating gene transcript subtraction profiles.
- Table 6 is a partial listing of database entries used in the electronic northern blot analysis as provided by the present invention.
- Figure 1 is a chart summarizing data collected and stored regarding the library construction portion of sequence preparation and analysis.
- Figure 2 is a diagram representing the sequence of operations performed by "abundance sort" software in a class of preferred embodiments of the inventive method.
- Figure 3 is a block diagram of a preferred embodiment of the system of the invention.
- FIG. 4 is a more detailed block diagram of the bioinformatics process from new sequence (that has already been sequenced but not identified) to printout of the transcript imaging analysis and the provision of database subscriptions. 5.
- the present invention provides a method to compare the relative abundance of gene transcripts in different
- RNA transcript imaging The quantitative analysis of the relative abundance for a set of gene transcripts is denoted herein as “gene transcript image analysis” or “gene transcript frequency analysis”.
- gene transcript image analysis The quantitative analysis of the relative abundance for a set of gene transcripts.
- gene transcript frequency analysis The present invention allows one to obtain a profile for gene transcription in any given population of cells or tissue from any type of organism.
- the invention can be applied to obtain a profile of a specimen consisting of a single cell (or clones of a single cell), or of many cells, or of tissue more complex than a single cell and containing multiple cell types, such as liver.
- the invention has significant advantages in the fields of diagnostics, toxicology and pharmacology, to name a few.
- a highly sophisticated diagnostic test can be performed on the ill patient in whom a diagnosis has not been made.
- a biological specimen consisting of the patient's fluids or tissues is obtained, and the gene transcripts are isolated and expanded to the extent necessary to determine their identity.
- the gene transcripts can be
- gene transcript sequence abundances are compared against reference database sequence abundances including normal data sets for diseased and healthy patients.
- the patient has the disease(s) with which the patient's data set most closely correlates.
- gene transcript frequency analysis can be used to differentiate normal cells or tissues from diseased cells or tissues, just as it highlights differences between normal monocytes and activated macrophages in Table 3.
- Gene transcript imaging provides highly detailed information on the cell and tissue environment, some of which would not be obvious in conventional, less detailed screening methods.
- the gene transcript image is a more powerful method to predict drug toxicity and efficacy.
- the gene transcript image can be used selectively to look at protein categories which are
- transcript frequency analysis is used to differentiate between cancer cells which respond to anti-cancer agents and those which do not respond.
- anti-cancer agents are tamoxifen, vincristine, vinblastine,
- podophyllotoxins etoposide, tenisposide, cisplatin, biologic response modifiers such as interferon, 11-2, GM-CSF, enzymes, hormones and the like.
- This method also provides a means for sorting the gene transcripts by functional category. In the case of cancer cells,
- comparative gene transcript frequency analysis is used to differentiate between control liver cells and liver cells isolated from patients treated with experimental drugs like FIAU to distinguish between pathology caused by the underlying disease and that caused by the drug.
- comparative gene transcript frequency analysis is used to differentiate between brain tissue from patients treated and untreated with lithium.
- comparative gene transcript frequency analysis is used to differentiate between
- comparative gene transcript frequency analysis is used to differentiate between virally infected (including HIV-infected) human cells and
- Gene transcript frequency analysis is also used to rapidly survey gene transcripts in HIV-resistant, HIV-infected, and HIV-sensitive cells.
- comparative gene transcript frequency analysis is used to differentiate between
- bronchial lavage fluids from healthy and unhealthy patients with a variety of ailments bronchial lavage fluids from healthy and unhealthy patients with a variety of ailments.
- comparative gene transcript frequency analysis is used to differentiate between cell, plant, microbial and animal mutants and wild-type species.
- the transcript abundance program is adapted to permit the scientist to evaluate the transcription of one gene in many different tissues. Such comparisons could identify deletion mutants which do not produce a gene product and point mutants which produce a less abundant or otherwise different message.
- Such mutations can affect basic biochemical and pharmacological processes, such as mineral nutrition and metabolism, and can be isolated by means known to those skilled in the art. Thus, crops with improved yields, pest resistance and other factors can be developed.
- comparative gene transcript frequency analysis is used for an interspecies comparative analysis which would allow for the selection of better pharmacologic animal models.
- humans and other animals such as a mouse
- their cultured cells are treated with a specific test agent.
- the relative sequence abundance of each cDNA population is determined. If the animal test system is a good model, homologous genes in the animal cDNA population should change expression similarly to those in human cells. If side effects are detected with the drug, a detailed transcript abundance analysis will be performed to survey gene transcript changes. Models will then be evaluated by comparing basic physiological changes.
- comparative gene transcript frequency analysis is used in a clinical setting to give a highly detailed gene transcript profile of a patient's cells or tissue (for example, a blood sample).
- a patient's cells or tissue for example, a blood sample.
- gene transcript frequency analysis is used to give a high resolution gene expression profile of a
- the method utilizes high-throughput cDNA sequencing to identify specific transcripts of interest.
- the generated cDNA and deduced amino acid sequences are then extensively compared with GENBANK and other sequence data banks as described below.
- the method offers several advantages over current protein discovery by two-dimensional gel methods which try to identify individual proteins involved in a particular biological effect.
- detailed comparisons of profiles of activated and inactive cells reveal numerous changes in the expression of individual transcripts. After it is determined if the sequence is an "exact" match, similar or a non-match, the sequence is entered into a database.
- the numbers of cDNA copies (optionally divided by the total number of sequences in the data set) provides a picture of the relative abundance of transcripts for each corresponding gene.
- the list of represented genes can then be sorted by abundance in the cDNA population. A multitude of additional types of comparisons or dimensions are possible and are exemplified below.
- An alternate method of producing a gene transcript image includes the steps of obtaining a mixture of test mRNA and providing a representative array of unique probes whose sequences are complementary to at least some of the test mRNAs. Next, a fixed amount of the test mRNA is added to the arrayed probes. The test mRNA is incubated with the probes for a sufficient time to allow hybrids of the test mRNA and probes to form. The mRNA-probe hybrids are detected and the quantity determined. The hybrids are identified by their location in the probe array. The quantity of each hybrid is summed to give a population number. Each hybrid quantity is divided by the population number to provide a set of relative abundance data termed a gene transcript image analysis. 6.
- tissue obtained from the human body can be obtained from any organ of the body, any age donor, any abnormality or any immortalized cell line. Immortal cell lines may be preferred in some
- tissue samples invariably include mixed cell types.
- a special technique is available to take a single cell (for example, a brain cell) and harness the cellular machinery to grow up sufficient cDNA for sequencing by the techniques and analysis described herein (cf. U.S. Patent Nos.
- monocyte-like U-937 cells activated macrophage-like THP-1 cells
- induced vascular endothelial cells HMVEC cells
- mast cell-like HMC-1 cells monocyte-like U-937 cells, activated macrophage-like THP-1 cells, induced vascular endothelial cells (HUVEC cells) and mast cell-like HMC-1 cells.
- the U-937 cell line is a human histiocytic lymphoma cell line with monocyte characteristics, established from malignant cells obtained from the pleural effusion of a patient with diffuse histiocytic lymphoma (Sundstrom, C. and Nilsson, K. (1976) Int. J. Cancer 17:565).
- U-937 is one of only a few human cell lines with the morphology, cytochemistry, surface receptors and monocyte-like
- histiocytic cells These cells can be induced to terminal monocytic differentiation and will express new cell surface molecules when activated with supernatants from human mixed lymphocyte cultures. Upon this type of in vitro activation, the cells undergo
- U-937 is a cell line that is well suited for the
- the HUVEC cell line is a normal, homogeneous, well characterized, early passage endothelial cell culture from human umbilical vein (Cell Systems Corp., 12815 NE 124th Street, Kirkland, WA 98034). Only gene transcripts from induced, or treated, HUVEC cells were sequenced.
- One batch of 1 X 10 8 cells was treated for 5 hours with 1 U/ml rIL-1b and 100 ng/ml E.coli lipopolysaccharide (LPS) endotoxin prior to harvesting.
- a separate batch of 2 X 10 8 cells was treated at confluence with 4 U/ml TNF and 2 U/ml
- IFN-gamma interferon-gamma
- THP-1 is a human leukemic cell line with distinct monocytic characteristics. This cell line was derived from the blood of a 1-year-old boy with acute monocytic leukemia (Tsuchiya, S. et al. (1980) Int. J. Cancer: 171-76).
- cytological and cytochemical criteria were used to determine the monocytic nature of the cell line: 1) the presence of alpha-naphthyl butyrate esterase activity which could be inhibited by sodium fluoride; 2) the production of lysozyme; 3) the phagocytosis of latex particles and sensitized SRBC (sheep red blood cells); and 4) the ability of mitomycin C-treated THP-1 cells to activate T-lymphocytes following ConA (concanavalin A) treatment.
- ConA concanavalin A
- the cytoplasm contained small azurophilic granules and the nucleus was indented and irregularly shaped with deep folds.
- the cell line had Fc and C3b receptors, probably functioning in phagocytosis.
- THP-1 cells Morphologically, as the cells change shape, the nucleus becomes more irregular and additional phagocytic vacuoles appear in the cytoplasm.
- the differentiated THP-1 cells also exhibit an increased adherence to tissue culture plastic.
- HMC-1 cells (a human mast cell line) were established from the peripheral blood of a Mayo Clinic patient with mast cell leukemia (Leukemia Res. (1988) 12:345-55). The cultured cells looked similar to immature cloned murine mast cells, contained histamine, and stained positively for chloroacetate esterase, amino caproate esterase, eosinophil major basic protein (MBP) and tryptase. The HMC-1 cells have, however, lost the ability to synthesize normal IgE receptors. HMC-1 cells also possess a 10; 16 translocation, present in cells initially collected by leukophoresis from the patient and not an artifact of culturing. Thus, HMC-1 cells are a good model for mast cells.
- cDNA LIBRARIES For inter-library comparisons, the libraries must be prepared in similar manners. Certain parameters appear to be particularly important to control. One such parameter is the method of isolating mRNA. It is important to use the same conditions to remove DNA and heterogeneous nuclear RNA from comparison libraries. Size fractionation of cDNA must be carefully controlled.
- the same vector preferably should be used for preparing libraries to be compared. At the very least, the same type of vector (e.g.,
- unidirectional vector should be used to assure a valid comparison.
- a unidirectional vector may be preferred in order to more easily analyze the output.
- clones be randomly sampled, and that a significant population of clones is used. Data have been generated with 5,000 clones; however, if very rare genes are to be obtained and/or their relative abundance determined, as many as 100,000 clones from a single library may need to be sampled. Size fractionation of cDNA also must be carefully controlled. Alternately, plaques can be selected, rather than clones.
- the details of library construction are collected and stored in a database for later retrieval relative to the sequences being
- Fig. 1 shows important information regarding the library collaborator or cell or cDNA supplier
- RNA must be harvested from cells and tissue samples and cDNA libraries are subsequently constructed.
- cDNA libraries can be constructed according to techniques known in the art. (See, for example, Maniatis, T. et al. (1982) Molecular Cloning, Cold Spring Harbor Laboratory, New
- cDNA libraries may also be purchased.
- the U-937 cDNA library (catalog No. 937207) was obtained from
- the THP-1 cDNA library was custom constructed by
- the human mast cell HMC-1 cDNA library was also custom constructed by Stratagene from cultured HMC-1 cells.
- the HUVEC cDNA library was custom constructed by Stratagene from two batches of induced HUVEC cells which were separately processed.
- RNA poly (A+) RNA
- cDNA synthesis was only primed with oligo dT.
- THP-1 and HUVEC RNA cDNA synthesis was primed separately with both oligo dT and random hexamers, and the two cDNA libraries were treated
- the libraries can be screened with either DNA probes or antibody probes and the pBluescript® phagemid
- the phagemid allows the use of a plasmid system for easy insert
- the custom-constructed library phage particles were infected into E. coli host strain XLl-Blue® (Stratagene), which has a high transformation efficiency, increasing the probability of obtaining rare, underrepresented clones in the cDNA library.
- the phagemid forms of individual cDNA clones were obtained by the in vivo excision process, in which the host bacterial strain was coinfected with both the lambda library phage and an fl helper phage. Proteins derived from both the library-containing phage and the helper phage nicked the lambda DNA, initiated new DNA synthesis from defined sequences on the lambda target DNA and created a smaller, single stranded circular phagemid DNA molecule that included all DNA sequences of the pBluescript® plasmid and the cDNA insert. The phagemid DNA was secreted from the cells and purified, then used to re-infect fresh host cells, where the double stranded phagemid DNA was produced. Because the phagemid carries the gene for beta-lactamase, the newly-transformed bacteria are selected on medium containing ampicillin.
- Phagemid DNA was purified using the Magic MiniprepsTM DNA Purification System (Promega catalogue #A7100. Promega Corp., 2800 Woods Hollow Rd., Madison, WI 53711). This small-scale process provides a simple and reliable method for lysing the bacterial cells and rapidly isolating purified phagemid DNA using a proprietary DNA-binding resin. The DNA was eluted from the purification resin already prepared for DNA sequencing and other analytical manipulations.
- Phagemid DNA was also purified using the QIAwell-8 Plasmid Purification System from QIAGEN® DNA Purification System (QIAGEN Inc., 9259 Eton Ave., Chattsworth, CA
- This product line provides a convenient, rapid and reliable high-throughput method for lysing the bacterial cells and isolating highly purified phagemid DNA using QIAGEN anion-exchange resin particles with EMPORETM membrane technology from 3M in a multiwell format.
- the DNA was eluted from the purification resin already prepared for DNA sequencing and other analytical manipulations.
- the 96 wells are each filled with only 1 ml of sterile terrific broth with carbenicillin at 25 mg/L and glycerol at 0.4%. After the wells are inoculated, the bacteria are cultured for 24 hours and lysed with 60 ⁇ l of lysis buffer. A centrifugation step (2900 rpm for 5 minutes) is performed before the contents of the block are added to the primary filter plate. The optional step of adding isopropanol to TRIS buffer is not routinely performed. After the last step in the protocol, samples are transferred to a Beckman 96-well block for storage.
- WIZARDTM product line which is available from Promega (catalog No. A7071) and may be adaptable to the 96-well format.
- the cDNA inserts from random isolates of the U-937 and THP-1 libraries were sequenced in part.
- Methods for DNA sequencing are well known in the art.
- Conventional enzymatic methods employ DNA polymerase Klenow fragment, SequenaseTM or Taq polymerase to extend DNA chains from an oligonucleotide primer annealed to the DNA template of interest. Methods have been developed for the use of both single- and double-stranded templates.
- termination reaction products are usually electrophoresed on urea-acrylamide gels and are detected either by
- Gene transcript imaging can be used with any sequence-specific method, including, but not limited to
- sequences of a Sequence Using the nucleotide sequences derived from the cDNA clones as query sequences (sequences of a Sequence
- the word "library” denotes a set (or population) of biological specimen nucleic acid sequences.
- a “library” can consist of cDNA sequences, RNA sequences, or the like, which characterize a biological specimen.
- the biological specimen can consist of cells of a single human cell type (or can be any of the other above-mentioned types of specimens).
- sequences in a library have been determined so as to accurately represent or characterize a biological specimen (for example, they can consist of representative cDNA sequences from clones of RNA taken from a single human cell).
- database denotes a set of stored data which represent a collection of sequences, which in turn represent a
- a database can consist of data representing many stored cDNA sequences which are in turn representative of human cells infected with various viruses, cells of humans of various ages, cells from different mammalian species, and so on.
- the invention employs a computer programmed with software (to be described) for performing the following steps:
- the list of identified sequence values can then be sorted by abundance in the cDNA population. A multitude of additional types of comparisons or dimensions are possible.
- steps (a) and (b) can be repeated for two different tasks
- subtraction may be carried out on multiple libraries. It is possible to add the transcripts from several libraries (for example, three) and then to divide them by another set of transcripts from multiple libraries (again, for example, three). Notation for this operation may be abbreviated as (A+B+C) / (D+E+F), where the capital letters each indicate an entire library.
- the abundance numbers of transcripts in the summed libraries may be divided by the total sample size before subtraction.
- ratio values can be obtained by dividing relative abundance values in a first library by corresponding values in a second library and vice versa.
- the library consists of nucleotide sequences derived from cDNA clones. Examples of databases which can be searched for areas of homology
- step (similarity) in step (a) include the commercially available databases known as Genbank (NIH) EMBL (European Molecular Biology Labs, Germany), and GENESEQ (Intelligenetics, Mountain View, California).
- step (a) One homology search algorithm which can be used to implement step (a) is the algorithm described in the paper by D.J. Lipman and W.R. Pearson, entitled “Rapid and Lipman
- the homologous regions are searched in a two-step manner.
- the highest homologous regions are determined by calculating a matching score using a homology score table.
- the parameter "Ktup" is used in this step to establish the minimum window size to be shifted for comparing two sequences. Ktup also sets the number of bases that must match to extract the highest homologous region among the sequences.
- no insertions or deletions are applied and the homology is displayed as an initial (INIT) value.
- the homologous regions are aligned to obtain the highest matching score by inserting a gap in order to add a probable deleted portion.
- the matching score obtained in the first step is recalculated using the homology score Table and the insertion score Table to an optimized (OPT) value in the final output.
- DNA homologies between two sequences can be examined graphically using the Harr method of constructing dot matrix homology plots (Needleman, S.B. and Wunsch, CO., J. Mom. Biol 48:443 (1970)). This method produces a
- step (a) is implemented by processing the library data in the commercially available computer program known as the
- the Factura program preprocesses each library sequence to "edit out" portions thereof which are not likely to be of interest, such as the vector used to prepare the library. Additional sequences which can be edited out or masked (ignored by the search tools) include but are not limited to the polyA tail and repetitive GAG and CCC sequences.
- a low-end search program can be written to mask out such "low-information" sequences, or programs such as BLAST can ignore the low-information sequences.
- Window size specifies the length of the segments into which the query sequence is subdivided.
- Window offset specifies where to start the next segment [to be compared], counting from the beginning of the previous segment.
- tolerance specifies the total number of insertions
- Error tolerance may be set to any integer between 0 and 6.
- a database (such as a DNA database) can be searched for sequences containing regions of homology and the
- homologous regions are examined using dot matrix homology plots to determine regions of homology versus regions of repetition.
- Smith-Waterman alignments can be used to display the results of the homology search.
- the INHERIT software can be executed by a Sun computer system programmed with the UNIX operating system. Search alternatives to INHERIT include the BLAST program, GCG (available from the Genetics Computer Group, WI) and the Dasher program (Temple Smith, Boston).
- Nucleotide sequences can be searched against Genbank, EMBL or custom databases such as GENESEQ (available from Intelligenetics, Mountain View, CA) or other databases for genes.
- Genbank EMBL
- custom databases such as GENESEQ (available from Intelligenetics, Mountain View, CA) or other databases for genes.
- the transcript sequences are analyzed by the INHERIT software for best conformance with a reference gene transcript to assign a sequence identifier and assigned the degree of homology, which together are the identified sequence value and are input into, and further processed by, a Macintosh personal computer (available from Apple) programmed with an "abundance sort and subtraction analysis" computer program (to be described below).
- abundance sort and subtraction analysis program Prior to the abundance sort and subtraction analysis program (also denoted as the "abundance sort” program), identified sequences from the cDNA clones are assigned value (according to the parameters given above) by degree of match according to the following categories: “exact” matches (regions with a high degree of identity),
- homologous human matches regions of high similarity, but not "exact” matches
- homologous non-human matches regions of high similarity present in species other than human
- non matches no significant regions of homology to
- the degree of match can be a numeric value as described below.
- protein and peptide sequences can be deduced from the nucleic acid sequences.
- the match identification can be performed in a manner analogous to that done with cDNA sequences.
- a protein sequence is used as a query sequence and compared to the previously identified sequences contained in a database such as the Swiss/Prot, PIR and the NBRF Protein database to find homologous proteins. These proteins are initially scored for homology using a homology score Table (Orcutt, B.C. and Dayoff, M.O. Scoring Matrices, PIR Report MAT - 0285 (February 1985) ) resulting in an INIT score.
- the homologous regions are aligned to obtain the highest matching scores by inserting a gap which adds a probable deleted portion.
- the matching score is
- Pattern Specification Language and parameter windows are used to search protein databases for sequences containing regions of homology which are scored with an initial value. Subsequent display in a dot-matrix homology plot shows regions of homology versus regions of
- Pattern search databases include, but are not limited to. Protein Blocks (available from Henikoff & Henikoff, University of
- Brookhaven Protein available from the Brookhaven National Laboratory, Brookhaven, MA
- PROSITE available from Amos Bairoch, University of Geneva, Switzerland
- ProDom available from Temple Smith, Boston University
- PROTEIN MOTIF FINGERPRINT available from University of Leeds, United Kingdom
- Biosystems, Inc. Foster City, CA
- the Assembler software combines two advanced computer technologies which maximize the ability to assemble sequenced DNA fragments into Assemblages, a special grouping of data where the relationships between sequences are shown by graphic overlap, alignment and statistical views. The process is based on the
- step (b) the "abundance sort" program which implements above-mentioned “step (b)” to tabulate the number of sequences of the library which match each database entry (the "abundance number" for each database entry).
- Fig. 2 is a flow chart of a preferred embodiment of the abundance sort program. A source code listing of this embodiment of the abundance sort program is set forth in
- Sequences are transcript sequences representing each sequence of the library and a corresponding identification of the database entry (if any) which it matches.
- the "Identified Sequences” are transcript sequences representing the output of above-discussed “step (a).”
- Fig. 3 is a block diagram of a system for implementing the invention.
- the Fig. 3 system includes library
- Processor 4 can be a processor programmed with the commercially available computer program known as the INHERIT 670
- Fig. 4 shows a more detailed block diagram of a planned relational computer system, including various searching techniques which can be implemented, along with an
- the abundance sort program first performs an operation known as "Tempnum" on the
- the Tempnum process can select Identified Sequences which represent matches of the following types with database entries (see above for definition): “exact” matches, human “homologous” matches, “other species” matches representing genes present in species other than human), “no” matches (no significant regions of homology with database entries representing previously identified nucleotide sequences), “I” matches (Incyte for not previously known DNA sequences), or “X” matches (matches ESTs in reference database).
- “exact” matches human “homologous” matches, “other species” matches representing genes present in species other than human
- no no significant regions of homology with database entries representing previously identified nucleotide sequences
- I matches
- Incyte for not previously known DNA sequences or "X” matches (matches ESTs in reference database).
- the identified sequence values selected during the "Tempnum” process then undergo a further selection (weeding out) operation known as “Tempred.” This operation can, for example, discard all identified sequence values
- the identified sequence values selected during the "Tempred” process are then classified according to library, during the "Tempdesig” operation. It is contemplated that the "Identified Sequences” can represent sequences from a single library, or from two or more libraries.
- the identified sequence values represent sequences from a single library.
- all the identified sequence values determined during "Tempred” undergo sorting in the "Templib” operation, further sorting in the “Libsort” operation, and finally additional sorting in the "Temptarsort” operation.
- these three sorting operations can sort the identified sequences in order of decreasing "abundance number" (to generate a list of decreasing abundance
- sequences produced during the "Tempred” operation represent sequences from two libraries (which we will denote the "target” library and the "subtractant” library).
- the target library may consist of cDNA sequences from clones of a diseased cell
- the subtractant library may consist of cDNA sequences from clones of the diseased cell after treatment by exposure to a drug.
- the target library may consist of cDNA sequences from clones of a cell type from a young human
- the subtractant library may consist of cDNA sequences from clones of the same cell type from the same human at different ages.
- the "Tempdesig” operation routes all transcript sequences representing the target library for processing in accordance with "Templib” (and then "Libsort” and “Temptarsort"), and routes all transcript sequences representing the subtractant library for processing in accordance with "Tempsub” (and then "Subsort” and
- Tempsubsort For example, the consecutive “Templib,” “Libsort,” and “Temptarsort” sorting operations sort identified sequences from the target library in order of decreasing abundance number (to generate a list of
- the consecutive "Tempsub,” “Subsort,” and “Tempsubsort” sorting operations sort identified sequences from the subtractant library in order of decreasing abundance number (to generate a list of decreasing abundance numbers, each abundance number corresponding to a database entry, or several lists of decreasing abundance numbers, with the abundance numbers in each list corresponding to database entries of a selected type) with redundancies eliminated from each sorted list.
- transcript sequences output from the "Temptarsort” operation typically represent sorted lists from which a histogram could be generated in which position along one (e.g., horizontal) axis indicates abundance number (of target library sequences), and position along another
- transcript sequences output from the "Tempsubsort" indicates identified sequence value (e.g., human or non-human gene type).
- transcript sequences (sorted lists) output from the Tempsubsort and Temptarsort sorting operations are combined during the operation identified as "Cruncher.”
- the "Cruncher” process identifies pairs of corresponding target and subtractant abundance numbers (both representing the same identified sequence value), and divides one by the other to generate a "ratio" value for each pair of
- sequence in Fig. 2 is typically a sorted list from which a histogram could be generated in which position along one axis indicates the size of a ratio of abundance numbers (for corresponding identified sequence values from target and subtractant libraries) and position along another axis indicates identified sequence value (e.g., gene type).
- the Cruncher operation prior to obtaining a ratio between the two library abundance values, the Cruncher operation also divides each ratio value by the total number of sequences in one or both of the target and subtractant libraries.
- the output of the Cruncher operation is a set of lists, each list representing a sequence of decreasing ratio values for a different selected subset (e.g. protein family) of database entries.
- the abundance sort program of the invention tabulates for a library the numbers of mRNA transcripts corresponding to each gene identified in a database. These numbers are divided by the total number of clones sampled. The results of the division reflect the relative abundance of the mRNA transcripts in the cell type or tissue from which they were obtained. Obtaining this final data set is referred to herein as "gene transcript image analysis.” The resulting subtracted data show exactly what proteins and genes are upregulated and
- Table 2 is an abundance table listing the various gene transcripts in an induced HUVEC library. The transcripts are listed in order of decreasing abundance. This
- Tables 3 and 4 show truncated comparisons of two libraries.
- the "normal monocytes” are the HMC-1 cells
- the "activated macrophages” are the THP-1 cells pretreated with PMA and activated with LPS.
- Table 3 lists in descending order of abundance the most abundant gene transcripts for both cell types. With only 15 gene transcripts from each cell type, this table permits quick, qualitative comparison of the most common
- macrophage transcripts is found in the top 15 normal monocyte gene transcripts (poly A binding protein); and 2) a new gene transcript (previously unreported in other databases) is relatively highly represented in activated macrophages but is not similarly prominent in normal macrophages.
- a research tool provides researchers with a short-cut to new proteins, such as receptors, cell-surface and intracellular signalling molecules, which can serve as drug targets in commercial drug screening
- a gene transcript subtraction profile such as in Table 3 is useful as a first screening tool for such gene expression and protein studies.
- the computer program as disclosed in Table 5 was used to obtain ratios of all the gene transcripts in the two libraries discussed in Example 6.7, and the gene transcripts were sorted by the descending values of their ratios. If a gene transcript is not represented in one library, that gene transcript's abundance is unknown but appears to be less than 1. As an approximation ⁇ and to obtain a ratio, which would not be possible if the unrepresented gene were given an abundance of zero ⁇ genes which are represented in only one of the two libraries are assigned an abundance of 1/2. Using 1/2 for unrepresented clones increases the relative importance of "turned-on" and "turned-off" genes, whose products would be drug candidates. The resulting print-out is called a subtraction table and is an extremely valuable screening method, as is shown by the following data.
- Table 4 is a subtraction table, in which the normal monocyte library was electronically "subtracted” from the activated macrophage library. This table highlights most effectively the changes in abundance of the gene
- Such a subtraction table can be obtained for patient diagnosis.
- An individual patient sample (such as monocytes obtained from a biopsy or blood sample) can be compared with data provided herein to diagnose conditions associated with macrophage activation.
- Table 4 uncovered many new gene transcripts (labeled Incyte clones). Note that many genes are turned on in the activated macrophage (i.e., the monocyte had a 0 in the bgfreq column). This screening method is superior to other screening techniques, such as the western blot, which are incapable of uncovering such a multitude of discrete new gene transcripts.
- the subtraction-screening technique has also uncovered a high number of cancer gene transcripts (oncogenes rho, ETS2, rab-2 ras, YPT1-related, and acute myeloid leukemia mRNA) in the activated macrophage. These transcripts may be attributed to the use of immortalized cell lines and are inherently interesting for that reason. This screening technique offers a detailed picture of upregulated cancer gene transcripts (oncogenes rho, ETS2, rab-2 ras, YPT1-related, and acute myeloid leukemia mRNA) in the activated macrophage. These transcripts may be attributed to the use of immortalized cell lines and are inherently interesting for that reason. This screening technique offers a detailed picture of upregulated cancer gene transcripts (oncogenes rho, ETS2, rab-2 ras, YPT1-related, and acute myeloid leukemia mRNA) in the activated macrophage. These transcripts may be attributed to the
- transcripts including oncogenes which helps explain why anti-cancer drugs interfere with the patient's immunity mediated by activated macrophages.
- rats are exposed to hepatitis virus and maintained in the colony until they show definite signs of hepatitis.
- AHA anti-hepatitis agent
- liver samples can be obtained from rats with hepatitis just prior to AHA treatment.
- the liver tissue is treated as described in Examples 6.2 and 6.3 to obtain mRNA and subsequently to sequence cDNA.
- the cDNA from each sample are processed and analyzed for abundance according to the computer program in Table 5.
- the resulting gene transcript images of the cDNA provide detailed pictures of the baseline (control) for each animal and of the infected and/or treated state of the animals.
- cDNA data for a group of samples can be combined into a group summary gene transcript profile for all control samples, all samples from infected rats and all samples from AHA-treated rats.
- control and post-study samples can be subtracted. Also, if samples are obtained before and after AHA treatment, that data from individual animals and treatment groups can be subtracted. In addition, the data for all control samples can be pooled and averaged. The control average can be subtracted from averages of both post-study AHA and post-study non-AHA cDNA samples. If pre- and post-treatment samples are available, pre- and post-treatment samples can be compared individually (or electronically averaged) and subtracted.
- subtraction tables are used in two general ways. First, the differences are analyzed for gene transcripts which are associated with continuing hepatic deterioration or healing.
- the subtraction tables are tools to isolate the effects of the drug treatment from the underlying basic pathology of hepatitis. Because hepatitis affects many parameters, additional liver toxicity has been difficult to detect with only blood tests for the usual enzymes.
- the gene transcript profile and subtraction provides a much more complex biochemical picture which researchers have needed to analyze such difficult problems.
- the subtraction tables provide a tool for identifying clinical markers, individual proteins or other biochemical determinants which are used to predict and/or evaluate a clinical endpoint, such as disease, improvement due to the drug, and even additional pathology due to the drug.
- the subtraction tables specifically highlight genes which are turned on or off.
- the subtraction tables provide a first screen for a set of gene transcript
- Table 5 includes a program for performing this function
- Table 6 is a partial listing of entries of the database used in the electronic northern blot analysis.
- Phase I clinical tests are undertaken. Normal patients are subjected to the usual preliminary clinical laboratory tests. In addition, appropriate specimens are taken and subjected to gene transcript analysis. Additional patient specimens are taken at predetermined intervals during the test. The specimens are subjected to gene transcript analysis as described above. In addition, the gene transcript changes noted in the earlier rat toxicity study are carefully evaluated as clinical markers in the followed patients.
- Changes in the gene transcript analyses are evaluated as indicators of toxicity by correlation with clinical signs and symptoms and other laboratory results.
- subtraction is performed on individual patient specimens and on averaged patient specimens. The subtraction
- subtraction analysis highlights any toxicological changes in the treated patients. This is a highly refined determinant of toxicity.
- the subtraction method also annotates clinical markers. Further subgroups can be analyzed by subtraction analysis, including, for example, 1) segregation by occurrence and type of adverse effect; and 2) segregation by dosage.
- a gene transcript imaging analysis (or multiple gene transcript imaging analyses) is a useful tool in other clinical studies. For example, the differences in gene transcript imaging analyses before and after treatment can be assessed for patients on placebo and drug treatment.
- This method also effectively screens for clinical markers to follow in clinical use of the drug.
- the subtraction method can be used to screen cDNA libraries from diverse sources. For example, the same cell types from different species can be compared by gene transcript analysis to screen for specific differences, such as in detoxification enzyme systems. Such testing aids in the selection and validation of an animal model for the commercial purpose of drug screening or toxicological testing of drugs intended for human or animal use. When the comparison between animals of different species is shown in columns for each species, we refer to this as an interspecies comparison, or zoo blot.
- N Nucleic acid metabolis
- Ribosomal phosphoprotein Macrophage inflammatory protein 1
Abstract
Description


Claims
Priority Applications (15)
| Application Number | Priority Date | Filing Date | Title |
|---|---|---|---|
| JP7520218A JPH09503921A (en) | 1994-01-27 | 1995-01-27 | Comparative analysis of gene transcripts |
| AU16946/95A AU688465B2 (en) | 1994-01-27 | 1995-01-27 | Comparative gene transcript analysis |
| EP95908725A EP0748390A4 (en) | 1994-01-27 | 1995-01-27 | Comparative gene transcript analysis |
| EE9600097A EE9600097A (en) | 1994-01-27 | 1995-01-27 | Comparative analysis of gene transcripts |
| APAP/P/1996/000833A AP9600833A0 (en) | 1994-01-27 | 1995-01-27 | Comparative gene transcript analysis. |
| BR9506657A BR9506657A (en) | 1994-01-27 | 1995-01-27 | Comparative gene transcript analysis |
| NZ294720A NZ294720A (en) | 1995-01-27 | 1995-09-06 | Computer system storing and analyzing microbiological data |
| JP8522835A JPH11501741A (en) | 1995-01-27 | 1995-09-06 | Computer system for storing and analyzing microbiological data |
| EP95935663A EP0805874A4 (en) | 1995-01-27 | 1995-09-06 | Computer system storing and analyzing microbiological data |
| PCT/US1995/012429 WO1996023078A1 (en) | 1995-01-27 | 1995-09-06 | Computer system storing and analyzing microbiological data |
| AU37590/95A AU692626B2 (en) | 1995-01-27 | 1995-09-06 | Computer system storing and analyzing microbiological data |
| CA002210731A CA2210731A1 (en) | 1995-01-27 | 1995-09-06 | Computer system storing and analyzing microbiological data |
| BG100751A BG100751A (en) | 1994-01-27 | 1996-07-26 | Comparative gene transcription analysis |
| NO963151A NO963151L (en) | 1994-01-27 | 1996-07-26 | Comparative gene transcript analysis |
| FI962987A FI962987A (en) | 1994-01-27 | 1996-07-26 | Analysis for comparison of transcription of genes |
Applications Claiming Priority (4)
| Application Number | Priority Date | Filing Date | Title |
|---|---|---|---|
| US08/187,530 US5840484A (en) | 1992-07-17 | 1994-01-27 | Comparative gene transcript analysis |
| US08/187,530 | 1994-01-27 | ||
| US08/282,955 US6114114A (en) | 1992-07-17 | 1994-07-29 | Comparative gene transcript analysis |
| US08/282,955 | 1994-07-29 |
Publications (2)
| Publication Number | Publication Date |
|---|---|
| WO1995020681A1 true WO1995020681A1 (en) | 1995-08-03 |
| WO1995020681A9 WO1995020681A9 (en) | 1995-09-21 |
Family
ID=26883115
Family Applications (1)
| Application Number | Title | Priority Date | Filing Date |
|---|---|---|---|
| PCT/US1995/001160 WO1995020681A1 (en) | 1994-01-27 | 1995-01-27 | Comparative gene transcript analysis |
Country Status (17)
| Country | Link |
|---|---|
| US (1) | US6114114A (en) |
| EP (1) | EP0748390A4 (en) |
| JP (1) | JPH09503921A (en) |
| CN (1) | CN1145098A (en) |
| AP (1) | AP9600833A0 (en) |
| AU (1) | AU688465B2 (en) |
| BG (1) | BG100751A (en) |
| BR (1) | BR9506657A (en) |
| CA (1) | CA2182217A1 (en) |
| CZ (1) | CZ218996A3 (en) |
| EE (1) | EE9600097A (en) |
| FI (1) | FI962987A (en) |
| LV (1) | LV11696B (en) |
| NO (1) | NO963151L (en) |
| OA (1) | OA10723A (en) |
| PL (1) | PL315687A1 (en) |
| WO (1) | WO1995020681A1 (en) |
Cited By (55)
| Publication number | Priority date | Publication date | Assignee | Title |
|---|---|---|---|---|
| US5695937A (en) * | 1995-09-12 | 1997-12-09 | The Johns Hopkins University School Of Medicine | Method for serial analysis of gene expression |
| WO1998014619A1 (en) * | 1996-10-03 | 1998-04-09 | Incyte Pharmaceuticals, Inc. | Methods for generating and analyzing transcript markers |
| WO1998015657A1 (en) * | 1996-10-08 | 1998-04-16 | Abbott Laboratories | Reagents and methods useful for detecting diseases of the prostate |
| WO1998018945A1 (en) * | 1996-10-31 | 1998-05-07 | Abbott Laboratories | Reagents and methods useful for detecting diseases of the breast |
| WO1998020143A1 (en) * | 1996-11-05 | 1998-05-14 | Abbott Laboratories | Reagents and methods useful for detecting diseases of the lung |
| EP0848067A2 (en) * | 1996-12-12 | 1998-06-17 | Affymetrix, Inc. (a California Corporation) | Computer-aided techniques for analyzing biological sequences |
| WO1998031838A1 (en) * | 1997-01-15 | 1998-07-23 | Chugai Pharmaceutical Co., Ltd. | Method for analyzing quantitative expression of genes |
| WO1998033926A1 (en) * | 1997-01-31 | 1998-08-06 | Abbott Laboratories | Reagents and methods useful for detecting diseases of the lung |
| EP0866877A1 (en) * | 1995-10-24 | 1998-09-30 | Curagen Corporation | Method and apparatus for identifying, classifying, or quantifying dna sequences in a sample without sequencing |
| WO1998044159A1 (en) * | 1997-03-31 | 1998-10-08 | Abbott Laboratories | Reagents and methods useful for detecting diseases of the gastrointestinal tract |
| WO1998044160A1 (en) * | 1997-03-31 | 1998-10-08 | Abbott Laboratories | Reagents and methods useful for detecting diseases of the gastrointestinal tract |
| WO1998044133A1 (en) * | 1997-03-31 | 1998-10-08 | Abbott Laboratories | Reagents and methods useful for detecting diseases of the gastrointestinal tract |
| WO1998049342A1 (en) * | 1997-04-30 | 1998-11-05 | Forskningsparken I Ås As | Method of preparing a standard diagnostic gene transcript pattern |
| WO1998050567A1 (en) * | 1997-05-02 | 1998-11-12 | Abbott Laboratories | Reagents and methods useful for detecting diseases of the prostate |
| WO1998051805A1 (en) * | 1997-05-15 | 1998-11-19 | Abbott Laboratories | Reagents and methods useful for detecting diseases of the prostate |
| WO1998051824A1 (en) * | 1997-05-15 | 1998-11-19 | Abbott Laboratories | Reagents and methods useful for detecting disease of the urinary tract |
| WO1998055656A1 (en) * | 1997-06-05 | 1998-12-10 | Abbott Laboratories | Reagents and methods useful for detecting diseases of the urinary tract |
| WO1998056951A1 (en) * | 1997-06-11 | 1998-12-17 | Abbott Laboratories | Reagents and methods useful for detecting diseases of the lung |
| WO1999002734A1 (en) * | 1997-07-08 | 1999-01-21 | Abbott Laboratories | Reagents and methods useful for detecting diseases of the urinary tract |
| WO1999002714A1 (en) * | 1997-07-07 | 1999-01-21 | Abbott Laboratories | Reagents and methods useful for detecting diseases of the breast |
| WO1999002559A1 (en) * | 1997-07-07 | 1999-01-21 | Abbott Laboratories | Reagents and methods useful for detecting diseases of the breast |
| US5866330A (en) * | 1995-09-12 | 1999-02-02 | The Johns Hopkins University School Of Medicine | Method for serial analysis of gene expression |
| US5871697A (en) * | 1995-10-24 | 1999-02-16 | Curagen Corporation | Method and apparatus for identifying, classifying, or quantifying DNA sequences in a sample without sequencing |
| WO1999025850A1 (en) * | 1997-11-17 | 1999-05-27 | Abbott Laboratories | Reagents and methods useful for detecting diseases of the breast |
| WO1999034016A2 (en) * | 1997-12-29 | 1999-07-08 | Genena Ltd. | A method for identifying and characterizing cells and tissues |
| WO1999037815A1 (en) * | 1998-01-22 | 1999-07-29 | Akzo Nobel N.V. | ISOTHERMAL TRANSCRIPTION BASED ASSAY FOR THE DETECTION AND QUANTIFICATION OF CHEMOKINE RANTES, MIP-1α AND MIP-1$g(b) |
| US5966711A (en) * | 1997-04-15 | 1999-10-12 | Alpha Gene, Inc. | Autonomous intelligent agents for the annotation of genomic databases |
| US5981190A (en) * | 1997-01-08 | 1999-11-09 | Ontogeny, Inc. | Analysis of gene expression, methods and reagents therefor |
| WO2000012760A2 (en) * | 1998-08-28 | 2000-03-09 | Incyte Pharmaceuticals, Inc. | Toxicological response markers |
| US6040138A (en) * | 1995-09-15 | 2000-03-21 | Affymetrix, Inc. | Expression monitoring by hybridization to high density oligonucleotide arrays |
| WO2000039346A1 (en) * | 1998-12-31 | 2000-07-06 | Iconix Pharmaceuticals, Inc. | Method for generating a pathway reporter system |
| WO2000053806A1 (en) * | 1999-03-05 | 2000-09-14 | Chugai Pharmaceutical Co. Ltd. | Method of identifying gene transcription patterns |
| WO2000073509A2 (en) * | 1999-06-01 | 2000-12-07 | Incyte Genomics, Inc. | Molecules for diagnostics and therapeutics |
| WO2001011032A1 (en) * | 1999-08-05 | 2001-02-15 | Incyte Genomics, Inc. | Secretory molecules |
| US6368792B1 (en) | 1997-03-31 | 2002-04-09 | Abbott Laboratories | Reagents and methods useful for detecting diseases of the gastrointestinal tract |
| US6403778B1 (en) | 1998-05-04 | 2002-06-11 | Incyte Genomics, Inc. | Toxicological response markers |
| US6418382B2 (en) | 1995-10-24 | 2002-07-09 | Curagen Corporation | Method and apparatus for identifying, classifying, or quantifying DNA sequences in a sample without sequencing |
| WO2002090579A1 (en) * | 2001-05-04 | 2002-11-14 | Genomics Research Partners Pty Ltd | Bioinformatics based system for assessing a condition of a performance animal by analysing nucleic acid expression |
| US6596856B2 (en) | 1998-07-31 | 2003-07-22 | Affymetrix, Inc. | Nucleic acid labeling compounds |
| US6839635B2 (en) | 1998-12-23 | 2005-01-04 | Rosetta Inpharmatics Llc | Method and system for analyzing biological response signal data |
| US6864059B2 (en) | 1996-01-23 | 2005-03-08 | Affymetrix, Inc. | Biotin containing C-glycoside nucleic acid labeling compounds |
| US6965020B2 (en) | 1996-01-23 | 2005-11-15 | Affymetrix, Inc. | Nucleic acid labeling compounds |
| US6974666B1 (en) | 1994-10-21 | 2005-12-13 | Appymetric, Inc. | Methods of enzymatic discrimination enhancement and surface-bound double-stranded DNA |
| US7282327B2 (en) | 1996-01-23 | 2007-10-16 | Affymetrix, Inc. | Nucleic acid labeling compounds |
| US7291463B2 (en) | 1996-01-23 | 2007-11-06 | Affymetrix, Inc. | Nucleic acid labeling compounds |
| US7423143B2 (en) | 1996-01-23 | 2008-09-09 | Affymetrix. Inc. | Nucleic acid labeling compounds |
| US7468243B2 (en) | 2001-03-12 | 2008-12-23 | Affymetrix, Inc. | 2-aminopyrimidin-4-one nucleic acid labeling compounds |
| US7479537B2 (en) | 1996-10-31 | 2009-01-20 | Abbott Laboratories Inc. | Reagents and methods useful for detecting diseases of the breast |
| US7608395B2 (en) | 2005-09-15 | 2009-10-27 | Baylor Research Institute | Systemic lupus erythematosus diagnostic assay |
| US7846667B2 (en) | 1998-03-31 | 2010-12-07 | Genzyme Corporation | Methods for the diagnosis and treatment of lung cancer |
| EP2270504A2 (en) | 2000-01-11 | 2011-01-05 | Geron Corporation | Techniques for growth and differentiation of human pluripotent stem cells |
| US8105773B2 (en) | 2004-06-02 | 2012-01-31 | Diagenic As | Oligonucleotides for cancer diagnosis |
| EP2546359A1 (en) | 2005-12-08 | 2013-01-16 | Novartis AG | Effects of inhibitors of FGFR3 on gene transcription |
| JP2014138606A (en) * | 1996-07-19 | 2014-07-31 | Cornell Research Foundation Inc | High fidelity detection of nucleic acid differences by ligase detection reaction |
| EP3456331A1 (en) | 2006-02-08 | 2019-03-20 | Genzyme Corporation | Gene therapy for niemann-pick disease type a |
Families Citing this family (40)
| Publication number | Priority date | Publication date | Assignee | Title |
|---|---|---|---|---|
| US20020064792A1 (en) * | 1997-11-13 | 2002-05-30 | Lincoln Stephen E. | Database for storage and analysis of full-length sequences |
| WO1999051774A2 (en) * | 1998-04-02 | 1999-10-14 | Tellus Genetic Resources, Inc. | A method for obtaining a plant with a genetic lesion in a gene sequence |
| US6960439B2 (en) | 1999-06-28 | 2005-11-01 | Source Precision Medicine, Inc. | Identification, monitoring and treatment of disease and characterization of biological condition using gene expression profiles |
| US7244559B2 (en) * | 1999-09-16 | 2007-07-17 | 454 Life Sciences Corporation | Method of sequencing a nucleic acid |
| US7211390B2 (en) | 1999-09-16 | 2007-05-01 | 454 Life Sciences Corporation | Method of sequencing a nucleic acid |
| AU7709300A (en) * | 1999-09-24 | 2001-04-24 | Linden Technologies, Inc. | Drug discovery using gene expression profiling |
| AU2001227280A1 (en) * | 2000-04-10 | 2001-10-23 | The Scripps Research Institute | Proteomic analysis using activity-based probe libraries |
| GB0008908D0 (en) * | 2000-04-11 | 2000-05-31 | Hewlett Packard Co | Shopping assistance service |
| US7363165B2 (en) | 2000-05-04 | 2008-04-22 | The Board Of Trustees Of The Leland Stanford Junior University | Significance analysis of microarrays |
| JP2004500846A (en) * | 2000-05-11 | 2004-01-15 | アカデミス ジーケンホイス ベイ デ ユニフェルジテイト ファン アムステルダム | MYC target |
| KR20030051435A (en) * | 2000-06-19 | 2003-06-25 | 코렐로직 시스템즈, 인크. | Heuristic method of classification |
| EP1409718A2 (en) * | 2000-07-21 | 2004-04-21 | Phase-1 Molecular Toxicology | Canine toxicity genes |
| US7110885B2 (en) | 2001-03-08 | 2006-09-19 | Dnaprint Genomics, Inc. | Efficient methods and apparatus for high-throughput processing of gene sequence data |
| CA2377213A1 (en) * | 2001-03-20 | 2002-09-20 | Ortho-Clinical Diagnostics, Inc. | Method for providing clinical diagnostic services |
| US6996477B2 (en) | 2001-04-19 | 2006-02-07 | Dana Farber Cancer Institute, Inc. | Computational subtraction method |
| WO2003004690A2 (en) * | 2001-07-06 | 2003-01-16 | 454$m(3) CORPORATION | Method for isolation of independent, parallel chemical micro-reactions using a porous filter |
| US20030148314A1 (en) * | 2001-08-01 | 2003-08-07 | Millennium Pharmaceuticals, Inc. | Compositions, kits, and methods for identification, assessment, prevention, and therapy of colon cancer |
| US20030054396A1 (en) * | 2001-09-07 | 2003-03-20 | Weiner Michael P. | Enzymatic light amplification |
| US20050124022A1 (en) * | 2001-10-30 | 2005-06-09 | Maithreyan Srinivasan | Novel sulfurylase-luciferase fusion proteins and thermostable sulfurylase |
| US6902921B2 (en) * | 2001-10-30 | 2005-06-07 | 454 Corporation | Sulfurylase-luciferase fusion proteins and thermostable sulfurylase |
| US6956114B2 (en) | 2001-10-30 | 2005-10-18 | '454 Corporation | Sulfurylase-luciferase fusion proteins and thermostable sulfurylase |
| WO2003040404A1 (en) | 2001-11-09 | 2003-05-15 | Source Precision Medicine, Inc. | Identification, monitoring and treatment of disease and characterization of biological condition using gene expression profiles |
| AU2003213107A1 (en) | 2002-02-15 | 2003-09-09 | Exact Sciences Corporation | Methods for analysis of molecular events |
| US20050158742A1 (en) * | 2002-05-22 | 2005-07-21 | Fujitsu Limited | Method for analyzing genome |
| US20050136457A1 (en) * | 2002-05-22 | 2005-06-23 | Fujitsu Limited | Method for analyzing genome |
| US7395160B2 (en) * | 2002-07-29 | 2008-07-01 | Correlogic Systems, Inc. | Quality assurance/quality control for electrospray ionization processes |
| EP1431399A1 (en) * | 2002-12-20 | 2004-06-23 | Clinigenetics | Methods and composition for identifying therapeutic agents of atherosclerotic plaque lesions |
| CN101128601B (en) * | 2003-01-29 | 2011-06-08 | 454生命科学公司 | Methods of amplifying and sequencing nucleic acids |
| US7575865B2 (en) * | 2003-01-29 | 2009-08-18 | 454 Life Sciences Corporation | Methods of amplifying and sequencing nucleic acids |
| MXPA06001170A (en) * | 2003-08-01 | 2006-05-15 | Correlogic Systems Inc | Multiple high-resolution serum proteomic features for ovarian cancer detection. |
| WO2006026654A2 (en) | 2004-08-27 | 2006-03-09 | Exact Sciences Corporation | Method for detecting a recombinant event |
| WO2006047787A2 (en) | 2004-10-27 | 2006-05-04 | Exact Sciences Corporation | Method for monitoring disease progression or recurrence |
| US20070003996A1 (en) * | 2005-02-09 | 2007-01-04 | Hitt Ben A | Identification of bacteria and spores |
| US9777314B2 (en) | 2005-04-21 | 2017-10-03 | Esoterix Genetic Laboratories, Llc | Analysis of heterogeneous nucleic acid samples |
| US20080312514A1 (en) * | 2005-05-12 | 2008-12-18 | Mansfield Brian C | Serum Patterns Predictive of Breast Cancer |
| CN101218497B (en) * | 2005-07-07 | 2012-04-25 | 索尼株式会社 | Material information acquiring method and material information measuring device using evanescent light, and method and system for determination of base sequence |
| US20080250016A1 (en) * | 2007-04-04 | 2008-10-09 | Michael Steven Farrar | Optimized smith-waterman search |
| MY150234A (en) | 2007-06-29 | 2013-12-31 | Ahn Gook Pharmaceutical Company Ltd | Predictive markers for ovarian cancer |
| CN101930502B (en) * | 2010-09-03 | 2011-12-21 | 深圳华大基因科技有限公司 | Method and system for detection of phenotype genes and analysis of biological information |
| WO2013123481A1 (en) * | 2012-02-16 | 2013-08-22 | Cornell University | Methods and kit for characterizing the modified base status of a transcriptome |
Family Cites Families (6)
| Publication number | Priority date | Publication date | Assignee | Title |
|---|---|---|---|---|
| US5371671A (en) * | 1990-03-13 | 1994-12-06 | The Regents Of The University Of California | DNA sequence autoradiogram digitizer and methodology implemented in the same |
| US5723286A (en) * | 1990-06-20 | 1998-03-03 | Affymax Technologies N.V. | Peptide library and screening systems |
| US5364759B2 (en) * | 1991-01-31 | 1999-07-20 | Baylor College Medicine | Dna typing with short tandem repeat polymorphisms and identification of polymorphic short tandem repeats |
| DK0604552T3 (en) * | 1991-09-18 | 1997-08-04 | Affymax Tech Nv | Process for the synthesis of different assemblies of oligomers |
| US5270170A (en) * | 1991-10-16 | 1993-12-14 | Affymax Technologies N.V. | Peptide library and screening method |
| US5541061A (en) * | 1992-04-29 | 1996-07-30 | Affymax Technologies N.V. | Methods for screening factorial chemical libraries |
-
1994
- 1994-07-29 US US08/282,955 patent/US6114114A/en not_active Expired - Lifetime
-
1995
- 1995-01-27 CN CN95192325A patent/CN1145098A/en active Pending
- 1995-01-27 EP EP95908725A patent/EP0748390A4/en not_active Withdrawn
- 1995-01-27 CA CA002182217A patent/CA2182217A1/en not_active Abandoned
- 1995-01-27 EE EE9600097A patent/EE9600097A/en unknown
- 1995-01-27 WO PCT/US1995/001160 patent/WO1995020681A1/en not_active Application Discontinuation
- 1995-01-27 JP JP7520218A patent/JPH09503921A/en active Pending
- 1995-01-27 PL PL95315687A patent/PL315687A1/en unknown
- 1995-01-27 BR BR9506657A patent/BR9506657A/en not_active Application Discontinuation
- 1995-01-27 CZ CZ962189A patent/CZ218996A3/en unknown
- 1995-01-27 AP APAP/P/1996/000833A patent/AP9600833A0/en unknown
- 1995-01-27 AU AU16946/95A patent/AU688465B2/en not_active Ceased
-
1996
- 1996-07-26 OA OA60868A patent/OA10723A/en unknown
- 1996-07-26 BG BG100751A patent/BG100751A/en unknown
- 1996-07-26 NO NO963151A patent/NO963151L/en unknown
- 1996-07-26 FI FI962987A patent/FI962987A/en not_active Application Discontinuation
- 1996-08-27 LV LVP-96-343A patent/LV11696B/en unknown
Non-Patent Citations (5)
| Title |
|---|
| INTELLIGENETICS SUITE, Release 5.4, Advanced Training Manual, issued January 1993, by IntelliGenetics Inc., 700 East EI Camino Real, Moutain View, California 94040, USA, pages 1-19. * |
| NATURE GENETICS, Volume 2, No. 3, issued November 1992, K. OKUBO et al., "Large Scale cDNA Sequencing for Analysis of Quantitative and Qualitative Aspects of Gene Expression", pages 173-179. * |
| NUCLEIC ACIDS RESEARCH, Volume 19, No. 25, issued 1991, E. HARA et al., "Subtractive cDNA Cloning Using Oligo(dT)30-Latex and PCR: Isolation of cDNA Clones Specific to Undifferentiated Human Embryonal Carcinoma Cells", pages 7097-7104. * |
| SCIENCE, Volume 252, issued 21 June 1991, M.D. ADAMS et al., "Complementary DNA Sequencing: Expressed Sequence Tags and Human Gemone Project", pages 1651-1656. * |
| See also references of EP0748390A4 * |
Cited By (96)
| Publication number | Priority date | Publication date | Assignee | Title |
|---|---|---|---|---|
| US6600996B2 (en) | 1994-10-21 | 2003-07-29 | Affymetrix, Inc. | Computer-aided techniques for analyzing biological sequences |
| US6974666B1 (en) | 1994-10-21 | 2005-12-13 | Appymetric, Inc. | Methods of enzymatic discrimination enhancement and surface-bound double-stranded DNA |
| US5866330A (en) * | 1995-09-12 | 1999-02-02 | The Johns Hopkins University School Of Medicine | Method for serial analysis of gene expression |
| US6746845B2 (en) | 1995-09-12 | 2004-06-08 | The Johns Hopkins University | Method for serial analysis of gene expression |
| US5695937A (en) * | 1995-09-12 | 1997-12-09 | The Johns Hopkins University School Of Medicine | Method for serial analysis of gene expression |
| US6383743B1 (en) | 1995-09-12 | 2002-05-07 | The John Hopkins University School Of Medicine | Method for serial analysis of gene expression |
| US6040138A (en) * | 1995-09-15 | 2000-03-21 | Affymetrix, Inc. | Expression monitoring by hybridization to high density oligonucleotide arrays |
| US6453245B1 (en) | 1995-10-24 | 2002-09-17 | Curagen Corporation | Method and apparatus for identifying, classifying, or quantifying protein sequences in a sample without sequencing |
| EP0866877A4 (en) * | 1995-10-24 | 2004-10-13 | Curagen Corp | Method and apparatus for identifying, classifying, or quantifying dna sequences in a sample without sequencing |
| US6432361B1 (en) | 1995-10-24 | 2002-08-13 | Curagen Corporation | Method and apparatus for identifying, classifying, or quantifying protein sequences in a sample without sequencing |
| US6418382B2 (en) | 1995-10-24 | 2002-07-09 | Curagen Corporation | Method and apparatus for identifying, classifying, or quantifying DNA sequences in a sample without sequencing |
| US5871697A (en) * | 1995-10-24 | 1999-02-16 | Curagen Corporation | Method and apparatus for identifying, classifying, or quantifying DNA sequences in a sample without sequencing |
| US6141657A (en) * | 1995-10-24 | 2000-10-31 | Curagen Corporation | Method and apparatus for identifying classifying or quantifying DNA sequences in a sample without sequencing |
| US6231812B1 (en) | 1995-10-24 | 2001-05-15 | Curagen Corporation | Method and apparatus for indentifying, classifying, or quantifying protein sequences in a sample without sequencing |
| US5972693A (en) * | 1995-10-24 | 1999-10-26 | Curagen Corporation | Apparatus for identifying, classifying, or quantifying DNA sequences in a sample without sequencing |
| EP0866877A1 (en) * | 1995-10-24 | 1998-09-30 | Curagen Corporation | Method and apparatus for identifying, classifying, or quantifying dna sequences in a sample without sequencing |
| US6864059B2 (en) | 1996-01-23 | 2005-03-08 | Affymetrix, Inc. | Biotin containing C-glycoside nucleic acid labeling compounds |
| US6965020B2 (en) | 1996-01-23 | 2005-11-15 | Affymetrix, Inc. | Nucleic acid labeling compounds |
| US7282327B2 (en) | 1996-01-23 | 2007-10-16 | Affymetrix, Inc. | Nucleic acid labeling compounds |
| US7291463B2 (en) | 1996-01-23 | 2007-11-06 | Affymetrix, Inc. | Nucleic acid labeling compounds |
| US7423143B2 (en) | 1996-01-23 | 2008-09-09 | Affymetrix. Inc. | Nucleic acid labeling compounds |
| JP2014138606A (en) * | 1996-07-19 | 2014-07-31 | Cornell Research Foundation Inc | High fidelity detection of nucleic acid differences by ligase detection reaction |
| WO1998014619A1 (en) * | 1996-10-03 | 1998-04-09 | Incyte Pharmaceuticals, Inc. | Methods for generating and analyzing transcript markers |
| US5919638A (en) * | 1996-10-08 | 1999-07-06 | Abbott Laboratories | Reagents and methods useful for detecting prostate tumors |
| US6110675A (en) * | 1996-10-08 | 2000-08-29 | Abbott Laboratories | Reagents and methods useful for detecting diseases of the prostate |
| WO1998015657A1 (en) * | 1996-10-08 | 1998-04-16 | Abbott Laboratories | Reagents and methods useful for detecting diseases of the prostate |
| US7479537B2 (en) | 1996-10-31 | 2009-01-20 | Abbott Laboratories Inc. | Reagents and methods useful for detecting diseases of the breast |
| WO1998018945A1 (en) * | 1996-10-31 | 1998-05-07 | Abbott Laboratories | Reagents and methods useful for detecting diseases of the breast |
| WO1998020143A1 (en) * | 1996-11-05 | 1998-05-14 | Abbott Laboratories | Reagents and methods useful for detecting diseases of the lung |
| US5939265A (en) * | 1996-11-05 | 1999-08-17 | Abbott Laboratories | Reagents and methods useful for detecting diseases of the lung |
| EP0848067A3 (en) * | 1996-12-12 | 2002-05-08 | Affymetrix, Inc. (a California Corporation) | Computer-aided techniques for analyzing biological sequences |
| EP0848067A2 (en) * | 1996-12-12 | 1998-06-17 | Affymetrix, Inc. (a California Corporation) | Computer-aided techniques for analyzing biological sequences |
| US5981190A (en) * | 1997-01-08 | 1999-11-09 | Ontogeny, Inc. | Analysis of gene expression, methods and reagents therefor |
| US5968784A (en) * | 1997-01-15 | 1999-10-19 | Chugai Pharmaceutical Co., Ltd. | Method for analyzing quantitative expression of genes |
| WO1998031838A1 (en) * | 1997-01-15 | 1998-07-23 | Chugai Pharmaceutical Co., Ltd. | Method for analyzing quantitative expression of genes |
| US6461814B1 (en) | 1997-01-15 | 2002-10-08 | Dominic G. Spinella | Method of identifying gene transcription patterns |
| WO1998033926A1 (en) * | 1997-01-31 | 1998-08-06 | Abbott Laboratories | Reagents and methods useful for detecting diseases of the lung |
| US6368792B1 (en) | 1997-03-31 | 2002-04-09 | Abbott Laboratories | Reagents and methods useful for detecting diseases of the gastrointestinal tract |
| WO1998044160A1 (en) * | 1997-03-31 | 1998-10-08 | Abbott Laboratories | Reagents and methods useful for detecting diseases of the gastrointestinal tract |
| US6867016B1 (en) | 1997-03-31 | 2005-03-15 | Abbott Laboratories | Reagents and methods useful for detecting diseases of the gastrointestinal tract |
| US7087393B2 (en) | 1997-03-31 | 2006-08-08 | Abbott Laboratories | Methods for detecting CS198 antigen |
| WO1998044159A1 (en) * | 1997-03-31 | 1998-10-08 | Abbott Laboratories | Reagents and methods useful for detecting diseases of the gastrointestinal tract |
| US6660834B2 (en) | 1997-03-31 | 2003-12-09 | Abbott Laboratories | Reagents useful for detecting diseases of the gastrointestinal tract |
| US6627414B2 (en) | 1997-03-31 | 2003-09-30 | Abbott Laboratories | Reagents useful for detecting diseases of the gastrointestinal tract |
| WO1998044133A1 (en) * | 1997-03-31 | 1998-10-08 | Abbott Laboratories | Reagents and methods useful for detecting diseases of the gastrointestinal tract |
| US5966711A (en) * | 1997-04-15 | 1999-10-12 | Alpha Gene, Inc. | Autonomous intelligent agents for the annotation of genomic databases |
| EP1323728A3 (en) * | 1997-04-30 | 2004-02-04 | Diagenic AS | Method of preparing a standard diagnostic gene transcript pattern |
| WO1998049342A1 (en) * | 1997-04-30 | 1998-11-05 | Forskningsparken I Ås As | Method of preparing a standard diagnostic gene transcript pattern |
| NO327084B1 (en) * | 1997-04-30 | 2009-04-20 | Diagenic As | Method for isolating mRNA or cDNA probes, and using them for the preparation of a standard diagnostic gene transcription sample and probe test kit and using the method for diagnosing or identifying a disease. |
| EP2050825A1 (en) | 1997-04-30 | 2009-04-22 | DiaGenic AS | Method of preparing a standard diagnostic gene transcript pattern |
| US6720138B2 (en) | 1997-04-30 | 2004-04-13 | Diagenic As | Method of preparing a standard diagnostic gene transcript pattern |
| EP1323728A2 (en) * | 1997-04-30 | 2003-07-02 | Diagenic AS | Method of preparing a standard diagnostic gene transcript pattern |
| US6130043A (en) * | 1997-05-02 | 2000-10-10 | Abbott Laboratories | Reagents and methods useful for detecting diseases of the prostate |
| WO1998050567A1 (en) * | 1997-05-02 | 1998-11-12 | Abbott Laboratories | Reagents and methods useful for detecting diseases of the prostate |
| US6252047B1 (en) | 1997-05-02 | 2001-06-26 | Abbott Laboratories | Reagents and methods useful for detecting diseases of the prostate |
| WO1998051824A1 (en) * | 1997-05-15 | 1998-11-19 | Abbott Laboratories | Reagents and methods useful for detecting disease of the urinary tract |
| US6890749B2 (en) | 1997-05-15 | 2005-05-10 | Abbott Laboratories | Reagents and methods useful for detecting diseases of the prostate |
| WO1998051805A1 (en) * | 1997-05-15 | 1998-11-19 | Abbott Laboratories | Reagents and methods useful for detecting diseases of the prostate |
| WO1998055656A1 (en) * | 1997-06-05 | 1998-12-10 | Abbott Laboratories | Reagents and methods useful for detecting diseases of the urinary tract |
| US6949357B2 (en) | 1997-06-05 | 2005-09-27 | Abbott Laboratories | Reagents and methods useful for detecting diseases of the urinary tract |
| WO1998056951A1 (en) * | 1997-06-11 | 1998-12-17 | Abbott Laboratories | Reagents and methods useful for detecting diseases of the lung |
| WO1999002714A1 (en) * | 1997-07-07 | 1999-01-21 | Abbott Laboratories | Reagents and methods useful for detecting diseases of the breast |
| WO1999002559A1 (en) * | 1997-07-07 | 1999-01-21 | Abbott Laboratories | Reagents and methods useful for detecting diseases of the breast |
| WO1999002734A1 (en) * | 1997-07-08 | 1999-01-21 | Abbott Laboratories | Reagents and methods useful for detecting diseases of the urinary tract |
| WO1999025850A1 (en) * | 1997-11-17 | 1999-05-27 | Abbott Laboratories | Reagents and methods useful for detecting diseases of the breast |
| WO1999034016A2 (en) * | 1997-12-29 | 1999-07-08 | Genena Ltd. | A method for identifying and characterizing cells and tissues |
| WO1999034016A3 (en) * | 1997-12-29 | 1999-09-02 | Genena Ltd | A method for identifying and characterizing cells and tissues |
| US6218154B1 (en) | 1998-01-22 | 2001-04-17 | Akzo Nobel N.V. | Isothermal transcription based assay for the detection and quantification of chemokines rantes, MIP-1α and MIP-1β |
| US6121023A (en) * | 1998-01-22 | 2000-09-19 | Akzo Nobel N.V. | Isothermal transcription based assay for the detection and quantification of the chemokine rantes |
| WO1999037815A1 (en) * | 1998-01-22 | 1999-07-29 | Akzo Nobel N.V. | ISOTHERMAL TRANSCRIPTION BASED ASSAY FOR THE DETECTION AND QUANTIFICATION OF CHEMOKINE RANTES, MIP-1α AND MIP-1$g(b) |
| US8067240B2 (en) | 1998-03-31 | 2011-11-29 | Esoterix Genetic Laboratories, Llc | Methods for the diagnosis and treatment of lung cancer |
| US7846667B2 (en) | 1998-03-31 | 2010-12-07 | Genzyme Corporation | Methods for the diagnosis and treatment of lung cancer |
| US6403778B1 (en) | 1998-05-04 | 2002-06-11 | Incyte Genomics, Inc. | Toxicological response markers |
| US6844433B2 (en) | 1998-07-31 | 2005-01-18 | Affymetrix, Inc. | Nucleic acid labeling compounds |
| US7179905B2 (en) | 1998-07-31 | 2007-02-20 | Affymetrix, Inc. | Nucleic acid labeling compounds |
| US6596856B2 (en) | 1998-07-31 | 2003-07-22 | Affymetrix, Inc. | Nucleic acid labeling compounds |
| US7491818B2 (en) | 1998-07-31 | 2009-02-17 | Affymetrix, Inc. | Nucleic acid labeling compounds |
| WO2000012760A3 (en) * | 1998-08-28 | 2000-08-03 | Incyte Pharma Inc | Toxicological response markers |
| WO2000012760A2 (en) * | 1998-08-28 | 2000-03-09 | Incyte Pharmaceuticals, Inc. | Toxicological response markers |
| US6839635B2 (en) | 1998-12-23 | 2005-01-04 | Rosetta Inpharmatics Llc | Method and system for analyzing biological response signal data |
| WO2000039346A1 (en) * | 1998-12-31 | 2000-07-06 | Iconix Pharmaceuticals, Inc. | Method for generating a pathway reporter system |
| WO2000053806A1 (en) * | 1999-03-05 | 2000-09-14 | Chugai Pharmaceutical Co. Ltd. | Method of identifying gene transcription patterns |
| WO2000073509A3 (en) * | 1999-06-01 | 2001-04-26 | Incyte Genomics Inc | Molecules for diagnostics and therapeutics |
| WO2000073509A2 (en) * | 1999-06-01 | 2000-12-07 | Incyte Genomics, Inc. | Molecules for diagnostics and therapeutics |
| WO2001011032A1 (en) * | 1999-08-05 | 2001-02-15 | Incyte Genomics, Inc. | Secretory molecules |
| EP2270504A2 (en) | 2000-01-11 | 2011-01-05 | Geron Corporation | Techniques for growth and differentiation of human pluripotent stem cells |
| US7468243B2 (en) | 2001-03-12 | 2008-12-23 | Affymetrix, Inc. | 2-aminopyrimidin-4-one nucleic acid labeling compounds |
| US8026057B2 (en) | 2001-03-12 | 2011-09-27 | Affymetrix, Inc. | Nucleic acid labeling compounds |
| US8076072B2 (en) | 2001-03-12 | 2011-12-13 | Affymetrix, Inc. | Nucleic acid labeling compounds |
| US8497064B2 (en) | 2001-03-12 | 2013-07-30 | Affymetrix, Inc. | Nucleic acid labelling compounds |
| WO2002090579A1 (en) * | 2001-05-04 | 2002-11-14 | Genomics Research Partners Pty Ltd | Bioinformatics based system for assessing a condition of a performance animal by analysing nucleic acid expression |
| US8105773B2 (en) | 2004-06-02 | 2012-01-31 | Diagenic As | Oligonucleotides for cancer diagnosis |
| EP2302079A2 (en) | 2005-09-15 | 2011-03-30 | Baylor Research Institute | Systemic lupus erythematosus diagnostic assay |
| US7608395B2 (en) | 2005-09-15 | 2009-10-27 | Baylor Research Institute | Systemic lupus erythematosus diagnostic assay |
| EP2546359A1 (en) | 2005-12-08 | 2013-01-16 | Novartis AG | Effects of inhibitors of FGFR3 on gene transcription |
| EP3456331A1 (en) | 2006-02-08 | 2019-03-20 | Genzyme Corporation | Gene therapy for niemann-pick disease type a |
Also Published As
| Publication number | Publication date |
|---|---|
| EE9600097A (en) | 1996-12-16 |
| NO963151D0 (en) | 1996-07-26 |
| CN1145098A (en) | 1997-03-12 |
| OA10723A (en) | 2002-12-04 |
| CZ218996A3 (en) | 1997-05-14 |
| CA2182217A1 (en) | 1995-08-03 |
| BR9506657A (en) | 1997-09-16 |
| FI962987A (en) | 1996-09-26 |
| LV11696B (en) | 1997-08-20 |
| NO963151L (en) | 1996-09-27 |
| PL315687A1 (en) | 1996-11-25 |
| BG100751A (en) | 1997-07-31 |
| AP9600833A0 (en) | 1996-07-31 |
| AU688465B2 (en) | 1998-03-12 |
| JPH09503921A (en) | 1997-04-22 |
| EP0748390A4 (en) | 1998-04-01 |
| US6114114A (en) | 2000-09-05 |
| FI962987A0 (en) | 1996-07-26 |
| EP0748390A1 (en) | 1996-12-18 |
| AU1694695A (en) | 1995-08-15 |
Similar Documents
| Publication | Publication Date | Title |
|---|---|---|
| WO1995020681A1 (en) | Comparative gene transcript analysis | |
| WO1995020681A9 (en) | Comparative gene transcript analysis | |
| US5840484A (en) | Comparative gene transcript analysis | |
| Van Driessche et al. | A transcriptional profile of multicellular development in Dictyostelium discoideum | |
| Zhang et al. | The functional landscape of mouse gene expression | |
| Lobenhofer et al. | Progress in the application of DNA microarrays. | |
| Mabbott et al. | Meta-analysis of lineage-specific gene expression signatures in mouse leukocyte populations | |
| AU692626B2 (en) | Computer system storing and analyzing microbiological data | |
| Li et al. | Single-cell RNA-seq and chromatin accessibility profiling decipher the heterogeneity of mouse γδ T cells | |
| Dubois et al. | Defining the skin cellular community using single-cell genomics to advance precision medicine | |
| Green et al. | The human genome project: Prospects and implications for clinical medicine | |
| Matoba et al. | Gene expression profiling of mouse postnatal cerebellar development | |
| JPH10510981A (en) | Methods, devices and compositions for characterizing nucleotide sequences | |
| Cao et al. | Profiling brain transcription: neurons learn a lesson from yeast | |
| Chang et al. | Microarray analysis of stem cells and differentiation | |
| Ma et al. | Development of a murine hematopoietic progenitor complementary DNA microarray using a subtracted complementary DNA library | |
| US20040023231A1 (en) | System for identifying and analyzing expression of are-containing genes | |
| Reynolds | GEM™ Microarrays and drug discovery | |
| Mager et al. | Identification of candidate maternal-effect genes through comparison of multiple microarray data sets | |
| He et al. | Universal mouse reference RNA derived from neonatal mice | |
| MXPA96003077A (en) | Comparative analysis of the transcription of the | |
| Kato | Adaptor-tagged competitive PCR: study of the mammalian nervous system | |
| Wang | Developing a Massively Parallel Reporter Assay for Studying Gene Regulatory Elements | |
| Pal et al. | Single-Cell Genomics | |
| Harshman et al. | DNA microarrays: a bridge between genome sequence information and biological understanding |
Legal Events
| Date | Code | Title | Description |
|---|---|---|---|
| WWE | Wipo information: entry into national phase |
Ref document number: 95192325.0 Country of ref document: CN |
|
| AK | Designated states |
Kind code of ref document: A1 Designated state(s): AM AU BB BG BR BY CA CN CZ EE FI GE HU JP KG KP KR KZ LK LR LT LV MD MG MN MX NO NZ PL RO RU SI SK TJ TT UA UZ VN |
|
| AL | Designated countries for regional patents |
Kind code of ref document: A1 Designated state(s): KE MW SD SZ AT BE CH DE DK ES FR GB GR IE IT LU MC NL PT SE BF BJ CF CG CI CM GA GN ML MR NE SN TD TG |
|
| COP | Corrected version of pamphlet |
Free format text: PAGES 1/4-4/4,DRAWINGS,REPLACED BY NEW PAGES BEARING THE SAME NUMBER;DUE TO LATE TRANSMITTAL BY THE RECEIVING OFFICE |
|
| 121 | Ep: the epo has been informed by wipo that ep was designated in this application | ||
| DFPE | Request for preliminary examination filed prior to expiration of 19th month from priority date (pct application filed before 20040101) | ||
| WWE | Wipo information: entry into national phase |
Ref document number: PV1996-2189 Country of ref document: CZ |
|
| WWE | Wipo information: entry into national phase |
Ref document number: 97596 Country of ref document: SK |
|
| WWE | Wipo information: entry into national phase |
Ref document number: 279720 Country of ref document: NZ Ref document number: 962987 Country of ref document: FI Ref document number: 2182217 Country of ref document: CA Ref document number: 96-01546 Country of ref document: RO |
|
| WWE | Wipo information: entry into national phase |
Ref document number: PA/a/1996/003077 Country of ref document: MX |
|
| WWE | Wipo information: entry into national phase |
Ref document number: 1995908725 Country of ref document: EP |
|
| WWE | Wipo information: entry into national phase |
Ref document number: 1256 Country of ref document: MD |
|
| WWP | Wipo information: published in national office |
Ref document number: 1995908725 Country of ref document: EP |
|
| WWP | Wipo information: published in national office |
Ref document number: PV1996-2189 Country of ref document: CZ |
|
| WWR | Wipo information: refused in national office |
Ref document number: PV1996-2189 Country of ref document: CZ |
|
| WWW | Wipo information: withdrawn in national office |
Ref document number: 1995908725 Country of ref document: EP |