WO2007127749A2 - Predicting mortality and detecting severe disease - Google Patents
Predicting mortality and detecting severe disease Download PDFInfo
- Publication number
- WO2007127749A2 WO2007127749A2 PCT/US2007/067333 US2007067333W WO2007127749A2 WO 2007127749 A2 WO2007127749 A2 WO 2007127749A2 US 2007067333 W US2007067333 W US 2007067333W WO 2007127749 A2 WO2007127749 A2 WO 2007127749A2
- Authority
- WO
- WIPO (PCT)
- Prior art keywords
- level
- subject
- biomarker
- sample
- levels
- Prior art date
Links
Classifications
-
- G—PHYSICS
- G01—MEASURING; TESTING
- G01N—INVESTIGATING OR ANALYSING MATERIALS BY DETERMINING THEIR CHEMICAL OR PHYSICAL PROPERTIES
- G01N33/00—Investigating or analysing materials by specific methods not covered by groups G01N1/00 - G01N31/00
- G01N33/48—Biological material, e.g. blood, urine; Haemocytometers
- G01N33/50—Chemical analysis of biological material, e.g. blood, urine; Testing involving biospecific ligand binding methods; Immunological testing
- G01N33/68—Chemical analysis of biological material, e.g. blood, urine; Testing involving biospecific ligand binding methods; Immunological testing involving proteins, peptides or amino acids
- G01N33/6893—Chemical analysis of biological material, e.g. blood, urine; Testing involving biospecific ligand binding methods; Immunological testing involving proteins, peptides or amino acids related to diseases not provided for elsewhere
-
- C—CHEMISTRY; METALLURGY
- C12—BIOCHEMISTRY; BEER; SPIRITS; WINE; VINEGAR; MICROBIOLOGY; ENZYMOLOGY; MUTATION OR GENETIC ENGINEERING
- C12Q—MEASURING OR TESTING PROCESSES INVOLVING ENZYMES, NUCLEIC ACIDS OR MICROORGANISMS; COMPOSITIONS OR TEST PAPERS THEREFOR; PROCESSES OF PREPARING SUCH COMPOSITIONS; CONDITION-RESPONSIVE CONTROL IN MICROBIOLOGICAL OR ENZYMOLOGICAL PROCESSES
- C12Q1/00—Measuring or testing processes involving enzymes, nucleic acids or microorganisms; Compositions therefor; Processes of preparing such compositions
- C12Q1/68—Measuring or testing processes involving enzymes, nucleic acids or microorganisms; Compositions therefor; Processes of preparing such compositions involving nucleic acids
- C12Q1/6876—Nucleic acid products used in the analysis of nucleic acids, e.g. primers or probes
- C12Q1/6883—Nucleic acid products used in the analysis of nucleic acids, e.g. primers or probes for diseases caused by alterations of genetic material
-
- G—PHYSICS
- G01—MEASURING; TESTING
- G01N—INVESTIGATING OR ANALYSING MATERIALS BY DETERMINING THEIR CHEMICAL OR PHYSICAL PROPERTIES
- G01N33/00—Investigating or analysing materials by specific methods not covered by groups G01N1/00 - G01N31/00
- G01N33/48—Biological material, e.g. blood, urine; Haemocytometers
- G01N33/50—Chemical analysis of biological material, e.g. blood, urine; Testing involving biospecific ligand binding methods; Immunological testing
- G01N33/53—Immunoassay; Biospecific binding assay; Materials therefor
- G01N33/564—Immunoassay; Biospecific binding assay; Materials therefor for pre-existing immune complex or autoimmune disease, i.e. systemic lupus erythematosus, rheumatoid arthritis, multiple sclerosis, rheumatoid factors or complement components C1-C9
-
- G—PHYSICS
- G01—MEASURING; TESTING
- G01N—INVESTIGATING OR ANALYSING MATERIALS BY DETERMINING THEIR CHEMICAL OR PHYSICAL PROPERTIES
- G01N33/00—Investigating or analysing materials by specific methods not covered by groups G01N1/00 - G01N31/00
- G01N33/48—Biological material, e.g. blood, urine; Haemocytometers
- G01N33/50—Chemical analysis of biological material, e.g. blood, urine; Testing involving biospecific ligand binding methods; Immunological testing
- G01N33/68—Chemical analysis of biological material, e.g. blood, urine; Testing involving biospecific ligand binding methods; Immunological testing involving proteins, peptides or amino acids
- G01N33/6863—Cytokines, i.e. immune system proteins modifying a biological response such as cell growth proliferation or differentiation, e.g. TNF, CNF, GM-CSF, lymphotoxin, MIF or their receptors
- G01N33/6869—Interleukin
-
- G—PHYSICS
- G16—INFORMATION AND COMMUNICATION TECHNOLOGY [ICT] SPECIALLY ADAPTED FOR SPECIFIC APPLICATION FIELDS
- G16Z—INFORMATION AND COMMUNICATION TECHNOLOGY [ICT] SPECIALLY ADAPTED FOR SPECIFIC APPLICATION FIELDS, NOT OTHERWISE PROVIDED FOR
- G16Z99/00—Subject matter not provided for in other main groups of this subclass
-
- G—PHYSICS
- G01—MEASURING; TESTING
- G01N—INVESTIGATING OR ANALYSING MATERIALS BY DETERMINING THEIR CHEMICAL OR PHYSICAL PROPERTIES
- G01N2333/00—Assays involving biological materials from specific organisms or of a specific nature
- G01N2333/435—Assays involving biological materials from specific organisms or of a specific nature from animals; from humans
- G01N2333/52—Assays involving cytokines
- G01N2333/54—Interleukins [IL]
-
- G—PHYSICS
- G01—MEASURING; TESTING
- G01N—INVESTIGATING OR ANALYSING MATERIALS BY DETERMINING THEIR CHEMICAL OR PHYSICAL PROPERTIES
- G01N2333/00—Assays involving biological materials from specific organisms or of a specific nature
- G01N2333/435—Assays involving biological materials from specific organisms or of a specific nature from animals; from humans
- G01N2333/705—Assays involving receptors, cell surface antigens or cell surface determinants
- G01N2333/715—Assays involving receptors, cell surface antigens or cell surface determinants for cytokines; for lymphokines; for interferons
- G01N2333/7155—Assays involving receptors, cell surface antigens or cell surface determinants for cytokines; for lymphokines; for interferons for interleukins [IL]
-
- G—PHYSICS
- G01—MEASURING; TESTING
- G01N—INVESTIGATING OR ANALYSING MATERIALS BY DETERMINING THEIR CHEMICAL OR PHYSICAL PROPERTIES
- G01N2800/00—Detection or diagnosis of diseases
- G01N2800/12—Pulmonary diseases
-
- G—PHYSICS
- G01—MEASURING; TESTING
- G01N—INVESTIGATING OR ANALYSING MATERIALS BY DETERMINING THEIR CHEMICAL OR PHYSICAL PROPERTIES
- G01N2800/00—Detection or diagnosis of diseases
- G01N2800/32—Cardiovascular disorders
- G01N2800/325—Heart failure or cardiac arrest, e.g. cardiomyopathy, congestive heart failure
-
- G—PHYSICS
- G01—MEASURING; TESTING
- G01N—INVESTIGATING OR ANALYSING MATERIALS BY DETERMINING THEIR CHEMICAL OR PHYSICAL PROPERTIES
- G01N2800/00—Detection or diagnosis of diseases
- G01N2800/50—Determining the risk of developing a disease
-
- G—PHYSICS
- G01—MEASURING; TESTING
- G01N—INVESTIGATING OR ANALYSING MATERIALS BY DETERMINING THEIR CHEMICAL OR PHYSICAL PROPERTIES
- G01N2800/00—Detection or diagnosis of diseases
- G01N2800/52—Predicting or monitoring the response to treatment, e.g. for selection of therapy based on assay results in personalised medicine; Prognosis
-
- G—PHYSICS
- G01—MEASURING; TESTING
- G01N—INVESTIGATING OR ANALYSING MATERIALS BY DETERMINING THEIR CHEMICAL OR PHYSICAL PROPERTIES
- G01N2800/00—Detection or diagnosis of diseases
- G01N2800/56—Staging of a disease; Further complications associated with the disease
Definitions
- the invention relates to methods for predicting mortality and detecting the presence of severe disease by measuring circulating levels of ST2 and/or IL-33, alone or in combination with other biomarkers.
- Clinical evaluation of subjects can present significant challenges, as the cause and severity of the subject's condition may not always be apparent.
- the decision whether to treat a subject aggressively or conservatively, or to admit the subject as an inpatient or to send them home, may sometimes be made solely on a physician's clinical assessment or "gut feeling" as to the individual's actual condition.
- Biomarkers that indicate a subject's likelihood of an adverse outcome, e.g., mortality, and/or the presence of severe disease, would significantly enhance the physician's ability to make informed treatment decisions.
- the present invention is based, at least in part, on the discovery that serum levels of the biomarker ST2 (Growth Stimulation-Expressed Gene 2, also known as Interleukin 1 Receptor Like 1 (ILlRL-I)) can be used to predict clinical outcome, e.g., death, within a specific time period, e.g., 30 days, 3 or 6 months, or a year or more, or to detect the presence of severe disease, regardless of the underlying causes of symptoms or ultimate diagnosis. Changes in the level of ST2 over time, e.g., over a few days or more, can also be used to predict clinical outcome, e.g., in patients hospitalized after an acute event.
- ILlRL-I Interleukin 1 Receptor Like 1
- the methods described herein include measuring ST2 levels as well as monitoring changes in ST2 levels over time (e.g., ratios) to provide diagnostic and prognostic evaluation of patients, e.g., patients with non-specific symptoms, e.g., acutely dyspneic patients and those with chest pain.
- IL-33 has been identified as the ligand for ST2.
- the invention includes methods for evaluating patients by monitoring biomarker levels of ST2 and/or IL-33 levels, as well as ST2/IL-33 complexes, and ratios of ST2:IL-33 complexes to free ST2 and/or IL-33.
- the methods can include using additional diagnostic methods, including evaluating organ function and/or levels of adjunct biomarkers such as troponin (Tn, e.g., TnI or TnT), brain natriuretic peptide (BNP), proBNP, NT- proBNP, atrial natriuretic peptide (ANP), NT-proANP, proANP, C-reactive peptide (CRP), Blood Urea Nitrogen (BUN), D-dimers (degradation products of cross-linked fibrin, whose level becomes elevated following clot formation), albumin, liver function enzymes, measures of renal function (e.g., creatinine, creatinine clearance rate, or glomerular filtration rate) and/or bacterial endotoxin.
- Tn troponin
- BNP brain natriuretic peptide
- proBNP e.g., proBNP
- NT- proBNP atrial natriuretic peptide
- ANP atrial
- the methods include measuring ST2 and/or a change in ST2 levels over time in addition to BUN, NT-proBNP or BNP, and/or TnI.
- the invention features methods for evaluating the risk of death or readmission within a specific time period, e.g., 30, 60, 90, or 180 days (e.g., one, two, three, or six months), or one, two, or five years, for a subject.
- the methods include obtaining a sample, e.g., blood, serum, plasma, urine, or body tissue from the subject; determining a biomarker level of ST2 and/or IL-33 in the sample; and comparing the biomarker level of ST2 and/or IL-33 in the sample to a reference level of ST2 and/or IL-33.
- a comparison of the biomarker level of ST2 and/or IL-33 in the sample versus the reference indicates the subject's risk of death or readmission within the specific time period.
- the specific time period is one year.
- the reference level represents a level in a subject who has a low risk of death within one year.
- the reference level of ST2 is between about 0.2 and 0.3 ng/ml of serum, e.g., the level can be 0.20, 0.23, 0.25, 0.27, or 0.29 ng/ml of serum, and a level in the sample that is greater than or equal to the reference level indicates that the subject has an elevated, i.e., statistically significantly elevated, risk of death within one year.
- an immunoassay e.g., an enzyme-linked immunosorbent assay (ELISA)
- ELISA enzyme-linked immunosorbent assay
- the reference ST2 level may be different than described herein; the specific numbers recited herein should be construed to be equivalent to corresponding numbers generated using other analytical techniques.
- the elevated risk of death is at least 20% higher, e.g., 30%, 40%, or 50% higher.
- the invention features methods for determining the severity of one or more diseases, e.g., the present severity of diseases, in a subject.
- the methods include obtaining a sample from the subject; determining a biomarker level of ST2 and/or IL-33 in the sample; and comparing the biomarker level of ST2 and/or IL-33 in the sample to a reference level of ST2 and/or IL-33.
- the biomarker level of ST2 and/or IL-33 in the sample as compared to the reference indicates whether the one or more diseases the subject has are severe, e.g., life-threatening.
- the invention includes methods for monitoring a subject's condition, e.g., for deciding whether a subject has improved, e.g., improved sufficiently to be discharged from the hospital.
- the methods include determining a first biomarker level of ST2 and/or IL-33 in the subject, e.g., a baseline level; and determining at least one subsequent biomarker level of ST2 and/or IL-33 in the subject, e.g., a treatment level. Then, the first level and the subsequent levels are compared.
- the biomarker level of ST2 and/or IL-33 decreases sufficiently, e.g., statistically significantly, or by at least 5%, 10%, 15%, 20%, or more, from the first to the subsequent levels, then the subject's condition is likely to be improving and, if either one or both levels are low enough, e.g., below a selected threshold, then the subject can be discharged, e.g., for outpatient treatment.
- the methods include determining a level of ST2 that indicates a subject's risk, and optionally selecting or modifying a treatment for the subject, based on a ratio of a first ST2 level, e.g., a baseline level, to a second ST2 level, e.g., a level taken some time later, e.g., one, two, three, four, or more days later.
- a first ST2 level e.g., a baseline level
- a second ST2 level e.g., a level taken some time later, e.g., one, two, three, four, or more days later.
- the second level of ST2 is more than a selected percentage of the first level, then the subject has a high risk and should be treated more aggressively; if the subject is already being treated, then the subject is not responding favorably to the current treatment and a new treatment should be selected, i.e., an alternate treatment to which the patient may respond more favorably.
- a new treatment should be selected, i.e., an alternate treatment to which the patient may respond more favorably.
- the second level is about 85% or more of the first level (i.e., has decreased by about 15% or less), then the subject is not improving and still has a high risk of death.
- the level of ST2 in a subject is compared to a reference level that represents a level in a subject who does not have severe disease, e.g., has no disease or has no acute, severe disease, e.g., when measured using an ELISA, e.g., as described herein.
- the reference level of ST2 can be between about 0.2 and 0.3 ng/ml, e.g., the level can be about 0.20, 0.23, 0.25, 0.27, or 0.29 ng/ml of serum or plasma (as noted above, the thresholds recited herein apply when using an ELISA method as described herein; other threshold numbers can be considered as equivalent to these numbers when determined using a different method).
- a level in the sample that is greater than or equal to the reference level indicates that the subject has one or more severe diseases, e.g., present diseases.
- the reference level represents a subject with a certain prognosis.
- the level of ST2 when the level of ST2 is measured using an ELISA, e.g., as described herein in Example 1, the reference level can be used to determine prognosis as follows: an ST2 ⁇ about 0.2 or 0.23 ng/ml indicates that the subject has a good prognosis, e.g., is likely to recover; an ST2 of from about 0.2 or 0.23 ng/ml to 0.7 ng/ml (or an equivalent thereof) indicates that the subject has a poor prognosis, e.g., is less likely to recover.
- an ST2 of greater than 0.7 ng/ml indicates a very poor prognosis, e.g., the subject is not likely to recover.
- poor prognosis would indicate that the patient is at risk of death or developing more severe disease within one year possibly requiring hospital admission.
- Very poor prognosis indicates that the patient has a high probability of death or developing more severe disease within 90 days possibly requiring hospital admission.
- patients with an ST2 level higher than 0.7 ng/ml had a mortality rate of over 30%.
- the subject exhibits one or more non-specific symptoms, e.g., chest pain or discomfort, shortness of breath (dyspnea), nausea, vomiting, eructation, sweating, palpitations, lightheadedness, fatigue, and fainting.
- the symptom is dyspnea or chest pain.
- the subject does not have a cardiovascular disorder.
- the subject has a pulmonary disorder, e.g., acute infection (e.g., pneumonia), chronic obstructive pulmonary disease (COPD), and pulmonary embolism.
- the subject has a liver disorder, e.g., a liver disorder associated with chemotherapy, alcohol toxicity, or drug toxicity as determined by standard liver function laboratory tests.
- the methods further include determining the level of an adjunct (non-ST2, non-IL-33) biomarker, e.g., Troponin, NT-proBNP, BNP, proBNP, NT-proANP, proANP, ANP, CRP, D-dimers, BUN, albumin, liver function enzymes, measures of renal function, e.g., creatinine, creatinine clearance rate, or glomerular filtration rate, and/or bacterial endotoxin, in the sample; and comparing the level of the adjunct biomarker in the sample to a reference level of the adjunct biomarker.
- an adjunct biomarker e.g., Troponin, NT-proBNP, BNP, proBNP, NT-proANP, proANP, ANP, CRP, D-dimers, BUN, albumin, liver function enzymes, measures of renal function, e.g., creatinine, creatinine clearance rate, or glomerular filtration rate, and/or bacterial end
- the level of the adjunct biomarker in the sample as compared to the reference, in combination with the level of ST2 in the sample as compared to an ST2 reference level, indicates whether the subject has an elevated risk of death within a specific time period, and/or has a present severe disease.
- the methods include determining a change in levels over time (e.g., a ratio) for the adjunct biomarker, by comparing a first level, e.g., a baseline level, to a second level, e.g., a level taken some time later, e.g., one, two, three, four, or more days later.
- a ratio of an adjunct biomarker can also be calculated, e.g., based on the same time period as the ratio of ST2.
- the subject has a BMI of 25-29, a BMI of > 30, or renal insufficiency, e.g., the subject is selected on the basis that they have a BMI of 25-29, a BMI of > 30, or renal insufficiency.
- the methods include determining a level of ST2 and a level of IL-33 in the sample; determining a ratio of ST2:IL-33 in the sample; and comparing the ratio of ST2:IL-33 to a reference ratio.
- the ratio of ST2:IL-33 in the sample as compared to the reference ratio indicates whether the subject has an elevated risk of death within a specific time period, and/or has present severe disease.
- the invention provides methods for evaluating the risk of death within a specific time period, e.g., 30, 60, 90, or 180 days (6 months), or one, two, or five years, e.g., for a subject who exhibits one or more non-specific symptoms.
- the methods include obtaining a sample from the subject; determining a biomarker level of ST2 and/or IL-33 in the sample, and optionally a level of NT- proBNP, proBNP, or BNP in the sample; and comparing the level of ST2 and/or IL-33 in the sample, and the level of NT-proBNP in the sample (if determined), to corresponding reference levels.
- the level of ST2 and/or IL-33 in the sample, and the level of NT-proBNP, proBNP, or BNP in the sample, as compared to the respective reference levels indicate the subject's risk of death within the specific time period.
- the methods include determining levels of (i) NT- proBNP, proBNP, or BNP and (ii) ST2 in the sample.
- the subject's risk of death within one year is as follows:
- the invention includes methods for monitoring a subject's condition, e.g., for deciding whether a subject has improved, e.g., improved sufficiently to discharge the subject from the hospital.
- the methods include determining a first level of (i) a non-ST2 biomarker, e.g., NT-proBNP, proBNP, or BNP and (ii) ST2 and/or IL-33 in the subject, e.g., a baseline level; and determining at least one subsequent level of (i) the non-ST2 biomarker, e.g., NT-proBNP, proBNP, or BNP and (ii) ST2 and/or IL-33 in the subject, e.g., a treatment level. Then, the first level and the subsequent levels are compared.
- the methods include determining at least a first, second, and third level of (i) a non-ST2 biomarker, e.g., NT-proBNP, proBNP, or BNP and (ii) ST2 and/or IL- 33 in the subject, and comparing the levels. A difference between the levels indicates whether the subject has improved sufficiently to be discharged.
- a decision to discharge or continue to treat on an inpatient basis can be made as follows:
- the threshold for ST2 is 0.2 ng/ml
- the threshold for BNP is 986 pg/ml.
- kits including one or more antibodies that bind specifically to ST2 and/or one or more antibodies that bind specifically to IL-33, and instructions for performing one or more of the methods described herein.
- the invention provides methods for evaluating a subject's condition.
- the methods include obtaining a sample from the subject; determining a biomarker level of ST2 and/or IL-33 in the sample, and determining presence or a level of one or more, e.g., all, of the following other biomarkers:
- cardiac troponin e.g., cTnl
- the level of ST2 and/or IL-33 in the sample, and the level of the other biomarker in the sample, as compared to the reference levels indicate the severity of the subject's condition.
- the methods described herein include measuring levels or ratios of ST2 and/or IL-33 in combination with BNP or NT-proBNP; with troponin, e.g., TnI or TnT; or with a measure of renal function, e.g., creatinine, creatinine clearance rate, or glomerular filtration rate.
- the invention includes methods for evaluating the efficacy of a treatment in a subject.
- the methods include determining a first (e.g., baseline) level of circulating ST2 and/or IL-33 in a subject; comparing the first level of circulating ST2 and/or IL-33 in the subject to a predetermined reference level; selecting the subject if the first level of ST2 is above the predetermined reference level; administering a treatment to the subject; determining a second level of circulating ST2 and/or IL-33 in a subject; and comparing the first and second levels of circulating ST2 and/or IL-33.
- a difference between the first and second levels of circulating ST2 and/or IL-33 indicates the efficacy of the treatment in the subject. For example, a second level of circulating ST2 and/or IL-33 that is lower than the first level indicates that the treatment is effective.
- sample includes any bodily fluid or tissue, e.g., one or more of blood, serum, plasma, urine, and body tissue.
- a sample is a serum, plasma, or blood sample.
- An antibody that "binds specifically to" an antigen binds preferentially to the antigen in a sample containing other proteins.
- the methods and kits described herein have a number of advantages.
- the methods can be used to determine whether a patient should be admitted or held as an inpatient for further assessment, regardless of whether a definitive diagnosis has been made.
- the methods can be used for risk stratification of a given subject, e.g., to make decisions regarding the level of aggressiveness of treatment that is appropriate for the subject, based on their ST2 levels. Better treatment decisions can lead to reduced morbidity and mortality, and better allocation of scarce health care resources.
- the methods described herein can be used to make general assessments as to whether a patient should be further tested to determine a specific diagnosis.
- the methods described herein can also be used for patient population risk stratification, e.g., to provide information about clinical performance or expected response to a therapeutic intervention.
- FIG. 1 is a graph illustrating receiver operating characteristic analysis for ST2 and death within one year. ST2 was useful for this purpose, as indicated by the high area under the curve (AUC).
- FIG. 2 is a bar graph illustrating the crude rates of death across deciles of ST2 in the ProBNP Investigation of Dyspnea in the Emergency Department (PRIDE) study cohort. A clear threshold effect is noted at decile 5, corresponding to an ST2 concentration of 0.23 ng/ml for the particular assay.
- FIGs. 3A and 3B are a pair of Kaplan-Meier hazard curves depicting the rates of death from presentation to one year of follow up in patients with dyspnea, stratified as a function of ST2 concentrations. Among dyspneic patients with ST2 concentrations of > 0.20 ng/ml, a high rate of mortality was noted within days of presentation, and extending to a full year from presentation. The rates of death were similar among those with (3A) and without (3B) acute heart failure (all Log-rank p values ⁇ 0.001).
- FIG. 4 is a bar graph illustrating mortality rates as a function of marker concentrations for NT-proBNP and ST-2.
- FIG. 5 is receiver operating curve (ROC) of specificity versus sensitivity, for change in ST2 (light grey line) and change in BNP (dark line).
- ROC receiver operating curve
- FIG. 6 is a combination bar and line graph.
- the bars illustrate the percent mortality in populations with the indicated levels of BUN and ST2 ratios.
- the line indicates the number of patients that are in each category.
- FIG. 7A is a line graph of average ST2 values for survivors (light grey squares) and non-survivors (dark diamonds) on each day of hospitalization.
- FIG. 8 is a line graph of ratios of ST2 values for survivors (light grey squares) and non-survivors (dark diamonds) as compared to baseline (around admission) on each day of hospitalization.
- FIG. 10 is a box graph illustrating the correlation between ST2 concentrations and risk of death within one year in PRIDE subjects with a pulmonary diagnosis.
- FIG. 11 is a line graph illustrating the mortality rate as a function of ST2 concentration in PRIDE subjects with a pulmonary diagnosis. P ⁇ 0.001.
- FIGs. 12A-B are box graphs illustrating mean Glomerular Filtration Rate (GFR, 12A) and ST2 levels (12B) in a population of 133 subjects with moderate to severe renal insufficiency.
- FIG. 13 is a bar graph illustrating the distribution of ST2 levels in the population described in Example 8.
- Elevated concentrations of ST2 are correlated with the presence of severe disease in a subject, regardless of the underlying cause of the disease.
- the highest levels of disease were associated with severe disease including chronic obstructive pulmonary disease (COPD), lymphoma, sepsis, alcohol abuse, and pulmonary embolism (see Example 5).
- COPD chronic obstructive pulmonary disease
- lymphoma lymphoma
- sepsis sepsis
- alcohol abuse and pulmonary embolism
- the methods described herein can be used to determine how aggressively a diagnosis should be sought; a high ST2 level would indicate the presence of severe disease, and suggest that the subject should be treated as a high-risk case.
- the methods described herein can be used to help determine the severity of the underlying pathology; again, a higher ST2 level is associated with more severe disease.
- the methods described herein include evaluating circulating levels (e.g., levels in blood, serum, plasma, urine, or body tissue) of ST2 and/or IL-33 in a subject, e.g., a mammal, e.g., a human. These levels provide information regarding the subject's likelihood of experiencing an adverse outcome, e.g., mortality, e.g., within a specific time period, e.g., 30 days, 60 days, 90 days, 6 months, one year, two years, three years, or five years. These levels also provide information regarding the severity of disease in the subject. In some embodiments, the level of ST2 and/or IL- 33 is determined once, e.g., at presentation.
- the level of ST2 and/or IL-33 is determined 2, 4, 6, 8, 12, 18, and/or 24 hours, and/or 1-7 days after the onset of symptoms. Where more than one level is determined, a ratio of ST2 can be calculated that quantifies whether and how much the level of ST2 in the subject has increased or decreased.
- the level of ST2 and/or IL-33 is determined more than once; in that case, the higher measurement, or the most recent measurement, can be used. In embodiments where the level of ST2 and/or IL-33 is determined more that once, the highest level can be used, or the difference between the levels (i.e., the magnitude and direction of the difference) can be determined and used.
- a ratio of ST2 can be determined that represents the change (e.g., the magnitude and direction, e.g., increase or decrease) in ST2 levels over time, e.g., over the course of a few days, e.g., 3 days or more, or over the course of weeks or months; the ratio is indicative of the subject's risk level and the presence of severe disease.
- Levels of ST2 and/or IL-33 can also be determined multiple times to evaluate a subject's response to a treatment. For example, a biomarker level of ST2 and/or IL-33 taken after administration of a treatment, e.g., one or more doses or rounds of a treatment, can be compared to levels of ST2 and/or IL-33 before the treatment was initiated. The difference between the ST2 levels would indicate whether the treatment was effective; e.g., a reduction in ST2 levels would indicate that the treatment was effective.
- the difference between the ST2 levels can also be used to monitor a subject's condition, e.g., to determine if the subject is improving, e.g., improving enough to be discharged from a hospital, to be treated less aggressively, or to be followed up at greater time intervals.
- Evaluating circulating levels of ST2 and/or IL-33 in a subject typically includes obtaining a biological sample, e.g., serum, plasma or blood, from the subject.
- Levels of ST2 and/or IL-33 in the sample can be determined by measuring levels of polypeptide in the sample, using methods known in the art and/or described herein, e.g., immunoassays such as enzyme-linked immunosorbent assays (ELISA).
- ELISA enzyme-linked immunosorbent assays
- levels of ST2 and/or IL-33 mRNA can be measured, again using methods known in the art and/or described herein, e.g., by quantitative PCR or Northern blotting analysis.
- the level or ratio can be compared to a reference level or ratio.
- the reference level will represent a threshold level, above which the subject has an increased risk of death, and/or has a severe disease. The reference level chosen may depend on the methodology used to measure the levels of ST2.
- the reference level is about 0.20, 0.23, or 0.29 ng/ml of serum, and a level of ST2 above that reference level indicates that the subject has an increased risk of death, and/or has a severe disease.
- a ratio has been determined, e.g., using a first and second measurement of ST2, the reference ratio will represent an amount and direction of change that indicates whether the subject has an increased risk of death and/or has a severe disease.
- an ST2 ratio can be calculated based on a first measurement, e.g., a baseline measurement taken when a subject presents for treatment, e.g., to an ED, and a second measurement, e.g., a measurement taken about three to four days later. If the ratio of first and second ST2 levels over time is about 0.85 or higher, i.e., the ST2 levels have decreased less than about 15% (or have stayed the same or increased), then the subject has a very high risk of imminent death. Ratios below about 0.85 (where the ST2 levels have decreased more than about 15%) indicate that the subject has a lower risk of imminent death.
- This information allows a treating physician to make more accurate treatment decisions; for example, when the results of the determination indicate that the subject has a level equal to or above a reference level, e.g., above about 0.20 ng/ml, 0.23 ng/ml, or 0.29 ng/ml of serum, or a ratio above a reference ratio, the subject may be admitted to the hospital as an inpatient, e.g., in an acute or critical care department.
- comparison of ST2 to a reference level or ratio can be used to determine a subject's prognosis.
- the reference level can be used to determine prognosis as follows: an ST2 ⁇ about 0.20 ng/ml or 0.23 ng/ml indicates that the subject has a good prognosis, e.g., is likely to recover; an ST2 of from about 0.20 ng/ml or 0.23 ng/ml to about 0.7 ng/ml indicates that the subject has a poor prognosis, e.g., is less likely to recover. Finally, an ST2 of greater than about 0.7 ng/ml indicates a very poor prognosis, e.g., the subject is not likely to recover. As another example, a ratio of first and second ST2 levels over time above about 0.85 indicates a poor prognosis, while a ratio of about 0.85 of below indicates a good prognosis.
- Additional testing may be performed, to determine the subject's actual condition. More aggressive treatment may be administered either before or after additional testing. For example, in the case of a suspected MI the subject may be sent for more extensive imaging studies and/or cardiac catheterization.
- both levels of ST2 and IL-33 are determined, and the information from the comparison of both biomarkers with their respective reference levels provides cumulative information regarding an increased risk of death, and/or presence of a severe disease in the subject.
- the ratio of ST2 to IL-33 may be determined, and the ratio compared to a reference ratio that represents a threshold ratio above which the subject has an increased risk of death, and/or has a severe disease.
- the presence of IL-33/ST2 complexes is detected, and the level of such complexes is indicative of risk of death and/or the presence of severe disease.
- the methods include the use of additional diagnostic methods to identify underlying pathology. Any diagnostic methods known in the art can be used, and one of skill in the art will be able to select diagnostic methods that are appropriate for the subject's symptoms. In some embodiments, the methods described herein include other diagnostic methods in addition to or as an alternative to the measurement of other biomarkers, e.g., physical measurements of lung function or cardiac function as are known in the art.
- the methods described herein include measuring levels of ST2 and/or IL-33 and one or more additional biomarkers that aid in the subject's diagnosis.
- biomarkers indicative of cardiac disease can be measured, e.g., cardiac troponin (cTn), e.g., cTnl, BNP, and/or ANP; alternatively or in addition, biomarkers of pulmonary disease can be measured, e.g., D-dimers for pulmonary embolism.
- the methods can include measuring levels of, cTnl, BNP or NTproBNP or proBNP in addition to ST2 and/or IL-33, to determine whether the subject is having an MI.
- the methods can include measuring levels of BNP or NTproBNP or proBNP in addition to ST2 and/or IL-33, to determine whether the subject is having HF.
- the methods can include measuring lung function in addition to levels of ST2 and/or IL-33, to determine whether the subject has COPD.
- the methods include measuring levels of BUN, and the presence of elevated BUN and elevated ST2 places the subject in the highest risk category.
- the ST2 gene is a member of the interleukin-1 receptor family, whose protein product exists both as a trans-membrane form, as well as a soluble receptor that is detectable in serum (Kieser et al, FEBS Lett. 372(2-3): 189-93 (1995); Kumar et al, J. Biol. Chem. 270(46):27905-13 (1995); Yanagisawa et al., FEBS Lett. 302(l):51-3 (1992); Kuroiwa et al., Hybridoma 19(2):151-9 (2000)).
- ST2 was recently described to be markedly up-regulated in an experimental model of heart failure (Weinberg et al., Circulation 106(23):2961-6 (2002)), and preliminary results suggest that ST2 concentrations may be elevated in those with chronic severe HF (Weinberg et al., Circulation 107(5):721-6 (2003)) as well as in those with acute myocardial infarction (MI) (Shimpo et al., Circulation 109(18):2186-90 (2004)).
- MI myocardial infarction
- the trans-membrane form of ST2 is thought to play a role in modulating responses of T helper type 2 cells (Lohning et al., Proc. Natl. Acad. Sci. U. S. A. 95(12):6930-5 (1998); Schmitz et al., Immunity 23(5):479-90 (2005)), and may play a role in development of tolerance in states of severe or chronic inflammation (Brint et al., Nat. Immunol. 5(4):373-9 (2004)), while the soluble form of ST2 is up-regulated in growth stimulated fibroblasts (Yanagisawa et al., 1992, supra).
- St2 for Growth Stimulation-Expressed Gene T.
- the St2 gene encodes two protein products: ST2, which is a soluble secreted form; and ST2L, a transmembrane receptor form that is very similar to the interleukin- 1 receptors.
- ST2 which is a soluble secreted form
- ST2L a transmembrane receptor form that is very similar to the interleukin- 1 receptors.
- the HUGO Nomenclature Committee designated the human homolog, the cloning of which was described in Tominaga et al., Biochim. Biophys. Acta. 1171 :215-218 (1992), as Interleukin 1 Receptor-Like 1 (ILlRLl). The two terms are used interchangeably herein.
- the mRNA sequence of the shorter, soluble isoform of human ST2 can be found at GenBank Ace. No. NM_003856.2, and the polypeptide sequence is at GenBank Ace. No. NP_003847.2; the mRNA sequence for the longer form of human ST2 is at GenBank Ace. No. NM_016232.4; the polypeptide sequence is at GenBank Ace. No. NP_057316.3. Additional information is available in the public databases at GenelD: 9173, MIM ID # 601203, and UniGene No. Hs.66. In general, in the methods described herein, the soluble form of ST2 polypeptide is measured.
- Kits for measuring ST2 polypeptide are also commercially available, e.g., the ST2 ELISA Kit manufactured by Medical & Biological Laboratories Co., Ltd. (MBL International Corp., Woburn, MA), no. 7638.
- devices for measuring ST2 and other biomarkers are described in U.S. Pat. Pub. No. 2005/0250156.
- the methods include determining the identity of the nucleotide sequence at RefSNP ID: rslO41973.
- IL-33 IL-33 was recently identified as the ligand for ST2, and the presence of increased levels of IL-33 in various inflammatory disorders has been described (see Schmitz et al., Immunity 23(5):479-90 (2005); U.S. Pat. Pub. No. 2005/0203046). In the methods described herein, IL-33 can be measured instead of or in addition to ST2. The ratio of ST2 to IL-33 can also be determined.
- IL-33 The nucleic acid sequence of IL-33 can be found at GenBank Ace. No. NM_033439.2, and the polypeptide sequence is at GenBank Ace. No. NP_254274.1. Additional information is available in the public databases at GenelD: 90865, MIM ID # *608678, and UniGene No. Hs.348390. IL-33 is also known as Chromosome 9 Open Reading Frame 26 (C9ORF26); Nuclear Factor from High Endothelial Venules (NFHEV); and Interleukin 33. See also Baekkevold et al., Am. J. Path. 163: 69-79 (2003). Methods for measuring levels of IL-33 are known in the art, see, e.g., Schmitz et al., Immunity. 23(5):479-90 (2005), and U.S. Pat. Pub. No. 2005/0203046.
- the methods described herein can also include measuring levels of other biomarkers in addition to ST2 and/or IL-33.
- Suitable biomarkers include proBNP, NT-proBNP, BNP, NT-proANP, proANP, ANP, troponin, CRP, IL-6, D-dimers, BUN, liver function enzymes, albumin, measures of renal function, e.g., creatinine, creatinine clearance rate, or glomerular filtration rate, and/or bacterial endotoxin.
- Methods for measuring these biomarkers are known in the art, see, e.g., U.S. Pat. Pub. Nos. 2004/0048286 and 2005/0130136 to Lee et al.; Dhalla et al., MoI. Cell.
- Liver function enzymes include alanine transaminase (ALT); aspartate transaminase (AST); alkaline phosphatase (ALP); and total bilirubin (TBIL).
- levels of ST2 and/or IL-33 and one or more additional biomarkers are determined, and the information from the comparison of the biomarkers with their respective reference levels provides additional information regarding the subject's risk of death and/or the presence of a severe disease in the subject, which may provide more accurate and specific information regarding the subject's risk.
- the levels can then be compared to a reference ratio that represents a threshold ratio above which the subject has an increased risk of death, and/or has a severe disease.
- the methods can include determining levels of NT-proBNP and ST2.
- the levels indicate the subject's risk of death, e.g., as shown in Table IA.
- Table IA Risk of Death Based on Circulating Levels of NT-proBNP
- the lowest risk of death e.g., no greater risk of death than in normal patients or healthy individuals, occurs when both ST2 and NT-proBNP levels are low
- the highest risk of death i.e., a statistically significantly increased risk, e.g., greater than 20% increased risk of death, e.g., a greater than 30, 40, or 50% higher risk than a normal patient or healthy individual, occurs when both ST2 and NT- proBNP levels are high.
- the methods can include determining levels of ST2 and
- the levels indicate the subject's risk of death, e.g., as shown in Table IB.
- Table IB Risk of Death Based on Circulating Levels of BUN and ST2
- the lowest risk of death e.g., no greater risk of death than in normal patients or healthy individuals, occurs when both ST2 and BUN levels are low
- the highest risk of death e.g., a statistically significantly increased risk of death, e.g., a risk greater than 30, 40, or 50% higher risk than a normal patient or healthy individual, occurs when both ST2 and BUN levels are high.
- the information can be used in a variety of ways. For example, if the subject has elevated ST2 levels, e.g., as compared to a reference level, a decision to treat aggressively can be made, and the subject can be, e.g., admitted to a hospital for treatment as an inpatient, e.g., in an acute or critical care department.
- Portable test kits could allow emergency medical personnel to evaluate a subject in the field, to determine whether they should be transported to the ED.
- Triage decisions can also be made based on information provided by a method described herein. Those patients with high ST2 and/or IL-33 levels can be prioritized over those with lower ST2 or IL-33 levels.
- the methods described herein also provide information regarding whether a subject is improving, e.g., responding to a treatment, e.g., whether a hospitalized subject has improved sufficiently to be discharged and followed on an outpatient basis. In general, these methods will include determining the levels of ST2 and/or IL- 33 in the subject multiple times. A decrease in ST2 and/or IL-33 levels over time indicates that the subject is likely to be improving. The most recent levels of ST2 and/or IL-33 can also be compared to a threshold, as described herein, to determine whether the subject has improved sufficiently to be discharged.
- the subject may also be considered for inclusion in a clinical trial, e.g., of a treatment that carries a relatively high risk.
- the subject can be treated with a regimen that carries a relatively higher risk than would be considered appropriate for someone who had a lower risk of imminent mortality, e.g., mortality within 30 days or within 1 year of presentation.
- information regarding a subject's ST2 and/or IL- 33 can be used in other ways, e.g., for payment decisions by third party payors, or for setting medical or life insurance premiums by insurance providers.
- a high level of ST2 and/or IL-33 e.g., a level above a predetermined threshold level, may be used to decide to increase insurance premiums for the subject.
- the methods can be used for general population screening, including screening by doctors, e.g., in hospitals and outpatient clinics, as well as the ED.
- levels of ST2 and/or IL-33 can be determined at any time, and if ST2 and/or IL-33 is elevated, the physician can act appropriately.
- Non-specific symptoms include, but are not limited to, chest pain or discomfort, shortness of breath, nausea, vomiting, eructation, sweating, palpitations, lightheadedness, fatigue, and fainting. Each symptom can have varied etiology. Chest Pain
- Chest pain is the chief complaint in about 1 to 2 percent of outpatient visits, and although the cause is often noncardiac, heart disease remains the leading cause of death in the United States. Therefore, distinguishing between serious and benign causes of chest pain is crucial. The methods described herein are useful in making this determination.
- a subject presenting to the ED with chest pain may have esophageal pain, an ulcer, acute lung problems such as pulmonary embolus (PE) (potentially fatal), rupturing or dissecting aneurysm (highly lethal), gall bladder attack, pericarditis (inflammation of the sack around the heart), angina pectoris (cardiac pain without damage), or an MI (potentially fatal).
- PE pulmonary embolus
- rupturing or dissecting aneurysm highly lethal
- gall bladder attack pericarditis (inflammation of the sack around the heart), angina pectoris (cardiac pain without damage), or an MI (potentially fatal).
- PE pulmonary embolus
- rupturing or dissecting aneurysm highly lethal
- gall bladder attack pericarditis (inflammation of the sack around the heart)
- angina pectoris cardiac pain without damage
- MI potentially fatal
- Dyspnea or shortness of breath (also defined as abnormal or uncomfortable breathing), is a common symptom of subjects on presentation to the ED.
- the differential diagnosis for dyspnea includes four general categories: (1) cardiac, (2) pulmonary, (3) mixed cardiac or pulmonary, and (4) noncardiac or nonpulmonary.
- Cardiac causes of dyspnea include right, left, or biventricular congestive heart failure with resultant systolic dysfunction, coronary artery disease, recent or remote myocardial infarction, cardiomyopathy, valvular dysfunction, left ventricular hypertrophy with resultant diastolic dysfunction, asymmetric septal hypertrophy, pericarditis, and arrhythmias.
- Pulmonary causes include obstructive (e.g., chronic obstructive pulmonary disease (COPD) and asthma) and restrictive processes (e.g., extrapulmonary causes such as obesity, spine or chest wall deformities, and intrinsic pulmonary pathology such as interstitial fibrosis, pneumoconiosis, granulomatous disease or collagen vascular disease).
- COPD chronic obstructive pulmonary disease
- restrictive processes e.g., extrapulmonary causes such as obesity, spine or chest wall deformities, and intrinsic pulmonary pathology such as interstitial fibrosis, pneumoconiosis, granulomatous disease or collagen vascular disease.
- Mixed cardiac and pulmonary disorders include COPD with pulmonary hypertension and cor pulmonale, deconditioning, pulmonary emboli, and trauma.
- Noncardiac or nonpulmonary disorders include metabolic conditions such as anemia, diabetic ketoacidosis and other, less common causes of metabolic acidosis, pain in the chest wall or elsewhere in the body, and neuromuscular disorders such as multiple sclerosis and muscular dystrophy.
- Obstructive rhinolaryngeal problems include nasal obstruction due to polyps or septal deviation, enlarged tonsils, and supraglottic or subglottic airway stricture.
- Dyspnea can also present as a somatic manifestation of psychiatric disorders, e.g., an anxiety disorder, with resultant hyperventilation.
- psychiatric disorders e.g., an anxiety disorder
- Certain populations of subjects may benefit particularly from the methods described herein. These subjects include people for whom BNP or NT-proBNP is less useful, such as in those with impaired renal function (Anwaruddin et al, J. Am. Coll. Cardiol. 47(l):91-7 (2006); McCullough et al., Am. J. Kidney Dis. 41(3):571-9 (2003)), or in those who are overweight (Body Mass Index (BMI) of 25-29) or obese (BMI > 30) (Krauser et al., Am. Heart J. 149(4):744-50 (2005); McCord et al., Arch. Intern. Med. 164(20):2247-52 (2004)).
- BMI Body Mass Index
- the methods described herein can include determining a subject's BMI, and if the subject is overweight or obese, selecting the patient for determination of ST2 and/or IL-33 levels, as described herein.
- Example 1 Sandwich ELISA Assay This example uses the ST2 ELISA Kit manufactured by Medical & Biological
- kits are sandwich ELISA assay utilizing monoclonal antibodies for both capture and detection. This procedure is intended to analyze a full plate of samples assayed in replicates at a 1 :3 dilution factor and closely follows the manufacturers' protocol. Kits should be stored at 4 0 C until use. The procedure described in this example is optimized for human serum or plasma collected in citrate or EDTA anticoagulant tubes. Plasma collected in heparin anticoagulant tubes should not be used in this assay as heparin binds ST2 and inhibits measurement by this ELISA protocol. Plasma or serum samples may be used fresh or stored frozen. This assay is not adversely effected by up to 3 freeze and thaw cycles of plasma samples.
- Reagents should be prepared fresh from a new kit immediately before performing the assays. Allow the kit to equilibrate to room temperature prior to use. Reagents not explicitly discussed below are provided by the manufacturer ready to use. 1. Wash solution - wash solution is provided by the manufacturer as a 1OX concentrate solution. To make 1 liter of wash solution dilute 100 ml of the 1OX concentrate provided with 900 ml of distilled water. 2. Detector solution - the detector solution is prepared by diluting the detector concentrate 1 : 101 with the detector diluent. For a full 96 well plate of samples 10 ml of detector solution is required.
- the standard curve is prepared by making 2 fold serial dilutions of the 8 ng/ml stock solution. 1. Using a PlOOO pipette transfer 250 ⁇ l of Assay Diluent to 8 1.5 ml polypropylene tubes labeled S1-S8.
- the plate is set up so that each sample is analyzed as a 1 :3 dilution in duplicate. 1. Label a 1.5 ml polypropylene tube for each sample.
- Detector using the 8 channel multichannel pipette transfer 100 ⁇ l of the detector solution to each well and incubate at room temperature for 60 minutes. a. NOTE: this reagent was to be prepared during the first incubation step. b. NOTE: use a disposable reagent vessel for this reagent addition. ALWAYS use a fresh disposable reagent vessel for each reagent. It is not necessary to change pipette tips during this step.
- Substrate using the 8 channel multichannel pipette transfer 100 ⁇ l of the Substrate to each well and incubate at room temperature for 30 minutes. a. The Substrate reagent is provided ready to use by the manufacturer. 7. Stop: at the completion of the Substrate incubation using the 8 channel multichannel pipette transfer 100 ⁇ l of the Stop solution to each well, a. The Stop Solution reagent is provided ready to use by the manufacturer.
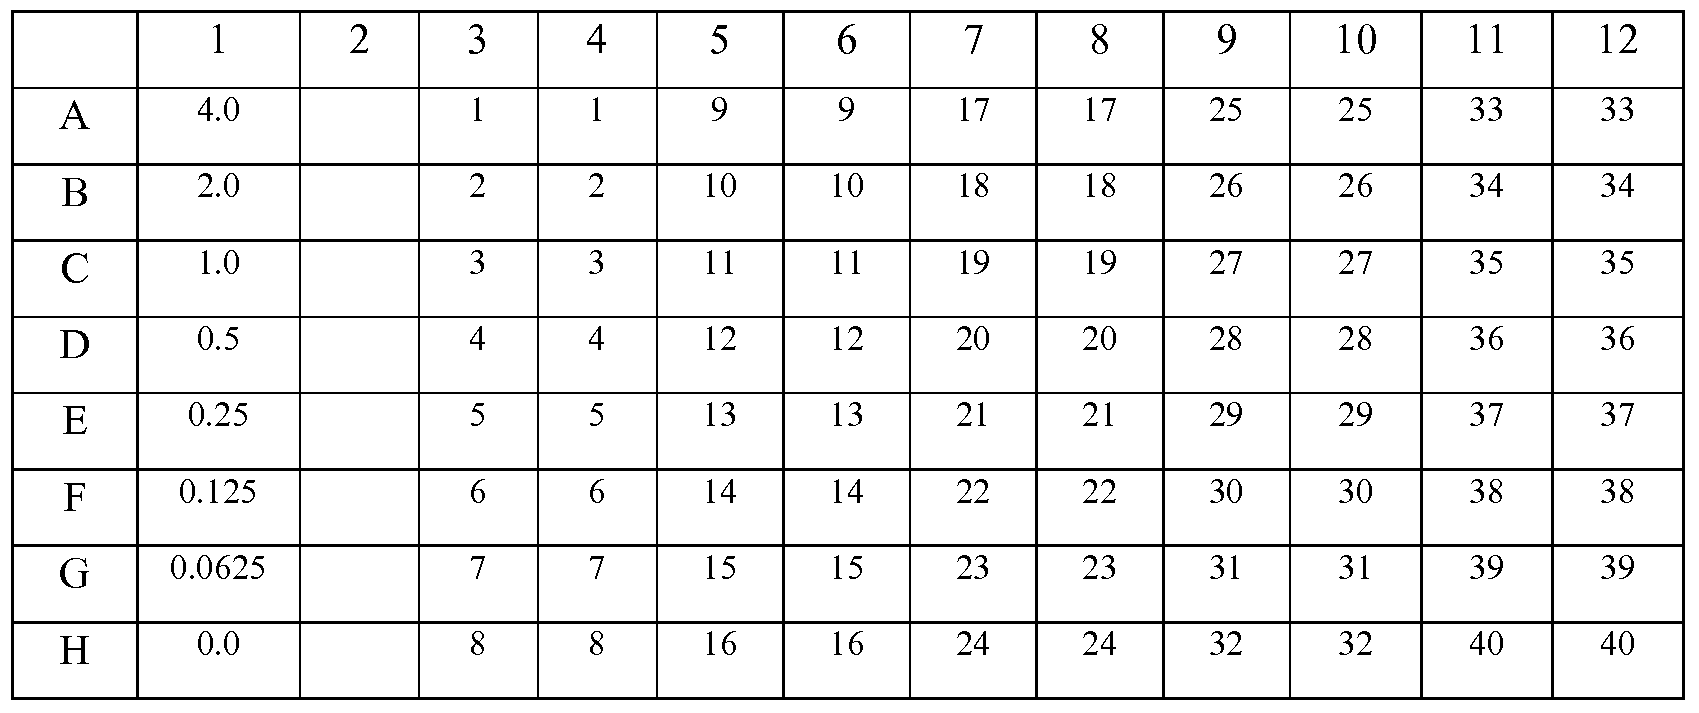
- Table 2 is a map of an exemplary 96 well assay plate, with control reactions in column 1, and each sample 1-40 analyzed in duplicate in columns 3-12.
- Example 2 Measurement of Soluble ST2 Concentrations for the Evaluation of Patients with Acute Dyspnea
- NT-proBNP was measured in the PRIDE study using a commercially available immunoassay (ELECSYS ® ProBNP assay, Roche Diagnostics, Indianapolis, IN), using established methodology. In the PRIDE study, the assay had inter-run coefficients of variation of 0.9%. Blood collected at the time of presentation was later analyzed for concentrations of ST2, using an enzyme-linked immunosorbent assay (Medical & Biological Laboratories Co., Ltd.), as described in Example 1 herein. This assay utilizes monoclonal antibodies to human ST2 for both capture and detection, and had a relative percent difference of 17.5% in the present analysis. The plasma used for the present study had been previously subjected to a single freeze- thaw cycle.
- Body-mass index (Kg/m 2 , mean ⁇ SD) 28.0 ⁇ 7.0 28.5 ⁇ 6.5 NS
- Atrial fibrillation 16% 9% 0.009
- Troponin T ng/dl, mean ⁇ SD 0.063 ⁇ 0.32 0.022 ⁇ 0.16 0.04
- Factors predictive of mortality within one year following presentation with dyspnea were evaluated in the population described in Example 2.
- Candidate ST2 diagnostic cut points were evaluated with the use of bootstrapping techniques using the STATA SWBOOT program; this was followed by multivariable logistic regression analyses.
- Each of the estimation procedures was coded in programming language then subjected to the STATA bootstrap prefix command for 10 bootstrap repeated random samples, followed by 100 replications for those variables selected in the initial analyses.
- the bootstrap sample size was 593 (the size of the entire data set).
- Factors entered into the analysis included elements from past and present medical history, symptoms and signs, medication use, as well as results of diagnostic studies including radiographic studies, electrocardiography, hematology, and blood chemistries.
- Kaplan-Meier survival curves were constructed to compare mortality rates within one year in groups divided as a function of ST2 concentrations (as well as diagnosis), using the log-rank test to compare the significance of the rates of mortality.
- ROC Receiver operating characteristic
- a threshold effect for mortality was noted at the ST2 median of 0.20 ng/ml ( Figure 2).
- NT-proBNP ⁇ 986 pg/ml 1.7% 13.1%
- NT-proBNP > 986 pg/ml 4.5% 37.0%
- NT-proBNP and ST2 levels is useful in predicting risk of mortality.
- ST2 concentrations were determined as described in Example 1, above, in a population of 350 patients who presented to the ED with chest pain. Serum samples were obtained and ST2 measurements made at baseline, and 90 and 180 minutes later for most patients. Also, for most patients, the baseline sample was collected within 2 hours of onset of symptoms.
- ST2 concentrations were determined as described in Example 1, above, as were BUN, NT-Pro-BNP, and BNP, in a population of 150 subjects who were diagnosed with and admitted for acute decompensated heart failure (ADHF) to the San Diego Veterans' Administration Hospital. Some patients had a new diagnosis of ADHF and other patients had an acute exacerbation of existing heart failure. Samples were taken on successive days in a number of patients, though not every patient gave a sample every day. Length of stay (LOS) in the hospital for these patients ranged from 1 to 24 days with an average of 5 days. Table 7 shows the characteristics of the population; as expected, given that the population was drawn from the San Diego Veteran's Hospital, the population was overwhelmingly male and Caucasian.
- ADHF acute decompensated heart failure
- Class I No limitation of physical activity. Ordinary physical activity does not cause undue fatigue, palpitation, or dyspnea (shortness of breath).
- Class II Slight limitation of physical activity. Comfortable at rest, but ordinary physical activity results in fatigue, palpitation, or dyspnea.
- Class III Marked limitation of physical activity. Comfortable at rest, but less than ordinary activity causes fatigue, palpitation, or dyspnea.
- Class rV Unable to carry out any physical activity without discomfort. Symptoms of cardiac insufficiency at rest. If any physical activity is undertaken, discomfort is increased.
- *90 day outcome frequency is cumulative of all events that occurred at earlier time points.
- AUC area under the curve
- the biomarkers that most accurately predicted the reported events included change in ST2 for 30 and 90 day mortality, and NT-proBNP levels at discharge for both 30 and 90-day mortality.
- the homogeneity of this cohort resulted in the AUC using the admission measurement for each biomarker being lower than what was observed in the PRIDE cohort (described in examples 2-3).
- the high number of patients without diagnosed heart failure reported in the PRIDE cohort resulted in a high discriminatory power of ST2 at the admission measurement.
- the ST2 level at admission is expected to be somewhat elevated; consequently, the predictive power for subsequent events is somewhat diminished as compared to a heterogenous cohort that is more representative of the general population.
- the odds ratio represents the increased odds of death within 90 days for a positive test vs. a negative test.
- the odds ratio represents the increased odds of death within 90 days for each 1 mg/dL increase.
- the ROC was compared for change in BNP and change in ST2. As shown in Figure 5, the AUC for change in BNP during hospitalization was 0.67, while the AUC for change in ST2 was 0.78, significantly higher, indicating that change in ST2 is a much more accurate predictor of 90-day mortality than BNP.
- the change in ST2 was analyzed in conjunction with BUN levels to determine whether the two markers, when used together provided additional predictive information.
- the results, shown in Figure 6, demonstrate that BUN levels and changes in ST2 levels can be used to categorize patients by risk: patients with low levels of BUN (less than 40 mg/dL) and levels of ST2 that decreased by 15% or more had the lowest risk levels; patients with higher BUN and levels of ST2 that decreased by less than 15% (or increased or held steady) had the highest risk levels, while subjects with either high BUN and ST2 decreased by at least 15%, or low BUN and ST2 decreased by 15% or more, had a medium level of risk (which was still much increased over that of the lowest risk category, see Figure 6).
- Table HA Summary of ST2 Values over Time
- N > 0.85" indicates the number of people who had a reduction of less than 15% in ST2 over the time period indicated (so that the second level is 85% or more of the first level). After at least two days, the percentage of people with a ratio of 0.85 or higher who died was over 20% while the percentage of patients who died with a ratio below 0.85 initially decreased and remained low.
- ST2 is a more accurate marker than BNP or NT-proBNP alone for predicting mortality as a function of change over time during hospitalization.
- Table 12C Change in ST2 and Change in NT-proBNP for Risk Stratification
- NT ⁇ 0.7, NT ⁇ 0.7, NT > 0.7, NT > 0.7, ST2 ⁇ 0.85 ST2 > 0.85 ST2 ⁇ 0.85 ST2 > 0.85
- Example 7 ST2 Concentrations for Risk Stratification in Patients with Pulmonary Disease Of the 599 subjects in the PRIDE population (described in Examples 2 and 3),
- ADHF acute decompensated heart failure
- 236 had "pulmonary disease"; of those with available data, 5 had uncomplicated bronchitis; 18 had pulmonary embolism (PE); 64 had pneumonia; and 149 had COPD/asthma.
- 149 with COPD/asthma 69 had asthma; 67 had emphysema; and 13 had chronic bronchitis.
- ST2 levels were assessed in each diagnostic category. Concentrations for each diagnostic category are shown in Table 13.
- ST2 concentrations were evaluated using ROC analysis for death at one year, and concentrations in those dead and alive at one year were compared. Mortality rates as a function of ST2 concentrations to one year were analyzed. The results are shown in Table 14 and Figures 9-11.
- the effect of renal impairment on ST2 concentrations was evaluated in a population of 135 patients with moderate to severe renal insufficiency. None of the patients were on dialysis, and none were previously diagnosed with CVD. All of the patients were evaluated using glomerular filtration rate (GFR in mls/min) as determined by the Modification of Diet in Renal Disease (MDRD) method as a measure of renal function. Echocardiography and coronary artery calcium (CAC) measurements were also performed on each subject to detect latent CVD. Multiple biomarkers were also evaluated.
- GFR in mls/min glomerular filtration rate
- MDRD Modification of Diet in Renal Disease
- CAC coronary artery calcium
- ADHF acute decompensated heart failure
- the amount of increased risk of mortality was evaluated in the subjects who participated in the PRIDE study and the veterans in the population described in Example 8.
- the NPV for 0.2 ng/ml is 97.6% and for 0.7 ng/ml is 79.5% in this cohort.
- the NPV for this measurement is 96.2%.
Abstract
Description


Claims


Priority Applications (8)
| Application Number | Priority Date | Filing Date | Title |
|---|---|---|---|
| DE602007008224T DE602007008224D1 (en) | 2006-04-24 | 2007-04-24 | PREDICTION OF LETALITY AND DETECTION OF SERIOUS DISEASES |
| JP2009507931A JP5383480B2 (en) | 2006-04-24 | 2007-04-24 | Predict fatality and detect serious disease |
| EP17177530.7A EP3255432B1 (en) | 2006-04-24 | 2007-04-24 | Predicting mortality and detecting severe disease |
| AU2007244927A AU2007244927B2 (en) | 2006-04-24 | 2007-04-24 | Predicting mortality and detecting severe disease |
| ES07761219T ES2351623T3 (en) | 2006-04-24 | 2007-04-24 | PREDICTION OF MORTALITY AND DETECTION OF A SERIOUS ILLNESS. |
| AT07761219T ATE476657T1 (en) | 2006-04-24 | 2007-04-24 | PREDICTION OF LETHALITY AND DETECTION OF SERIOUS DISEASES |
| EP07761219A EP2010912B1 (en) | 2006-04-24 | 2007-04-24 | Predicting mortality and detecting severe disease |
| CA2650201A CA2650201C (en) | 2006-04-24 | 2007-04-24 | Predicting mortality and detecting severe disease |
Applications Claiming Priority (6)
| Application Number | Priority Date | Filing Date | Title |
|---|---|---|---|
| US79435406P | 2006-04-24 | 2006-04-24 | |
| US60/794,354 | 2006-04-24 | ||
| US80036206P | 2006-05-15 | 2006-05-15 | |
| US60/800,362 | 2006-05-15 | ||
| US90460807P | 2007-03-02 | 2007-03-02 | |
| US60/904,608 | 2007-03-02 |
Publications (2)
| Publication Number | Publication Date |
|---|---|
| WO2007127749A2 true WO2007127749A2 (en) | 2007-11-08 |
| WO2007127749A3 WO2007127749A3 (en) | 2008-03-20 |
Family
ID=38656334
Family Applications (1)
| Application Number | Title | Priority Date | Filing Date |
|---|---|---|---|
| PCT/US2007/067333 WO2007127749A2 (en) | 2006-04-24 | 2007-04-24 | Predicting mortality and detecting severe disease |
Country Status (12)
| Country | Link |
|---|---|
| US (7) | US7998683B2 (en) |
| EP (5) | EP3255432B1 (en) |
| JP (4) | JP5383480B2 (en) |
| AT (2) | ATE527544T1 (en) |
| AU (1) | AU2007244927B2 (en) |
| CA (1) | CA2650201C (en) |
| DE (1) | DE602007008224D1 (en) |
| DK (3) | DK2386860T3 (en) |
| ES (4) | ES2646142T3 (en) |
| HK (3) | HK1164443A1 (en) |
| PL (2) | PL2848938T3 (en) |
| WO (1) | WO2007127749A2 (en) |
Cited By (20)
| Publication number | Priority date | Publication date | Assignee | Title |
|---|---|---|---|---|
| EP2021799A2 (en) * | 2006-04-27 | 2009-02-11 | Critical Care Diagnostics, Inc. | Interleukin-33 (il-33) for the diagnosis and prognosis of cardiovascular disease |
| WO2009100907A1 (en) * | 2008-02-14 | 2009-08-20 | Dianeering Diagnostics Engineering And Research Gmbh | Means and methods for assessing the risk of patients presenting to emergency departments based on very low concentrations of troponin i or t or using a combination of markers |
| EP2141499A1 (en) * | 2008-07-02 | 2010-01-06 | Apoptec AG | COPD diagnosis |
| WO2010071120A1 (en) * | 2008-12-15 | 2010-06-24 | 塩野義製薬株式会社 | Method for diagnosing lung cancer by sugar chain analysis |
| WO2010071119A1 (en) * | 2008-12-15 | 2010-06-24 | 塩野義製薬株式会社 | Method for diagnosing pancreatic cancer by sugar chain analysis |
| JP2011520098A (en) * | 2008-04-18 | 2011-07-14 | クリティカル ケア ダイアグノスティクス インコーポレイテッド | How to predict the risk of major adverse heart events |
| US7989210B2 (en) | 2002-05-09 | 2011-08-02 | The Brigham And Women's Hospital, Inc. | IL1RL-1 as a cardiovascular disease marker and therapeutic target |
| WO2011127412A2 (en) | 2010-04-09 | 2011-10-13 | Critical Care Diagnostics, Inc. | Soluble human st-2 antibodies and assays |
| JP2012181200A (en) * | 2006-04-24 | 2012-09-20 | Critical Care Diagnostics Inc | Prediction of mortality and detection of severe disease |
| WO2012141844A2 (en) | 2011-03-17 | 2012-10-18 | Critical Care Diagnostics, Inc. | Methods predicting risk of an adverse clinical outcome |
| US8530173B2 (en) | 2000-11-09 | 2013-09-10 | The Brigham And Women's Hospital, Inc. | Methods for treatment of cardiovascular disease |
| EP2635904A1 (en) * | 2010-11-01 | 2013-09-11 | B.R.A.H.M.S GmbH | Prognosis and risk assessment of patients with non-specific complaints |
| WO2014028875A1 (en) | 2012-08-16 | 2014-02-20 | Critical Care Diagnostics, Inc. | Methods for predicting risk of developing hypertension |
| US10093730B2 (en) | 2014-11-10 | 2018-10-09 | Genentech, Inc. | Anti-interleukin-33 antibodies and uses thereof |
| US10203339B2 (en) | 2006-05-01 | 2019-02-12 | Critical Care Diagnostics, Inc. | Diagnosis of cardiovascular disease |
| US10303844B2 (en) | 2012-08-21 | 2019-05-28 | Critical Care Diagnostics, Inc. | Multimarker risk stratification |
| US10408845B2 (en) | 2012-05-18 | 2019-09-10 | Critical Care Diagnostics, Inc. | Methods for treating or predicting risk of a ventricular tachyarrhythmia event |
| US10928393B2 (en) | 2011-07-18 | 2021-02-23 | Critical Care Diagnostics, Inc. | Methods of treating cardiovascular diseases and predicting the efficacy of exercise therapy |
| US11708608B2 (en) | 2014-11-10 | 2023-07-25 | Genentech, Inc. | Therapeutic and diagnostic methods for IL-33-mediated disorders |
| US11760797B2 (en) | 2020-03-13 | 2023-09-19 | Genentech, Inc. | Anti-interleukin-33 antibodies and uses thereof |
Families Citing this family (26)
| Publication number | Priority date | Publication date | Assignee | Title |
|---|---|---|---|---|
| EP1731910A1 (en) * | 2005-06-07 | 2006-12-13 | F. Hoffmann-La Roche Ag | Use of NT-proANP and NT-proBNP for diagnosing cardiac diseases |
| ES2542343T3 (en) * | 2006-05-02 | 2015-08-04 | Critical Care Diagnostics, Inc. | Differential diagnosis between pulmonary and cardiovascular disease |
| EP2019843A2 (en) * | 2006-05-25 | 2009-02-04 | Momenta Pharmaceuticals, Inc. | Low molecular weight heparin composition and uses thereof |
| US11389080B2 (en) | 2007-11-28 | 2022-07-19 | Intervet Inc. | System and method for diagnosis of bovine diseases using auscultation analysis |
| US20110076729A1 (en) * | 2008-02-20 | 2011-03-31 | Momenta Pharmaceuticals, Inc. | Methods of making low molecular weight heparin compositions |
| US20100099958A1 (en) * | 2008-10-16 | 2010-04-22 | Fresenius Medical Care Holdings Inc. | Method of identifying when a patient undergoing hemodialysis is at increased risk of death |
| US9883799B2 (en) * | 2008-10-16 | 2018-02-06 | Fresenius Medical Care Holdings, Inc. | Method of identifying when a patient undergoing hemodialysis is at increased risk of death |
| US10064580B2 (en) | 2008-11-07 | 2018-09-04 | Intervet Inc. | System and method for determining antibiotic effectiveness in respiratory diseased animals using auscultation analysis |
| WO2011038047A1 (en) * | 2009-09-23 | 2011-03-31 | Momenta Pharmaceuticals, Inc. | Methods of treatment with a low molecular weight heparin composition |
| AU2010319290A1 (en) * | 2009-11-13 | 2012-05-24 | Bg Medicine, Inc. | Risk factors and prediction of myocardial infarction |
| US20110237513A1 (en) * | 2010-03-26 | 2011-09-29 | Pronota N.V. | Ltbp2 as a biomarker for renal dysfunction |
| JP2011232164A (en) * | 2010-04-27 | 2011-11-17 | Keio Gijuku | Liver disease marker, method and device for measuring the same, and method for verifying medicine |
| US20110295613A1 (en) * | 2010-05-28 | 2011-12-01 | Martin Coyne | Inpatient utilization management system and method |
| GB201021289D0 (en) * | 2010-12-15 | 2011-01-26 | Immatics Biotechnologies Gmbh | Novel biomarkers for a prediction of the outcome of an immunotherapy against cancer |
| US10203321B2 (en) | 2010-12-02 | 2019-02-12 | Fresenius Medical Care Holdings, Inc. | Method of identifying when a patient undergoing hemodialysis is at increased risk of death |
| US20130157290A1 (en) * | 2011-12-16 | 2013-06-20 | Yves Levy | Soluble st2 as a marker for disease |
| UY34813A (en) | 2012-05-18 | 2013-11-29 | Amgen Inc | ANTIGEN UNION PROTEINS DIRECTED AGAINST ST2 RECEIVER |
| BR112015018929B8 (en) | 2013-02-06 | 2023-01-31 | Geissler Companies Llc | ELECTRONIC HEALTH SYSTEM TO DETERMINE THE EFFECTIVENESS OF A DRUG ADMINISTERED USING AUSCULTATION ANALYSIS |
| JP6655016B2 (en) | 2014-01-10 | 2020-02-26 | クリティカル ケア ダイアグノスティクス インコーポレイテッド | Methods for determining the risk of heart failure |
| AU2014407088B2 (en) | 2014-09-26 | 2021-09-23 | Somalogic Operating Co., Inc. | Cardiovascular risk event prediction and uses thereof |
| ES2708325T5 (en) | 2014-10-29 | 2023-02-17 | Hoffmann La Roche | Biomarkers for predicting the risk of chronic heart failure progression and mortality |
| US10079073B2 (en) | 2014-12-11 | 2018-09-18 | Critical Care Diagnostics, Inc. | Test apparatus and methods for ST2 cardiac biomarker |
| US10324089B2 (en) | 2014-12-11 | 2019-06-18 | Critical Care Diagnostics, Inc. | Test apparatus and methods for ST2 cardiac biomarker |
| CN106952043B (en) * | 2017-03-23 | 2021-04-13 | 国家电网公司客户服务中心 | Planned power failure sensitivity assessment method and device |
| CN108982871B (en) * | 2018-07-19 | 2021-09-24 | 北京市心肺血管疾病研究所 | Application of serum sST2 in children dilated cardiomyopathy prognosis |
| WO2023201054A1 (en) * | 2022-04-15 | 2023-10-19 | Memorial Sloan-Kettering Cancer Center | Multi-modal machine learning to determine risk stratification |
Citations (1)
| Publication number | Priority date | Publication date | Assignee | Title |
|---|---|---|---|---|
| US20040133079A1 (en) * | 2003-01-02 | 2004-07-08 | Mazar Scott Thomas | System and method for predicting patient health within a patient management system |
Family Cites Families (79)
| Publication number | Priority date | Publication date | Assignee | Title |
|---|---|---|---|---|
| US4208479A (en) * | 1977-07-14 | 1980-06-17 | Syva Company | Label modified immunoassays |
| US5206140A (en) * | 1988-06-24 | 1993-04-27 | Research Corporation Technologies, Inc. | Assay for soluble crosslinked fibrin polymers |
| JPH0731479Y2 (en) | 1989-06-02 | 1995-07-19 | 内橋エステック株式会社 | Thermal fuse |
| US5217899A (en) | 1990-08-24 | 1993-06-08 | The General Hospital Corporation | Cell stretching apparatus |
| JP2665850B2 (en) | 1991-11-14 | 1997-10-22 | 塩野義製薬株式会社 | Monoclonal antibody recognizing the C-terminus of hBNP |
| GB9211686D0 (en) * | 1992-06-03 | 1992-07-15 | Medisinsk Innovation A S | Chemical compounds |
| JPH0731479A (en) | 1993-02-23 | 1995-02-03 | Shinichi Tominaga | Dna of coding murine st2l, expression product of the same dna and production of expression product by expressing the same dna |
| US6066322A (en) * | 1995-03-03 | 2000-05-23 | Millennium Pharmaceuticals, Inc. | Methods for the treatment of immune disorders |
| EP0963205A4 (en) | 1996-08-23 | 2002-10-02 | Human Genome Sciences Inc | T1 receptor-like ligand ii |
| EP0981619A1 (en) | 1997-02-28 | 2000-03-01 | Human Genome Sciences, Inc. | T1/st2-receptor ligand iii |
| DE19711932A1 (en) | 1997-03-21 | 1998-09-24 | Anne Katrin Dr Werenskiold | An in vitro method for predicting the course of disease of patients with breast cancer and / or for diagnosing a breast carcinoma |
| DE69829293T2 (en) * | 1997-04-02 | 2006-04-13 | The Brigham And Women's Hospital Inc., Boston | USE OF A MEANS TO REDUCE THE RISK OF CARDIOVASCULAR DISEASES |
| ATE489633T1 (en) * | 1997-06-10 | 2010-12-15 | Lpath Inc | METHOD FOR EARLY DETECTION OF HEART DISEASES |
| ATE315228T1 (en) | 1997-09-11 | 2006-02-15 | Shionogi & Co | IMMUNOASSAY TO DETERMINE BNP |
| GB9727172D0 (en) | 1997-12-24 | 1998-02-25 | Univ Glasgow | Reagents specific for st2l and uses therefor |
| GB9827348D0 (en) | 1998-12-12 | 1999-02-03 | Univ Leicester | Natriuretic peptide |
| EP1140137A2 (en) | 1998-12-18 | 2001-10-10 | Scios Inc. | Method for detection and use of differentially expressed genes in disease states |
| WO2000073498A1 (en) | 1999-06-02 | 2000-12-07 | Millennium Pharmaceuticals, Inc. | Compositions and methods for the treatment and diagnosis of immune disorders |
| FR2795823B1 (en) | 1999-07-01 | 2001-11-23 | Inst Nat Sante Rech Med | METHODS AND KITS FOR DIAGNOSING OR MONITORING SYNOVIAL OR OSTEOARTICULAR PATHOLOGY INCLUDING THE USE OF A SPECIFIC MARKER FOR THE DEGRADATION OF SYNOVIAL TISSUE |
| AU783855B2 (en) | 1999-08-24 | 2005-12-15 | Medicure International Inc. | Compositions for the treatment of cardiovascular diseases containing pyridoxal compounds and cardiovascular compounds |
| US6323334B1 (en) | 1999-09-24 | 2001-11-27 | Millennium Pharmaceuticals, Inc. | Nucleic acid molecules encoding a 103 gene product and uses therefor |
| AU2001218871A1 (en) | 2000-03-21 | 2001-10-03 | Takao Arai | Monoclonal antibody and method and kit for the immunoassay of soluble human st2 with the use of the same |
| FR2807170B1 (en) | 2000-03-30 | 2002-06-28 | Sipal | ELASTIC HINGE WITH REDUCED FRICTION |
| IL149251A0 (en) | 2000-08-22 | 2002-11-10 | Brigham & Womens Hospital | Diagnosis and treatment of cardiovascular conditions |
| WO2002038794A2 (en) | 2000-11-09 | 2002-05-16 | The Brigham And Women's Hospital, Inc. | Cardiovascular disease diagnostic and therapeutic targets |
| US6537221B2 (en) | 2000-12-07 | 2003-03-25 | Koninklijke Philips Electronics, N.V. | Strain rate analysis in ultrasonic diagnostic images |
| US20040253637A1 (en) | 2001-04-13 | 2004-12-16 | Biosite Incorporated | Markers for differential diagnosis and methods of use thereof |
| US7713705B2 (en) * | 2002-12-24 | 2010-05-11 | Biosite, Inc. | Markers for differential diagnosis and methods of use thereof |
| DE60235416D1 (en) | 2001-05-04 | 2010-04-01 | Biosite Inc | Diagnostic markers of acute coronary syndromes and their uses |
| US6905827B2 (en) * | 2001-06-08 | 2005-06-14 | Expression Diagnostics, Inc. | Methods and compositions for diagnosing or monitoring auto immune and chronic inflammatory diseases |
| WO2003022987A2 (en) * | 2001-07-26 | 2003-03-20 | Eos Biotechnology, Inc. | Methods of diagnosis of hepatitis c infection, compositions and methods of screening for modulators of hepatitis c infection |
| US6810284B1 (en) | 2001-11-21 | 2004-10-26 | Pacesetter, Inc. | Implantable cardiac stimulation system and method for monitoring diastolic function |
| US7670769B2 (en) | 2002-05-09 | 2010-03-02 | The Brigham And Women's Hospital, Inc. | IL1RL-1 as a cardiovascular disease marker and therapeutic target |
| MXPA03004105A (en) * | 2002-05-14 | 2004-10-15 | Hoffmann La Roche | Making a prognosis in cases of cardiac disease using a combination of markers. |
| US20040005615A1 (en) * | 2002-05-24 | 2004-01-08 | Jing Li | Amplification and overexpression of oncogenes |
| US8263325B2 (en) * | 2002-11-15 | 2012-09-11 | Ottawa Heart Institute Research Corporation | Predicting, detecting and monitoring treatment of cardiomyopathies and myocarditis |
| AU2003299441A1 (en) * | 2002-12-19 | 2004-07-14 | Centre National De La Recherche Scientifique - Cnrs | Nf-hev compositions and methods of use |
| US20040220155A1 (en) | 2003-03-28 | 2004-11-04 | Pharmacia Corporation | Method of providing a steroid-sparing benefit with a cyclooxygenase-2 inhibitor and compositions therewith |
| US20050123451A1 (en) | 2003-10-31 | 2005-06-09 | Hiroshi Nomura | System and apparatus for body fluid analysis using surface-textured optical materials |
| CA2832293C (en) * | 2003-11-26 | 2015-08-04 | Celera Corporation | Single nucleotide polymorphisms associated with cardiovascular disorders and statin response, methods of detection and uses thereof |
| WO2005055810A2 (en) | 2003-12-05 | 2005-06-23 | The Cleveland Clinic Foundation | Risk markers for cardiovascular disease |
| US20050196817A1 (en) * | 2004-01-20 | 2005-09-08 | Molecular Staging Inc. | Biomarkers for sepsis |
| NZ549040A (en) | 2004-02-17 | 2009-07-31 | Schering Corp | Use for interleukin-33 (IL33) and the IL-33 receptor complex |
| JP2005291899A (en) * | 2004-03-31 | 2005-10-20 | Akira Matsumori | Examination method of heart disease |
| EP1833766A1 (en) | 2004-12-17 | 2007-09-19 | Clearwater Systems Corp. | Method and apparatus for treating fluids |
| DK1849009T3 (en) | 2005-01-24 | 2009-01-12 | Hoffann La Roche Ag F | Use of cardiac hormones to diagnose cardiovascular risk as a result of administration of anti-inflammatory drugs |
| EP1731910A1 (en) | 2005-06-07 | 2006-12-13 | F. Hoffmann-La Roche Ag | Use of NT-proANP and NT-proBNP for diagnosing cardiac diseases |
| US20070021977A1 (en) * | 2005-07-19 | 2007-01-25 | Witt Biomedical Corporation | Automated system for capturing and archiving information to verify medical necessity of performing medical procedure |
| JP4820192B2 (en) | 2006-03-17 | 2011-11-24 | 一般財団法人化学及血清療法研究所 | Measurement and use of ADAMTS13 in acute coronary syndromes |
| EP3255432B1 (en) | 2006-04-24 | 2019-01-23 | Critical Care Diagnostics, Inc. | Predicting mortality and detecting severe disease |
| ATE517341T1 (en) | 2006-04-27 | 2011-08-15 | Critical Care Diagnostics Inc | INTERLEUKIN-33 (IL-33) FOR THE DIAGNOSIS AND PREDICTION OF CARDIOVASCULAR DISEASES |
| SI2482078T1 (en) | 2006-05-01 | 2016-05-31 | Critical Care Diagnostics, Inc. | Diagnosis of cardiovascular disease |
| ES2542343T3 (en) | 2006-05-02 | 2015-08-04 | Critical Care Diagnostics, Inc. | Differential diagnosis between pulmonary and cardiovascular disease |
| US8147817B2 (en) * | 2006-05-04 | 2012-04-03 | The Brigham And Women's Hospital, Inc. | IL-33 in the treatment and diagnosis of diseases and disorders |
| RU2312591C1 (en) | 2006-06-14 | 2007-12-20 | Государственное образовательное учреждение высшего профессионального образования "Санкт-Петербургская государственная медицинская академия им. И.И. Мечникова Федерального агентства по здравоохранению и социальному развитию" | Method for predicting the development of the risk of crib death in patients with left- and right-ventricular extrasystolia |
| WO2008116083A1 (en) | 2007-03-22 | 2008-09-25 | Cv Therapeutics, Inc. | Use of ranolazine for elevated brain-type natriuretic peptide |
| AU2008251801A1 (en) | 2007-05-11 | 2008-11-20 | The General Hospital Corporation | Polynucleotides associated with age-related macular degeneration and methods for evaluating patient risk |
| GB0713404D0 (en) | 2007-07-11 | 2007-08-22 | Integra Sp Ipr Ltd | Altio graph |
| WO2009040133A1 (en) | 2007-09-26 | 2009-04-02 | Universitätsklinikum Heidelberg | Osteopontin as novel prognostic biomarker for heart failure |
| FR2923029B1 (en) | 2007-10-26 | 2009-11-20 | Minima | GLASSES OF TYPE WITHOUT ENTOURAGE WITH WIRED BRANCHES |
| WO2009129454A2 (en) | 2008-04-18 | 2009-10-22 | Critical Care Diagnostics, Inc. | Predicting risk of major adverse cardiac events |
| EP2347266B9 (en) | 2008-11-11 | 2014-02-12 | B.R.A.H.M.S GmbH | Prognosis and risk assessment in patients suffering from heart failure by determining the level of adm |
| AU2010319290A1 (en) | 2009-11-13 | 2012-05-24 | Bg Medicine, Inc. | Risk factors and prediction of myocardial infarction |
| PL2556090T3 (en) | 2010-04-09 | 2017-07-31 | Critical Care Diagnostics, Inc. | Soluble human st-2 antibodies and assays |
| EP2635904A1 (en) | 2010-11-01 | 2013-09-11 | B.R.A.H.M.S GmbH | Prognosis and risk assessment of patients with non-specific complaints |
| RU2452394C1 (en) | 2010-11-09 | 2012-06-10 | Федеральное государственное бюджетное образовательное учреждение высшего профессионального образования Ульяновский государственный университет | Method of predicting risk of death of patients with chronic heart failure |
| CN103718046B (en) | 2011-03-17 | 2016-10-12 | 重症监护诊断股份有限公司 | The method predicting the risk of bad clinical effectiveness |
| BR112014001283A2 (en) | 2011-07-18 | 2017-02-21 | Critical Care Diagnostics Inc | Cardiovascular disease treatment methods and prevention of the effectiveness of exercise therapy |
| JP6302896B2 (en) | 2012-05-18 | 2018-03-28 | クリティカル ケア ダイアグノスティクス インコーポレイテッド | Method for treating or predicting the risk of a ventricular tachyarrhythmia event |
| RU2683026C2 (en) | 2012-08-16 | 2019-03-26 | Критикал Кэа Дайэгностикс, Инк. | Methods for predicting risk of developing hypertension |
| JP6450679B2 (en) | 2012-08-21 | 2019-01-09 | クリティカル ケア ダイアグノスティクス インコーポレイテッド | Multi-marker risk stratification |
| JP6178687B2 (en) | 2013-09-27 | 2017-08-09 | 富士機械工業株式会社 | Gravure coating equipment |
| JP6655016B2 (en) | 2014-01-10 | 2020-02-26 | クリティカル ケア ダイアグノスティクス インコーポレイテッド | Methods for determining the risk of heart failure |
| USD770057S1 (en) | 2014-04-14 | 2016-10-25 | Critical Care Diagnostics, Inc. | Blood test kit |
| US9934249B2 (en) | 2014-06-03 | 2018-04-03 | Conduent Business Machines Services, Llc | Systems and methods for context-aware and personalized access to visualizations of road events |
| USD800332S1 (en) | 2014-09-23 | 2017-10-17 | Critical Care Diagnostics, Inc. | Blood test kit |
| USD800333S1 (en) | 2014-09-23 | 2017-10-17 | Critical Care Diagnostics, Inc. | Blood test kit |
| US10079073B2 (en) | 2014-12-11 | 2018-09-18 | Critical Care Diagnostics, Inc. | Test apparatus and methods for ST2 cardiac biomarker |
| US10324089B2 (en) | 2014-12-11 | 2019-06-18 | Critical Care Diagnostics, Inc. | Test apparatus and methods for ST2 cardiac biomarker |
-
2007
- 2007-04-24 EP EP17177530.7A patent/EP3255432B1/en not_active Not-in-force
- 2007-04-24 ES ES14188319.9T patent/ES2646142T3/en active Active
- 2007-04-24 EP EP07761219A patent/EP2010912B1/en active Active
- 2007-04-24 ES ES07761219T patent/ES2351623T3/en active Active
- 2007-04-24 EP EP11177461.8A patent/EP2386860B1/en not_active Not-in-force
- 2007-04-24 EP EP10171764A patent/EP2241888B1/en active Active
- 2007-04-24 PL PL14188319T patent/PL2848938T3/en unknown
- 2007-04-24 CA CA2650201A patent/CA2650201C/en not_active Expired - Fee Related
- 2007-04-24 AT AT10171764T patent/ATE527544T1/en active
- 2007-04-24 DK DK11177461.8T patent/DK2386860T3/en active
- 2007-04-24 WO PCT/US2007/067333 patent/WO2007127749A2/en active Application Filing
- 2007-04-24 US US11/789,169 patent/US7998683B2/en active Active
- 2007-04-24 ES ES10171764T patent/ES2378314T3/en active Active
- 2007-04-24 EP EP14188319.9A patent/EP2848938B1/en not_active Not-in-force
- 2007-04-24 ES ES11177461.8T patent/ES2529618T3/en active Active
- 2007-04-24 DE DE602007008224T patent/DE602007008224D1/en active Active
- 2007-04-24 JP JP2009507931A patent/JP5383480B2/en not_active Expired - Fee Related
- 2007-04-24 PL PL11177461T patent/PL2386860T4/en unknown
- 2007-04-24 AT AT07761219T patent/ATE476657T1/en active
- 2007-04-24 DK DK10171764.3T patent/DK2241888T3/en active
- 2007-04-24 DK DK14188319.9T patent/DK2848938T3/en active
- 2007-04-24 AU AU2007244927A patent/AU2007244927B2/en not_active Ceased
-
2011
- 2011-07-08 US US13/179,173 patent/US8617825B2/en active Active
- 2011-10-26 US US13/282,111 patent/US9568481B2/en active Active
-
2012
- 2012-04-26 JP JP2012100940A patent/JP5806165B2/en active Active
- 2012-05-16 HK HK12104804.4A patent/HK1164443A1/en not_active IP Right Cessation
-
2013
- 2013-03-07 US US13/787,975 patent/US9057733B2/en not_active Expired - Fee Related
-
2015
- 2015-09-03 JP JP2015173815A patent/JP6214604B2/en active Active
- 2015-09-17 HK HK15109122.5A patent/HK1208724A1/en not_active IP Right Cessation
- 2015-09-17 HK HK18107615.0A patent/HK1248311B/en not_active IP Right Cessation
-
2017
- 2017-01-19 US US15/410,155 patent/US10067146B2/en active Active
- 2017-09-19 JP JP2017178945A patent/JP2017215347A/en active Pending
-
2018
- 2018-08-13 US US16/101,939 patent/US11016103B2/en active Active
-
2021
- 2021-04-27 US US17/241,303 patent/US20210255200A1/en not_active Abandoned
Patent Citations (1)
| Publication number | Priority date | Publication date | Assignee | Title |
|---|---|---|---|---|
| US20040133079A1 (en) * | 2003-01-02 | 2004-07-08 | Mazar Scott Thomas | System and method for predicting patient health within a patient management system |
Non-Patent Citations (4)
| Title |
|---|
| See also references of EP2010912A2 * |
| TSUCHIYA ET AL.: 'Expression and Regulation of ST2 an interleukin-1 Receprtor Family member, in cardinmyocytes and myocardial infarction' CIRCULATION vol. 106, 2002, pages 2961 - 2966, XP008013076 * |
| TSUCHIYA ET AL.: 'Th1, Th2 and activated T-cell marker and clinical prognosis in peripheral T-cell lymphoma unspecified comparison AILD, ALCL, lymphoblastic lymphoma and ATLL' BLOOD vol. 103, 2004, pages 236 - 241, XP008131665 * |
| WEINBERG ET AL.: 'Identification of Serum Schluble ST2 receptor as a novel heart failure biomarker' CIRCULATION vol. 107, 2003, pages 721 - 726, XP002985431 * |
Cited By (69)
| Publication number | Priority date | Publication date | Assignee | Title |
|---|---|---|---|---|
| US9857379B2 (en) | 2000-11-09 | 2018-01-02 | The Brigham And Women's Hospital Inc. | Methods for treatment of cardiovascular disease |
| US8530173B2 (en) | 2000-11-09 | 2013-09-10 | The Brigham And Women's Hospital, Inc. | Methods for treatment of cardiovascular disease |
| US8871452B2 (en) | 2000-11-09 | 2014-10-28 | The Brigham And Women's Hospital, Inc. | Methods for treatment of cardiovascular disease |
| US8734769B2 (en) | 2002-05-09 | 2014-05-27 | The Brigham And Women's Hospital, Inc. | 1L1RL-1 as a cardiovascular disease marker and therapeutic target |
| US7989210B2 (en) | 2002-05-09 | 2011-08-02 | The Brigham And Women's Hospital, Inc. | IL1RL-1 as a cardiovascular disease marker and therapeutic target |
| US10788500B2 (en) | 2002-05-09 | 2020-09-29 | Brigham & Women's Hospital, Inc. | IL1RL-1 as a cardiovascular disease marker and therapeutic target |
| US9851362B2 (en) | 2002-05-09 | 2017-12-26 | The Brigham & Women's Hosptial, Inc. | 1L1RL-1 as a cardiovascular disease marker and therapeutic target |
| US8748116B2 (en) | 2002-05-09 | 2014-06-10 | The Brigham And Women's Hospital, Inc. | 1L1RL-1 as a cardiovascular disease marker and therapeutic target |
| US8597958B2 (en) | 2002-05-09 | 2013-12-03 | The Brigham And Women's Hospital, Inc. | IL1RL-1 as a cardiovascular disease marker and therapeutic target |
| US9568481B2 (en) | 2006-04-24 | 2017-02-14 | Critical Care Diagnostics, Inc. | Methods of identifying a subject as having heart failure |
| US10067146B2 (en) | 2006-04-24 | 2018-09-04 | Critical Care Diagnostics, Inc. | Predicting mortality and detecting severe disease |
| JP2012181200A (en) * | 2006-04-24 | 2012-09-20 | Critical Care Diagnostics Inc | Prediction of mortality and detection of severe disease |
| US11016103B2 (en) | 2006-04-24 | 2021-05-25 | Critical Care Diagnostics, Inc. | Predicting mortality and detecting severe disease |
| US9057733B2 (en) | 2006-04-24 | 2015-06-16 | Critical Care Diagnostics, Inc. | Predicting mortality and detecting severe disease |
| US8617825B2 (en) | 2006-04-24 | 2013-12-31 | Critical Care Diagnostics, Inc. | Predicting mortality and detecting severe disease |
| EP2021799A2 (en) * | 2006-04-27 | 2009-02-11 | Critical Care Diagnostics, Inc. | Interleukin-33 (il-33) for the diagnosis and prognosis of cardiovascular disease |
| EP2021799A4 (en) * | 2006-04-27 | 2009-08-05 | Critical Care Diagnostics Inc | Interleukin-33 (il-33) for the diagnosis and prognosis of cardiovascular disease |
| US10203339B2 (en) | 2006-05-01 | 2019-02-12 | Critical Care Diagnostics, Inc. | Diagnosis of cardiovascular disease |
| WO2009100907A1 (en) * | 2008-02-14 | 2009-08-20 | Dianeering Diagnostics Engineering And Research Gmbh | Means and methods for assessing the risk of patients presenting to emergency departments based on very low concentrations of troponin i or t or using a combination of markers |
| JP2011520098A (en) * | 2008-04-18 | 2011-07-14 | クリティカル ケア ダイアグノスティクス インコーポレイテッド | How to predict the risk of major adverse heart events |
| JP2014178322A (en) * | 2008-04-18 | 2014-09-25 | Critical Care Diagnostics Inc | Method for predicting risk of major adverse cardiac event |
| JP2017203784A (en) * | 2008-04-18 | 2017-11-16 | クリティカル ケア ダイアグノスティクス インコーポレイテッド | Method for predicting risk of major adverse cardiac events |
| JP2016048272A (en) * | 2008-04-18 | 2016-04-07 | クリティカル ケア ダイアグノスティクス インコーポレイテッド | Method for predicting risk of major adverse cardiac events |
| US8090562B2 (en) | 2008-04-18 | 2012-01-03 | Critical Care Diagnostics, Inc. | Predicting risk of major adverse cardiac events |
| US11170896B2 (en) | 2008-04-18 | 2021-11-09 | Critical Care Diagnostics, Inc. | Predicting risk of major adverse cardiac events |
| US9886553B2 (en) | 2008-04-18 | 2018-02-06 | Critical Care Diagnostics, Inc. | Predicting risk of major adverse cardiac events |
| JP2019105645A (en) * | 2008-04-18 | 2019-06-27 | クリティカル ケア ダイアグノスティクス インコーポレイテッド | Method for predicting risk of major adverse cardiac events |
| US9965593B2 (en) | 2008-04-18 | 2018-05-08 | Critical Care Diagnostics, Inc. | Predicting risk of major adverse cardiac events |
| RU2549481C2 (en) * | 2008-07-02 | 2015-04-27 | Апосайенс Аг | Diagnosing chronic obstructive pulmonary disease (copd) |
| WO2010000820A3 (en) * | 2008-07-02 | 2010-03-04 | Aposcience Ag | Copd diagnosis |
| EP2330424A1 (en) * | 2008-07-02 | 2011-06-08 | Aposcience AG | COPD diagnosis |
| WO2010000820A2 (en) * | 2008-07-02 | 2010-01-07 | Aposcience Ag | Copd diagnosis |
| EP2141499A1 (en) * | 2008-07-02 | 2010-01-06 | Apoptec AG | COPD diagnosis |
| US8415112B2 (en) | 2008-07-02 | 2013-04-09 | Aposcience Ag | COPD diagnosis |
| JP2013152236A (en) * | 2008-07-02 | 2013-08-08 | Aposcience Ag | Copd diagnosis |
| WO2010071119A1 (en) * | 2008-12-15 | 2010-06-24 | 塩野義製薬株式会社 | Method for diagnosing pancreatic cancer by sugar chain analysis |
| WO2010071120A1 (en) * | 2008-12-15 | 2010-06-24 | 塩野義製薬株式会社 | Method for diagnosing lung cancer by sugar chain analysis |
| RU2684724C2 (en) * | 2010-04-09 | 2019-04-11 | Критикал Кэа Дайэгностикс, Инк. | Soluble human st-2 antibodies and assays |
| US10745484B2 (en) | 2010-04-09 | 2020-08-18 | Critical Care Diagnostics, Inc. | Soluble human ST-2 antibodies and assays |
| EP3434694A1 (en) | 2010-04-09 | 2019-01-30 | Critical Care Diagnostics, Inc. | Soluble human st-2 antibodies and assays |
| US8420785B2 (en) | 2010-04-09 | 2013-04-16 | Critical Care Diagnostics, Inc. | Soluble human ST-2 antibodies and assays |
| EP3848394A1 (en) | 2010-04-09 | 2021-07-14 | Critical Care Diagnostics, Inc. | Soluble human st-2 antibodies and assays |
| WO2011127412A2 (en) | 2010-04-09 | 2011-10-13 | Critical Care Diagnostics, Inc. | Soluble human st-2 antibodies and assays |
| EP2635904A1 (en) * | 2010-11-01 | 2013-09-11 | B.R.A.H.M.S GmbH | Prognosis and risk assessment of patients with non-specific complaints |
| US9239333B2 (en) | 2011-03-17 | 2016-01-19 | Critical Care Diagnostics, Inc. | Methods of determining efficacy of treatment in a subject having heart failure |
| EP2686689A4 (en) * | 2011-03-17 | 2014-09-03 | Critical Care Diagnostics Inc | Methods predicting risk of an adverse clinical outcome |
| WO2012141844A2 (en) | 2011-03-17 | 2012-10-18 | Critical Care Diagnostics, Inc. | Methods predicting risk of an adverse clinical outcome |
| US8728742B2 (en) | 2011-03-17 | 2014-05-20 | Critical Care Diagnostics, Inc. | Methods predicting risk of an adverse clinical outcome |
| US9823257B2 (en) | 2011-03-17 | 2017-11-21 | Critical Care Diagnostics, Inc. | Methods of treating or selecting a treatment for a subject having heart failure that include detecting levels of galectin-3 and soluble ST2 |
| EP2686689A2 (en) * | 2011-03-17 | 2014-01-22 | Critical Care Diagnostics, Inc. | Methods predicting risk of an adverse clinical outcome |
| EP3605104A1 (en) * | 2011-03-17 | 2020-02-05 | Critical Care Diagnostics, Inc. | Methods predicitng risk of an adverse clinical outcome |
| US10393756B2 (en) | 2011-03-17 | 2019-08-27 | Critical Care Diagnostics, Inc. | Methods of treating a subject having heart failure that include detecting levels of galectin-3 and soluble ST2 |
| US10928393B2 (en) | 2011-07-18 | 2021-02-23 | Critical Care Diagnostics, Inc. | Methods of treating cardiovascular diseases and predicting the efficacy of exercise therapy |
| US11340236B2 (en) | 2012-05-18 | 2022-05-24 | Critical Care Diagnostics, Inc. | Methods for treating or predicting risk of a ventricular tachyarrhythmia event |
| US10408845B2 (en) | 2012-05-18 | 2019-09-10 | Critical Care Diagnostics, Inc. | Methods for treating or predicting risk of a ventricular tachyarrhythmia event |
| US10041957B2 (en) | 2012-08-16 | 2018-08-07 | Critical Care Diagnostics, Inc. | Methods for predicting risk of developing hypertension |
| US9523696B2 (en) | 2012-08-16 | 2016-12-20 | Critical Care Diagnostics, Inc. | Methods for predicting risk of developing hypertension |
| EP2885641A4 (en) * | 2012-08-16 | 2016-03-23 | Critical Care Diagnostics Inc | Methods for predicting risk of developing hypertension |
| EP2885641A1 (en) * | 2012-08-16 | 2015-06-24 | Critical Care Diagnostics, Inc. | Methods for predicting risk of developing hypertension |
| WO2014028875A1 (en) | 2012-08-16 | 2014-02-20 | Critical Care Diagnostics, Inc. | Methods for predicting risk of developing hypertension |
| AU2013302451B2 (en) * | 2012-08-16 | 2019-01-17 | Critical Care Diagnostics, Inc. | Methods for predicting risk of developing hypertension |
| EP3282258A1 (en) * | 2012-08-16 | 2018-02-14 | Critical Care Diagnostics, Inc. | Methods for predicting risk of developing hypertension |
| US10303844B2 (en) | 2012-08-21 | 2019-05-28 | Critical Care Diagnostics, Inc. | Multimarker risk stratification |
| US10741290B2 (en) | 2012-08-21 | 2020-08-11 | Critical Care Diagnostics, Inc. | Multimarker risk stratification |
| US10093730B2 (en) | 2014-11-10 | 2018-10-09 | Genentech, Inc. | Anti-interleukin-33 antibodies and uses thereof |
| US10723795B2 (en) | 2014-11-10 | 2020-07-28 | Genentech, Inc. | Anti-interleukin-33 antibodies and uses thereof |
| US11708608B2 (en) | 2014-11-10 | 2023-07-25 | Genentech, Inc. | Therapeutic and diagnostic methods for IL-33-mediated disorders |
| US11725050B2 (en) | 2014-11-10 | 2023-08-15 | Genentech, Inc. | Anti-interleukin-33 antibodies and uses thereof |
| US11760797B2 (en) | 2020-03-13 | 2023-09-19 | Genentech, Inc. | Anti-interleukin-33 antibodies and uses thereof |
Also Published As
Similar Documents
| Publication | Publication Date | Title |
|---|---|---|
| US20210255200A1 (en) | Predicting mortality and detecting severe disease | |
| US8090562B2 (en) | Predicting risk of major adverse cardiac events | |
| AU2016200419B2 (en) | Predicting mortality and detecting severe disease | |
| AU2012202069B2 (en) | Predicting mortality and detecting severe disease |
Legal Events
| Date | Code | Title | Description |
|---|---|---|---|
| 121 | Ep: the epo has been informed by wipo that ep was designated in this application |
Ref document number: 07761219 Country of ref document: EP Kind code of ref document: A2 |
|
| WWE | Wipo information: entry into national phase |
Ref document number: 2650201 Country of ref document: CA |
|
| WWE | Wipo information: entry into national phase |
Ref document number: 2009507931 Country of ref document: JP |
|
| WWE | Wipo information: entry into national phase |
Ref document number: 2007244927 Country of ref document: AU |
|
| NENP | Non-entry into the national phase |
Ref country code: DE |
|
| WWE | Wipo information: entry into national phase |
Ref document number: 2007761219 Country of ref document: EP |
|
| ENP | Entry into the national phase |
Ref document number: 2007244927 Country of ref document: AU Date of ref document: 20070424 Kind code of ref document: A |