WO2012109675A1 - Aptamers to tissue factor pathway inhibitor and their use as bleeding disorder therapeutics - Google Patents
Aptamers to tissue factor pathway inhibitor and their use as bleeding disorder therapeutics Download PDFInfo
- Publication number
- WO2012109675A1 WO2012109675A1 PCT/US2012/024916 US2012024916W WO2012109675A1 WO 2012109675 A1 WO2012109675 A1 WO 2012109675A1 US 2012024916 W US2012024916 W US 2012024916W WO 2012109675 A1 WO2012109675 A1 WO 2012109675A1
- Authority
- WO
- WIPO (PCT)
- Prior art keywords
- aptamer
- tfpi
- amino acids
- seq
- arc
- Prior art date
Links
- 0 C*(CC*(C)(C)*)CC(NCC=CC)=* Chemical compound C*(CC*(C)(C)*)CC(NCC=CC)=* 0.000 description 5
- BHJCXFGIBMPTDH-SAAXCQNUSA-N C(C1)CC2[C@@H]1C[C@H]1CC2CC1 Chemical compound C(C1)CC2[C@@H]1C[C@H]1CC2CC1 BHJCXFGIBMPTDH-SAAXCQNUSA-N 0.000 description 1
- RFAKUGGKHZOCSH-IHWYPQMZSA-N C/C=C\CCC1CCCC1 Chemical compound C/C=C\CCC1CCCC1 RFAKUGGKHZOCSH-IHWYPQMZSA-N 0.000 description 1
Classifications
-
- C—CHEMISTRY; METALLURGY
- C12—BIOCHEMISTRY; BEER; SPIRITS; WINE; VINEGAR; MICROBIOLOGY; ENZYMOLOGY; MUTATION OR GENETIC ENGINEERING
- C12N—MICROORGANISMS OR ENZYMES; COMPOSITIONS THEREOF; PROPAGATING, PRESERVING, OR MAINTAINING MICROORGANISMS; MUTATION OR GENETIC ENGINEERING; CULTURE MEDIA
- C12N15/00—Mutation or genetic engineering; DNA or RNA concerning genetic engineering, vectors, e.g. plasmids, or their isolation, preparation or purification; Use of hosts therefor
- C12N15/09—Recombinant DNA-technology
- C12N15/11—DNA or RNA fragments; Modified forms thereof; Non-coding nucleic acids having a biological activity
- C12N15/115—Aptamers, i.e. nucleic acids binding a target molecule specifically and with high affinity without hybridising therewith ; Nucleic acids binding to non-nucleic acids, e.g. aptamers
-
- A—HUMAN NECESSITIES
- A61—MEDICAL OR VETERINARY SCIENCE; HYGIENE
- A61P—SPECIFIC THERAPEUTIC ACTIVITY OF CHEMICAL COMPOUNDS OR MEDICINAL PREPARATIONS
- A61P7/00—Drugs for disorders of the blood or the extracellular fluid
- A61P7/04—Antihaemorrhagics; Procoagulants; Haemostatic agents; Antifibrinolytic agents
-
- C—CHEMISTRY; METALLURGY
- C12—BIOCHEMISTRY; BEER; SPIRITS; WINE; VINEGAR; MICROBIOLOGY; ENZYMOLOGY; MUTATION OR GENETIC ENGINEERING
- C12N—MICROORGANISMS OR ENZYMES; COMPOSITIONS THEREOF; PROPAGATING, PRESERVING, OR MAINTAINING MICROORGANISMS; MUTATION OR GENETIC ENGINEERING; CULTURE MEDIA
- C12N2310/00—Structure or type of the nucleic acid
- C12N2310/10—Type of nucleic acid
- C12N2310/16—Aptamers
-
- C—CHEMISTRY; METALLURGY
- C12—BIOCHEMISTRY; BEER; SPIRITS; WINE; VINEGAR; MICROBIOLOGY; ENZYMOLOGY; MUTATION OR GENETIC ENGINEERING
- C12N—MICROORGANISMS OR ENZYMES; COMPOSITIONS THEREOF; PROPAGATING, PRESERVING, OR MAINTAINING MICROORGANISMS; MUTATION OR GENETIC ENGINEERING; CULTURE MEDIA
- C12N2310/00—Structure or type of the nucleic acid
- C12N2310/30—Chemical structure
- C12N2310/32—Chemical structure of the sugar
- C12N2310/321—2'-O-R Modification
Definitions
- the invention relates generally to the field of nucleic acids and more particularly to aptamers that bind to tissue factor pathway inhibitor (TFPI), which are useful as therapeutics in and diagnostics of bleeding disorders and/or other pathologies, diseases or disorders in which TFPI has been implicated.
- TFPI tissue factor pathway inhibitor
- the invention further relates to materials and methods for the administration of aptamers that bind to TFPI.
- An aptamer is an isolated or purified nucleic acid that binds with high specificity and affinity to a target through interactions other than Watson-Crick base pairing.
- An aptamer has a three dimensional structure that provides chemical contacts to specifically bind to a target.
- aptamer binding is not dependent upon a conserved linear base sequence, but rather a particular secondary or tertiary structure. That is, the nucleic acid sequences of aptamers are non-coding sequences. Any coding potential that an aptamer may possess is entirely fortuitous and plays no role whatsoever in the binding of an aptamer to a target.
- a typical minimized aptamer is 5-15 kDa in size (1 5-45 nucleotides), binds to a target with nanomolar to sub-nanomolar affinity, and discriminates against closely related targets (e.g. , aptamers will typically not bind to other proteins from the same gene or functional family).
- Aptarners have been generated to many targets, such as small molecules, carbohydrates, peptides and proteins, including growth factors, transcription factors, enzymes, immunoglobulins and receptors.
- Aptarners are capable of specifically binding to selected targets and modulating the target's activity or binding interactions, e.g., through binding, aptarners may inhibit or stimulate a target's ability to function.
- Specific binding to a target is an inherent property of an aptamer. Functional activity, i.e., inhibiting or stimulating a target's function, is not.
- an aptamer binds to a target and has little or no effect on the function of the target.
- an aptamer binds to a target and has an inhibitory or stimulatory effect on a target's function.
- Aptarners have a number of desirable characteristics for use as therapeutics and diagnostics, including high specificity and affinity, biological activity, low immunogenicity, tunable pharmacokinetic properties and stability.
- Coagulation is the formation of a stable fibrin/cellular hemostatic plug that is sufficient to stop bleeding.
- the coagulation process which is illustrated in Figure 1, involves complex biochemical and cellular interactions that can be divided into three stages.
- Stage 1 is the formation of activated Factor X by either the contact (intrinsic) or the tissue factor/Vila (extrinsic) pathway.
- Stage 2 is the formation of thrombin from prothrombin by Factor Xa.
- Stage 3 is the formation of fibrin from fibrinogen stabilized by Factor Xllla.
- Hemophilia is defined as a congenital or acquired disorder of coagulation that usually, but not always, involves a quantitative and/or functional deficiency of a single coagulation protein. Deficiency of coagulation Factors VIII (hemophilia A) and IX (hemophilia B) are the two most common inherited bleeding disorders. The total overall number of hemophilia A and B patients worldwide is approximately 400,000; however, only about 1/4 (100,000) of these individuals are treated. Hemophilia A and B can be further divided in regard to the extent of factor deficiency. Mild hemophilia is 5-40% of normal factor levels and represents approximately 25% of the total hemophilia population.
- Moderate hemophilia is 1-5% of normal factor levels and represents approximately 25% of the total hemophilia population. Severe hemophilia is ⁇ 1% of normal factor levels and represents approximately 50% of the total hemophilia population and the highest users of currently available therapies.
- Recombinant Factor Vila (rFVIIa) treatment is the most used of these bypass agents.
- Factor Vila complexes with endogenous tissue factor to activate the extrinsic pathway. It also can direct! ⁇ ' activate Factor X.
- the response to rFVIIa treatment is variable.
- the variable response, along with the poor pharmacokinetic (PK) profile of rFVIIa, can require multiple injections to control bleeding and significantly limits its utility for prophylactic treatment.
- tissue factor/Vila (extrinsic) pathway provides for rapid formation of low levels of thrombin that can serve as the initial hemostatic response to initiate and accelerate the Factor VIII, V and IX dependent intrinsic pathway.
- Tissue factor, Factor Vila and Factor Xa have a central role in this pathway and it is closely regulated by an endothelial cell associated Kunitz Type proteinase inhibitor, tissue factor pathway inhibitor (TFPI).
- TFPI tissue factor pathway inhibitor
- Tissue factor pathway inhibitor is a 40 kDa serine protease inhibitor that is synthesized in and found bound to endothelial cell surfaces ("surface TFPI”), in plasma at a concentration of 2-4 nM (“plasma TFPI”) and is stored (200 pM/10 platelets) and released from activated platelets. Approximately 10% of plasma TFPI is un associated, while 90% is associated with oxidized LDL particles and is inactive. There are two primary forms of TFPI, TFPIa and ⁇ ( Figures 2 and 3).
- TFPIa contains 3 Kunitz decoy domains, l , K2 and K3. Kl and K2 mimic protease substrates and inhibit by tight but reversible binding to the target proteases. In the case of TFPIa, Kl binds to and inhibits tissue factor/Vila, while K2 binds to and inhibits Factor Xa. The role for K3 is unknown at this time, but it may have a role in cell-surface binding and enhancing the inhibition of Factor Xa by K2. TFPIa has a basic C-termmal tail peptide that is the membrane binding site region for the molecule. It is estimated that 80% of the surface TFPI is TFPIa.
- TFPIa is primarily bound to the endothelial surface associated with the membrane proteoglycans. Heparin has been shown to release TFPIa from cultured endothelium, isolated veins and following intravenous (IV) heparin (unfractionated and LMWH) injection. The exact nature of the release mechanism is unclear (competition or induced release), but TFPI levels can be increased 3-8 fold following IV heparin administration. Some TFPIa can also be found bound to glycosylated phosphatidylinositol (GPI) via an unidentified co-receptor.
- GPI glycosylated phosphatidylinositol
- TFPIp is an alternatively spliced version of TFPI that is post-translationally modified with a glycosylated phosphatidylinositol (GPI) anchor. It is estimated that it represents about 20% of the surface T FPI in cultured endothelial cells. Although it has in vitro inhibitory activity, the functional in vivo role is less clear.
- GPI glycosylated phosphatidylinositol
- Surface TFPI may have a more important role in regulation of coagulation based on its localization to the site of vascular injury and thrombus formation.
- Surface TFPI represents the largest proportion of active TFPI.
- Data from several laboratories suggest that TFPI can also have complementary/synergistic effects via interactions with antithrombin III ( ⁇ ) and protein
- TFPI binds to Factor Vila and Factor Xa via its l and K2 domains and to proteoglycans via its K3 and C-terrninal domains.
- TFPI inhibition could provide a single treatment or an adjuvant treatment that is given in addition to or combined with recombinant purified factors.
- An approach to promote a prothrombotic state could be via the upregulation of the tissue factor mediated extrinsic pathway of coagulation. It, has been suggested that inhibition of TFPI might improve coagulation in the hemophilia patient.
- TFPI deficiency in mice can increase thrombus formation, and that TFPI antibodies improve bleeding times in Factor Viii deficient rabbits and shorten clotting in plasma from hemophilia patients.
- transient hemophilia A was induced by treating rabbits with a Factor VIII antibody. This was followed by treatment with either Factor VIII replacement or an antibody specific to rabbit TFPI.
- the anti-TFPI treatment produced a reduction in bleeding and a correction of coagulation that was similar to that observed with Factor VII I replacement. Liu et al. (Liu et al., "improved coagulation in bleeding disorders by Non-Anticoagulant Sulfated Polysaccharides (NASP)", Thromb.
- NBP Non-Anticoagulant Sulfated Polysaccharides
- TFPI inhibition had a positive effect on restoration of a normal coagulation profile and, in the dog model, an improvement in hemostatic profile, including an improved thromboelastogram (TEG) and a reduction in nail bleeding time.
- TAG thromboelastogram
- the invention provides aptamers that bind to tissue factor pathway inhibitor (TFPI), referred to herein as "TFPI aptamers", and methods for using such aptamers in the treatment of bleeding disorders and other TFPI-mediated pathologies, diseases or disorders, with or without other agents.
- TFPI aptamers may be used before, during and/or after medical procedures, with or without other agents, in order to reduce the complications or side effects thereof.
- the TFPI aptamers bind to or otherwise interact with TFPI or one or more portions (or regions) thereof.
- the TFPI aptarners may bind to or otherwise interact with a linear portion or a conformational portion of TFPI.
- TFPI aptamer binds to or otherwise interacts with a linear portion of TFPI when the aptamer binds to or otherwise interacts with a contiguous stretch of amino acid residues that are linked by peptide bonds.
- a TFPI aptamer binds to or otherwise interacts with a conformational portion of TFPI when the aptamer binds to or otherwise interacts with non-contiguous amino acid residues that are brought together by folding or other aspects of the secondary and/or tertiary structure of the polypeptide chain.
- the TFPI is human TFPI.
- the TFPI aptamers bind to TFPI and require binding contacts, at least in part, outside of the Kl and K2 regions, such as the K3/C-terminal region. More preferably, the TFPI aptamers bind at least in part to one or more portions of mature TFPI (for example.
- Figure 3 A that are selected from the group consisting of: amino acids 148-170, amino acids 150-170, amino acids 155-175, amino acids 160-180, amino acids 165-185, amino acids 170-190, amino acids 175-195, amino acids 180-200, amino acids 185- 205, amino acids 190-210, amino acids 195-215, amino acids 200-220, amino acids 205-225, amino acids 210-230, amino acids 215-235, amino acids 220-240, amino acids 225-245, amino acids 230-250, amino acids 235-255, amino acids 240-260, amino acids 245-265, amino acids 250-270, amino acids 255-275, amino acids 260-276, amino acids 148-175, amino acids 150- 175, amino acids 150-180, amino acids 150-185, amino acids 150-190, amino acids 150-195, amino acids 150-200, amino acids 150-205, amino acids 150-210, amino acids 150-215, amino acids 150-220, amino acids 150-225, amino acids 150-230, amino acids 150-235, amino acids 150
- TFPI aptamers include, but are not limited to, aptamers that comprise a nucleic acid sequence selected from the group consisting of SEQ ID NO; I, which is referred to herein as ARC26835; SEQ ID NO; 2, which is referred to herein as ARC17480; SEQ ID NO: 3, which is referred to herein as ARC 19498; SEQ ID NO: 4, which is referred to herein as
- ARC 19499 SEQ ID NO: 5, which is referred to herein as ARC 19500
- SEQ ID NO: 6, which is referred to herein as ARC 19501 SEQ ID NO; 7, which is referred to herein as ARC31301
- SEQ ID NO: 10 which is referred to herein as ARC19882.
- the TFPI aptamer is an aptamer or a salt thereof comprising the following nucleic acid sequence: m(j-rnG-rnA-mA-mlJ-mA-mlJ-nLA-dC-rnU-rnU-mCj-m( ⁇ -dC-mij-dC- rnG-mU-mlJ-mA-m(j-m(j ⁇ mU-rnG-d( mCj-mlJ-mA-mlJ ⁇ mA-rnU-rnA (SEQ) ID NO: 1) (ARC26835), wherein "dN” is a deoxynucleotide and "mN" is a 2 -0 Methyl containing nucleotide (which is also known in the art as a 2'-OMe, 2'-methoxy or 2'-OCH 3 containing nucleotide).
- the TFPI is an aptamer or a salt
- the TFPI aptamer is an aptamer or a salt thereof comprising the following nucleic acid sequence: mG-mG-mA-mA-mL -mA-mL T -mA-dC-mU-mIJ-mG-mG-dC- mU-dC-mG-mU-mU-mA-mG-mG-mU-mG-dC-mG-mU-iiiA-mU-mA-mU-niA.-3T (SEQ ID NO: 2) (ARC 17480), wherein "3T” is an inverted deoxythymidine, "dN” is a deoxynucleotide and "inN” is a 2'-0 Methyl containing nucleotide.
- the TFPI aptamer is an aptamer or a salt thereof that consists of the nucleic acid sequence of SEQ ID NO; 2.
- the TFPI aptamer is an aptamer or a salt thereof comprising the following nucleic acid sequence: NH 2 -mG-mG-niA-mA-mU-inA-mU-mA-dC-mU-mU-mG- mG-dC-mU-dC-mG-mU-mU-mA-mG-mG-mU ⁇
- the TFPI aptamer is an aptamer or a salt thereof that consists of the nucleic acid sequence of SEQ ID NO; 3. [0028] Most preferably, the TFPI aptamer is an aptamer or a salt thereof comprising the following nucleic acid sequence: PEG4QK-NH-mG-mG-mA-mA-mU ⁇
- the TFPI aptamer is an aptamer or a salt thereof that consists of the nucleic acid sequence of SEQ ID NO: 4.
- the PEG40K moiety of SEQ ID NO; 4 is a branched PEG moiety having a total molecular weight of 40 kDa.
- the PEG40K moiety of SEQ ID NO; 4 is a linear PEG moiety having a molecular weight of 40 kDa. In further embodiments, the PEG40K moiety of SEQ ID NO; 4 is a methoxypolyethylene glycol (rnPEG) moiety having a molecular weight of 40 kDa.
- rnPEG methoxypolyethylene glycol
- the PEG40 moiety of SEQ ID NO: 4 is a branched rnPEG moiety that contains two rnPEG20K moieties, each having a molecular weight of 20 kDa, as shown in Figures 6-9, where "20 PEG” refers to a rnPEG moiety having a molecular weight of 20 kDa.
- the PEG40 moiety of SEQ ID NO: 4 is the branched PEG40K moiety shown in Figure 6, where "20KPEG” refers to a rnPEG rnoiety having a molecular weight of 20 kDa, and is connected to the aptamer as shown in Figure 7.
- the PEG40 moiety is connected to the aptamer using a 5 '-amine linker phosphoramidite, as shown in Figure 8, where "20 PEG” refers to a mPEG moiety having a molecular weight of 20 kDa.
- the PEG40 moiety is a mPEG moiety having a total molecular weight of 40 kDa and is connected to the aptamer using a S'- hexylamine linker phosphoramidite, as shown in Figure 9 A and 9B.
- the TFPI aptamer is an aptamer or a salt thereof comprising the following nucleic acid sequence; NH 2 -mG-mG-mA-mA-mU-mA-mU-mA-dC-mU-mU-mG-mG- dC-mU-dC-mG-mU-mU-rnA-mG-mG-mU-mG-dC-mG-mU-rnA-mU-mA-mU-niA-NH 2 (SEQ ID NO: 5) (ARC19500), wherein "dN" is a deoxynucleotide, "mN” is a 2'-Q Methyl containing nucleotide and "NH?.” is from a hexylamine linker phosphoramidite.
- the TFPI aptamer is an aptamer or a salt thereof that consists of the nucleic acid sequence of S
- aptamer or a salt thereof comprising the following nucleic acid sequence: PEG20K-NH-mG-mG-mA-niA-mU-mA-mU- iriA-dC-mU-mU-mG-mG-dC-mU-dC-mG-mU-mU-mA-mG
- the TFPI aptamer is an aptamer or a salt thereof that consists of the nucleic acid sequence of SEQ ID NO: 6,
- the PEG20K moieties of SEQ ID NO: 6 are branched PEG moieties.
- the PEG20K moieties of SEQ ID NO: 6 are linear PEG moieties.
- the PEG20K moieties of SEQ ID NO; 6 are methoxypolyethylene glycol (mPEG) moieties having a molecular weight of 20 kDa.
- the PEG20K moieties of SEQ ID NO: 6 are branched mPEG moieties that contain two mPEGlOK moieties each having a molecular weight of 10 kDa.
- the TFP i aptamer is an aptamer or a salt thereof comprising the following nucleic acid sequence: mG-mG-mA-mA-mU-mA-mU-mA-dC ⁇
- the TFP I aptamer is an aptamer or a salt thereof that consists of the nucleic acid sequence of SEQ ID NO: 7.
- TFPI aptamer Preferable to the TFPI aptamer of paragraph [0031] is an aptamer or a salt thereof comprising the following nucleic acid sequence: mG-mG-niA-nii ⁇ -mU-mA-mlJ-mA-dC-mU- mU-mG-mG-mC-mlJ-dC-mG-mU-mU-niA-mG-mG-mlJ-mG-mC-mG-mU-mA-mL -niA-mL 1 - mA-3T (SEQ ID NO: 8) (ARC 18546), wherein "3T” is an inverted deoxythymidine, "dN” is a deoxynucleotide and "mN” is a 2'-0 Methyl containing nucleotide.
- the TFPI aptamer is an aptamer or a salt thereof that consists of the nu
- aptamer or a salt thereof comprising the following nucleic acid sequence: NH 2 -mG-mG-mA-mA-niU-mA-mU- mA-dC-mU-mU-mG-mG-mC-mU-dC-mG-mG-mG-mG-mC-mU-dC-mG-m
- TFPI aptamer is an aptamer or a salt thereof that consists of the nucleic acid sequence of SEQ ID NO: 9.
- TFPI aptamer of paragraph [0031] is an aptamer or a salt thereof comprising the following nucleic acid sequence; PEG40K-NH-mG-mG-mA-iTiA-mU- mA-mU-rnA-dC-mU-mU-mG-mG-mC-mU-dC-mG-mU-mU-mA-m
- the TFPI aptamer is an aptamer or a salt thereof that consists of the nucleic acid sequence of SEQ ID NO: 10.
- the PEG40K moiety of SEQ ID NO; 10 is a branched PEG moiety having a total molecular weight of 40 kDa, In other embodiments, the PEG40K moiety of SEQ ID NO: 10 is a linear PEG moiety having a molecular weight of 40 kDa, In further embodiments, the PEG40K moiety of SEQ ID NO: 10 is a methoxypolyethylene glycol (mPEG) moiety having a molecular weight of 40 kDa.
- mPEG methoxypolyethylene glycol
- the PEG40K moiety of SEQ ID NO; 10 is a branched mPEG moiety that contains two mPEG20 moieties, each having a molecular weight of 20 kDa, as shown in Figures 6-9, where "20KPEG” refers to a mPEG moiety having a molecular weight of 20 kDa.
- the PEG40K moiety of SEQ ID NO: 10 is the branched PEG40K moiety shown in Figure 6, where "20KPEG” refers to a rnPEG moiety having a molecular weight of 20 kDa, and is connected to the aptamer as shown in Figure 7.
- the PEG40 moiety is connected to the aptamer using a 5'-amine linker phosphoramidite, as shown in Figure 8, where "20KPEG” refers to a mPEG moiety having a molecular weight of 20 kDa.
- the PEG40 moiety is a mPEG moiety having a total molecular weight of 40 kDa and is connected to the aptamer using a 5'- hexylamine linker phosphoramidite, as shown in Figure 9 A and 9B.
- the TFPI aptamers are connected to one or more PEG moieties, with or without one or more linkers.
- the PEG moieties may be any type of PEG moiety.
- the PEG moiety may be linear, branched, multiple branched, star shaped, comb shaped or a dendrimer.
- the PEG moiety may have n ⁇ ' molecular weight.
- the PEG moiety has a molecular weight ranging from 5-100 kDa in size. More preferably, the PEG moiety has a molecular weight ranging from 10-80 kDa in size.
- the PEG moiety has a molecular weight ranging from 20-60 kDa in size. Yet even more preferably, the PEG moiety has a molecular weight ranging from 30-50 kDa in size. Most preferably, the PEG moiety has a molecular weight of 40 kDa in size, also referred to herein as "40KPEG".
- the same or different PEG moieties may be connected to a TFPI aptamer.
- the same or different linkers or no linkers may be used to connect the same or different PEG moieties to a TFPI aptamer.
- the TFPI aptamers may be connected to one or more PEG alternatives (rather than to one or more PEG moieties), with or without one or more linkers.
- PEG alternatives include, but are not limited to, polyoxazoline (POZ), PolyPEG,
- the PEG alternative may be any type of PEG alternative, but, it should function the same as or similar to a PEG moiety, i.e., to reduce renal filtration and increase the half-life of the TFPI aptamer in the circulation.
- the same or different PEG alternatives may be connected to a TFPI aptamer.
- the same or different linkers or no linkers may be used to connect the same or different PEG alternatives to a TFPI aptamer.
- a combination of PEG moieties and PEG alternati ves may be connected to a TFPI aptamer, with or without one or more of the same or different linkers.
- the TFPI aptamers are connected to a PEG moiety or a PEG alternative via one or more linkers.
- the TFPI aptamers may be connected to a PEG moiety or PEG alternati ve directly, without the use of a linker.
- the linker may be any type of molecule. Examples of linkers include, but are not limited to, amines, thiols and azides.
- the linkers can include a phosphate group.
- the linker is from a 5 '-amine linker phosphoramidite.
- the 5 '-amine linker phosphoramidite comprises 2-18 consecutive CH 2 groups.
- the 5 '-amine linker phosphoramidite comprises 2-12 consecutive CH 2 groups.
- the 5'- amine linker phosphoramidite comprises 4-8 consecutive Q1 ⁇ 4 groups.
- the 5'- amine linker phosphoramidite comprises 6 consecutive CH 2 groups, i.e., is a 5'-hexylamine linker phosphoramidite.
- One or more of the same or different linkers or no linkers may be used to connect one or more of the same or different PEG moieties or one or more of the same or different PEG alternatives to a TFPI aptamer.
- an aptamer, or a salt thereof, comprising the following structure is provided:
- HN ⁇ "" ⁇ " P0 3 H is from a 5 '-amine linker phosphoramidite
- the aptamer is a TFPI aptamer of the invention.
- the aptamer is selected from the group consisting of SEQ ID NQs: 2 and 8.
- the 20KPEG moiety can be any PEG moiety having a molecular weight of 20 kDa.
- the 2QKPEG moiety is a mPEG moiety having a molecular weight of 20 kDa.
- an aptamer, or a salt thereof, comprising the following structure is provided:
- HN mo " nn " P0 2 fl is from a 5 '-amine linker phosphoramidite, and the aptamer is a
- the aptamer is selected from the group consisting of
- the 20KPEG moiety can be any PEG moiety having a molecular weight of 20 kDa.
- the 20KPEG moiety is a mPEG moiety having a molecular weight of 20 kDa
- an aptamer, or a salt thereof, comprising the following structure is provided:
- the aptamer is a TFPI aptamer of the invention.
- the aptamer is selected from the group consisting of SEQ ID NO: 1
- the 20KPEG moiety can be any PEG moiety having a molecular weight of 20 kDa.
- the 20 PEG moiety is a mPEG moiety having a molecular weight of 20 kDa
- an aptamer, or a salt thereof, comprising the following structure is provided:
- the aptamer is a TFPI aptarner of the invention.
- the aptamer is selected from the group consisting of SEQ ID NO: I .
- the 20KPEG moiety can be any PEG moiety having a molecular weight of 20 kDa.
- the 20KPEG moiety is a mPEG moiety having a molecular weight of 20 kDa
- an aptamer, or a salt thereof, comprising the following structure is provided: , wherein
- "n” ranges from 400-500 ethylene oxide units. More preferably, “n” ranges from 425-475 ethylene oxide units. Even more preferably, “n” ranges from 440-460 ethylene oxide units. Most preferably, "n” is 454 ethylene oxide units.
- the aptamer is selected from the group consisting of SEQ ID N Os: 2 and
- an aptamer, or a salt thereof, comprising the following structure is provided:
- "n” ranges from 400- 500 ethylene oxide units. More preferably, “n” ranges from 425-475 ethylene oxide units. Even more preferably, “n” ranges from 440-460 ethylene oxide units. Most preferably, "n” is 454 ethylene oxide units.
- the aptamer is selected from the group consisting of SEQ ID NO: 1 .
- the invention also provides aptamers that have substantially the same ability to bind to TFPI as any one of the aptamers shown in SEQ) ID NOs: 1 , 2, 3, 4, 5, 6, 7, 8, 9 or 10.
- the aptamers have substantially the same structure as any one of the aptamers shown in SEQ ID NOs: 1, 2, 3, 4, 5, 6, 7, 8, 9 or 10.
- the aptamers have substantially the same ability to bind to TFPI and substantially the same structure as any one of the aptamers shown in SEQ ID NOs: 1 , 2, 3, 4, 5, 6, 7, 8, 9 or 10.
- the invention also provides aptamers that have substantially the same ability to bind to TFPI and substantially the same ability to modulate a biological function of TFPI as any one of the aptamers shown in SEQ ID NOs; I , 2, 3, 4, 5, 6, 7, 8, 9 or 10.
- the invention further provides aptamers that have
- the invention also provides aptamers that have substantially the same structure and substantially the same ability to modulate a biological function of TFPI as any one of the aptamers shown in SEQ ID NOs; 1 , 2, 3, 4, 5, 6, 7, 8, 9 or 10.
- the invention also provides aptamers that have substantially the same structure and substantially the same ability to modulate blood coagulation as any one of the aptamers shown in SEQ ID NOs: 1 , 2, 3, 4, 5, 6, 7, 8, 9 or 10.
- the aptamers have substantially the same ability to bind to TFPI, substantially the same structure and substantially the same ability to modulate a biological function of TFPI as any one of the aptamers shown in SEQ) ID NOs: 1 , 2, 3, 4, 5, 6, 7, 8, 9 or 10.
- the aptamers have substantially the same ability to bind to TFPI, substantially the same structure and substantially the same abilit to modulate blood coagulation as any one of the aptamers shown in SEQ I D NOs: 1 , 2, 3, 4, 5, 6, 7, 8, 9 or 10.
- the TFPI aptamers may comprise at least one chemical modification.
- the modification is selected from the group consisting of: a chemical substitution at a sugar position, a chemical substitution at an internucleotide linkage and a chemical substitution at a base position.
- the modification is selected from the group consisting of: incorporation of a modified nucleotide; a 3 ' cap; a 5' cap; conjugation to a high molecular weight, noii- immimogenic compound; conj gation to a lipophilic compound; incorporation of a CpG motif; and incorporation of a phosphorothioate or phosphorodithioate into the phosphate backbone.
- the high molecular weight, non-immunogenic compound is preferably polyethylene glycol.
- the polyethylene glycol is methoxypolyethylene glycol (mPEG).
- the 3 ' cap is preferably an inverted deoxythymidine cap.
- the invention also provides aptamers that bind to TFPI and have one or more of the following characteristics: (i) includes the primary nucleotide sequence of niG-niG-mA-mA-mU- mA-inU-inA ⁇ dC ⁇ mU-mU-niG-mG-dC-inU-dC ⁇ mG ⁇ mU-mU-mA-mG-inG-inU ⁇ mG ⁇ dC-niG-niU- mA-mU-mA-mU-mA-mU-rnA (SEQ ID NO: 1); (ii) includes a primary nucleotide sequence that has at least 70%, 75%, 80%, 85%, 90%, 91%, 92%, 93%, 94%, 95%, 96%, 97%, 98% or 99% sequence identity to the primary nucleotide sequence shown in SEQ ID NO: 1 or 7: (iii) has substantial! ⁇ ' the same or better ability to bind to
- primary nucleotide sequence refers to the 5' to 3 ' linear sequence of nucleotide bases of the nucleic acid sequence that forms an aptamer, without regard to 3 ' or 5' modifications.
- ARC26835, ARC 17480, ARC 19498, ARCI9499, ARC! 9500 and ARC19501 all have the same primary nucleotide sequence.
- the invention additionally provides pharmaceutical compositions comprising a therapeutically effective amount of a TFPI aptamer or a salt thereof, and a pharmaceutically acceptable carrier or diluent.
- the invention further provides a method for treating, preventing, delaying the progression of, or ameliorating a pathology, disease or disorder mediated by TFPI by
- the pathology, disease or disorder is selected from the group consisting of: coagulation factor deficiencies, congenital or acquired, mild or moderate or severe, including hemophilia A (Factor VIII deficiency), hemophilia B (Factor IX deficiency) and hemophilia C (Factor XI deficiency); hemophilia A or B with inhibitors; other factor deficiencies (V, VII, X, XIII, prothrombin, fibrinogen); deficiency of o2-plasmin inhibitor; deficiency of plasminogen activator inhibitor 1 ; multiple factor deficiency; functional factor abnormalities (e.g.
- dysprothrombinemia joint hemorrhage (hemarthrosis), including, but not limited to, ankle, elbow and knee; spontaneous bleeding in other locations (muscle, gastrointestinal, mouth, etc.); hemorrhagic stroke; intracranial hemorrhage; lacerations and other hemorrhage associated with trauma; acute traumatic coagulopathy; coagulopathy associated with cancer (e.g. , acute promyelocytic leukemia); von Willebrand's Disease; disseminated intravascular coagulation; liver disease; menorrhagia; thrombocytopenia and hemorrhage associated with the use of anticoagulants (e.g., vitamin K antagonists, FXa antagonists, etc.).
- anticoagulants e.g., vitamin K antagonists, FXa antagonists, etc.
- compositions may be administered by numerous routes of administration.
- the compositions are administered intravenously (TV).
- the compositions are administered subc taneously (SC or SQ).
- compositions may be administered using various treatment regimens.
- the compositions may be administered as a maintenance therapy at, a defined dose for a defined period of time, such as when a patient is not suffering from a bleeding episode.
- the compositions may be administered on demand, i.e. , as needed, such as when a patient is suffering from a bleeding episode.
- the compositions may be administered as a combination of maintenance therapy and on demand therapy.
- the compositions may be administered as a maintenance therapy at a defined dose for a defined period of time until a bleed occurs, in which case the dosage of the compositions would be increased on an as needed basis until the bleeding stopped, at which point the dosage of the compositions would be decreased back to the prior maintenance level.
- the compositions may be administered as a maintenance therapy at a defined dose for a defined period of time until a bleed occurs, in which case another bleeding disorder therapy would be administered to the patient (such as Factor VIII) until the bleeding stopped, at which point the other bleeding disorder therapy would be discontinued. During this entire time, the compositions would continue to be administered as a maintenance therapy.
- the compositions may be administered as a maintenance therapy at a defined dose for a defined period of time until a bleed occurs, in which case the dosage of the compositions would be decreased and another bleeding disorder therapy would be administered to the patient (such as Factor VIII) until the bleeding stopped, at which point the dosage of the compositions would be increased back to the prior maintenance level and the other bleeding disorder therapy would be discontinued.
- another bleeding disorder therapy such as Factor VIII
- another bleeding disorder therapy (such as Factor VIII) may be administered as a maintenance therapy at a defined dose for a defined period of time until a bleed occurs, in which case the dosage of the other bleeding disorder therapy would be decreased and the compositions would be administered to the patient until the bleeding stopped, at which point the dosage of the other bleeding disorder therapy would be increased back to the prior maintenance level and therapy with the compositions would be discontinued.
- the pharmaceutical compositions may also be administered prior to, during and/or after a medical procedure.
- the pharmaceutical compositions may be administered in conjunction (before, during and/or after) with medical procedures, such as: prophylaxis and/or treatment, associated with bleeding caused by dental procedures, orthopedic surgery including but, not limited to arthroplasty (e.g. , hip replacement), surgical or radionuclide synovectomy (RSV), major surgery, venipuncture, transfusion and amputation.
- medical procedures such as: prophylaxis and/or treatment, associated with bleeding caused by dental procedures, orthopedic surgery including but, not limited to arthroplasty (e.g. , hip replacement), surgical or radionuclide synovectomy (RSV), major surgery, venipuncture, transfusion and amputation.
- arthroplasty e.g. , hip replacement
- RSV radionuclide synovectomy
- the pharmaceutical compositions may also be administered in combination with another drug, such as: activated prothrombin complex concentrates (APCC), Factor Eight Inhibitor Bypass Agent (FEIBA ® ), recombinant Factor Vila (e.g., NovoSeven*), recombinant Factor VIII (Advate ⁇ , KLogenate 4 , Recombinate* ' , Helixate 4 ', eFacto*), plasma-derived Factor Vm (Hurnate P*, Hemofil M 4 '), recombinant Factor IX (BeneFIX ® ), plasma-derived Factor IX (Bebulin VII*, Konyne 4 ', Mononine 4 '), cryoprecipitate, desmopressin acetate (DDAVP), epsilon- aminocaproic acid or tranexamic acid.
- APCC activated prothrombin complex concentrates
- FEIBA ® Factor Eight Inhibitor Bypass Agent
- compositions may be administered in combination with another therapy, such as: blood or blood-product transfusion, plasmapheresis, immune tolerance induction therapy with high doses of replacement factor, immune tolerance therapy with immunosuppressive agents (e.g. , prednisone, rituximab) or pain therapy.
- another therapy such as: blood or blood-product transfusion, plasmapheresis, immune tolerance induction therapy with high doses of replacement factor, immune tolerance therapy with immunosuppressive agents (e.g. , prednisone, rituximab) or pain therapy.
- another therapy such as: blood or blood-product transfusion, plasmapheresis, immune tolerance induction therapy with high doses of replacement factor, immune tolerance therapy with immunosuppressive agents (e.g. , prednisone, rituximab) or pain therapy.
- immunosuppressive agents e.g. , prednisone, rituximab
- the TFPI aptamers may be used for identification of the TFPI protein. Specifically, the TFPI aptamers may be used to identify, quantify or otherwise detect the presence of the TFPI protein in a sample, such as a biological sample or other subject-derived sample. For example, the TFPI aptamers may be used in in vitro assays, e.g., ELISA, to detect TFPI levels in a patient sample.
- a sample such as a biological sample or other subject-derived sample.
- the TFPI aptamers may be used in in vitro assays, e.g., ELISA, to detect TFPI levels in a patient sample.
- the invention also provides a method for regulating TFPI in which a molecule binds or otherwise interacts with one or more portions of TFPI, wherein at least one portion is outside of the Kl and K2 domains of TFPI, such as the K3/C terminal region.
- the molecule can be any type of molecule, such as, for example, a small molecule organic compound, an antibody, a protein or peptide, a polysaccharide, a nucleic acid, an siRNA, an aptamer, or any combination thereof.
- the molecule is a small molecule organic compound. More preferably, the molecule is an antibody. Most preferably, the molecule is an aptamer.
- the molecule may bind to or otherwise interact, with a linear portion or a conformational portion of TFPI.
- a molecule binds to or otherwise interacts with a linear portion of TFPI when the molecule binds to or otherwise interacts with a contiguous stretch of amino acid residues that are linked by peptide bonds.
- a molecule binds to or otherwise interacts with a conformational portion of TFPI when the molecule binds to or otherwise interacts with non-contiguous amino acid residues that are brought together by fol ding or other aspects of the secondary and/or tertiary structure of the polypeptide chain.
- the molecule binds at, least in part to one or more portions of mature TFPI (for example, Figure 3 A) that are selected from the group consisting of: amino acids 148-170, amino acids 150-170, amino acids 155-175, amino acids 160-180, amino acids 365-185, amino acids 170-190, amino acids 375-195, amino acids 380- 200, amino acids 185-205, amino acids 190-210, amino acids 195-215, amino acids 200-220, amino acids 205-225, amino acids 210-230, amino acids 215-235, amino acids 220-240, amino acids 225-245, amino acids 230-250, amino acids 235-255, amino acids 240-260, amino acids 245-265, amino acids 250-270, amino acids 255-275, amino acids 260-276, amino acids 348- 175, amino acids 150-175, amino acids 150-180, amino acids 150-185, amino acids 150-190, amino acids 150-195, amino acids 150-200, amino acids 150-205, amino acids 150-210, amino acids 150-21
- the molecule preferably comprises a dissociation constant for human TFPI, or a variant thereof, of less than 100 ⁇ , less than 1 ⁇ , less than 500 nM, less than 100 nM, preferably 50 nM or less, preferably 25 nM or less, preferably 10 nM or less, preferably 5 nM or less, more preferably 3 nM or less, even more preferably 1 nM or less, and most preferably 500 pM or less.
- the invention further provides for the use of a TFPI aptamer in the manufacture of a medicament in the treatment, prevention, delaying progression, and/or amelioration of a bleeding disorder.
- ARC26835, ARC17480, ARC 19498, ARC 19499, ARC19500 for example, ARC26835, ARC17480, ARC 19498, ARC 19499, ARC19500,
- ARC19501, ARCS 1301, ARC18546, ARC19881 and ARC 19882 are used in the manufacture of a medicament for treating, preventing, delaying progression of or otherwise ameliorating a bleeding disorder.
- the invention provides a TFPI aptamer for use in a method of treatment, prevention, delaying progression and/or amelioration of a bleeding disorder.
- the invention provides for the use of a TFPI aptamer in the manufacture of a diagnostic composition or product for use in a method of diagnosis practiced on the human or animal body.
- the method of diagnosis is for the diagnosis of a bleeding disorder.
- the invention provides a TFPI aptamer for use in a method of diagnosis practiced on the human or animal body.
- the method of diagnosis is for the diagnosis of a bleeding disorder.
- the invention provides the use of a TFPI aptamer for diagnosis in vitro.
- the in vitro use is for the diagnosis of a bleeding disorder.
- the invention further relates to agents that reverse the effects of the TFPI aptamers, referred to herein as "TFPI reversal agents".
- TFPI reversal agents can be any type of molecule, such as a protein, antibody, small molecule organic compound or an oligonucleotide.
- a TFPI reversal agent is an oligonucleotide that is 10-15 nucleotides in length.
- a TFPI reversal agent binds to a TFPI aptamer.
- binding is via complementary base pairing.
- a TFPI reversal agent acts by hybridizing to a TFPI aptamer, thereby disrupting the TFPI aptamer 's structure and preventing the binding of the TFPI aptamer to TFPI.
- TFPI reversal agents include, but are not limited to; SEQ ID NO: 15, which is ARC23085; SEQ ID NO: 16, which is ARC23087; SEQ ID NO: 17, which is
- ARC23088 and SEQ ID NO: 18, which is ARC23089.
- the TFPI reversal agent is a nucleic acid comprising the structure set forth below: mA-mG-mC-mC-niA-mA-mG-mU-rnA-mU-mA-mU-mU-mC-m (SEQ ID NO: 15), wherein "mN" is a 2'-0 Methyl containing residue (which is also known in the art as a 2'-QMe, 2'- methoxy or ' ⁇ ( )( ' ! S : containing residue).
- the TFPI reversal agent is a nucleic acid comprising the structure set forth below;
- the TFPI reversal agent is a nucleic acid comprising the structure set forth below;
- the TFPI reversal agent is a nucleic acid comprising the structure set forth below:
- the invention further provides a method for treating, preventing, delaying the progression of and/or ameliorating a bleeding disorder, the method comprising the step of administering a TFPI reversal agent to a patient in need of such treatment.
- the invention provides for the use of a TFPI reversal agent in the manufacture of a medicament for the treatment, prevention, delaying progression and/or amelioration of a bleeding disorder.
- the invention provides for the use of a TFPI reversal agent in the manufacture of a medicament for the treatment, prevention, delaying progression and/or amelioration of a bleeding disorder in a patient wherein the method involves administering the TFPI reversal agent to the patient to control and/or modulate the therapeutic effect of a TFPI aptamer administered to the patient.
- the TFPI aptamer may be administered prior to the TFPI reversal agent, simultaneously with the TFPI reversal agent or after the TFPI reversal agent, and may be administered as part of a combination therapy.
- the TFPI aptamer is administered to the patient in order to treat, prevent, delay progression of and/or ameliorate a bleeding disorder in the patient.
- the invention also provides the vise of a TFPI reversal agent in the manufacture of a medicament for use in controlling and/or modulating the treatment of a bleeding disorder, wherein the bleeding disorder is being treated with a TFPI aptamer.
- the invention provides a TFPI reversal agent for use in the treatment, prevention, delaying progression and/or amelioration of a bleeding disorder.
- the invention provides a TFPI reversal agent for use in the treatment, prevention, delaying progression and/or amelioration of a bleeding disorder in a patient wherein the method involves administering the TFPI reversal agent to the patient to control and/or modulate the therapeutic effect of a TFPI aptamer administered to the patient.
- the invention also provides a TFPI reversal agent for use in the treatment, prevention, delaying progression and/or amelioration of a bleeding disorder, wherein the bleeding disorder is being treated with a TFPI aptamer.
- the invention provides for the use of a TFPI reversal agent in the manufacture of a diagnostic composition or product for use in a method of diagnosis practiced on the human or animal body.
- the method of diagnosis is for the diagnosis of a bleeding disorder.
- the invention provides a TFPI reversal agent for use in a method of diagnosis practiced on the human or animal body.
- the method of diagnosis is for the diagnosis of a bleeding disorder.
- the invention provides the use of a TFPI reversal agent for diagnosis in vitro.
- the in vitro use is for the diagnosis of a bleeding disorder.
- the invention also provides a kit comprising at least one container comprising a quantity of one or more TFPI aptaniers, along with instructions for using the one or more TFPI aptamers in the treatment, prevention, delaying progression and/or amelioration of a bleeding disorder.
- the kit includes ARC26835, ARC 17480, ARC19498, ARC19499, ARC 19500, ARC1950I , ARC31301, ARC18546, ARCI9881 or ARC 19882 and combinations thereof.
- the aptamers are formulated as a pharmaceutical composition.
- the kit may further comprise a TFPI reversal agent, along with instructions regarding administration of the reversal agent.
- the invention also provides a method for producing an aptamer that binds to TFPI, the method comprising the step of chemically synthesizing a nucleic acid having a nucleic acid sequence of an aptamer that binds to TFPI as described herein.
- the method may further comprise the step of formulating a pharmaceutical composition by mixing the synthesized nucleic acid sequence, or a salt thereof, with a pharmaceutically acceptable carrier or diluent.
- the invention additionally provides a method for producing a reversal agent, the method comprising the step of chemically synthesizing a nucleic acid having a nucleic acid sequence of a TFPI reversal agent as described herein.
- the method may further comprise the step of formulating a pharmaceutical composition by mixing the synthesized nucleic acid sequence or a salt, thereof, with a pharmaceutically acceptable carrier or diluent.
- the invention further provides aptamers that have been identified by the SELEXTM process, which comprises the steps of (a) contacting a mixture of nucleic acids with TFPI under conditions in which binding occurs; (b) partitioning unbound nucleic acids from those nucleic acids that have bound to TFPI; (c) amplifying the bound nucleic acids to yield a ligand-enriched mixture of nucleic acids; and, optionally, (d) reiterating the steps of binding, partitioning and amplifying through as many cycles as desired to obtain aptamer(s) that bind to TFPI.
- the invention further provides methods for identifying aptamers that bind at least in part to or othenvise interact with one or more portions of TFPI, which comprise the steps of (a) contacting a mixture of nucleic acids with one or more portions of TFPI under conditions in which binding occurs: (b) partitioning unbound nucleic acids from those nucleic acids that have bound to TFPI; (c) amplifying the bound nucleic acids to yield a ligand-enriched mixture of nucleic acids; and, optionally, (d) reiterating the steps of contacting, partitioning and amplifying through as many cycles as desired, to obtain aptamer(s) that bind to a portion of TFPI.
- This method may also include intervening or additional cycles with binding to full-length TFPI, followed by partitioning and amplification.
- the TFPI aptamers may bind to or othenvise interact with a linear portion or a conformational portion of TFPI.
- a TFPI aptamer binds to or othenvise interacts with a linear portion of TFPI when the aptamer binds to or otherwise interacts with a contiguous stretch of amino acid residues that are linked by peptide bonds.
- a TFPI aptamer binds to or othenvise interacts with a conformational portion of TFPI when the aptamer binds to or othenvise interacts with non-contiguous amino acid residues that are brought together by folding or other aspects of the secondary and/or tertiary structure of the polypeptide chain.
- the one or more portions of mature TFPI are selected from the group consisting of: amino acids 148-170, amino acids 150-170, amino acids 155-175, amino acids 160-180, amino acids 165-185, amino acids 170-190, amino acids 175-195, amino acids 180-200, amino acids 185-205, amino acids 190-210, amino acids 195- 215, amino acids 200-220, amino acids 205-225, amino acids 210-230, amino acids 215-235, amino acids 220-240, amino acids 225-245, amino acids 230-250, amino acids 235-255, amino acids 240-260, amino acids 245-265, amino acids 250-270, amino acids 255-275, amino acids 260-276, amino acids 148-175, amino acids 150-175, amino acids 150-180, amino acids 150- 185, amino acids 150-190, amino acids 150-195, amino acids 150-200, amino acids 150-205, amino acids 150-210, amino acids 150-215, amino acids 150-220, amino acids 150-225
- the aptamer preferably comprises a dissociation constant for human TFPI or a variant or one or more portions thereof, of less than 100 ⁇ , less than 3 ⁇ , less than 500 nM, less than 100 nM, preferably 50 nM or less, preferably 25 nM or less, preferably 10 nM or less, preferably 5 nM or less, more preferably 3 nM or less, even more preferably 1 nM or less, and most preferably 500 pM or less.
- the invention also provides methods for identifying aptamers that bind at least in part to or otherwise interact with one or more portions of TFPI, which comprise the steps of (a) contacting a mixture of nucleic acids with full-length TFPI or one or more portions of TFPI under conditions in which binding occurs: (b) partitioning unbound nucleic acids from those nucleic acids that have bound to full-length TFPI or one or more portions of TFPI; (c) specifically eluting the bound nucleic acids with a portion of TFPI, or a ligand that binds to full- length TFPI or a portion of TFPI; (d) amplifying the bound nucleic acids to yield a ligand- enriched mixture of nucleic acids; and, optionally, (e) reiterating the steps of contacting, partitioning, eluting and amplifying through as many cycles as desired to obtain aptamer(s) that bind to one or more portions of TFPI.
- the TFPI aptamers may bind to or otlienvise interact with a linear portion or a conformational portion of TFPI
- a TFPI aptamer binds to or otherwise interacts with a linear portion of TFPI when the aptamer binds to or otherwise interacts with a contiguous stretch of amino acid residues that are linked by peptide bonds.
- a TFPI aptamer binds to or otherwise interacts with a conformational portion of TFPI when the aptamer binds to or otherwise interacts with non-contiguous amino acid residues that are brought together by folding or other aspects of the secondary and/or tertiary structure of the polypeptide chain.
- the one or more portions of mature TFPI are selected from the group consisting of: amino acids 148-170, amino acids 150-170, amino acids 155-175, amino acids 160- 180, amino acids 165-185, amino acids 170-190, amino acids 175-195, amino acids 180-200, amino acids 185-205, amino acids 190-210, amino acids 195-215, amino acids 200- 220, amino acids 205-225, amino acids 210-230, amino acids 215-235, amino acids 220-240, amino acids 225-245, amino acids 230-250, amino acids 235-255, amino acids 240-260, amino acids 245-265, amino acids 250-270, amino acids 255-275, amino acids 260-276, amino acids 348-175, amino acids 350-175, amino acids 150-380, amino acids 350-185, amino acids 350- 190, amino acids 150-195, amino acids 150-200, amino acids 150-205, amino acids 150-210, amino acids 150-215, amino acids 150-220, amino acids 150-225
- the aptamer preferably comprises a dissociation constant for human TFPI or a variant or one or more portions thereof of less than 100 ⁇ , less than 1 ⁇ , less than 500 nM, less than 100 nM, preferably 50 nM or less, preferably 25 nM or less, preferably 10 nM or less, preferably 5 nM or less, more preferably 3 nM or less, even more preferably 1 nM or less, and most preferably 500 pM or less.
- the invention further provides methods for identifying aptamers that bind at least in part to or otherwise interact with one or more portions of TFPI, which comprise the steps of (a) contacting a mixture of nucleic acids with full-length TFPI or one or more portions of TFPI under conditions in which binding occurs in the presence of a TFPI ligand (a ligand that binds to TFPI) that blocks one or more epitopes on TFPI from aptamer binding; (b) partitioning unbound nucleic acids from those nucleic acids that have bound to full-length TFPI or one or more portions of TFPI; (c) amplifying the bound nucleic acids to yield a iigand-enriched mixture of nucleic acids; and, optionally, (d) reiterating the steps of contacting, partitioning and amplifying through as many cycles as desired to obtain aptamer(s) that bind to one or more portions of TFPI.
- inclusion of a TFPI ligand that blocks one or more portions on TFPI from aptamer binding can occur during the contacting step, the partitioning step, or both.
- the TFPI aptamers ma ⁇ ' bind to or othenvise interact with a linear portion or a conformational portion of TFPI.
- a TFPI aptamer binds to or otherwise interacts with a linear portion of TFPI when the aptamer binds to or othenvise interacts with a contiguous stretch of amino acid residues that are linked by peptide bonds.
- a TFPI aptamer binds to or otherwise interacts with a conformational, portion of TFPI when the aptamer binds to or otherwise interacts with non-contiguous amino acid residues that are brought together by folding or other aspects of the secondary and/or tertiary structure of the polypeptide chain.
- the one or more portions of mature TFPI are selected from the group consisting of: amino acids 148-1 70, amino acids 150-170, amino acids 155-175, amino acids 160-180, amino acids 165-185, amino acids 170-190, amino acids 175-195, amino acids 1 80- 200, amino acids 185-205, amino acids 190-210, amino acids 195-215, amino acids 200-220, amino acids 205-225, amino acids 210-230, amino acids 215-235, amino acids 220-240, amino acids 225-245, amino acids 230-250, amino acids 235-255, amino acids 240-260, amino acids 245-265, amino acids 250-270, amino acids 255-275, amino acids 260-276, amino acids 148- 175, amino acids 150-175, amino acids 150-180, amino acids 150-185, amino acids 150-190, amino acids 150-195, amino acids 150-200, amino acids 150-205, amino acids 150-210, amino acids 150-215, amino acids 150-220, amino acids 150-225
- the aptamer preferably comprises a dissociation constant for human TFPI or a variant or one or more portions thereof of less than 100 ⁇ , less than 1 ⁇ , less than 500 nM, less than 100 iiM, preferably 50 nM or less, preferably 25 nM or less, preferably 10 nM or less, preferably 5 nM or less, more preferably 3 nM or less, even more preferably 1 nM or less, and most preferably 500 pM or less.
- the invention further provides methods for identifying aptamers that bind at least in part to or othenvise interact with one or more portions of TFPI, which comprise the steps of (a) contacting a mixture of nucleic acids with full-length TFPI or one or more portions of TFPI under conditions in which binding occurs: (b) partitioning unbound nucleic acids from those nucleic acids that have bound to full-length TFPI or one or more portions of TFPI; (c) partitioning bound nucleic acids that have a desired functional property from bound nucleic acids that do not have a desired functional property; (d) amplifying the bound nucleic acids that have a desired functional property to yield a ligand-enriched mixture of nucleic acids; and, optionally, (e) reiterating the steps of contacting, partitioning, partitioning and amplifying through as many cycles as desired to obtain aptamer(s) that bind to one or more portions of TFPI.
- Steps (b) and (c) can occur sequentially or simultaneously.
- the desired functional property is inhibition of TFPFs interaction with FXa, FVIIa, TFPI receptor or the glycocalyx.
- the TFPI aptamers may bind to or otherwise interact with a linear portion or a conformational portion of TFPI.
- a TFPI aptamer binds to or otherwise interacts with a linear portion of TFPI when the aptamer binds to or otherwise interacts with a contiguous stretch of amino acid residues that are linked by peptide bonds.
- a TFPI aptamer binds to or otherwise interacts with a conformational portion of TFPI when the aptamer binds to or otherwise interacts with noncontiguous amino acid residues that are brought together by folding or other aspects of the secondary and/or tertiary structure of the polypeptide chain.
- the one or more portions of mature TFPI are selected from the group consisting of: amino acids 148-170, amino acids 150-170, amino acids 155-175, amino acids 160-180, amino acids 165- 185, amino acids 170-190, amino acids 175-195, amino acids 180-200, amino acids 185-205, amino acids 190-210, amino acids 195-215, amino acids 200-220, amino acids 205-225, amino acids 210-230, amino acids 215-235, amino acids 220-240, amino acids 225-245, amino acids 230-250, amino acids 235-255, amino acids 240-260, amino acids 245-265, amino acids 250- 270, amino acids 255-275, amino acids 260-276, amino acids 148-175, amino acids 150-175, amino acids 150-180, amino acids 150-185, amino acids 150-190, amino acids 150-195, amino acids 150-200, amino acids 150-205, amino acids 150-210, amino acids 150-215, amino acids 150-220, amino acids 150-225
- the invention also provides an aptamer that, binds to a human tissue factor pathway inhibitor (TFPI) polypeptide having the amino acid sequence of SEQ ID NO; 11, wherein the aptamer modulates TFPI-mediated inhibition of blood coagulation, and wherein the aptamer competes for binding to TFPI with a reference aptamer comprising a nucleic acid sequence selected from the group consisting of: SEQ ID NO: 4 (ARC! 9499), SEQ ID NO: 1 (ARC26835), SEQ ID NO: 2 (ARC!
- TFPI human tissue factor pathway inhibitor
- the reference aptamer comprises the nucleic acid sequence of SEQ ID NO: 4 (ARC 19499).
- the in vention further provides an aptamer that binds to a human tissue factor path way inhibitor (TFPI) polypeptide having the amino acid sequence of SEQ ID NO: 11, wherein the aptamer binds to a linear portion or a conformational portion of TFP I in which at least a portion of the region recognized by the aptamer is different than the TFPI region bound by Factor Vila, Factor Xa, or both Factor Vila and Factor Xa.
- TFPI tissue factor path way inhibitor
- the aptamer binds to one or more regions comprising at least a portion of the amino acid sequence of SEQ ID NO: 11 selected from the group consisting of: amino acid residues 148-170, amino acid residues 150- 170, amino acid residues 155-175, amino acid residues 160-180, amino acid residues 165-185, amino acid residues 170-190, amino acid residues 175-195, amino acid residues 180-200, amino acid residues 185-205, amino acid residues 190-210, amino acid residues 195-215, amino acid residues 200-220, amino acid residues 205-225, amino acid residues 210-230, amino acid residues 215-235, amino acid residues 220-240, amino acid residues 225-245, amino acid residues 230-250, amino acid residues 235-255, amino acid residues 240-260, amino acid residues 245-265, amino acid residues 250-270, amino acid residues 255-275, amino acid residues 260-276, amino acid residues 148-175, amino
- the invention also provides an aptamer that binds to the same region on a human tissue factor pathway inhibitor (TFPI) polypeptide having the amino acid sequence of SEQ ID NO: 1 1 as the region bound by a TFPI aptamer comprising the nucleic acid sequence of SEQ ID NO: 4 (ARC! 9499).
- TFPI tissue factor pathway inhibitor
- the in vention farther provides an aptamer that binds to a region on a human tissue factor pathway inhibitor (TFPI) polypeptide comprising one or more portions of SEQ ID NO: 3 3 , wherein the one or more portions is selected from the group consisting of: amino acid residues 348-170, amino acid residues 150-170, amino acid residues 355-1 75, amino acid residues 160- 180, amino acid residues 165-185, amino acid residues 170-190, amino acid residues 175-195, amino acid residues 180-200, amino acid residues 185-205, amino acid residues 190-210, amino acid residues 195-215, amino acid residues 200-220, amino acid residues 205-225, amino acid residues 210-230, amino acid residues 215-235, amino acid residues 220-240, amino acid residues 225-245, amino acid residues 230-250, amino acid residues 235-255, amino acid residues 240-260, amino acid residues 245-265, amino acid residues 250-270,
- the invention additionally provides an aptamer that binds to human tissue factor pathway inhibitor (TFPI) and exhibits one or more of the following properties: a) competes for binding to TFPI with any one of SEQ ID NOs: 1 -10; b) inhibits TFPI inhibition of Factor Xa; c) increases thrombin generation in hemophilia plasma; d) inhibits TFPI inhibition of the intrinsic tenase complex; e) restores normal hemostasis, as measured by thromboelastography (TEG ® ) in whole blood and plasma; f) restores normal clotting, as indicated by shorter clot time, more rapid clot formation or more stable clot development, as measured by thromboelastography (TEG ® ) or rotational fhromboelastornetry (ROTEM) in whole blood and plasma; or g) decreases the clot time, as measured by dilute prothrombin time (dPT), tissue factor activated clotting time (dPT),
- the invention also provides an aptamer that binds to human tissue factor pathway inhibitor wherein the aptamer competes for binding to TFPI with a reference aptamer selected from the group consisting of: SEQ ID NO: 1 , SEQ ID NO: 2, SEQ ID NO: 3, SEQ ID NO: 4, SEQ ID NO: 5, SEQ ID NO: 6, SEQ ID NO: 7, SEQ ID NO: 8, SEQ ID NO: 9 and SEQ ID NO: 10.
- a reference aptamer selected from the group consisting of: SEQ ID NO: 1 , SEQ ID NO: 2, SEQ ID NO: 3, SEQ ID NO: 4, SEQ ID NO: 5, SEQ ID NO: 6, SEQ ID NO: 7, SEQ ID NO: 8, SEQ ID NO: 9 and SEQ ID NO: 10.
- the invention further provides an aptamer that binds to tissue factor pathway inhibitor (TFPI) wherein the aptamer competes, either directly or indirectly, for binding to TFPI with a reference antibody selected from the group consisting of: AD4903.
- TFPI tissue factor pathway inhibitor
- the invention also provides an aptamer that binds to human tissue factor pathway inhibitor (TFPI) and comprises a stem and loop motif having the nucleotide sequence of SEQ ID NO: 4, wherein: a) any one or more of nucleotides 1, 2, 3, 4, 6, 8, 11 , 12, 13, 17, 20, 21, 22, 24, 28, 30 and 32 may be modified from a 2'-OMe substitution to a 2'-deoxy substitution; b) any one or more of nucleotides 5, 7, 15, 19, 23, 27, 29 and 31 may be modified from a 2'-OMe uracil to either a 2'-deoxy uracil or a 2'-deoxy thymine; c) nucleotide 18 may be modified from a 2'-OMe uracil to a 2'-deoxy uracil; and/or d) any one or more of nucleotides 14, 16 and 25 may be modified from a 2'-deox.y cytosine to either a 2'-OMe
- the invention further provides a method for treating a bleeding disorder comprising administering any one of the above aptamers.
- the invention further provides an aptamer that binds to tissue factor pathway inhibitor (TFPI), wherein the aptamer comprises a primary nucleic acid sequence selected from the group consisting of SEQ ID NOs.: 4, 1 , 2, 3, 5, 6, 7, 8, 9 and 10.
- TFPI tissue factor pathway inhibitor
- Figure I is a schematic representation of the coagulation cascade.
- Figure 2 is an illustration of the forms of TFPI, which are associated with the vascular endothelium or in the plasma pool,
- Figure 3 is a schematic representation of the two forms of TFPI found on the endothelium, ( Figure 3 A.) TFPIa and ( Figure 3B) ⁇ .
- Figure 4 is a schematic representation of the in vitro aptamer selection (SELEXTM) process from pools of random sequence oligonucleotides.
- Figure 5 is an illustration of the amino acid sequence of the mature human TFPI protein.
- Figure 6 is an illustration of a 40 kDa branched PEG.
- Figure 7 is an illustration of a 40 kDa branched PEG that is attached to the 5' terminus of an amine aptamer.
- Figure 8 is an illustration of a 40 kDa branched PEG that is attached to the 5' terminus of an aptamer using a 5 '-amine linker phosphoramidite.
- Figure 9 A is an illustration of a 40 kDa branched PEG that is attached to the 5 ' terminus of an aptamer using a 5'-hexylamine linker phosphoramidite.
- Figure 9B is an alternative illustration of a 40 kDa branched PEG that is attached to the 5 ' terminus of an aptamer using a 5'-hexylamine linker phosphoramidite.
- Figure 10A is an illustration of a TFPI aptamer, which is comprised of 2'-0 Methyl (circles) and 2'-deoxy (squares) nucleotides and is modified at its 5 '-terminus with a 40 kDa PEG moiety and at its 3 '-terminus with an inverted deoxythymidine residue (3T, which is also known in the art as idT).
- 3T inverted deoxythymidine residue
- Figure 10B is an illustration of a TFPI aptamer, which is comprised of 2'-Q Methyl (circles) and 2'-deoxy (squares) nucleotides and is modified at its S'-terminus with a 40 kDa PEG moiety and linker, and at its 3 '-terminus with an inverted deoxythymidine residue (3T).
- Figure IOC is an illustration of the putative structure of ARC 19499, which is comprised of 2'-Q Methyl (circles) and 2'-deoxy (squares) nucleotides and is modified at its 5 '-terminus with a 40 kDa branched PEG moiety and a hexylamine phosphate-containing linker, and at its 3 '- termmus with an inverted deoxythymidine residue (3T).
- Figure i i is an illustration depicting various PEGylation strategies, such as standard moTio-PEGylation, multiple PEGylation and oligornerization via PEGylation.
- Figure I2A is a graph showing that ARC 17480 binds tightly to full-length TFPL The data are fit to both monophasic and triphasic models to determine a KD for binding.
- Figure 12B is a graph showing that iRNA shifts the affinity of ARC 17480 for TFPL The aptamer still binds tightly to TFPI in the presence of tRN A, indicating that the binding of ARC 17480 to TFPI is specific.
- Figure 13 depicts the results of binding-competition experiments with radiolabeled ARCl 7480, full-length TFPI and various unlabeled aptamers.
- Unlabeled ARC! 7480 and ARC19499 Figure 13 A
- ARCl 9498 Figure 13B
- ARCl 8546 Figure 1 3C
- ARC26835 Figure 13D
- ARC19500, ARCl 9501, ARC19881 and ARC19882 Figure 13E
- Figure 13E all compete for binding with radiolabeled ARC 17480.
- Figure 14 is a set of graphs showing binding experiments with A RC 17480 and various proteins, including coagulation factors, protease inhibitors and coagulation zymogens.
- Figure 14A is a graph of a binding experiment with ARC 17480 and various proteins.
- Figure 14B is a graph of a binding experiment with ARC 17480 and TFPI or various activated coagulation factors.
- Figure 14C is a graph of a binding experiment with ARC 17480 and TFPI or various protease inhibitors.
- Figure 14D is a graph of a binding experiment with ARC 17480 and TFPI or various coagulation zymogens.
- ARC 17480 showed significant binding to TFPI, but not to an ⁇ ' of the other proteins tested.
- Figure 15 is a graph showing data from a plate-based assay demonstrating binding of ARC 19499 to recombinant TFPI.
- Figure 16 is a graph showing data from a plate-based competition assay
- Figure I7A depicts the results of a binding assay with radiolabeled ARC17480, full- length TFPI and TFPI-His.
- Figure 17B depicts the results of a binding assay with radiolabeled ARC 17480, full-length TFPL truncated TFPI-K1K2, TFPI K3-C-tenninal domain protem, and the peptide that contains the C-terminal region of TFPI in the presence of neutravidin.
- Figure ISA depicts the results of a binding assay with radiolabeled ARC 17480 and full-length TFPI in the absence or presence of 0.1 mg/niL heparin.
- Figure 18B depicts the results of a binding-competition assay with radiolabeled ARC ! 7480, 12.5 nM full-length TFPI, and different concentrations of heparin and low molecular weight heparin (LMWH) as competitors.
- LMWH low molecular weight heparin
- Figure 19 A and B illustrates competition of various anti-TFPI antibodies with ARC 19499 in a plate -based binding assay.
- Figure 20, A, B and C illustrates competition of various anti-TFPI antibodies with ARC 19499 in a nitrocellulose filtration (dot-blot) assay.
- Figure 21 is a series of graphs showing the activity of ARC 19499 in the extrinsic Xase inhibition assay.
- the rate (mOD/min) was plotted vs time (minutes). In the absence of TFPI, the rate was linear. 1 nM TFPI decreased the rate dramatically. Increasing concentrations of ARC 19499 from 0.01 to 1000 nM increased the rate in a dose-dependent manner until nearly the level of no TFPI.
- Figure 21 B the rates at the 4 minute time point were normalized to the rate in the absence of TFPI at 4 minutes. ARC 19499 showed a dose- dependent improvement on the rate of the assay, reaching levels close to that of no TFPI by 10 nM aptaraer.
- FIG. 22 depicts the results of a Factor Xa (FXa) activity assay with full- length TFPI and ARC 17480, ARC18546, ARC26835, ARC31301 , ARC 19498, ARC 19499, ARC 19500, ARC19501 , ARC19881 or ARC19882.
- the adjusted rate of FXa substrate degradation is plotted as a function of aptamer concentration. The rates are adjusted by subtraction of the rate observed with FXa and TFPI in the absence of aptamer. All of the aptamers inhibit TFPI, which results in a concentration-dependent increase in FXa activity in this assay.
- Figure 23 is a graph that shows protection of Factor Xa (FXa) activity by ARC 19499 from TFPI inhibition in a chromogenic FXa activity assay.
- FXa Factor Xa
- Figure 24 is a graph that shows protection of the extrinsic FXase by ARC 19499 from TFPI inhibition in a chromogenic assay of Factor X (FX) activation.
- Figure 25 is a graph that shows protection of the TF:FVIIa complex by ARC 19499 from TFPI i hibitio in a fluorogenic assay of TFiFV Ia activity,
- Figure 26 is a graph that shows the effect of ARC19499 on tissue factor (TF)-initiated thrombin generation in a Normal Synthetic Coagulation Proteome (SCP).
- TF tissue factor
- SCP Normal Synthetic Coagulation Proteome
- Figure 27 is a graph that shows the effect of ARC 19499 on tissue factor (TF)-initiated thrombin generation in a hemophilia A Synthetic Coagulation Proteome.
- Figure 28 is a graph that shows the effect of ARC 19499 on tissue factor (TF)-initiated thrombin generation in a hemophilia B Synthetic Coagulation Proteome.
- Figure 29 is a graph that shows the effect of increasing Factor VIII (FVIII) concentrations on tissue factor (TF)-initiated thrombin generation in the absence of ARC 19499.
- FVIII Factor VIII
- Figure 30 is a graph that shows the effect of increasing Factor VIII (FVIII) concentrations on tissue factor (TF)-initiated thrombin generation in the presence of 1.0 nM ARC 19499.
- FVIII Factor VIII
- Figure 31 is a graph that shows the effect of increasing Factor VIII (FVIII) concentrations on tissue factor (TF)-initiated thrombin generation in the presence of 2.5 nM ARC 19499.
- FVIII Factor VIII
- Figure 32 is a graph that shows the effect of increasing ARC 19499 concentrations on tissue factor (TF)-initiated thrombin generation in the absence of Factor VIII (FVIII).
- Figure 33 is a graph that shows the effect of increasing ARC 19499 concentrations on tissue factor (TF)-initiated thrombin generation in the presence of 100% Factor VIII (FVIII).
- Figure 34 is a graph that shows the effect of increasing ARC 19499 concentrations on tissue factor (TF)-initiated thrombin generation in the presence of 2% Factor VIII (FVIII).
- Figure 35 is a graph that shows the effect of increasing ARC 19499 concentrations on tissue factor (TF)-initiated thrombin generation in the presence of 5% Factor VIII (FVIII).
- Figure 36 is a graph that shows the effect of increasing ARC 19499 concentrations on tissue factor (TF)-initiated thrombin generation in the prese ce of 40% Factor VIII (FVIII).
- Figure 37 is a series of graphs showing the activity of ARC19499 i the calibrated automated thrombogram (CAT) assay in pooled normal plasma (PNP) initiated with 0.1 pM tissue factor (TF; Figure 37 A) or 1.0 pM TF (Figure 37B).
- the lag time ( Figure 37E) showed a dose-dependent decrease with increasing concentrations of ARC 19499 at both TF concentrations.
- Figure 38 is a series of graphs showing the activity of ARC 19499 in the calibrated automated thrombogram (CAT) assay in TFPI-depieted plasma initiated with 0.01 , 0.1 or 1.0 pM tissue factor (TF).
- Figure 38A shows thrombin generation curves at increasing ARC 19499 concentrations with three different TF concentrations.
- the endogenous thrombin potential (ETP; Figure 38B), peak thrombin (Figure 38C) and lag time (Figure 38D) showed little or no change over all tested ARC 19499 concentrations at all tested TF concentrations.
- Figure 39 is a series of graphs showing the activity of ARC 19499 in the calibrated automated thrombogram (CAT) assay in pooled normal plasma (PNP) previously treated with a neutralizing, polyclonal anti-TFPI antibody.
- the assay was initiated with 0.01 pM tissue factor (TF; Figure 39A), 0.1 pM TF (Figure 39B) or 1.0 pM TF ( Figure 39C).
- the endogenous thrombin potential (ETP; Figure 39D), peak thrombin (Figure 39E) and lag time (Figure 39F) remained largely unchanged at all ARC ! 9499 concentrations independent of the TF
- Figure 40 is a series of graphs showing a calibrated automated thrombogram (CAT) assay with ARC 17480 (Figure 40A), ARC 19498 ( Figure 40B) and ARC 19499 (Figure 40C) at various concentrations.
- the endogenous thrombin potential (ETP; Figure 40D) and peak thrombin (Figure 40E) measured with various concentrations of ARC 17480, ARC19498 and ARC 19499 in hemophilia A plasma were similar to one another, with ARC 19499 having slightly greater activity, reaching an ETP plateau close to normal plasma levels by 30 nM aptamer.
- the thrombin generation curves (Figure 40A-C) are representative data.
- Figure 41 is a graph of thrombin generation in platelet-poor normal plasma from a single, healthy volunteer.
- the plasma was treated with an anti-FVIII antibody to generate a hemophilia A-like state.
- ARC19499 showed a dose-dependent increase in thrombin generation in the antibody-treated plasma.
- Figure 42 is a series of graphs showing a calibrated automated thrombogram (CAT) assay with ARC 19499 (Figure 42 A) and ARC 17480 (Figure 42B) at various concentrations in hemophilia B plasma.
- Figure 43 is a series of graphs showing the effect of ARC 19499 (diamonds) and ARC 17480 (triangles) on endogenous thrombin potential (ETP), peak thrombin and lag time in hemophilia B plasma.
- the solid line designates the level of each parameter in the absence of any drag.
- the hatched line designates the level of each parameter in pooled normal plasma (PNP) without any additional drug.
- Figure 44 is a series of graphs showing the effects of ARC 19499 compared to a negative control aptamer on thrombin generation as measured by the calibrated automated thrombogram (CAT) assay in plasmas from patients with hemophilia A ( Figure 44A), hemophilia A with inhibitors ( Figure 44B) or hemophilia B ( Figure 44C). The results are given in terms of the lag time (left), endogenous thrombin potential (ETP) (mid dle) and peak thrombin concentration (right). In all graphs, lines represent acti vity of normal plasma (solid) and factor- deficient plasma (dashed) in the absence of aptamer, and shading around the lines represents the standard error of the mean.
- CAT calibrated automated thrombogram
- Figure 45 depicts the results of thrombin generation experiments with ARC 17480, ARC 18546, ARC26835 and ARC31301 in hemophilia A plasma. Adjusted endogenous thrombin potential (ETP; Figure 45A and C) and adjusted peak thrombin (Figure 45B and D) values are plotted as a function of aptamer concentration. The ETP and peak thrombin values for hemophilia plasma were subtracted from each value to give the adjusted values. ARC17480, ARC 18546, ARC26835 and ARC31301 increase thrombin generation in a concentration- dependent manner in hemophilia A plasma.
- ETP endogenous thrombin potential
- Figure 45B and D adjusted peak thrombin
- Figure 46 depicts the results of thrombin generation experiments with ARC 17480, ARC 19500, ARC 19501 , ARC 19881 and ARC 19882 in hemophilia A plasma. Adjusted endogenous thrombin potential (ETP; Figure 46A) and adjusted peak thrombin (Figure 46B) values are plotted as a function of aptamer concentration. The ETP and peak thrombin values for hemophilia plasma were subtracted from each value to give the adjusted values. ARC17480, ARC 19500, ARC 19501, ARC 19881 and ARC 19882 increase thrombin generation in a concentration-dependent manner in hemophilia A plasma.
- ETP endogenous thrombin potential
- Figure 46B adjusted peak thrombin
- Figure 47 is a series of graphs from thrombin generation experiments showing the effect of NovoSeven ® (empty triangles) and ARC! 9499 (filled diamonds) on endogenous thrombin potential (ETP; Figure 47A), peak thrombin (Figure 47B) and lag time (Figure 47C) in normal plasma.
- Figure 48 is a series of graphs from thrombin generation experiments showing the effect of NovoSeyen ® (empty triangles) and ARC 19499 (filled diamonds) on endogenous thrombin potential (ETP; Figure 48 A), peak thrombin (Figure 48B) and lag time (Figure 48C) in hemophilia A plasma.
- the solid black line designates the level of each parameter in the absence of any drag.
- Figure 49 is a series of graphs from thrombin generation experiments showing the effect of NovoSeven ® (empty triangles) and ARC 19499 (filled diamonds) on endogenous thrombin potential (ETP; Figure 49 A), peak thrombin (Figure 49B) and lag time (Figure 49C) in hemophilia A inhibitor plasma.
- the solid black line designates the level of each parameter in the absence of any drug.
- the dashed l ine designates the level of each parameter in pooled normal plasma (PNP) without any additional drug.
- Figure 50 is a series of graphs from experiments showing the effect of NovoSeven* (empty triangles) and ARC"! 9499 (filled diamonds) on R-value (Figure 50A), angle (Figure SOB) and maximum amplitude (MA; Figure 50C) in a thromboelastography (TEG ® ) assay in citrated whole blood from healthy volunteers.
- the solid black line designates the level of each parameter in the absence of any drag.
- Figure 51 is a series of graphs from experiments showing the effect of NovoSeven* (empty triangles) and ARC 19499 (filled diamonds) on R-value (Figure 51 A), angle ( Figure 5 IB) and maximum amplitude (MA; Figure 51C) in a thromboelastography (TEG*) assay in citrated whole blood from healthy volunteers treated with an anti-F VIII antibody.
- the solid black line designates the level of each parameter in the absence of any drag.
- the dashed line designates the level of each parameter in whole blood not treated with antibody.
- Figure 52 is a series of graphs from thromboelastography experiments showing the lag time (Figure 52A), peak thrombin (Figure 52B) and endogenous thrombin potential (ETP; Figure 52C).
- Each line represents the dose response of ARC 19499 in the presence of a different percent of Factor VIII (filled diamonds, 0%; empty triangles, 1.4%; filled squares, 2.5%; filled triangles, 5%; empty squares, 14%; and filled circles, 140%).
- the dashed line designates level of each parameter in the presence of pooled normal plasma (PNP) alone.
- FIG 53 is a series of graphs from thrombin generation experiments demonstrating ARC 19499 activity in plasma with various concentrations of Factor VIII (FVIII).
- ETP endogenous thrombin potential
- the dashed lines represent the ETP after addition of different amounts of FVIII to hemophilia A plasma.
- the solid lines show that ARC 19499 increases ETP in hemophilia A plasma (line with triangles) and hemophilia A plasma with 5% FVIII added (line with diamonds).
- the ETP is plotted versus FVIII concentration. ETP data is shown with and without the addition of 300 nM ARC19499.
- Figure 54 illustrates the experimental design of the spatial clotting model.
- Figure 54A is a diagram of the spatial clotting chamber.
- Figure 54B is a schematic illustration of the components of the system for measuring clot progression in the chamber.
- Figure 55 shows two graphs illustrating clot propagation in the spatial clotting model, as measured by light scattering, plotted as a function of distance from the acti vating surface. Clotting was activated by low density tissue factor in normal pooled plasma in the absence ( Figure 55A) and in the presence ( Figure 55B) of 300 nM ARC! 9499.
- Figure 56 is a graph of clot size versus time, in the absence (thick black line) and the presence (thin grey line) of 300 nM ARC 19499 in normal pooled plasma.
- the parameters that can be derived from this graph include the lag time (time until beginning of clot growth), initial velocity (a or mean slope during the first 10 minutes of growth), stationary velocity ( ⁇ or Vstationar,; mean slope during the next 30 minutes of growth) and clot size after 60 minutes (an integral parameter of clot formation efficiency).
- Figure 57 is a series of graphs showing the lag time (Figure 57A), Vj ni ,i a i ( Figure 57B), Vstationar ( Figure 57C) and clot size after 60 minutes ( Figure 57D) in normal pooled plasma, each plotted as a function of tissue factor density in the presence (circles) and absence (squares) of ARC 19499.
- Figure 58 is a series of graphs showing the lag time (Figure 58A), Vjmsa! ( Figure 58B), Vstationar (Figure 58C) and clot size after 60 minutes (Figure 58D) in normal pooled plasma, each plotted as a function of ARC 19499 concentration under conditions of low surface tissue factor density.
- Figure 59 is a series of graphs illustrating the effect of ARC 19499 on the lag time (Figure 59A), ⁇ ⁇ ⁇ « ⁇ ( Figure 59B), V stado n a ry ( Figure 59C) and clot size after 60 minutes ( Figure 59D) in normal pooled plasma under conditions of low surface tissue factor density.
- An asterisk indicates a statistically significant difference ⁇ ARC 19499 (P ⁇ 0,05).
- Figure 60 is a series of graphs showing the lag time (Figure 60 A), V m i t . a i ( Figure 60B), Vstationat ( Figure 60C) and clot size after 60 minutes (Figure 60D) in normal pooled plasma, each plotted as a function of ARC 19499 concentration under conditions of medium surface tissue factor density.
- Figure 61 is a series of graphs illustrating the effect, of ARC 19499 on the lag time ( Figure 61 A), Ymiiiai ( Figure 6 IB), Vstationary ( Figure 61 C) and clot size after 60 minutes ( Figure 61D) in normal pooled plasma under conditions of medium surface tissue factor density.
- An asterisk indicates a statistically significant difference ⁇ ARC 19499 (PO.05).
- Figure 62 compares clot propagation in normal pooled plasma ( Figure 62A) to normal pooled plasma containing 100 nM ARC 19499 ( Figure 62B) or 100 nM recombinant factor Vila (rVIIa or Novoseven* ' ; Figure 62C) under conditions of low surface tissue factor density.
- Figure 63 is an illustration showing a series of light scattering images from the spatial clotting model. Each row depicts clot propagation from a surface (bottom) over time 0, 10, 20, 30, 40, 50 and 60 minutes. The top row shows clot propagation in severe hemophilia A plasma, followed by severe hemophilia A plasma containing 100 nM ARC 19499 in the second row and severe hemophilia A plasma containing 100 nM recombinant factor Vila (rVIIa) in the third row.
- rVIIa recombinant factor Vila
- Figure 64 is a graph of clot size versus time, in normal plasma (dark grey, dashed line), severe hemophilia A plasma (black, solid line), severe hemophilia A plasma containing 100 nM ARC 19499 (light grey, solid line) or 100 nM recombinant factor Vila (rVIIa) (light grey, dashed line).
- Figure 65 is a table summarizing the demographics of hemophilia A patients from which plasma samples were drawn for spatial clot formation experiments.
- Figure 66 shows the effects of ARC19499 or recombinant factor Vila (rVIIa), titrated into severe hemophilia A plasma from Patient I , on spatial clot, formation activated with low surface tissue factor density.
- rVIIa recombinant factor Vila
- Figure 67 shows the effects of ARC19499 or recombinant factor Vila (rVIIa), titrated into severe hemophilia A plasma from Patient 2, on spatial clot formation activated with low surface tissue factor density.
- rVIIa recombinant factor Vila
- Figure 68 shows the effects of ARC 19499 or recombinant factor Vila (rVIIa), titrated into severe hemophilia A plasma from Patient 3, on spatial clot, formation activated with low surface tissue factor density.
- ARC 19499 and rVIIa on lag time are depicted in Figure 68A and B, respectively, while the effects of ARC 19499 and rVIIa on Vinitiai are depicted in Figure 68C and D, respectively.
- Figure 69 shows the effects of ARC 19499 (black symbols) or recombinant factor Vila (rVIIa; grey symbols) on Vstationar in hemophilia A plasma samples from Patients 1-3, activated with low surface tissue factor density.
- Figure 70 shows the effects of ARC 19499 ( Figure 70A) or recombinant factor Vila (rVI Ia; Figure 70B) on clot size at 60 minutes in hemophilia A plasma samples from Patients 1 - 3, activated with low surface tissue factor density.
- An asterisk indicates a statistically significant difference ⁇ ARC19499 (P ⁇ 0.05).
- Figure 72 is a series of graphs showing the lag time (Figure 72 A), Vjni t M ( Figure 72B), Vstationary ( Figure 72C) and clot size after 60 minutes (Figure 72D) in hemophilia A plasma from Patient 4 activated with medium surface tissue factor density. Each parameter is plotted as a function of ARC 19499 (squares) or recombinant factor Vila (rVIIa; circles).
- Figure 73 is a series of graphs showing the lag time ( Figure 73 A), Vinitiai ( Figure 73B), Vstationary ( Figure 73C) and clot size after 60 minutes ( Figure 73D) in hemophilia A plasma from Patient 5 activated with medium surface tissue factor density. Each parameter is plotted as a function of ARC! 9499 (squares) or recombinant factor Vila (rVIIa; circles).
- Figure 74 is a series of graphs showing the lag time ( Figure 74A), Vintoa! ( Figure 74B), Vstationary ( Figure 74C) and clot size after 60 minutes (Figure 74D) in hemophilia A plasma from Patient 6 activated with medium surface tissue factor density. Each parameter is plotted as a function of ARC 19499 (squares) or recombinant factor Vila (rVIIa; circles).
- Figure 76 is a series of graphs illustrating the lag time (Figure 76A), V ir . itiai ( Figure 76B), Vstationaiv ( Figure 76C) and clot size after 60 minutes ( Figure 76D) in normal plasma compared to hemophilia A plasma or hemophilia A plasma containing 300 nM ARC 19499, activated with low surface tissue factor density.
- Figure 77 is a bar graph illustrating the efficiency of ARC 19499 in promoting clot propagation in normal plasma (solid bars) versus hemophilia A plasma (hatched bars) as reflected in the lag time (white), Vinitiai (light grey), V statio ai7 (medium grey) and clot size after 60 minutes (black). Efficiency is defined as the ratio of the parameter determined in the presence of 300 nM ARC19499 to the parameter in the absence of ARC 19499.
- Figure 78 illustrates the concentration dependence of the lag time ( Figure 78 A) and clot size at 60 minutes ( Figure 78B) on ARC 19499 in hemophilia A plasma activated with low surface tissue factor density. These data were used to calculate the IC50 values shown in the table below the graphs.
- Figure 79 is a series of graphs illustrating the lag time (Figure 79 A), V : ⁇ .; ⁇ !., ⁇ ( Figure 79B), V sti i onary ( Figure 79C) and clot size after 60 minutes ( Figure 79D) in hemophilia A plasma alone compared to hemophilia A plasma containing 300 11M ARC 19499 or 300 nM recombinant factor Vila (rVIIa), activated with low surface tissue factor density.
- Figure 80 compares the lag time (Figure 80A) and ⁇ 1 ⁇ 3 ⁇ 4 ⁇ ⁇ ( Figure 80B) in TFPI depleted plasma activated with low surface tissue factor density. Each graph shows parameters measured in TFPI depleted plasma alone (“PBS”), TFPI depleted plasma supplemented with ⁇ 10 nM recombinant TFPI ("TFPI”), TFPI depleted plasma containing 300 nM ARC 19499 (“ARC”), and TFPI depleted plasma supplemented with 10 nM recombinant TFPI and 300 nM ARC 19499 (“ARC+TFPI”).
- Figure 81 is a series of tables showing the effects of ARC 19499 on the TF-activated clotting time (TF-ACT) assay in whole blood samples from normal, severe hemophilia B and severe hemophilia A individuals.
- Figure 82 is a series of tables showing the effects of ARC19499 on the dilute prothrombin time (dPT) assay in plasma samples from normal, severe hemophilia B and severe hemophilia A individuals,
- Figure 83 shows the effect of different ARC! 9499 concentrations on ROTEM parameters in whole blood samples (without corn trypsin inhibitor (CTI)) from hemophilia patients (filled squares) and healthy controls (empty circles).
- CT clotting time
- CFT clot formation time
- MCF maximum clot firmness
- alpha alpha
- Figure 84 shows the effect of different ARC 19499 concentrations on the clotting time (CT) in blood samples from healthy controls (empty circles) compared to hemophilia
- CT clotting time
- Figure 85 shows the effect of different ARC ! 9499 concentrations on ROTEM parameters in whole blood samples (with corn trypsin inhibitor (CTI)) from hemophilia patients (filled squares) and healthy controls (empty circles). The following parameters were analyzed: the clotting time (CT), the clot formation time (CFT), the maximum clot firmness (MCF) and the alpha angle (alpha).
- CT clotting time
- CFT clot formation time
- MCF maximum clot firmness
- alpha angle alpha
- Figure 86 shows the effect of different ARC19499 concentrations on ROTEM parameters in whole blood samples from a single patient with acquired hemophilia A. The following parameters were analyzed: the clotting time (CT), the clot formation time (CFT), the maximum clot firmness (MCF) and the alpha angle (alpha).
- CT clotting time
- CFT clot formation time
- MCF maximum clot firmness
- alpha alpha angle
- Figure 87 shows ROTEM parameters for healthy control blood pre-incubated with a neutralizing FVIII antibody.
- Graphs show clotting time (CT) (left panel) and clot formation time (CFT) (right panel) in the same controls; on the left side of each graph, values after inhibition by an FVIII antibody are depicted.
- Figure 88 shows thrombin generation curves from the calibrated automated thrombogram (CAT) assay in plasma from a representative severe hemophilia A patient (left panel) and a healthy control (right panel). Both graphs show results in the presence (empty circles) and absence (filled squares) of 200 nM ARC 19499.
- CAT calibrated automated thrombogram
- Figure 89 shows plots of calibrated automated thronibogram (CAT) parameters versus ARC 19499 concentration, including the endogenous thrombin potential (ETP), time to peak, peak thrombin concentration and start tail.
- CAT calibrated automated thronibogram
- Figure 90 is a plot of calibrated automated thronibogram (CAT) lag time versus ARC 19499 concentration, comparing the response in hemophilia patients (filled squares) to healthy controls (empty circles).
- CAT calibrated automated thronibogram
- Figure 91 shows the effect of different ARC! 9499 concentrations on peak thrombin in plasma samples from healthy controls (empty circles) compared to hemophilia
- the hatched region indicates the range observed in healthy controls.
- Figure 92 shows thrombin generation curves in plasma from a single patient with acquired hemophilia A containing 0 nM (filled squares), 2 nM (asterisks), 20 nM (empty circles) or 200 nM (filled stars) of ARC! 9499.
- Figure 93 shows calibrated automated thronibogram (CAT) parameters for healthy control plasma pre-incubated with a neutralizing FVIII antibody.
- Graphs show endogenous thrombin potential (ETP) (left panel) and peak thrombin (right panel) in the same controls: on the left side of each graph, values after inhibition by an FVIII antibody are depicted.
- Figure 94 shows representative calibrated automated thronibogram (CAT) data from a healthy volunteer (ARC HV 01 ).
- Figure 95 shows representative calibrated automated thronibogram (CAT) data from a patient with severe hemophilia A (ARC SUA 05).
- Figure 96 shows representative calibrated automated thronibogram (CAT) data from a patient with moderate hemophilia A (ARC MoHA 01).
- Figure 97 shows representative calibrated automated thronibogram (CAT) data from a patient with mild hemophilia A (ARC MiHA 03).
- Figure 98 is a series of graphs depicting median calibrated automated thronibogram (CAT) parameters (endogenous thrombin potential (ETP), peak thrombin, lag time and time to peak) measured in fresh plasma samples from patients with severe hemophilia A (empty diamonds), moderate hemophilia A (empty squares), mild hemophilia A (empty triangles) or severe hemophilia B (filled triangles) compared to healthy controls (filled circles),
- CAT median calibrated automated thronibogram
- Figure 99 is a series of graphs depicting median calibrated automated thrombogram (CAT) parameters (endogenous thrombin potential (ETP), peak thrombin, lag time and time to peak) measured in frozen/thawed plasma samples from patients with severe hemophilia A (empty diamonds), moderate hemophilia A (empty squares), mild hemophilia A (empty triangles) or severe hemophilia B (filled triangles) compared to healthy controls (filled circles).
- CAT median calibrated automated thrombogram
- Figure 100 shows representative whole blood thrornboelastography (TEG*) data from a healthy volunteer (ARC HV 01).
- Figure 101 shows representative whole blood thrornboelastography (TEG " ) data from a patient with severe hemophilia A (ARC SFIA 02).
- Figure 102 shows representative whole blood thrornboelastography (TEG ® ) data from a patient with moderate hemophilia A (ARC oHA 01).
- Figure 103 shows representative whole blood thrornboelastography (TEG ® ) data from a patient with mild hemophilia A (ARC MiHA 01 ).
- Figure 104 is a series of graphs depicting median thrornboelastography (TEG*) parameters (R-time, and angle) measured in whole blood samples from patients with severe hemophilia A (empty diamonds), moderate hemophilia A (empty squares), mild hemophilia A (empty triangles) or severe hemophilia B (filled triangles) compared to healthy controls (filled circles).
- TAG* median thrornboelastography
- Figure 105 shows representative plasma thrornboelastography (TEG 4 ') data from a patient with severe hemophilia A (ARC SUA 02).
- Figure 106 shows representative plasma thrornboelastography (TEG ® ) data from a patient with moderate hemophilia A (ARC MoHA 01).
- Figure 107 shows representative plasma thrornboelastography (TEG ® ) data from a patient with mild hemophilia A (ARC MiHA 03),
- Figure 108 is a series of graphs depicting median thrornboelastography (TEG ® ) parameters (R-time, and angle) measured in plasma samples from patients with severe hemophilia A (empty diamonds), moderate hemophilia A (empty squares), mild hemophilia A (empty triangles) or severe hemophilia B (filled triangles) compared to healthy controls (filled circles).
- TAG ® median thrornboelastography
- tlirombogram assay compared to hemophilia A plasma alone (solid line), as measured by endogenous thrombin potential (ETP; Figure 109 A) and peak thrombin (Figure 109B).
- ETP endogenous thrombin potential
- Figure 109B peak thrombin
- Addition of ARC23085 (filled diamonds), ARC23087 (empty triangles), ARC23088 (filled squares) and ARC23089 (filled triangles) can reverse this improvement at concentrations >100 nM, reaching similar levels to the absence of ARC 19499, In Figure 109C, R- values from the
- thromboelastography (TEG 3 ⁇ 4 ) assay showed that 500 nM ARC 19499 shortens the R-value that is prolonged in hemophilia A plasma.
- ARC23088 showed little reversal at either condition.
- ARC23089 also reversed the ARC 19499 improvement with a 5 minute preincubation at 37 °C.
- Figure 1 10 is a series of thrombin generation curves from the calibrated automated thrombogram (CAT) assay showing the activity of ARC 19499 in hemophilia A plasma in the presence of 0.00 (Figure 1 10A), 0.156 (Figure H OB), 0.312 (Figure HOC), 0.625 (Figure HOD), 1.25 ( Figure 3 30E), 2.50 (Figure 1 1 OF) or 5.00 IU/mL (Figure 1 1 OG) low molecular weight heparin (LMWI I).
- CAT calibrated automated thrombogram
- Figure 1 1 1 is a series of graphs showing the endogenous thrombin potential (ETP; ( Figure 111 A) and peak thrombin (Figure 1 1 IB) from calibrated automated thrombogram (CAT) assays performed in hemophilia A plasma with increasing concentrations of both ARC 19499 and LMWH.
- the concentration of LMWH is denoted on the x-axis in units of IU/mL.
- CAT automated thrombogram
- Figure 112 is a series of graphs showing the endogenous thrombin potential (ETP; ( Figure 112 A) and peak thrombin (Figure 1 12B) from calibrated automated thrombogram (CAT) assays performed in hemophilia A plasma with increasing concentrations of both ARC 19499 and LMWH.
- the concentration of LMWH is denoted on the x-axis in units of ⁇ .
- the data in these graphs were analyzed by curve-fitting to generate estimates of LM WH IC 50 in the presence of various ARC19499 concentrations. The IC 50 values may be found in the table below the graphs.
- Figure 113 is a series of graphs showing the in vitro stability of several TFPI aptamers in serum.
- Figure 1 14 is a graph of a thromboelastography (TEG ® ) assay where plasma from cynomolgus monkeys that were treated previously with an anti-human FVIII antibody was mixed with increasing concentrations of ARC 19499 and assayed for activity.
- the solid line represents plasma from untreated monkeys and the dashed line represents plasma from antibody treated monkeys, both in the absence of aptamer.
- the data represents mean ⁇ standard error, with the shaded areas representing the standard error of the non-aptarner samples.
- Figure 1 15 is a graph showing that regardless of treatment following Factor VIII antibody injection in cynomolgus monkeys, Factor VIII activity decreased to ⁇ I% and remained there for the duration of the study (5.5 hours). Data represent mean ⁇ standard error, n :::: 3-6.
- Figure 116 is a series of graphs showing prothrombin ( PT) and acti vated partial thromboplastin (aPTT) times before and after ARC 19499 treatment in cynomolgus monkeys.
- PT prothrombin
- aPTT acti vated partial thromboplastin
- Figure 1 17 is a series of graphs from thromboelastography (TEG 3 ⁇ 4 ) analysis showing that R- values ( Figure 117 A), a measure of clot time; angles ( Figure 117B), a measure of rate of clot formation; and maximum amplitudes (MA; Figure 1 17C), a measure of clot strength, determined in monkeys treated with saline (filled triangles), ovoSeven ⁇ (x), 600 ,iig/kg ARC 19499 (empty squares), 300 .iig/kg ARC 19499 (empty triangles) or 100 ⁇ g/kg ARC 19499 (empty diamonds).
- Figure 120 shows the schedule for bleeding time assessment and related FVIII antibody and ARC 19499 dosing and blood sampling in the non-human primate (NHP) bleeding model.
- Figure 121 is a series of graphs showing FVIII activity levels in plasma samples from various dosing groups of cynornolgus monkeys treated with FVIII antibody and ARC 19499:
- Figure 122 shows mean group bleeding times for Group I monkeys in seconds
- Figure 123 shows individual bleeding times for Group 1 monkeys in seconds
- Figure 124 shows mean group bleeding times for Group 2 monkeys in seconds ( Figure 124A) and in terms of % of baseline bleeding time ( Figure 124B).
- Figure 125 shows individual bleeding times for Group 2 monkeys in seconds ( Figure 125 A) and in terms of % of baseline bleeding time ( Figure 125B ).
- Figure 126 shows bleeding times for the Group 3 monkey in seconds ( Figure 126 A) and in terms of % of baseline bleeding time ( Figure 126B).
- Figure 127 shows bleeding times for the Group 4 monkey in seconds ( Figure 127 A) and in terms of % of baseline bleeding time ( Figure 127B).
- Figure 128 is a graph of mean group whole blood thromboelastography (TEG 1 *) R- values plotted against sampling timepoint for Group 1 monkeys.
- the time of anti-Factor VIII antibody dosing is indicated by a plus-sign (+) and the time of ARC 19499 dosing is indicated by an asterisk (*).
- Figure 129 is a graph of individual whole blood thromboelastography (TEG ® ) R- values plotted against sampling timepoint for Group 1 monkeys.
- the time of anti-Factor VIII antibody dosing is indicated by a plus-sign (+) and the time of ARC 19499 dosing is indicated by an asterisk (*).
- Figure 130 is a graph of mean group whole blood thromboelastography (TEG ® ) Revalues plotted against sampling timepoint for Group 2 monkeys.
- the time of anti-Factor VIII antibody dosing is indicated by a plus-sign (+) and the times of ARC 19499 dosing are indicated by asterisks (*).
- Figure 131 is a graph of individual whole blood thromboelastography (TEG ® ) R- values plotted against sampling timepoint for Group 2 monkeys.
- the time of anti-Factor VIII antibody dosing is indicated by a plus-sign (+) and the times of ARC 19499 dosing are indicated by asterisks (*).
- Figure 132 is a graph of individual whole blood thromboelastography (TEG J ) Revalues plotted against sampling timepoint for the Group 3 monkey.
- the time of anti-Factor VIII antibody dosing is indicated by a plus-sign (+) and the times of ARC 39499 dosing are indicated by asterisks (*).
- Figure 133 is a graph of individual whole blood thromboelastography (TEG ® ) R- values plotted against sampling timepoint for the Group 4 monkey.
- the time of anti-Factor VIII antibody dosing is indicated by a plus-sign (+) and the times of ARC 39499 dosing are indicated by asterisks (*).
- Figure 134 is a graph of mean group plasma thromboelastography ⁇ ⁇ . ⁇ ⁇ R- values plotted against sampling timepoint for Group 1 monkeys.
- the time of anti-Factor VIII antibody dosing is indicated by a plus-sign (- ) and the time of ARC 19499 dosing is indicated by an asterisk (*).
- Figure 135 is a graph of individual plasma thromboelastography (TEG ® ) R- values plotted against sampling timepoint for Group 1 monkeys.
- the time of anti-Factor VIII antibody dosing is indicated by a plus-sign (+) and the time of ARC 19499 dosing is indicated by an asterisk (*).
- Figure 136 is a graph of mean group plasma thromboelastography (TEG*) R- values plotted against sampling timepoint for Group 2 monkeys.
- the time of anti-Factor VIII antibody dosing is indicated by a plus-sign (+) and the times of ARC19499 dosing are indicated by asterisks (*).
- Figure 137 is a graph of individual plasma thromboelastography (TEG 0* ) R-values plotted against sampling timepoint for Group 2 monkeys.
- the time of anti-Factor VIII antibody dosing is indicated by a plus-sign (+) and the times of ARC 19499 dosing are indicated by asterisks (*).
- Figure 138 is a graph of individual plasma thromboelastography (TE,G 3 ⁇ 4 ) R-values plotted against sampling timepoint for the Group 3 monkey.
- the time of anti-Factor VIII antibody dosing is indicated by a plus-sign (+) and the times of ARC 19499 dosing are indicated by asterisks (*).
- Figure 139 is a graph of individual plasma thromboelastography (TE,G 3 ⁇ 4 ) R-values plotted against sampling timepoint for the Group 4 monkey.
- the time of anti-Factor VIII antibody dosing is indicated by a plus-sign (+) and the times of ARC 19499 dosing are indicated by asterisks (*).
- Figure 140 depicts derivatives of ARC17480 that contain single and multiple 2' ⁇ substitutions in the ARC 17480 sequence. Differences relative to ARC 17480 are shaded.
- Figure 141 depicts derivatives of ARC 17480 that contain a single phosphorothioate substitution between each pair of residues in the ARC" 17480 sequence. Each phosphorothioate is indicated by an "s" between the pairs of residues in the sequence. Differences relative to ARCl 7480 are shaded.
- Figure 142 A depicts tolerated and non-tolerated 2 '-substitutions mapped onto the putative secondary structure of ARC 17480.
- Figure 142B depicts active ARC 17480 derivatives with multiple 2'-deoxy to 2'-0 Methyl and/or 2'-fluoro substitutions at the four deoxycytidine residues of ARC 17480 (residues 9, 14, 16 and 25).
- Figure 143 depicts derivatives of ARC 17480 that contain single or multiple deletions in the ARC 17480 sequence. Differences relative to ARC 17480 are highlighted in black.
- Figure 144A depicts tolerated and non-tolerated single residue deletions mapped onto the putative secondary structure of ARC17480.
- ARC 17480 is comprised of 2'-0 Methyl (circles) and 2'-deoxy (squares) nucleotides and is modified at its 3 '-terminus with an inverted deoxythymidine residue (3T).
- the corresponding double residue deletion is also depicted in cases where two adjacent nucleotides were identical.
- Tolerated deletions are highlighted in gray and non-tolerated deletions are highlighted in black. Tolerated and non-tolerated double deletions are indicated.
- Figure 144B depicts active ARCS 7480 derivatives ARCS 3889 and A C33895. These molecules each have seven of the ARC 17480 residues deleted, which are represented by black circles.
- Figure 145 depicts the results of a thrombin generation experiment with 3 '-truncated ARC 19499 derivatives.
- ARC19499, ARC21383, ARC21385, ARC21387 and ARC21389 all increase thrombin generation in a concentration-dependent manner in hemophilia A plasma, as measured by endogenous thrombin potential (ETP; Figure 145 A) and peak thrombin ( Figure 145B).
- Figures 146 A and 146B depict derivatives of ARC 17480 that contain single nucleotide mutations in the ARC 17480 sequence. Differences relative to ARC 17480 are shaded.
- Figure 147 depicts the single tolerated nucleotide mutations mapped onto the putative secondary structure of ARC 17480.
- the letters at, each position indicate the nucleotides that are tolerated at that position when substituted individually in the context of the ARC ! 7480 sequence.
- Figure 148 depicts derivatives of ARC 17480 that contain multiple mutations and/or deletions in the ARC 17480 sequence. Deletions relative to ARC 17480 are highlighted in black and mutations relative to ARC 17480 are shaded.
- Figure 149 depicts derivatives of ARC1 7480 that contain multiple mutations relative to the ARC17480 sequence that retain Watson-Crick base-pairing at residues 6 and 29, 7 and 28, and 8 and 27. Mutations relative to ARC 17480 are shaded. Some of these molecules also contain deletions relative to ARC 17480, which are highlighted in black.
- Figure 150 depicts derivatives of ARC 17480 that contain multiple mutations in the ARC17480 sequence, each of which is tolerated individually (see Figure 147 and Table 40), Mutations relative to ARC 17480 are shaded.
- Figure 151 is a graph showing different concentrations of FXa and ARC 19499 (2000 - 0.10 iiM) competing with trace amounts of radiolabeled ARC 17480 for binding to TFPI (10 iiM). Also shown is a graph of a control experiment in which different concentrations of FXa (2000 - 0.10 nM) are bound to trace amounts of radiolabeled ARC! 7480.
- Figure 152 is a series of graphs depicting computer simulations of spatial clotting illustrating the effects of factor VIII and TFPI depletion.
- Panels A and B show clot size versus time plots for clotting activation with TF at 5 or 100 pmole/ T, respectively.
- Panel C shows the lag time in hemophilia A plasma with and without TFPI as a function of TF surface density.
- Figure 153 is a series of graphs showing the predicted effect based on computer simulation of the combination of TFPI and factor VIII concentration variations on spatial clot growth in hemophilia A. Individual panels show the dependence on concentrations of TFPI and factor VIII for the following clotting parameters: lag time (a), initial velocity (b), stationary velocity (c) and clot size (d),
- Figure 154 illustrates the experimental design of the spatial clotting model.
- Panel A is a diagram of the spatial clotting chamber.
- Panel B is a schematic illustration of the components of the system for measuring clot progression in the chamber.
- Figure 155 is a table showing characteristics of hemophilia A patients used in the spatial clotting experiments, including factor VIII level on the day of the experiment and the activated partial thromboplastin time (APTT).
- Figure 156 is a set of graphs showing the factor Vlll level (Panel A) and the APTT (Panel B) measured prior to and at various time points after administration of replacement factor VIII. Individual measurements are shown for samples from all 9 patients used in the study.
- Figure 157 illustrates the effects of ARCI9499 and factor VIII on spatial clotting in hemophilia A.
- Panel A shows typical light-scattering time-lapse images of clot growth in plasma initiated by immobilized TF at surface density of 2 pmole/m' ' : hemophilia A before (0 hours) and at 1 and 24 hours after factor VIII administration, with and without addition of 100 nM
- TF-coated activator is seen as a vertical black strip on the left side of each image.
- White bar shows the scale of 0.5 mm.
- Panels B through D show clot size versus time plots for each of the timepoints shown in Panel A: (b) 0 hours; (c) 1 hour post factor VIII administration; (d) 24 hours post factor VIII administration.
- Panel C also illustrates parameters used for experiment analysis throughout the study: lag time (time of clot growth initiation); , initial velocity (mean slope over the first 10 min); ⁇ , stationary velocity (mean slope over the following 30 min); clot size after 60 min of the experiment.
- Figure 158 is a bar graph illustrating the efficiency of ARC19499 in hemophilia A plasmas prepared with different methodologies. Ratios of clotting parameter with or without 300 nM ARC 19499 are shown for freshly prepared plasma collected into CTI and the same frozen/thawed plasma. The error bars were calculated based on standard errors.
- Figure 159 is a set of graphs showing the spatial clotting parameter dependence on ARC 19499 concentration at 0, 1 , and 24 h post factor VIII administration for patient 1.
- Figure 160 is a set of graphs showing the spatial clotting parameter dependence on ARC 19499 concentration at 0, I , and 24 h post factor VIII administration for patient 2.
- Figure 161 is a set of graphs showing the spatial clotting parameter dependence on ARC 19499 concentration at 0, I , and 24 h post factor VIII administration for patient 3.
- Figure 162 is a set of graphs showing the spatial clotting parameter dependence on ARC 19499 concentration at 0, 1 , and 24 h post factor VIII administration for patient 4.
- Figure 163 is a set of graphs showing the spatial clotting parameter dependence on ARC 19499 concentration at 0, 1 , and 24 h post factor VIII administration for patient 5.
- Figure 164 is a set of graphs showing the spatial clotting parameter dependence on ARC 19499 concentration at 0, 1 , and 24 h post factor VIII administration for patient 6.
- Figure 165 is a set of graphs showing the spatial clotting parameter dependence on ARC 19499 concentration at 0, I , and 24 h post factor VIII administration for patient 7.
- Figure 166 is a set of graphs showing the spatial clotting parameter dependence on ARC 19499 concentration at 0, 1 , and 24 h post factor VIII administration for patient 8.
- Figure 167 is a set of graphs showing the spatial clotting parameter dependence on ARC 19499 concentration at 0, 1 , and 24 h post factor VIII administration for patient 9.
- Figure 168 is a set of graphs showing the effect of 100 nM ARC19499 on spatial clotting parameters for three different ranges of factor VIII, ⁇ 5%, 5-30% and >30%. Spatial clotting parameters are shown as the average values ( ⁇ S.E.M.) for samples from 9 patients, as follows: lag time (a), initial velocity (b), stationary velocity (c) and clot size (d),
- Figure 169 is a graph showing the concentration dependence of clotting parameters on ARC19499 in plasma samples taken prior to factor VIII administration (squares), and at 1 hr (circles) and 24 hr (triangles) after factor VIII administration: (a) lag time, (b) initial velocity, (c) stationary velocity, (d) clot size. Each data point is the average ( ⁇ 8.E.M.) for 9 patient samples.
- Figure 170 is a series of pictures illustrating the role of TFPI in spatial clot formation and consequences of its inactivation.
- TFPI rapidly inhibits extrinsic tenase in a fXa-dependent manner; this does not stop fibrin clot spatial propagation because additional fXa is activated by intrinsic tenase.
- Clot size in hemophilia A plasma is significantly impaired because fVIIIa absence prevents spatial propagation
- (c) Addition of ARC 19499 to hemophilia A plasma inactivates TFPI. This does not restore spatial propagation velocity but initiates coagulation even earlier than in normal plasma. As a result, overall fibrin clot size is normalized.
- Figure 171 is a computer simulation illustrating the effects of TFPI and factor VIII depletion on coagulation, (a) Effects of TFPI and factor VIII depletion on fibrin clot propagatio as shown in a clot size versus time plot, (b) Factor Xa produced by intrinsic tenase (right, panels) or extrinsic tenase (left panels) il lustrating the effects of TFPI and factor VIII depletion on the generation of factor Xa. Factor Xa generation is plotted as a function of time from activation of the cascade and distance from activator.
- Figure 172 is a series of graphs depicting FXa activity under various conditions.
- TFPI, FXa and substrate were mixed in the absence of ARC 19499.
- FXa was added last, while in Panel B, substrate was added last.
- the lower panels show the same assays in the presence of ARC! 9499.
- Panel C shows results with TFPI, substrate and
- Figure 1 73 shows the relationship between ARC 19499 and TFPI in FXa activity after a 30 mm incubation of TFPI, FXa, and ARC ! 9499 prior to substrate addition.
- panel A the results are plotted with the ARC 19499 concentration on the x-axis.
- panel B the same results are plotted with the TFPI concentration on the x- xi .
- Figure 174 illustrates competition of various anti-TFPI antibodies with ARC 19499 in a plate-based binding assay.
- Figure 175, A and B illustrates competition of various anti-TFPI antibodies with ARC 17480 in a nitrocellulose filtration (dot-blot) assay.
- Figure 176 is a graph illustrating the effect of ARC 19499 on TFPI inhibition of FXa, shown as the relative FXa activity plotted against ARC 19499 concentration. Either 1 nM
- TFPI was incubated with 0.2 nM of factor Xa and various of the ARC 19499 before clironiogenic substrate was added to measure residual factor Xa activity.
- Figure 177 is a set of graphs illustrating TFPI inhibition of FXa under different conditions in the absence (Panel A) or presence (Panel B) of 4 ⁇ ARC 19499.
- curve #1 shows the factor Xa (0.2 nM) cleavage of a chromogenic substrate in the absence of TFPI
- curve #2 shows the factor Xa cleavage of substrate when TFPI (2 nM) and the chromogenic substrate were added to factor Xa at the same time
- curve #3 shows factor Xa cleavage of substrate when TFPI (2 nM) was pre-incubated with factor Xa (0.2 nM) before adding the substrate.
- curves #4 (circles), #5 (triangles), and #6 (plus signs) represent the factor Xa cleavage of substrate under the same conditions as #1 , #2, and #3, respectively except that 4 ⁇ of ARC 19499 was included.
- Both graphs in figures 177 A and 177B are representative from four repeats with almost identical results,
- Figure 178 is a series of graphs illustrating the effects of ARC 19499 on TFPI inhibition of the extrinsic Xase
- Panel A shows progress curves of factor Xa cleavage of substrate where FXa was activated from the reactions of 1 pM tissue factor, 1 nM factor Vila, 150 nM FX, mM CaCl 2 , and various amount, of ARC 19499
- Line 1 represents FXa cleavage of substrate when TFPI is absent
- lines 2-6 represent, the FXa cleavage of substrate in the present of 2 nM TFPI and 4000, 1000, 100, 10 and 0 nM of ARC 19499.
- Panel B shows the data from Panel A transformed into the active factor Xa concentrations plotted versus time.
- Panel C the data are expressed in terms of the extrinsic Xase turn-off time due to TF PI plotted as a function of increasing ARC 19499 concentration.
- Figure 179 is a set of graphs illustrating the effects of ARCI9499 on TFPI inhibition of prothrombinase.
- curve #1 (circles) represents the thrombin generation by 0.1 pM prothrombinase in the absence of TFPI
- curve #2 (triangles) represents the thrombin generation when 1 nM of TF PI was included with 0.1 pM prothrombinase
- curve #3 (plus signs) represents the thrombin generation when FVa was absent.
- curves #4 (circles), #5 (triangles) and #6 (plus signs) are from assays performed under the same conditions as #1 , #2 and #3 from Panel A, respectively, except that 4 ⁇ ARC 19499 was included. These graphs are representative from four repeats with almost identical results.
- Figure 180 is a set of graphs showing the effects of ARC 19499 on the dilute prothrombin time (dPT) measured in FVIII-deficient human plasma.
- dPT dilute prothrombin time
- Panel A either 0.25 pM (closed circles) or 0.5 pM (triangles) recombinant tissue factor was used to initiate the dPT in plasma samples prepared with increasing concentrations of FVIII. FVIII content was varied in these samples by mixing FVIII-deficient plasma with normal plasma at different rations.
- Panel B the ARC 19499 shortened the dPT in the factor Vlll-deficient plasma when initiated by either 0.25 pM (closed circles) or 0.5 pM (triangles) recombinant tissue factor.
- Figure 181 is a graph showing the effects of ARC 19499 on the whole blood clotting time measured in FVIII-deficient whole blood samples.
- Recombinant tissue factor 0.5 pM ⁇ ⁇
- ARC 19499 at, indicated concentrations
- the treated blood samples were incubated at 37 °C for 3 minutes before adding CaCl 2 to initiate clotting reactions.
- Figure 182 is a drawing illustrating the hydrogen-deuterium exchange (HDX) strategy used to examine the interaction between TFPI and ARC! 9498.
- HDX hydrogen-deuterium exchange
- Figure 183 is a drawing illustrating the level of deuteration achieved for segments of TFPI for different pHs and exchange times at 23 °C. The location of each segment, is indicated by juxtaposition with the TFPI amino acid sequence and the level of deuteration is indicated by color code according to the color key at the bottom of the figure.
- Figure 184 is a table showing the % deuteration for individual TFPI protein segments at different pHs and exchange times at 23 °C. This data was used to generate the drawing in Figure 2.
- Figure 185 is a series of graphs showing the % deuteration plotted as a function of exchange time for TFPI 23 °C. Each graph represents a peptide segment. Within each graph, squares represent data collected at pH 5 and diamonds represent data collected at pH 7. For the purposes of this figure, the pH 5 timepoints were converted to pH 7 equivalents (e.g. 30 seconds at pH 5 is equal to 0.3 seconds at pH 7).
- Figure 186 is a set of tables showing the buffers used in HDX with TFPI and
- Figure 187 is a series of graphs showing the % deuteration plotted as a function of exchange time for TFPI at 3 °C. Each graph represents a peptide segment. Within each graph, blue triangles represent data from on-solution/off-column experiments and purple diamonds represent data from on-column ' off-columii control experiments. For the purposes of this figure, the pH 5 and pH 6 timepoints were converted to pH 7 equivalents.
- Figure 188 is a table showing the differences in deuteration levels in each segment of TFPI after on/off exchange experiments at pH 5, 6 and pH 7 at 3 °C. Values in this table were calculated by subtracting the % deuteration from on-colunin/off-column experiments from the % deuteration from on-solution/off-column experiments. TFPI segments showing differences > 5% are regions protected in the presence of ARC19498.
- Figure 189 is a drawing illustrating the differences in deuteration levels in each segment of TFPI after on/off exchange experiments at pH 5, 6 and pH 7 at 3 °C. Dark blue indicates no protection by ARC! 9498. Lighter colors indicate differences >5% and are regions showing protection in the presence of ARC! 9498.
- Panel A shows the data for individual pHs and exchange times. Panel B reflects data averaged across all pHs and exchange times.
- the invention provides aptamers that bind to TFPI, which are described herein as "TFPI aptamers", and methods for using such aptamers in the treatment of bleeding disorders and other TFPI-mediated pathologies, diseases and disorders, with or without other agents.
- TFPI aptamers may be used before, during and/or after medical procedures, with or without other agents, in order to reduce or otherwise delay the progression of the complications or side effects thereof.
- the aptamers described herein are preferably identified through a method known in the art as Systematic Evolution of Ligands by Exponential Enrichment, or SELEXTM, which is shown generally in Figure 4. More specifically, starting with a mixture containing a starting pool of nucleic acids, the SELEX iM method includes steps of: (a) contacting the mixture with a target under conditions favorable for binding: (b) partitioning unbound nucleic acids from those nucleic acids that have bound to the target; (c) amplifying the bound nucleic acids to yield a ligand-enriched mixture of nucleic acids; and, optionally, (d) reiterating the steps of contacting, partitioning and amplifying through as many cycles as desired to yield highly specific, high affinity aptamers to the target.
- SELEXTM Systematic Evolution of Ligands by Exponential Enrichment
- the amplification step of the SELEX method includes the steps of; (i) reverse transcribing the nucleic acids dissociated from the nucleic acid-target complexes or otherwise transmitting the sequence information into a corresponding DNA sequence; (ii) PCR amplification; and (iii) transcribing the PCR. amplified nucleic acids or otherwise transmitting the sequence information into a corresponding RNA sequence before restarting the process.
- the starting pool of nucleic acids can be modified or unmodified DN A, RNA or DNA/RNA hybrids, and acceptable modifications include modifications at a base, sugar and/or inter ueleotide linkage.
- composition of the starting pool is dependent upon the desired properties of the final aptamer. Selections can be performed with nucleic acid sequences incorporating modified nucleotides to, e.g., stabilize the aptamers against degradation in vivo. For example, resistance to nuclease degradation can be greatly increased by the incorporation of modifying groups at the 2'- position.
- the invention provides aptamers including single 2' substitutions at all bases or combinations of 2 '-OH, 2'-F, 2'-deoxy, 2' ⁇ NI3 ⁇ 4 a d 2'-OMe modifications of the adenosine triphosphate (ATP), guanosine triphosphate (GTP), cytidine triphosphate (CTP), thymidine triphosphate (TTP) and uridine triphosphate (UTP) nucleotides.
- ATP adenosine triphosphate
- GTP guanosine triphosphate
- CTP cytidine triphosphate
- TTP thymidine triphosphate
- UDP uridine triphosphate
- the invention provides aptamers including combinations of 2' -OH, 2'-F, 2'-deoxy, 2'-OMe, 2'-NH 2 and 2'-methoxyethyl modifications of the ATP, GTP, CTP, TTP and UTP nucleotides.
- the invention provides aptamers including all or substantially all 2'-OMe modified ATP, GTP, CTP, TTP and/or UTP nucleotides.
- 2 '-modified aptamers of the invention are created using modified polymerases, e.g., a modified RNA polymerase having a rate of incorporation of modified nucleotides having bulk ⁇ ' substituents at the furanose 2' position that is higher than that of wild-type polymerases.
- the modified RNA polymerase is a mutant T7 polymerase in which the tyrosine at position 639 has been changed to phenylalanine (Y639F).
- the modified RNA polymerase is a mutant T7 polymerase in which the tyrosine at, position 639 has been changed to phenylalanine and the lysine at position 378 has been changed to arginine (Y 639F/ 378R).
- the modified RNA polymerase is a mutant T7 polymerase in which the tyrosine at position 639 has been changed to phenylalanine, the histidine at position 784 has been changed to an alanine, and the lysine at position 378 has been changed to arginine (Y639F/H784A/K378R), and the transcription reaction mixture requires a spike of 2' -OH G ' TP for transcription.
- the modified RNA polymerase is a mutant T7 polymerase in which the tyrosine at position 639 has been changed to phenylalanine and the histidine at position 784 has been changed to an alanine (Y639F/H784A).
- the modified RNA polymerase is a mutant T7 polymerase in which the tyrosine at position 639 has been changed to leucine (Y639L).
- Y639L leucine
- the modified RNA polymerase is a mutant T7 polymerase in which the tyrosine at position 639 has been changed to leucine and the histidine at, position 784 has been changed to an alanine (Y639L/II784A).
- the modified RNA polymerase is a mutant T7 polymerase in which the tyrosine at position 639 has been changed to leucine, the histidine at position 784 has been changed to alanine, and the lysine at position 378 has been changed to arginine (Y639IJH784A/K378R).
- RNA polymerase having a rate of incorporation of modified nucleotides having bulky substituents at the furanose 2' position that is higher than that of wild- type polymerases is, for example, a mutant T3 RNA polymerase.
- the mutant T3 RNA polymerase has a mutation at position 640, wherein the tyrosine at position 640 is replaced with a phenylalanine (Y640F).
- the mutant T3 RNA polymerase has mutations at positions 640 and 785, wherein the tyrosine at position 640 is replaced with a leucine and the histidine at position 785 is replaced with an alanine
- 2'-modified oligonucleotides may be synthesized entirely of modified nucleotides or with a subset of modified nucleotides.
- the modifications can be the same or different.
- Some or all nucleotides may be modified, and those that are modified may contain the same modification.
- all nucleotides containing the same base may have one type of modification, while nucleotides containing other bases may have different types of modification.
- All purine nucleotides may have one type of modification (or are unmodified), while all pyrimidine nucleotides have another, different type of modification (or are unmodified).
- transcripts or pools of transcripts, are generated using any combination of modifications, including for example, ribonucleotides (2'-OH), deoxyribonucleotides (2'-deoxy), 2 '-amino nucleotides (2'-NH 2 ), 2'-fluoro nucleotides (2'-F) and 2'-0-methyl (2 '-OMe) nucleotides.
- modifications including for example, ribonucleotides (2'-OH), deoxyribonucleotides (2'-deoxy), 2 '-amino nucleotides (2'-NH 2 ), 2'-fluoro nucleotides (2'-F) and 2'-0-methyl (2 '-OMe) nucleotides.
- a transcription mixture containing only 2 '-OMe A, G, C and U and/or T triphosphates (2'-OMe ATP, 2'-OMe UTP and/or 2'-GMe TTP, 2'-OMe CTP and 2'-GMe GTP) is referred to as an MNA or mRmY mixture, and aptamers selected therefrom are referred to as MNA aptamers or mRmY aptamers and contain only 2'-0-methyl nucleotides.
- transcription mixture containing 2 '-OMe C and U and/or T, and 2' -OH A and G is referred to as an "rRrnY” mixture, and aptamers selected therefrom are referred to as “rRmY” aptamers.
- rRrnY aptamers selected therefrom
- rRmY aptamers selected therefrom
- dRmY aptamers selected therefrom
- a transcription mixture containing 2'-OMe A, C and U and/or T, and 2'-OH G is referred to as a "rGrriH” mixture, and aptamers selected therefrom are referred to as "rGmH” aptamers.
- a transcription mixture alternately containing 2'-OMe A, C, U and/or T and G, and 2'-OMe A, U and/or T, and C, and 2'-F G is referred to as an "alternating mixture”
- aptamers selected therefrom are referred to as "alternating mixture” aptamers.
- a transcription mixture containing 2'-OH A and G, and 2'-F C and U and/or T is referred to as an "rRfY” mixture, and aptamers selected therefrom are referred to as “rRfY” aptamers.
- a transcription mixture containing 2'- OMe A and G, and 2'-F C and U and/or T is referred to as an "mRfY” mixture, and aptamers selected therefrom are referred to as "mRfY” aptamers.
- a transcription mixture containing 2'- OMe A, U and/or T, and C, and 2'-F G is referred to as a "fGmH” mixture, and aptamers selected therefrom are referred to as "fGmH” aptamers.
- a transcription mixture containing 2'- OMe A, U and/ or T, C and G, where up to 10% of the G's are ribonucleotides is referred to as a "r/mGniH” mixture, and aptamers selected therefrom are referred to as "r/mGmH” aptamers.
- a transcription mixture containing 2 '-OMe A, U and/or T, and C, and deoxy G is referred to as a "dGmH” mixture, and aptamers selected therefrom are referred to as "dGniH” aptamers.
- a transcription mixture containing deoxy A, and 2 '-OMe C, G and U and/or T is referred to as a "dAmB” mixture, and aptamers selected therefrom are referred to as “dAmB” aptamers.
- a transcription mixture containing 2'-OH A, and 2'-OMe C, G and U and/or T is referred to as a "rAmB” mixture, and aptamers selected therefrom are referred to as "rAmB” aptamers.
- a transcription mixture containing 2' -OH A and 2' -OH G, and 2' -deoxy C and 2 '-deoxy T is referred to as an rRdY mixture, and aptamers selected therefrom are referred to as "rRdY' aptamers.
- a transcription mixture containing 2'-OMe A, U and/or T, and G, and deoxy C is referred to as a "dCmD" mixture, and aptamers selected there from are referred to as "dCmD" aptamers.
- a transcription mixture containing 2 , -GMe A, G and C, and deoxy T is referred to as a "dTmV” mixture, and aptamers selected there from are referred to as “dTmV” aptamers.
- a transcription mixture containing 2'-OMe A, C and G, and 2'-OH U is referred to as a "rUmV” mixture, and aptamers selected there from are referred to as “rUmV” aptamers.
- a transcription mixture containing 2'-OMe A, C and G, and 2'- deoxy U is referred to as a "dUmV” mixture, and aptamers selected therefrom are referred to as "dUmV” aptamers.
- a transcription mixture containing all 2'-OH nucleotides is referred to as a "rN” mixture, and aptamers selected therefrom are referred to as “rN”, “rRrY” or RNA aptamers.
- a transcription mixture containing all deoxy nucleotides is referred to as a “dN” mixture, and aptamers selected therefrom are referred to as “dN”, “dRdY” or DNA aptamers.
- a transcription mixture containing 2'-F C and 2'-OMe A, ( ⁇ and U and/or T is referred to as a "fCmD" mixture, and aptamers selected therefrom are referred to as "fCmD” aptamers.
- a transcription mixture containing 2'-F U and 2'-OMe A, G and C is referred to as a "fUmV mixture, and aptamers selected therefrom are referred to as "fUmV” aptamers.
- a transcription mixture containing 2'-F A and G, and 2'-OMe C and U and/or T is referred to as a "fRmY” mixture, and aptamers selected therefrom are referred to as "fRmY” aptamers.
- a transcription mixture containing 2'-F A and 2'-OMe C, G and U and/or T is referred to as a "f ArtiB” mixture, and aptamers selected therefrom are referred to as "fAniB” aptamers.
- a leader sequence can be incorporated into the fixed sequence at the 5 ' end of a DNA transcription template.
- the leader sequence is typically 6-15 nucleotides long, e.g., 6, 7, 8, 9, 10, 1 1, 12, 13, 14 or 15 nucleotides long, and may be composed of all purines, or a mixture of purine and pyrimidine nucleotides.
- compositions that contain 2'-QMe GTP another useful factor can be the presence or concentration of 2'-OH guanosine or guaiiosine monophosphate (GMP).
- GMP guaiiosine monophosphate
- Transcription can be divided into two phases: the first phase is initiation, during which the RNA is extended by about 10-12 nucleotides; the second phase is elongation, during which transcription proceeds beyond the addition of the first about 10-12 nucleotides. It has been found that 2'-OH GMP or guanosine added to a transcription mixture containing an excess of 2'-OMe GTP is sufficient to enable the polymerase to initiate transcription.
- GMP 2'-QH guanosine e.g., or GMP is useful due to the specificity of the polymerase for the initiating nucleotide.
- the preferred concentration of GMP is 0.5 mM and even more preferably 1 mM.
- reagents that can be included in the transcription reaction include buffers such as N-2-hydroxyethylpiperazine-N'-2-ethanesulfonic acid (HEPES) buffer, a redox reagent such as dithiothreitol (DTT), a polycation such as spermidine, spermine, a surfactant such as Triton XI 00, and any combinations thereof.
- buffers such as N-2-hydroxyethylpiperazine-N'-2-ethanesulfonic acid (HEPES) buffer
- DTT dithiothreitol
- a polycation such as spermidine, spermine
- surfactant such as Triton XI 00
- the HEPES buffer concentration can range from 0 to 1 M.
- the invention also contemplates the use of other buffering agents having a p a between 5 and 10, including, for example, Tris-hydroxymemyl-aminomefhane.
- the DTT concentration can range from 0 to 400 mM.
- the methods of the invention also provide for the use of other reducing agents, including, for example, mercaptoethanol.
- the spermidine and/or spermine concentration can range from 0 to 20 mM. In some
- the PEG-8000 concentration can range from 0 to 50 % (w/ ' v).
- the methods of the invention also provide for the use of other hydrophilic polymers, including, for example, other molecular weight PEGs or other polyalkylene glycols.
- the Triton X-100 concentration can range from 0 to 0.1% (w/v).
- the methods of the invention also provide for the use of other non-ionic detergents, including, for example, other detergents, including other Triton-X detergents.
- the MgCl 2 concentration can range from 0.5 mM to 50 mM.
- the MnCl 2 concentration can range from 0.15 mM to 15 mM.
- the 2'-QMe NTP concentration (each NTP) can range from 5 ⁇ to 5 mM.
- the 2'-OH GTP concentration can range from 0 ⁇ to 300 ⁇ .
- the 2'-QII GMP concentration can range from 0 to 5 mM.
- the pH can range from pH 6 to pH 9.
- V ariations of the SELEX process may also be used to identify aptamers. For example, one may use agonist SELEX, toggle SELEX, 2'-Modified SELEX or Counter SELEX. Each of these variations of the SELEX process is known in the art.
- the invention includes nucleic acid aptamers, preferably of 20-55 nucleotides in length, that bind to tissue factor pathway inhibitor (TFPI) and which, in some embodiments, functionally modulate, e.g., stimulate, block or otherwise inhibit or stimulate, the activity of TFPI.
- TFPI tissue factor pathway inhibitor
- the TFPI aptamers bind at, least in part to TFPI or a variant or one or more portions (or regions) thereof.
- the TFPI aptamers may bind to or otherwise interact with a linear portion or a conformational portion of TFPI.
- a TFPI aptamer binds to or otherwise interacts with a linear portion of TFPI when the aptamer binds to or otherwise interacts with a contiguous stretch of amino acid residues that are linked by peptide bonds.
- a TFPI aptamer binds to or otherwise interacts with a conformational portion of TFPI when the aptamer binds to or otherwise interacts with non-contiguous amino acid residues that are brought together by folding or other aspects of the secondary and/or tertiary structure of the polypeptide chain.
- a TFPI variant encompasses variants that perform essentially the same function as TFPI functions, preferably includes substantially the same structure and in some embodiments includes at least 70% sequence identity, preferably at least 80% sequence identity, more preferably at least 90% sequence identity, and more preferably at least 95%, 96%, 97%, 98% or 99% sequence identity to the amino acid sequence of human TFPI, which is shown in Figure 5 as SEQ ID NO: 11.
- the TFPI aptamers bind to full length TFPI. If an aptamer binds to one or more portions of TFPI, it is preferable that the aptamer require binding contacts or other interaction with a portion of TFPI, at least in part, outside of the l and K2 regions, such as the K3/C-terminaI region.
- the TFPI aptamers may bind to or otherwise interact with a linear portion or a conformational portion of TFPI.
- a TFPI aptamer binds to or otherwise interacts with a linear portion of TFPI when the aptamer binds to or otherwise interacts with a contiguous stretch of amino acid residues that are linked by peptide bonds.
- a TFPI aptamer binds to or otherwise interacts with a conformational portion of TFPI when the aptamer binds to or otherwise interacts with non-contiguous amino acid residues that are brought together by folding or other aspects of the secondary and/or tertiary structure of the polypeptide chain.
- the TFPI aptamers bind at least in part to one or more portions of mature TFPI (for example, Figure 3 A) that are selected from the group consisting of: amino acids 148-170, amino acids 150-170, amino acids 155-175, amino acids 160-180, amino acids 165-185, amino acids 170-190, amino acids 175-195, amino acids 1 80-200, amino acids 185-205, amino acids 190- 210, amino acids 195-215, amino acids 200-220, amino acids 205-225, amino acids 210-230, amino acids 215-235, amino acids 220-240, amino acids 225-245, amino acids 230-250, amino acids 235-255, amino acids 240-260, amino acids 245-265, amino acids 250-270, amino acids 255-275, amino acids 260-276, amino acids 148-175, amino acids 150-175, amino acids 150- 180, amino acids 150-185, amino acids 150-190, amino acids 150-195, amino acids 150-200, amino acids 150-205, amino acids 150-210, amino acids 148
- the TFPI may be from any species, but is preferably human.
- the TFPI aptamers preferably comprise a dissociation constant for human TFPI, or a variant thereof, of less than 100 ⁇ , less than 1 ⁇ , less than 500 nM, less than 100 nM, preferably 50 nM or less, preferably 25 nM or less, preferably 10 nM or less, preferably 5 nM or less, more preferably 3 nM or less, even more preferably 1 n or less, and most preferably 500 pM or less.
- the dissociation constant is determined by dot blot titration.
- the TFPI aptamers ma ⁇ ' be ribonucleic acid, deoxyribonucleic acid, modified nucleic acids (for example, 2 , -modified) or mixed ribonucleic acid, deoxyribonucleic acid and modified nucleic acids, or any combination thereof.
- the aptamers m ⁇ ' be single stranded ribonucleic acid, deoxyribonucleic acid, modified nucleic acids (for example, 2'-modified), ribonucleic acid and modified nucleic acid, deoxyribonucleic acid and modified nucleic acid, or mixed ribonucleic acid, deoxyribonucleic acid and modified nucleic acids, or any combination thereof.
- the TFPI aptamers comprise at least one chemical
- the chemical modification is selected from the group consisting of: a chemical substitution at a sugar position, a chemical substitution at an internucleotide linkage and a chemical substitution at a base position. In other embodiments, the chemical modification is selected from the group consisting of; incorporation of a modified nucleotide; a 3' cap; a 5' cap; conjugation to a high molecular weight, non-immunogenic compound; conjugation to a lipophilic compound; incorporation of a CpG motif; and
- the non-immunogenic, high molecular weight compound is po!yalkylene glycol, and more preferably is polyethylene glycol (PEG).
- the polyethylene glycol is inethoxypolyethylene glycol (rnPEG).
- the 3 ' cap is an inverted deoxythymidine cap,
- the modifications described herein may affect aptamer stability, e.g., incorporation of a capping moiety may stabilize the aptamer against endomiclease degradation. Additionally, the modifications described herein may affect the binding affinity of an aptamer to its target, e.g., site specific incorporation of a modified nucleotide or conjugation to a PEG may affect binding affinity.
- binding affinity can be determined using a variety of art-recognized techniques, such as, e.g., functional assays, such as an ELISA, or binding assays in which labeled trace aptamer is incubated with varying target concentrations and complexes are captured on nitrocellulose and quantitated, to compare the binding affinities pre- and post-incorporation of a modification.
- functional assays such as an ELISA
- binding assays in which labeled trace aptamer is incubated with varying target concentrations and complexes are captured on nitrocellulose and quantitated
- the TFP1 aptamers bind at least in part to TFPI or a variant or one or more portions thereof and act as an antagonist to inhibit the function of TFPI.
- the TFPI aptamers completely or partially inhibit, reduce, block or otherwise modulate TFPI-mediated inhibition of blood coagulation.
- the TFPI aptamers are considered to complete! ⁇ ' modulate, block, inhibit, reduce, antagonize, neutralize or otherwise interfere with TFPI biological activity, such as TFPI-mediated inhibition of blood coagulation, when the level of TFPI-mediated inhibition in the presence of the TFPI aptamer is decreased by at least 95%, e.g., by 96%, 97%, 98%, 99% or 100% as compared to the level TFPI-mediated inhibition in the absence of the TFPI aptamer.
- the TFPI aptamers are considered to partial! ⁇ ' modulate, block, inhibit, reduce, antagonize, neutralize or otherwise interfere with TFPI biological activity, such as TFPI-mediated inhibition, when the level of TFPI-mediated inhibition in the presence of the TFPI aptamer is decreased by less than 95%, e.g., 10%, 15%, 20%, 25%, 30%, 35%, 40%, 45%, 50%, 55%, 60%, 65%, 70%, 75%, 80%, 85% or 90% as compared to the level ofTFPI activity in the absence of the TFPI aptamer,
- aptamers that bind to and modulate the function of TFPI for use as therapeutics and/or diagnostics include, but are not limited to, ARC26835, ARC 17480,
- the TFPI aptamers comprise one of the following nucleic acid sequences; (ARC26835)
- dN is a deoxynucleotide and "mN” is a 2 -0 Methyl containing nucleotide (which is also known in the art as a 2'-QMe, 2'-methoxy or 2'-OCFl3 containing nucleotide); and
- niU-mA-niG-mG-rnlJ-inG-dC-mG-mU-niA-mU-mA-rnlJ-mA-NH-PEG20 (SEQ ID NO: 6), wherein "dN” is a deoxyniicleotide, “rriN” is a 2 -0 Methyl containing nucleotide, "NH” is from a hexylamine linker phosphoramidite and "PEG” is a polyethylene glycol; and
- PEG40K-NH-mG-mG-iiiA-mA-mU-mA- mU-niA ⁇ mG-mG-mU-mG-mC-mG-mU-iTLA ⁇ mU-niA ⁇ mU-mA-3T (SEQ ID NO: 10), wherein "NH” is from a 5'-hexylamine linker phosphoramidite, "3T” is an inverted deoxythymidine, "dN” is a deoxynucleotide, "mN” is a 2'-0 Methyl containing nucleotide and "PEG” is a polyethylene glycol.
- ARC26835 The chemical name of ARC26835 is 2'-0Me-guanylyl-(3' ⁇ 5')-2'-0Me-guanylyl- (3' ⁇ 5 2'-OMe-adenylyl-(3' ⁇ 5 2'-OMe-adenylyH
- ARC 17480 The chemical name of ARC 17480 is 2'-OMe-guanylyl-(3' ⁇ 5')-2'-OMe-guanylyl- (3' ⁇ 5 2'-OMe-adenyiyl-(3' ⁇ 5 2'-OMe-adenylyl-(3 ' ⁇ 5')-2'-OMe-uracylyl-(3 ' ⁇ 5 ')-2 '- OMe-adenylyl-(3 ' ⁇ 5')-2'-OMe-u ⁇
- ARC 19498 is 6-aminohexylyl-(l ---+5')-2'-O e-guanylyl-
- ARC 19499 N-(methoxy-polyethyleneglycoi)-6- aminohexylyl-i ⁇ S ⁇ '-OMe-guanylyi-CS ⁇ S ⁇ '-OMe-guanylyl-iS ⁇ S ⁇ '-OMe-adenylyi-
- A. C 19500 is 6 ⁇ arnmohexylyl ⁇ (l ⁇ 5')-2'-QMe ⁇ guanylyl ⁇ (3' ⁇ 5 ')-2'-OMe-guanylyl-(3' ⁇ 5 2'-OMe-adenylyl-(3 ' ⁇ 5 2'-OMe-adenylyl-(3 ' ⁇ 5 2'- OMe-uracylyl-(3' ⁇ 5
- ARC19501 N-(methoxy-polyethylenegiycoi)-6- aminohexylyl-(l- ⁇ 5 2'-OMe-guanyM ⁇
- the chemical name of ARC31301 is 2'-OMe-guanylyl-(3' ⁇ 5 2'-OMe-guanylyl-
- ARC 19881 is 6-aminohexylyl-(l - ⁇ 5")-2'-OMe-guanylyl- (3' ⁇ 5 -2'-OMe-guanylyl-(3' ⁇ 5 -2'-OMe-adenylyl-(3' ⁇ 5 -2'-OMe-aden ⁇
- ARC19882 is N-(methoxy-polyethylenegiycol)-6- aminohexy lyl-( 1 ⁇ 5 ')-2 ' -OMe-guanylyl-(3 ' ⁇ 5 2 ' -OMe-guanyly l-(3 ' ⁇ 5 ')-2'-OMe-adeiiylyl- (3 ' ⁇ 5 ')-2'-OMe-adenylyl-(3 ' ⁇ 5 ')-2 '-OMe-uracylyl-(3 ' ⁇ 5 ')-2'-OMe-adenylyl-(3 ' ⁇ 5 2 '- OMe-uracy lyi-(3 ' ⁇ 5 ')-2 ' -OMe-adenylyl-(3 ' ⁇ 5 ')-2 ' -deoxycytidylyl-(3 ' ⁇ 5 ')-2'-OMe-uracylyl- (3' ⁇ ⁇
- the TFP I aptamers of the invention may have any secondary structure.
- the TFPi aptamers comipise a stem and a loop motif, such as in Figure I OA and B.
- the putati ve secondary structure of ARC 39499 is depicted in Figure 30C, which comprises a stem and a loop motif.
- the TFPI aptamers are connected to one or more PEG moieties, with ( Figure 10B) or without ( Figure 10A) one or more linkers.
- the PEG moieties may be any type of PEG moiety.
- the PEG moiety may be linear, branched, multiple branched, star shaped, comb shaped or a dendrimer.
- the PEG moiety may have any molecular weight.
- the PEG moiety has a molecular weight ranging from 5-100 kDa in size. More preferably, the PEG moiety has a molecular weight ranging from 10-80 kDa in size.
- the PEG moiety has a molecular weight ranging from 20-60 kDa in size. Yet even more preferably, the PEG moiety has a molecular weight ranging from 30-50 kDa in size. Most preferably, the PEG moiety has a molecular weight of 40 kDa in size.
- the same or different PEG moieties may be connected to a TFPI aptamer. The same or different linkers or no linkers may be used to connect the same or different PEG moieties to a TFPI aptamer
- the TFPI aptamers may be connected to one or more PEG alternatives (rather than to one or more PEG moieties), with or without one or more linkers.
- PEG alternatives include, but are not limited to, polyoxazolme (POZ), PolyPEG, hydroxy ethylstarch (HES) and albumin.
- POZ polyoxazolme
- HES hydroxy ethylstarch
- the PEG alternative may be any type of PEG alternative, but it should function the same as or similar to a PEG moiety, i.e. , to reduce renal filtration and increase the half-life of the TFPI aptamer in the circulation.
- the same or different PEG alternatives may be connected to a TFPI aptamer.
- the same or different linkers or no linkers may be used to connect the same or different PEG alternatives to a TFPI aptamer.
- a combination of PEG moieties and PEG alternatives may be connected to a TFPI aptamer, with or without one or more of the same or different linkers.
- the TFPI aptamers are connected to a PEG moiety via a linker ( Figure S OB).
- the TFPI aptamers rnay be connected to a PEG moiety directly, without the use of a linker ( Figure l OA).
- the linker may be any type of molecule. Examples of linkers include, but are not limited to, amines, thiols and azides.
- amines (R H 2 ) and activated esters ( R “ ( ( 0 )( ) “” ) or anhydrides ( R V ⁇ ( ) ⁇ ( )( ' ( 0 )R “ ) can be used as linkers to yield an amide ( R' ⁇ ( : 0)NR).
- Activated esters include, without limitation, NHS (N- hydroxysuccinimide) and sulfo derivatives of NHS, nitrophenyl esters and other substituted aromatic derivatives.
- Anhydrides can by cyclic, such as succinic acid anhydride derivatives.
- Amines (RNI3 ⁇ 4) and activated carbonates (R'OC( ::: 0)OR”) can be used to yield carbamates (ROC( :::: 0)NR).
- Activated carbamates include, without limitation, NHS (N-hydroxysuccinimide) and sulfo derivatives of NHS, nitrophenyl carbamates.
- Amines (RNH 2 ) and suifonyl chlorides (R'S0 2 C1) can be used as linkers to yield sulfoamides (R'S0 2 NHR).
- Amines (RNH 2 ) and epoxides and oxiranes can be used as linkers to give a-hydroxyamines.
- Thiols (RSH) and iodoacet ls (R.'(C :::: 0)CH 2 I) can be used as linkers to yield thioethers (R.SCH 2 (0 :::: C)R').
- Thiols (RSH) and maleiraides or maleimide derivatives can be used as linkers to give thioethers.
- Thiols (RSH) and aziridines can be used as linkers to give -amine thioethers.
- Thiols (RSH) and vinylsulfones (CH 2 :::: CHS0 2 R.') can be used as linkers to yield thiol ethers (RSCH 2 CH 2 S0 2 R').
- the linker contains a phosphate group.
- the linker is from a 5'- amine linker phosphoramidite.
- the 5 '-amine linker phosphoramidite comprises 2-18 consecutive CH 2 groups.
- the 5 '-amine linker phosphoramidite comprises 2-12 consecutive CH 2 groups.
- the 5 '-amine linker phosphoramidite comprises 4-8 consecutive CH 2 groups.
- the 5 '-amine linker phosphoramidite comprises 6 consecutive CH 2 groups, i.e. , is a 5'-hexylamine linker phosphoramidite.
- One or more of the same or different linkers or no linkers may be used to connect one or more of the same or different PEG moieties or one or more of the same or different, PEG alternatives to a TFPI aptamer.
- an aptamer, or a salt, thereof, comprising the following structure is provided:
- the 20KPEG moiety can be any PEG moiety having a molec ular weight of 20 kDa.
- the 20KPEG moiety is a mPEG moiety having a molecular weight of 20 kDa.
- the aptamer, or a salt thereof comprises the following structure:
- HN ⁇ , ⁇ / " PQ 3 H is from a 5 '-amine linker phosphoramidite
- the aptamer has the nucleic acid sequence of mG-mCi-mA-mA-mU-mA-mlJ-mA-dO mU-mU-mG-mG-dC-mlJ-dC-mG-mU-mU-mA-mG-mG-mlJ-mG-dC-mG-mL -mA-mU-niA- mU-mA-3T (SEQ ID NO: 2), wherein "3T” is an inverted deoxythymidine, "dN" is a
- the 5 '-amine linker phosphoramidite comprises 2-18 consecutive CH 2 groups. In more preferred embodiments, the 5 '-amine linker phosphoramidite comprises 2-12 consecutive CH 2 groups. In even more preferred embodiments, the 5 '-amine linker phosphoramidite comprises 4-8 consecutive CH 2 groups. In most preferred embodiments, the 5 '-amine linker phosphoramidite comprises 6 consecutive CH 2 groups.
- the 20KPEG moiety can be any PEG moiety having a molecular weight of 20 kDa. Preferably, the 20KPEG moiety is a mPEG moiety having a molecular weight of 20 kDa.
- the aptamer, or a salt thereof comprises the following structure:
- HN nn , ,,j PO 3 H is from a 5 '-amine linker phosphoramidite
- the aptamer has the nucleic acid sequence of mG-mG-mA-mA ⁇ mU ⁇ mA-mU-mA-dC- mU ⁇ mU-niG-mG-mC-niU-dC-inG-inU-mU ⁇ niA-mG-niG-mIJ-mG-inC-mG-inU-inA ⁇ mU ⁇ mA ⁇ mU-mA-3T (SEQ ID NO: 8), wherein "3T” is an inverted deoxythyrnidine, "dN" is a
- deoxynucleotide and "rtiN" is a 2'-0 Methyl containing nucleotide.
- the 5 '-amine linker phosp oramidite comprises 2-18 consecutive CH 2 groups.
- the 5 '-amine linker phosphoramidite comprises 2-12 consecutive CH 2 groups.
- the 5 '-amine linker phosphoramidite comprises 4-8 consecutive CH 2 groups.
- the 5 '-amine linker phosphoramidite comprises 6 consecutive (T3 ⁇ 4 groups.
- the 20K.PEG moiety can be any PEG moiety having a molecular weight of 20 kDa.
- the 20 PEG moiety is a mPEG moiety having a molecular weight of 20 kDa.
- an aptamer, or a salt thereof, comprising the following structure is provided:
- the aptamer is a TFPI aptamer of the invention.
- the 20KPEG moiety can be any PEG moiety having a molecular weight of 20 kDa.
- the 20KPEG moiety is a mPEG moiety having a molecular weight, of 20 kDa.
- the aptamer, or a salt thereof comprises the following structure:
- HN 'VWA ⁇ P0 2 H is from a 5 '-amine linker phosphoramidite
- the aptamer has the nucleic acid sequence of mG-mG-m A-m A-mU-raA-mU-mA-dC- mU-mU-mG-mG-dC mU-dC-mG-mU-mU-mA-m
- the 5 '-amine linker phosphoramidite comprises 2- 18 consecutive CH 2 groups.
- the 20 PEG moiety can be any PEG moiety having a molecular weight of 20 kDa.
- the 20 PEG moiety is a mPEG moiety having a molecular weight of 20 kDa.
- an aptamer, or a salt thereof, comprising the following structure is provided: , wherein the aptamer is a TFPI aptamer of the invention.
- the 20KPEG moiety' can be any PEG moiety having a molecular weight of 20 kDa.
- the 20KPEG moiety is a mPEG moiety having a molecular weight of 20 kDa.
- the aptamer, or a salt thereof comprises the following structure:
- the aptamer has the nucleic acid sequence of mG-mG-iriA-mA-mU-mA-mU- iTiA-dC-mU-mU-niG-mG-dC-mU-dC-mG-m mA-mU-mA-3 T (SEQ ID NO: 2), wherein "3T” is an inverted deoxythymidine, "dN” is a deoxynucleotide and "mN” is a 2 -0 Methyl containing nucleotide.
- the 20KPEG moiety can be any PEG moiety having a molecular weight of 20 kDa.
- the 20KPEG moiety is a mPEG moiety having a molecular weight of 20 kDa.
- the aptamer, or a salt thereof comprises the following structure:
- the aptamer has the nucleic acid sequence of niG-mG-mA-mA-mU-im -mU- im -dC-mU-mU-niG-mG-mC-mU-dC-mG-mU-mU-im ⁇ mG-niG-mU-mG-mC-mG-mU-im - mU-mA-mU-mA-3T (SEQ ID NO: 8), wherein "3T” is an inverted deoxythymidine, "dN” is a deoxynucleotide and "mN” is a 2'-0 Methyl containing nucleotide.
- the 20KPEG moiety can be any PEG moiety having a molecular weight of 20 kDa.
- the 20KPEG moiety is a rnPEG moiety having a molecular weight of 20 kDa.
- an aptamer, or a salt thereof, comprising the following structure is provided:
- the 20KPEG moiety can be any PEG moiety having a molecular weight of 20 kDa.
- the 20KPEG moiety is a mPEG moiety having a molecular weight of 20 kDa.
- the aptamer, or a salt thereof comprises the following structure
- the aptamer has the nucleic acid sequence of mG-mG-mA-mA-mU-mA-mU- niA-dC-mL r -mU-mG-mG-dC-mU-dC-mG-mU-mU-iiiA.-mG-mG-mU-mG-dC-mG-mLl-inA-mU- mA-mli-mA (SEQ ID NO: 1), wherein "dN" is a deoxynucleotide and "mN" is a 2 -0 Methyl containing nucleotide.
- the 20KPEG moiety can be any PEG moiety having a molecular weight of 20 kDa, Preferably, the 2GKPEG moiety is a mPEG moiety having a molecular weight of kDa.
- an aptamer, or a salt thereof, comprising the following structure is provided:
- n ranges from 400-500 ethylene oxide units. More preferably, “n” ranges from 425-475 ethylene oxide units. Even more preferably, “n” ranges from 440-460 ethylene oxide units. Most preferably, "n” is 454 ethylene oxide units.
- the aptamer, or a salt thereof comprises the following structur
- the aptamer has the nucleic acid sequence of mG-mG-mA-mA-mlJ-mA-mL - mA-dC-mU-mL -mG-mG-dC-mU-dC-mG-mL -mU-niiA-mG-mG-mU-mG-dC-niG-mU-niA-mlJ- mA-mU-mA-3T (SEQ ID NO: 2), wherein "n” is approximately 450, "3T” is an inverted deoxythymidine, "dN” is a deoxynucleotide and "rnN” is a 2'-0 Methyl containing nucleotide.
- This aptamer is also known as ARC 19499.
- the aptamer, or a salt thereof comprises the following structur
- the aptamer has the nucleic acid sequence of rnCi-mCj-mA-mA-mU-mA-mU- mA-dC-mU-mL -mG-mG-mC-mL-dC-mG-mU-mij-mA-niG-mG-mlJ-mG-mC-mG-mlJ-mA- mU-mA-mU-mA-3T (SEQ ID NO: 8), wherein "n” is approximately 450, "3T” is an inverted deoxythymidine, "dN” is a deoxynueleotide and "mN” is a 2'-Q Methyl containing nucleotide.
- This aptamer is also known as ARC19882.
- "n” ranges from 400- 500 ethylene oxide units. More preferably, “n” ranges from 425-475 ethylene oxide units. Even more preferably, “n” ranges from 440-460 ethylene oxide units. Most preferably, "n” is 454 ethylene oxide units.
- the aptamer, or a salt thereof comprises the following structure:
- the aptamer has the nucleic acid sequence of mG-mG-mA-mA-mU-mA-mU- mAHlC-mU-mU-rnG-mG-dC ⁇ mU ⁇ dC ⁇ mG-m
- niA-mU-mA SEQ ID NO: 1
- niA-mU-mA SEQ ID NO: 1
- dN deoxynueleotide
- mN 2'-0 Methyl containing nucleotide.
- This aptamer is also known as ARC 19501.
- the invention also provides aptamers that have substantially the same ability to bind to TFPI as any one of the aptamers shown in SEQ ID NOs: 1, 2, 3, 4, 5, 6, 7, 8, 9 or 10.
- the aptamers have substantially the same structure as any one of the aptamers shown in SEQ ID NOs: 1, 2, 3, 4, 5, 6, 7, 8, 9 or 10.
- the aptamers have substantially the same ability to bind to TF I and substantially the same structure as any one of the aptamers shown in SEQ ) ID NOs: 1 , 2, 3, 4, 5, 6, 7, 8, 9 or 10.
- the invention also provides aptamers that have substantially the same ability to bind to TFPI and substantially the same ability to modulate a biological function of TFPI as any one of the aptamers shown in SEQ ID NOs: I , 2, 3, 4, 5, 6, 7, 8, 9 or 10.
- the invention further provides aptamers that have substantially the same ability to bind to TFPI and substantially the same ability to modulate blood coagulation as any one of the aptamers shown in SEQ ID NQs: 1, 2, 3, 4, 5, 6, 7, 8, 9 or 10.
- the invention also provides aptamers that have substantial! ⁇ ' the same structure and substantially the same ability to modulate a biological function of TFPI as any one of the aptamers shown in SEQ ID NOs: !
- the invention also provides aptamers that have substantially the same straeture and substantially the same ability to modulate blood coagulation as any one of the aptamers shown in SEQ ID NOs; !, 2, 3, 4, 5, 6, 7, 8, 9 or 10.
- the aptamers have substantially the same ability to bind to TFPI, substantially the same structure and substantially the same ability to modulate a biological function of TFPI as any one of the aptamers shown in SEQ ID NOs; 1 , 2, 3, 4, 5, 6, 7, 8, 9 or 10.
- the aptamers have substantially the same ability to bind to TFPI, substantially the same structure and substantially the same ability to modulate blood coagulation as any one of the aptamers shown in SEQ ID NOs; 1 , 2, 3, 4, 5, 6, 7, 8, 9 or 10.
- substantially the same ability to bind to TFPI means that the affinity is within one or two orders of magnitude of the affinity of the nucleic acid sequences and/or aptamers described herein. It is well within the skill of those of ordinary skill in the art to determine whether a given sequence has substantially the same ability to bind to TFPI.
- the aptamer that binds to TFPI has a nucleic acid sequence at least 70%, 80%, 90% or 95% identical to SEQ ID NOs: 1 , 2, 3, 4, 5, 6, 7, 8, 9 or 10.
- the ability of an aptamer to bind to TFPI may be assessed in a binding-competition assay, e.g., as described in Example 34, in which one of the aptamers shown in SEQ ID NOs: 1 , 2, 3, 4, 5, 6, 7, 8, 9 or 10 may be selected as the competitor acting as a control aptamer.
- a suitable assay may involve incubating 10 iiM human TFPI (American Diagnostics, Stamford, CT, catalog #4500PC) with trace amounts of radiolabeled control aptamer and 5000 iiM, 16667 iiM, 556 nM, 185 iiM, 61.7 iiM, 20.6 nM, 6.86 iiM, 2.29 iiM, 0.76 nM or 0.25 nM of unlabeled competitor aptamer.
- a control aptamer is included in each experiment. For each molecule, the percentage of radiolabeled control aptamer bound at each competitor aptamer concentration is used for analysis.
- the IC 50 of each aptamer is compared to the IC 50 of the control aptamer evaluated in the same experiment.
- An aptamer having substantially the same ability to bind may include an aptamer having an IC 50 that is within one or two orders of magnitude of the i ( ' -.. ⁇ , of the control aptamer, and/or an aptamer having an IC 50 that is not more than 5-fold greater than that of the control aptamer evaluated in the same experiment.
- an aptamer to modulate a biological function and/or to modulate blood coagulation may be assessed in a calibrated automated thrombogram (CAT) assay, e.g. , as described in Example 34, in which one of the aptamers shown in SEQ ID NOs: 1 , 2, 3, 4, 5, 6, 7, 8, 9 or 10 may be selected as a control aptamer.
- CAT calibrated automated thrombogram
- a suitable assay may involve evaluation in a CAT assay in pooled hemophilia A plasma at 500 M, 167 nM, 55.6 nM, 18.5 nM, 6.17 nM and 2.08 nM aptamer concentration.
- a control aptamer is included in each experiment.
- the endogenous thrombin potential (ETP) and peak thrombin values at each aptamer concentration are used for analysis.
- ETP or peak thrombin value for hemophilia A plasma alone is subtracted from the corresponding value in the presence of aptamer for each molecule at each concentration.
- y :::: ETP or peak thrombin
- x-concentration of aptamer max ::: the maximum ETP or peak thrombin
- An aptamer having substantially the same ability to modulate a biological function and/ or to modulate blood coagulation may include an aptamer having an IC 50 that is within one or two orders of magnitude of the IC 50 of the control aptamer, and/or an aptamer for which one or both of the ETP and peak thrombin IC 50 of that molecule are not more than 5-fold greater than that of the control aptamer evaluated in the same experiment.
- the ability of an aptamer to modulate a biological function and/or to modulate blood coagulation may be assessed by evaluating inhibition of TFPI in a Factor Xa (FXa) activity assay, e.g., as described in Example 34, in which one of the aptamers shown in SEQ ID NOs: 1 , 2, 3, 4, 5, 6, 7, 8, 9 or 10 may be selected as a control aptamer.
- FXa Factor Xa
- a suitable assay may involve measuring the ability of FXa to cleave a chromogenic substrate in the presence and absence of TFPI, with or without the additio of aptamer. For exampl e, 2 M human FXa is incubated with 8 nM human TFPI.
- the rate of FXa substrate cleavage in the presence of TFPI and the absence of aptamer is subtracted from the corresponding value in the presence of both TFPI and aptamer for each mol ecule at each concentration.
- V max the maximum rate of substrate cleavage, to generate an IC50 and maximum (V max ) value.
- the IC 50 and V max values of each aptamer are compared to the IC 50 and Vmax values of the control aptamer evaluated in the same experiment.
- An aptamer having substantially the same ability to modulate a biological function and/or to modulate blood coagulation may include an aptamer having an IC50 that is within one or two orders of magnitude of the IC50 of the control aptamer, and/or an aptamer having an ICso that is not more than 5-fold greater than that of the control aptamer evaluated in the same experiment, and/or an aptamer having a Vmax value not less than 80% of the V max value of the control aptamer evaluated in the same experiment.
- sequence identity in the context of two or more nucleic acid or protein sequences, refer to two or more sequences or subsequences that are the same or have a specified percentage of amino acid residues or nucleotides that are the same, when compared and aligned for maximum correspondence, as measured using one of the following sequence comparison algorithms or by visual inspection.
- sequence comparison typically one sequence acts as a reference sequence to which test sequences are compared.
- Optimal alignment of sequences for comparison can be conducted, e.g., by the local homology algorithm of Smith & Waterman, Adv. Appl. Math.
- BLAST basic local alignment search tool
- NCBI Biotechnology Information
- Aptamers of the invention including, but not limited to, aptamers identified by the SELEX 1'* ' method, 2 '-Modified SELEX m , minimized aptamers, optimized aptamers and chemically substituted aptamers, can be manufactured using any oligonucleotide synthesis technique that is well known in the art, such as solid phase oligonucleotide synthesis techniques (see, e.g., Gualtiere, F. Ed., New Trends in Synthetic Medicinal Chemistry, Ch. 9, Chemistry of Antisense Oligonucleotides, p. 261-335, 2000, Wiley-VCH, New York).
- aptamers using solid phase oligonucleotide synthesis techniques can also be done at commercial scale.
- Solution phase methods such as triester synthesis methods (see, e.g., Sood et al., Nucl. Acid Res. 4:2557 (1977) and Hirose el al, Tet. Lett., 28:2449 ( 1978)), may also be used to manufacture aptamers of the invention, as well as recombinant means.
- a variety of functional groups can be introduced during the solid phase synthesis.
- the functionality can be a simple linker that results in a functional group, such as an amine or thiol, or may be a more complex construct, such as a biotin or a fluorescent dye.
- phosphoramidite or they can be introduced post-synthetically (i.e., after solid phase synthesis).
- a variety of functionalities can be introduced at the 3 '-end of the oligonucleotide, thereby enabling a wider variety of conjugation techniques.
- the invention further provides aptamers that have been identified by the SELEX lM process, which comprises the steps of (a) contacting a mixture of nucleic acids with TFPI under conditions in which binding occurs; (b) partitioning unbound nucleic acids from those nucleic acids that have bound to TFPI; (c) amplifying the bound nucleic acids to yield a ligand-enriched mixture of nucleic acids; and, optionally, (d) reiterating the steps of binding, partitioning and amplifying through as many cycles as desired to obtain aptarner(s) that bind to TFPI.
- the invention further provides methods for identifying aptamers that bind at least in part to or otherwise interact with one or more portions of TFPI, which comprise the steps of (a) contacting a mixture of nucleic acids with one or more portions of TFPI under conditions in which binding occurs; (b) partitioning unbound nucleic acids from those nucleic acids that have bound to TFPI; (c) amplifying the bound nucleic acids to yield a ligand-enriehed mixture of nucleic acids; and, optionally, (d) reiterating the steps of contacting, partitioning and amplifying through as many cycles as desired, to obtain aptamer(s) that, bind to a portion of TFPI.
- This method may also include intervening or additional cycles with binding to full-length TFPI, followed by partitioning and amplification.
- the TFPI aptamers may bind to or otherwise interact with a linear portion or a conformational portion of TFPI.
- a TFPI aptamer binds to or otherwise interacts wi th a linear portion of TFPI when the aptamer binds to or otherwise interacts with a contiguous stretch of amino acid residues that are linked by peptide bonds.
- a TFPI aptamer binds to or otherwise interacts with a conformational portion of TFPI when the aptamer binds to or otherwise interacts with non-contiguous amino acid residues that are brought together by folding or other aspects of the secondary and/or tertiary structure of the polypeptide chain.
- the one or more portions of mature TFPI are selected from the group consisting of: amino acids 148-170, amino acids 150-170, amino acids 155-175, amino acids 160-180, amino acids 365-185, amino acids 170-190, amino acids 175-195, amino acids 180-200, amino acids 185-205, amino acids 190-210, amino acids 195- 215, amino acids 200-220, amino acids 205-225, amino acids 210-230, amino acids 215-235, amino acids 220-240, amino acids 225-245, amino acids 230-250, amino acids 235-255, amino acids 240-260, amino acids 245-265, amino acids 250-270, amino acids 255-275, amino acids 260-276, amino acids 148-175, amino acids 150-175, amino acids 150-180, amino acids 150- 185, amino acids 150-190, amino acids 150-195, amino acids 150-200, amino acids 150-205, amino acids 150-210, amino acids 150-215, amino acids 150-220, amino acids 150-225
- the aptamer preferably comprises a dissociation constant for human TFPI or a variant or one or more portions thereof, of less than 100 ⁇ , less than 1 ⁇ , less than 500 nM, less than 100 nM, preferably 50 nM or less, preferably 25 nM or less, preferably 10 nM or less, preferably 5 nM or less, more preferably 3 nM or less, even more preferably 1 nM or less, and most preferably 500 pM or less.
- the invention also provides methods for identifying aptarners that bind at least in part to or otherwise interact with one or more portions of TFPI, which comprise the steps of (a) contacting a mixture of nucleic acids with full -length TFPI or one or more portions of TFPI under conditions in which binding occurs; (b) partitioning unbound nucleic acids from those nucleic acids that have bound to full-length TFPI or one or more portions of TFPI; (c) specifically l using the bound nucleic acids with full-length TFPI or a portion of TFPI, or a ligand that binds to full-length TFPI or a portion of TFPI; (d) amplifying the bound nucleic acids to yield a ligand-enriched mixture of nucleic acids; and, optionally, (e) reiterating the steps of contacting, partitioning, eluting and amplifying through as many cycles as desired to obtain aptamer(s) that bind to one or more portions of TFPI
- a TFPI aptamer binds to or otherwise interacts with a linear portion of TFPI when the aptamer binds to or otherwise interacts with a contiguous stretch of amino acid residues that are linked by peptide bonds.
- a TFP I aptamer binds to or otherwise interacts with a conformational portion of TFPI when the aptamer binds to or otherwise interacts with non-contiguous amino acid residues that are brought together by folding or other aspects of the secondary and/or tertiary structure of the polypeptide chain.
- the one or more portions of mature TFPI are selected from the group consisting of: amino acids 148-170, amino acids 150-170, amino acids 155-175, amino acids 160-180, amino acids 165-185, amino acids 170-190, amino acids 175-195, amino acids 180-200, amino acids 185-205, amino acids 190-210, amino acids 195- 215, amino acids 200-220, amino acids 205-225, amino acids 210-230, amino acids 215-235, amino acids 220-240, amino acids 225-245, amino acids 230-250, amino acids 235-255, amino acids 240-260, amino acids 245-265, amino acids 250-270, amino acids 255-275, amino acids 260-276, amino acids 148-175, amino acids 150-175, amino acids 150-180, amino acids 150- 185, amino acids 150-190, amino acids 150-195, amino acids 150-200, amino acids 150-205, amino acids 150-210, amino acids 150-215, amino acids 150-220, amino acids 150-225
- the aptamer preferably comprises a dissociation constant for human TFPI or a variant or one or more portions thereof of less than 100 ⁇ , less than 1 ⁇ , less than 500 nM, less than 100 nM, preferably 50 nM or less, preferably 25 nM or less, preferably 10 nM or less, preferably 5 nM or less, more preferably 3 nM or less, even more preferably I nM or less, and most, preferably 500 pM or less.
- the invention further provides methods for identifying aptamers that bind at, least in part to or otherwise interact with one or more portions of TFPI, which comprise the steps of (a) contacting a mixture of nucleic acids with full -length TFPI or one or more portions of TFPI under conditions in which binding occurs in the presence of a TFPI ligand (a ligand that binds to TFPI) that blocks one or more epitopes on TFPI from aptamer binding; (b) partitioning unbound nucleic acids from those nucleic acids that have bound to full-length TFPI or one or more portions of TFPI; (c) amplifying the bound nucleic acids to yield a ligand-enriched mixture of nucleic acids; and, optionally, (d) reiterating the steps of contacting, partitioning and amplifying through as many cycles as desired to obtain aptamer(s) that bind to one or more portions of TFPI.
- inclusion of a TFPI ligand that blocks one or more portions on TFPI from aptamer binding can occur during the contacting step, the partitioning step, or both.
- the TFPI aptamers may bind to or otherwise interact with a linear portion or a conformational portion of TFPI.
- a TFPI aptamer binds to or otherwise interacts with a linear portion of TFPI when the aptamer binds to or otherwise interacts with a contiguous stretch of amino acid residues that are linked by peptide bonds.
- a TFPI aptamer binds to or otherwise interacts with a conformational portion of TFPI when the aptamer binds to or otherwise interacts with non-contiguous amino acid residues that are brought together by folding or other aspects of the secondary and/or tertiary structure of the polypeptide chain.
- the one or more portions of mature TFPI are selected from the group consisting of: amino acids 148-170, amino acids 150-170, amino acids 155-175, amino acids 160-180, amino acids 165-185, amino acids 170-190, amino acids 175-195, amino acids 180- 200, amino acids 185-205, amino acids 190-210, amino acids 195-215, amino acids 200-220, amino acids 205-225, amino acids 210-230, amino acids 215-235, amino acids 220-240, amino acids 225-245, amino acids 230-250, amino acids 235-255, amino acids 240-260, amino acids 245-265, amino acids 250-270, amino acids 255-275, amino acids 260-276, amino acids 148- 175, amino acids 150-175, amino acids 150-180, amino acids 150-185, amino acids 150-190, amino acids 150-195, amino acids 150-200, amino acids 150-205, amino acids 150-210, amino acids 150-215, amino acids 150-220, amino acids 150-225,
- the aptamer preferably comprises a dissociation constant for human TFPI or a variant or one or more portions thereof of less than 100 uM, less than I ⁇ . ⁇ , less than 500 nM, less than 100 M, preferably 50 nM or less, preferably 25 nM or less, preferably 1 0 nM or less, preferably 5 nM or less, more preferably 3 nM or less, even more preferably 1 nM. or less, and most preferably 500 pM or less.
- the invention further provides methods for identifying aptamers that bind at least in part to or otherwise interact with one or more portions of TFPI, which comprise the steps of (a) contacting a mixture of nucleic acids with full-length TFPI or one or more portions of TFPI under conditions in which binding occurs; (b) partitioning unbound nucleic acids from those nucleic acids that have bound to full-length TFPI or one or more portions of TFPI; (c) partitioning bound nucleic acids that have a desired functional property from bound nucleic acids that do not have a desired functional property; (d) amplifying the bound nucleic acids that have a desired functional property to yield a ligand-enriched mixture of nucleic acids; and, optionally, (e) reiterating the steps of contacting, partitioning, partitioning and amplifying through as many cycles as desired to obtain aptamer(s) that bind to one or more portions of TFPI.
- Steps (b) and (c) can occur sequentially or simultaneously.
- the TFPI aptamers m ⁇ ' bind to or otherwise interact with a linear portion or a conformational portion of TFPI.
- a TFPI aptamer binds to or otherwise interacts with a linear portion of TFPI when the aptamer binds to or otherwise interacts with a contiguous stretch of amino acid residues that are linked by peptide bonds.
- a TFPI aptamer binds to or otherwise interacts with a conformational portion of TFPI when the aptamer binds to or otherwise interacts with non-contiguous amino acid residues that are brought together by folding or other aspects of the secondary and/or tertiary structure of the polypeptide chain.
- the one or more portions of mature TFPI for example.
- Figure 3 A are selected from the group consisting of: amino acids 148-170, amino acids 150-170, amino acids 155-175, amino acids 160-180, amino acids 165-185, amino acids 170-190, amino acids 175-195, amino acids 180-200, amino acids 185-205, amino acids 190-210, amino acids 195- 215, amino acids 200-220, amino acids 205-225, amino acids 210-230, amino acids 215-235, amino acids 220-240, amino acids 225-245, amino acids 230-250, amino acids 235-255, amino acids 240-260, amino acids 245-265, amino acids 250-270, amino acids 255-275, amino acids 260-276, amino acids 148-175, amino acids 150-175, amino acids 150-180, amino acids 150- 185, amino acids 150-190, amino acids 150-195, amino acids 150-200, amino acids 150-205, amino acids 150-210, amino acids 150-215, amino acids 150-220, amino acids 150-225, amino acids 150-230, amino acids 150-235, amino acids 150-240
- the aptamer preferably comprises a dissociation constant for human TFPI or a variant or one or more portions thereof of less than 100 ⁇ , less than 1 ⁇ , less than 500 riM, less than 100 tiM, preferably 50 n or less, preferably 25 nM or less, preferably 10 nM or less, preferably 5 nM or less, more preferably 3 nM or less, even more preferably 1 nM or less, and most preferably 500 pM or less.
- the invention also provides an aptamer that binds to a human tissue factor pathway inhibitor (TFPI) polypeptide having the amino acid sequence of SEQ ID NO: 11, wherein the aptamer modulates TFPI-mediated inhibition of blood coagulation, and wherein the aptamer competes for binding to TFPI with a reference aptamer comprising a nucleic acid sequence selected from the group consistmg of: SEQ ID NO: 4 (ARC19499), SEQ ID NO: 1 (ARC26835), SEQ ID NO: 2 (ARC 17480), SEQ ID NO: 3 (ARC19498), SEQ ID NO: 5 (ARC19500), SEQ ID NO:6 (ARC19501), SEQ ID NO: 7 (ARC3 I301), SEQ ID NO: 8 (ARC18546), SEQ ID NO: 9 (ARC 19881) and SEQ ID NO: 10 (ARC 19882).
- the reference aptamer comprises the nucleic acid sequence of SEQ ID NO: 4 (ARC 19499).
- the invention further provides an aptamer that binds to a human tissue factor pathway inhibitor (TFPI) polypeptide having the amino acid sequence of SEQ ID NO: 11, wherein the aptamer binds to a linear portion or a conformational portion of TFPI in which at least a portion of the region recognized by the aptamer is different than the TFPI region bound by Factor Vila, Factor Xa, or both Factor Vila and Factor Xa.
- TFPI human tissue factor pathway inhibitor
- the aptamer binds to one or more regions comprising at least a portion of the amino acid sequence of SEQ ID NO; 11 selected from the group consisting of; amino acid residues 148-170, amino acid residues 150- 170, amino acid residues 155-175, amino acid residues 160-180, amino acid residues 165-185, amino acid residues 170-190, amino acid residues 175-195, amino acid residues 1 80-200, amino acid residues 185-205, amino acid residues 190-210, amino acid residues 195-215, amino acid residues 200-220, amino acid residues 205-225, amino acid residues 210-230, amino acid residues 215-235, amino acid residues 220-240, amino acid residues 225-245, amino acid residues 230-250, amino acid residues 235-255, amino acid residues 240-260, amino acid residues 245-265, amino acid residues 250-270, amino acid residues 255-275, amino acid residues 260-276, amino acid residues 148-175,
- the invention also provides an aptamer that binds to the same region on a human tissue factor pathway inhibitor (TFPI) polypeptide having the amino acid sequence of SEQ ID NO: 1 1 as the region bound by a TFPI aptamer comprising the nucleic acid sequence of SEQ ID NO 4 (ARC 19499).
- TFPI tissue factor pathway inhibitor
- the invention further provides an aptamer that binds to a region on a human tissue factor pathway inhibitor (TFPI) polypeptide comprising one or more portions of SEQ ID NO; 11 , wherein the one or more portions is selected from the group consisting of; amino acid residues 148-170, amino acid residues 150-170, amino acid residues 155-175, amino acid residues 160- 180, amino acid residues 165-185, amino acid residues 170-190, amino acid residues 175-195, amino acid residues 180-200, amino acid residues 185-205, amino acid residues 190-210, amino acid residues 195-215, amino acid residues 200-220, amino acid residues 205-225, amino acid residues 210-230, amino acid residues 215-235, amino acid residues 220-240, amino acid residues 225-245, amino acid residues 230-250, amino acid residues 235-255, amino acid residues 240-260, amino acid residues 245-265, amino acid residues 250-270, amino acid residues TFPI
- the invention additionally provides an aptamer that binds to human tissue factor pathway inhibitor (TFPI) and exhibits one or more of the following properties: a) competes for binding to TFPI with any one of SEQ ID NOs: 1-10; b) inhibits TFPI inhibition of Factor Xa; c) increases thrombin generation in hemophilia pl asma; d) inhibits TF PI inhibition of the intrinsic tenase complex; e) restores normal hemostasis, as measured by thromboelastography (TEG"*) in whole blood and plasma; f) restores normal clotting, as indicated by shorter clot time, more rapid clot formation or more stable clot development, as measured by thromboelastography (TEG"*) or rotational thromboelastometry (RQTEM) in whole blood and plasma; or g) decreases the clot time, as measured by dilute prothrombin time (dP ' T), tissue factor activated clotting
- the invention also provides an aptamer that binds to human tissue factor pathway inhibitor wherein the aptamer competes for binding to TFPI with a reference aptamer selected from the group consisting of: SEQ ID NO: 1 , SEQ ID NO: 2, SEQ ID NO: 3, SEQ ID NO: 4, SEQ ID NO: 5. SEQ ID NO: 6. SEQ ID NO: 7, SEQ ID NO: 8. SEQ ID NO: 9 and SEQ ID NO: 10.
- the invention further provides an aptamer that binds to tissue factor pathway inhibitor (TFPI) wherein the aptamer competes, either directly or indirectly, for binding to TFPI with a reference antibody selected from the group consisting of: AD4903.
- TFPI tissue factor pathway inhibitor
- the invention also provides an aptamer that binds to human tissue factor pathway inhibitor (TFPI) and comprises a stem and loop motif having the nucleotide sequence of SEQ ID NO: 4, wherein: a) any one or more of nucleotides 1, 2, 3, 4, 6, 8, 11 , 12, 13, 17, 20, 21, 22, 24, 28, 30 and 32 may be modified from a 2'-OMe substitution to a 2'-deoxy substitution; b) any one or more of nucleotides 5, 7, 15, 19, 23, 27, 29 and 31 may be modified from a 2'-OMe uracil to either a 2'-deoxy uracil or a 2'-deoxy thymine; c) nucleotide 18 may be modified from a 2'-OMe uracil to a 2'-deoxy uracil; and/or d) any one or more of nucleotides 14, 16 and 25 may be modified from a 2'-deoxy cytosine to either a 2'-O e
- the invention additionally provides an aptamer that binds to human tissue factor pathway inhibitor (TFPI) and comprises nucleotides 7-28 of SEQ ID NO: 2.
- TFPI tissue factor pathway inhibitor
- the invention further provides a method for treating a bleeding disorder comprising administering any one of the above aptamers.
- the invention futher provides an aptamer that binds to tissue factor pathway inhibitor (TFPI), wherein the aptamer comprises a primary nucleic acid sequence selected from the group consisting of SEQ ID NOs.: 4, 1 , 2, 3, 5, 6, 7, 8, 9 and 10.
- TFPI tissue factor pathway inhibitor
- a primary nucleic acid sequence of an aptamer refers solely to the nucleotides (adenine, guanine, cytosine, uracil, thymine), without any modifications (such as a 2'-0 Methyl, 2'-fluoro modification, 3T or PEG).
- aptamers that bind to TFPI are identified, several techniques may be optionally performed in order to further increase binding, stability, potency and/or functional characteristics of the identified aptamer sequences.
- Aptamers that bind to TFPI may be truncated in order to obtain the minimal aptamer sequence having the desired binding and/or functional characteristics (also referred to herein as a "minimized construct” or a “minimized aptamer”).
- One method of accomplishing this is by using folding programs and sequence analysis, e.g., aligning clone sequences resulting from a selection to look for consen'ed motifs and/or covariation to inform the design of minimized constructs.
- Suitable folding programs include, for example, the R A structure program
- Biochemical probing experiments can also be performed in order to determine the 5' and 3' boundaries of an aptamer sequence to inform the design of minimized constructs.
- Minimized constructs can then be chemically synthesized and tested for binding and functional characteristics, as compared to the non-minimized sequence from which they were derived.
- Variants of an aptamer sequence containing a series of 5', 3' and/or internal deletions may also be directly chemically synthesized and tested for binding and/or functional characteristics, as compared to the non-minimized aptamer sequence from which they were derived.
- doped reselections may be used to explore the sequence requirements within a single active aptamer sequence or a single minimized aptamer sequence. Doped reselections are performed using a synthetic, degenerate pool that has been designed based on the single sequence of interest. The level of degeneracy usually varies 70% to 85% from the wild type sequence, i.e., the single sequence of interest. In general, sequences with neutral mutations are identified through the doped reselection process, but in some cases sequence changes can result in improvements in affinity. The composite sequence information from clones identified using doped reselections can then be used to identify the minimal binding motif and aid in optimization efforts.
- Aptamer sequences and/or minimized aptamer sequences may also be optimized post- SELEX' using aptamer medicinal chemistry to perform random or directed mutagenesis of the sequence to increase binding affinity and/or functional characteristics, or alternatively to determine which positions in the sequence are essential for binding activity and/or functional characteristics.
- Aptamer medicinal chemistry is an aptamer improvement technique in which sets of variant aptamers are chemically synthesized. These sets of variants typically differ from the parent aptamer by the introduction of a single substituent, and differ from each other by the location of this substituent. These variants are then compared to each other and to the parent. Improvements in characteristics m ⁇ ' be profound enough that the inclusion of a single substituent may be all that is necessary to achieve a particular therapeutic criterion.
- the information gleaned from the set of single variants may be used to design further sets of variants in which more than one substituent is introduced simultaneous! ⁇ '.
- all of the single substituent variants are ranked, the top 4 are chosen and all possible double (6), triple (4) and quadruple (1) combinations of these 4 single substituent variants are synthesized and assayed.
- the best single substituent variant is considered to be the new parent, and all possible double substituent variants that include this highest-ranked single substituent variant are synthesized and assayed.
- Other strategies may be used, and these strategies may be applied repeatedly such that the number of substituents is gradually increased while continuing to identify further-improved variants.
- Aptamer medicinal chemistry may be used particularly as a method to explore the local, rather than the global, introduction of substituents. Because aptamers are discovered within libraries that are generated by transcription, any substituents that are introduced during the SELEXTM process must be introduced globally. For example, if it is desired to introduce phosphorothioate linkages between nucleotides then they can only be introduced at every A (or every G, C, T, U, etc.) if globally substituted. Aptamers that require phosphorothioates at some As (or some G, C, T, U, etc.) (locally substituted) but cannot tolerate it at other As (or some G, C, T, U, etc.) cannot be readily discovered by this process.
- substituents that can be utilized by the aptamer medicinal chemistry process are only limited by the ability to introduce them into an oligomer synthesis scheme. The process is certainly not limited to nucleotides alone.
- Aptamer medicinal chemistry schemes may include substituents that introduce steric bulk, hydrophobicity, hydrophiiieity, lipophilicity, lipophobicity, positive charge, negative charge, neutral charge, zwitterions, polarizability, nuclease-resistance, conformational rigidity, conformational flexibility, protein-binding characteristics, mass, etc.
- Aptamer medicinal chemistry schemes may include base- modifications, sugar-modifications or phosphodiester linkage-modifications.
- substitutions that fall into one or more of the following categories: (1) Substituents already present in the body, e.g., 2'-deoxy, 2'-ribo, 2'-0-methyl nucleotides, inosine or 5-methyl cytosine;
- the aptamers of the invention include aptamers developed through aptamer medicinal chemistry, as described herein.
- Target binding affinity of the aptamers of the invention can be assessed through a series of binding reactions between the aptamer and the target (e.g., a protein) in which trace j2 P- labeled aptamer is incubated with a dilution series of the target in a buffered medium and then analyzed by nitrocellulose filtration using a vacuum filtration manifold.
- the dot blot binding assay uses a three layer filtration medium consisting (from top to bottom) of nitrocel lulose, nylon filter and gel blot paper. Aptamer that is bound to the target is captured on the nitrocellulose filter, whereas the non-target bound aptamer is captured on the nylon filter.
- the gel blot paper is included as a supporting medium for the other filters.
- the filter layers are separated, dried and exposed on a phosphor screen and quantified using a phosphorimaging system.
- the quantified results can be used to generate aptamer binding curves from which dissociation constants ( D ) can be calculated, in a preferred embodiment, the buffered medium used to perform the binding reactions is I x Dulbecco's PBS (with Ca l+ and Mg ++ ) plus 0.1 mg/mL BSA.
- the ability of an aptamer to modulate the functional activity of a target can be assessed using in vitro and in vivo models, which will vary depending on the biological function of the target.
- the aptamers of the invention may inhibit a known biological function of the target.
- the aptamers of the invention may stimulate a known biological function of the target.
- the functional activity of aptamers of the invention can be assessed using in vitro and in vivo models designed to measure a known function of TFPI.
- Aptamer sequences and/or minimized aptamer sequences may also be optimized using metabolic profile directed aptamer medicinal chemistry for site-specific identification of cleavage sites and modifications to optimize stability of the aptamer sequences and/or minimized aptamer sequences,
- Metabolic profile directed aptamer medicinal chemistry involves incubating a parent aptamer with a test fluid to result in a mixture. Then, the mixture is analyzed to determine the rate of disappearance of the parent aptamer or the amount or percentage of aptamer remaining after incubation, the specific aptamer metabolic profile and the specific aptamer metabolite sequences. Knowledge of the sequences of the specific metabolites formed allows one to identify the sites of nuclease cleavage based on the mass of the metabolite(s). After
- the method involves introducing chemical substitutions or modifications at, or near the cleavage sites that, are designed to optimize the stability of the aptamer sequences and/or minimized aptamer sequences.
- an aptamer is identified and modified by a) incubating a parent aptamer with a test fluid to result in a mixture; b) analyzing the mixture to identify metabolites of the parent aptamer, thereby detecting at least one aptamer cleavage site in the parent aptamer; and c) introducing a chemical substitution at a position proximal to the at least one aptamer cl eavage site to result in a modified aptamer.
- the test fluid is a biological matrix, particularly a biological matrix selected from the group consisting of one or more of: serum; plasma; cerebral spinal fluid; tissue extracts, including cytosolic fraction, S9 fraction and microsomal fraction; aqueous humour; vitreous humour and tissue homogenates.
- the biological matrix is derived from a species selected from the group consisting of one or more of: mouse, rat, monkey, pig, human, dog, guinea pig and rabbit.
- the test fluid comprises at least one purified enzyme, particularly at least one purified enzyme selected from the group consisting of: snake venom phosphodiesterase and DNAse I.
- the analyzing step includes analyzing the resulting aptamer using liquid chromatography and mass spectrometry, particularly electron spray ionization liquid chromatography mass spectrometry, polyacrylamide gel electrophoresis or capillary
- electrophoresis to determine a position of at least one aptamer cleavage site.
- the analyzing step includes analyzing the resulting aptamer using a bioanalytical method selected from the group consisting of one or more of: denaturing polyacrylamide gel electrophoresis (PAGE); capillary electrophoresis; high performance liquid chromatography (HPLC) and liquid chromatography-mass spectrometry (LC/MS), particularly LC/MS/MS or LC/MS/MS/MS, and more particularly electrospray ionization LC/MS (ESI-LC/MS), ESI- LC/MS/MS and ESI-LC/MS/MS/MS.
- a bioanalytical method selected from the group consisting of one or more of: denaturing polyacrylamide gel electrophoresis (PAGE); capillary electrophoresis; high performance liquid chromatography (HPLC) and liquid chromatography-mass spectrometry (LC/MS), particularly LC/MS/MS or LC/MS/MS/MS, and more particularly electrospray ionization LC
- the proximal position includes a position selected from the group consisting of; a position immediately 5' to the aptamer cleavage site, a 5' position at or within three nucleotides of the aptamer cleavage site, a position immediately 3 ' to the aptamer cleavage site, a 3' position at or within three nucleotides of the aptamer cleavage site, and at the cleaved internucleotide linkage.
- the chemical substitution is selected from the group consisting of: a chemical substitution at a sugar position; a chermcal substitution at a base position and a chemical substitution at an internucleotide linkage. More particularly, a substitution is selected from the group consisting of: a nucleotide substituted for a different nucleotide; a purine substitution for a pyrrolidine; a 2 '-amine substitution for any nucleotide; a 2'-deoxy
- the introducing step of these methods further includes introducing more than one chemical substitution at one or more cleavage sites or at a single cleavage site or both.
- the introducing step of these methods further includes introducing at least one chemical substitution at the associated proximal position of the aptamer cleavage site determined to occur first in time during the incubating step or at any other cleavage site(s) that provides the desired properties upon introduction of a chemical substitution.
- these methods further include the step of testing the stability of the modified aptanier in the test fluid.
- aptanier stability is assessed by determining the percent of modified aptamer that remains intact in the test fluid as compared to the percent of the parent, aptamer that remains intact in the test fluid.
- the percent of intact, aptamer is assessed by a bioanalytical method selected from the group consisting of one or more of: denaturing polyacrylamide gel electrophoresis (PAGE); capillary electrophoresis; HPLC and LC/MS, particularly LC MS MS or LC/MS/MS/MS, and more particularly ESI-LC/MS, ESI-LC/MS/MS and ESI-LC/MS MS/MS.
- the modified aptamer is more stable in the test, fluid than the parent aptamer, preferably at least 2 fold, more preferably at least 5 fold and most preferably at least 10 fold more stable.
- these methods further include determining a dissociation constant or IC 50 of the modified aptamer for its target.
- chemical substitutions are introduced singly at each position or in various combinations in the aptamer, and the dissociation constant or IC 50 for each resulting aptamer is determined.
- Chemical substitutions are introduced at a position proximal to the aptamer cleavage site such that a single chemical modification results in a dissociation constant for the modified aptamer that is the same or l ess than that of the parent aptamer.
- the method includes selecting a modified aptamer having a dissociation constant or IC 50 for its target that is the same or less than that for the parent aptamer.
- the modified aptamer binds to a target having a biological activity
- the method further includes testing the biological activity of the target in the presence and absence of modified aptanier.
- the method further includes selecting a modified aptamer that binds to a target having a biological activity that is the same or better than that of the parent aptamer.
- the biological activity may be measured in any relevant assay, such as an ELISA assay or a cell-based assay.
- the incubating, analyzing, introducing and testing steps are repeated iteratively until the desired stability is achieved.
- the aptamers of the invention may be routinely adapted for diagnostic purposes according to any number of techniques employed by those skilled in the art. Diagnostic utilization ma ⁇ ' include both in vivo or in vitro diagnostic applications. Diagnostic agents need only be able to allow the user to identify the presence of a given target at a particular locale or concentration. Simply the ability to form binding pairs with the target may be sufficient to trigger a positive signal for diagnostic purposes. Those skilled in the art would also be able to adapt any aptamer by procedures known in the art to incorporate a labeling tag to track the presence of such ligand. Such a tag could be used in a number of diagnostic procedures,
- the invention provides aptamers that bind to TFPI and modulate its biological function
- TLR 9 Toll-like receptor 9
- oligodeoxynucleotide (“OD ”) CpG sequences in a sequence-specific manner.
- the recognition of CpG motifs triggers defense mechanisms leading to innate and ultimately acquired immune responses.
- activation of TLR 9 in mice induces acti vation of antigen presenting cells, up-regulation of MHC class I and II molecules, and expression of important co-stimulatory molecules and cytokines including IL- 12 and IL-23. This activation both directly and indirectly enhances B and T cell responses, including a robust up-regulation of the Till cytokine IFN- gamma.
- CpG ODNs can provide protection against infectious diseases, function as immuno-adjuvants or cancer therapeutics (monotherapy or in combination with a mAb or other therapies), and can decrease asthma and allergic response.
- Preferred immunostimulatory motifs are as follows (shown 5' to 3 ', left to right) wherein “r” designates a purine, “y” designates a pyrimidine, and "X” designates any nucleotide: AACGTTCGAG (SEQ ID NO; 12); AACGTT; ACGT; rCGy; rrCGyy; XCGX; XXCGXX; and XiX 2 CGYiY 2; wherein X s is G or A, X 2 is not C, Yj is not G and Y 2 is preferably T.
- the CpG is preferably located in a non-essential region of the aptamer.
- Non-essential regions of aptamers can be identified by site-directed mutagenesis, deletion analyses and/or substitution analyses. However, any location that does not significantly interfere with the ability of the aptamer to bind to the non-CpG target may be used.
- the CpG motif may be appended to either or both of the 5 ' and 3 ' ends or otherwise attached to the aptamer. Any location or means of attachment may be used as long as the ability of the aptamer to bind to the non-CpG target is not significantly interfered with.
- stimulation of an immune response can mean either (1) the induction of a specific response (e.g. , induction of a Thl response) or the production of certain molecules, or (2) the inhibition or suppression of a specific response (e.g. , inhibition or suppression of the Th2 response) or of certain molecules.
- Aptamers of the invention can be identified or generated by a variety of strategies using, e.g. , the SELEX' process described herein.
- the incorporated immunostimulatory sequences can be DNA, RNA, substituted DNA or RNA, and/or a combination of substituted or unsubstituted DNA/RNA.
- the strategies can be divided into two groups. For both groups of strategies, the CpG motifs are included to: a) stimulate the immune response to counteract situations where a repressed immune response is relevant to disease development, (i.e.
- immune deficiency diseases such as AIDS
- a stimulated immune response against a particular target or cell type i.e. , cancer cells
- an immune response towards a TH1 state and away from TH2 or ⁇ 7 state i.e. , including CpG motifs in an aptamer against an anti- allergy target such as IgE to counteract an allergic condition
- the strategies are directed to identifying or generating aptamers including both a CpG motif or other imrnunostimulatory sequence as well as a binding site for a target, where the target (hereinafter "non-CpG target”) is a target other than one known to recognize CpG motifs or other imrnunostimulatory sequences.
- the non-CpG target is a TFPI target.
- the first strategy of this group includes performing SELEX 1 to obtain an aptamer to a specific non-CpG target, preferably a target using an ol igonucleotide pool wherein a CpG motif has been incorporated into each member of the pool as, or as part of, a fixed region, e.g. , in some embodiments the randomized region of the pool members includes a fixed region having a CpG motif incorporated therein, and identifying an aptamer including a CpG motif.
- the second strategy of this group includes performing SELEXTM " to obtain an aptamer to a specific non-CpG target, and following selection, appending a CpG motif to the 5 ' and/ or 3 ' end or engineering a CpG motif into a region, preferably a non- essential region, of the aptamer.
- the third strategy of this group includes performing SELEX to obtain an aptamer to a specific non-CpG target, wherein during synthesis of the pool the molar ratio of the various nucleotides is biased in one or more nucleotide addition steps so that the randomized region of each member of the pool is enriched in CpG motifs, and identifying an aptamer including a CpG motif.
- the fourth strategy of this group includes performing SELEXTM to obtain an aptamer to a specific non-CpG target, and identifying an aptamer including a CpG motif.
- the fifth strategy of this group includes performing SELEX to obtain an aptamer to a specific non-CpG target, and identifying an aptamer which, upon binding, stimulates an immune response but that does not include a CpG motif.
- the strategies are directed to identifying or generating aptamers including a CpG motif and/or other sequences that are bound by the receptors for the CpG motifs (e.g. , TLR9 or the other toll-like receptors) and upon binding stimulate an immune response.
- the first strategy of this group includes performing SELEX to obtain an aptamer to a target known to bind to CpG motifs or other imrnunostimulatory sequences and upon binding stimulate an immune response using an oligonucleotide pool wherein a CpG motif has been incorporated into each member of the pool as, or as part of, a fixed region, e.g.
- the randomized region of the pool members include a fixed region having a CpG motif incorporated therein, and identifying an aptamer including a CpG motif.
- the second strategy of this group includes performing SELEX ' " to obtain an aptamer to a target known to bind to CpG motifs or other immiuiostimulatory sequences and upon binding stimulate an immune response and then appending a CpG motif to the 5' and/or 3' end or engineering a CpG motif into a region, preferably a non-essential region, of the aptamer.
- the third strategy of this group includes performing SELEX m to obtain an aptamer to a target known to bind to CpG motifs or other immunostimulatory sequences and upon binding stimulate an immune response, wherein during synthesis of the pool the molar ratio of the various nucleotides is biased in one or more nucleotide addition steps so that the randomized region of each member of the pool is enriched in CpG motifs, and identifying an aptamer including a CpG motif.
- the fourth strategy of this group includes performing SELEX " to obtain an aptamer to a target known to bind to CpG motifs or other immunostimulatory sequences and upon binding stimulate an immune response, and identifying an aptamer including a CpG motif.
- the fifth strategy of this group includes performing SELEX T" to obtain an aptamer to a target known to bind to CpG motifs or other immunostimulatory sequences, and identifying an aptamer which, upon binding, stimulates an immune response but that does not include a CpG motif.
- oligonucleotide-based therapeutics including aptamers
- Aptamers must be able to be distributed to target organs and tissues, and remain in the body (unmodified) for a period of time consistent with the desired dosing regimen.
- the invention provides materials and methods to affect the pharmacokinetics of aptamer compositions and, in particular, the ability to tune aptamer pharmacokinetics.
- the tunability of (i.e. , the ability to modulate) aptamer pharmacokinetics is achieved through conj gation of modifying moieties (e.g., PEG polymers) to the aptamer and/or the incorporation of modified nucleotides (e.g., 2'-fluoro or 2' ⁇ 0-methyI) or modified internucieotide linkages to alter the chemical composition of the aptamer.
- modifying moieties e.g., PEG polymers
- modified nucleotides e.g., 2'-fluoro or 2' ⁇ 0-methyI
- the ability to tune aptamer pharmacokinetics is used in the improvement of existing therapeutic applications, or alternatively, in the development of new therapeutic applications. For example, in some therapeutic applications, e.g., in anti- neoplastic or acute care settings where rapid drug clearance or turn-off may be desired, it is desirable to decrease the residence times of aptamers in the circulation. Alternatively, in other therapeutic applications, e.g., maintenance therapies where systemic circulation of a therapeutic is desired, it is desirable to increase the residence times of aptamers in the circulation.
- the tunability of aptamer pharmacokinetics is used to modify the disposition, for example the absorption, distribution, metabolism and elimination (ADME) of an aptamer to fit its therapeutic objective in a subject.
- Tunability of the pharmacokinetics of an aptamer can affect the manner and extent of absorption of the aptamer, the distribution of an aptamer throughout the fluids and tissues of the body, the successive metabolic transformations of the aptamer and its metabolite(s) and finally, the elimination of the aptamer and its metabolite(s).
- an aptamer therapeutic in some therapeutic applications, it may be desirable to alter the biodistribution of an aptamer therapeutic in an effort to target a particular type of tissue or a specific organ (or set of organs), or to increase the propensity to enter specific cell types.
- the aptamer therapeutic preferentially distributes into specific tissues and/or organs and accumulates therein to cause a therapeutic effect.
- PEGylation of an aptamer therapeutic e.g., PEGylation with a 20 kDa PEG polymer or other polymer or conjugation entity
- PEGyiated aptamer therapeutic preferentially accumulates in the inflamed tissue.
- aptamer therapeutics e.g., aptamer conjugates or aptamers having altered chemistries, such as modified nucleotides
- a variety of parameters are studied in normal subjects, e.g., test animals or humans, or in diseased subjects, e.g., TFPI-speeifie animal models, such as animal models of hypercoagulation or
- AUC refers to the area under the plasma concentration curve of an aptamer therapeutic versus the time after aptamer administration.
- the AUC value is used to estimate the exposure of the aptamer and also used to determine the bioavailability of an aptamer after an extravascular route of administration, such as, e.g. , subcutaneous
- Bioavailability is determined by taking the ratio of the AUG obtained after subcutaneous administration to the AUG obtained after intravenous administration and normalizing them to the doses used after each administration (i. e. , the percent ratio of aptamer administered after subcutaneous administration as compared to the same aptamer administered by intravenous administration at the same dose or normalized dose).
- the CL value is the measurement of the removal of the parent aptamer therapeutic from the systemic circulation.
- the volume of distribution (Vd) is a term that relates the amount of aptamer in the body at one time to its plasma concentration. The Vd is used to determine how well a drug is removed from the plasma and distributed to tissues and/or organs.
- Vd A larger Vd implies wide distribution, extensive tissue binding, or both a wide distribution and extensive tissue binding.
- the parameter that should ideally be measured is the Vdss because this parameter is independent of the elimination kinetics. If the Vss for the aptamer is larger than the blood volume, it suggests that the aptamer is distributed outside of the systemic circulation and is likely to be found in the tissues or organs. Pharmacodynamic parameters may also be used to assess drag characteristics.
- aptamer therapeutics e.g. , aptamer conjugates or aptamers having altered chemistries, such as modified nucleotides
- a tissue distribution stud ⁇ ' or quantitative whole body autoradiography using a radiolabeled aptamer that is administered to a normal animal or a diseased target specific animal model is used.
- the accumulation of the radiolabeled-aptamer at a specific site can be quantified.
- an aptamer described herein can be modulated in a controlled manner by conjugating an aptamer to a modulating moiety, such as, but not limited to, a small molecule, peptide, or polymer, or by incorporating modified nucleotides into an aptamer.
- a modulating moiety such as, but not limited to, a small molecule, peptide, or polymer
- the conjugation of a modifying moiety and/or altering nucleotide chemical composition alters fundamental aspects of aptamer residence time in circulation and distribution within and to tissues and cells.
- oligonucleotide therapeutics are subject to elimination via renal filtration.
- a nuclease-resistant oligonucleotide administered intra venously typically exhibits an in vivo half- life of ⁇ 30 minutes, unless filtration can be blocked. This can be accomplished by either facilitating rapid distribution out of the blood stream into tissues or by increasing the apparent molecular weight of the oligonucleotide above the effective size cut-off for the glomerulus.
- Conjugation of small molecular weight therapeutics to a PEG polymer (PEGylation), as described below, can dramatically lengthen residence times of aptamers in the circulation, thereby decreasing dosing frequency and enhancing effectiveness against vascular targets.
- Modified nucleotides can also be used to modulate the plasma clearance of aptamers.
- an unconjugated aptamer that incorporates for example, 2'-fluoro, 2'-OMe, and/or phosphorothioate stabil izing chemistries, which is typical of current generation aptamers as it exhibits a high degree of nuclease resistance in vitro and in vivo, displays rapid distribution into tissues, primarily into the liver and kidney, when compared to unmodified aptamer.
- nucleic acids with high molecular weight non-immunogenic polymers has the potential to alter the pharmacokinetic and pharmacodynamic properties of nucleic acids making them more effective and/or safer therapeutic agents.
- Favorable changes in activity can include increased resistance to degradation by nucleases, decreased filtration by the kidneys, decreased exposure to the immune system, and altered distribution of the therapeutic through the bod ⁇ '.
- the aptamer compositions of the invention may be derivatized with one or more polyalkylene glycol (“PAG”) moieties.
- PEG polyethylene glycol
- PEG polyethylene oxide
- PEG polypropylene glycol
- random or block copolymers of different alkyiene oxides can be used in many applications.
- a polyalkylene glycol, such as PEG is a linear polymer terminated at each end with hydroxy! groups; HO- CH2CH20-(CH 2 C3 ⁇ 40) ⁇ -03 ⁇ 401 ⁇ 4- ⁇ .
- This polymer alpha-, omega-dihydroxylpolyethylene glycol, can also be represented as HO-PEG-OH, where it is understood that the -PEG- symbol represents the following structural unit; -CH2CH 2 0-(CH 2 CH20) n -CH 2 CH 2 -, where n typically ranges from 4 to 10,000.
- PAG polymers suitable for therapeutic indications typically have the properties of solubility in water and in many organic solvents, lack of toxicity, and lack of immunogenicity.
- One use of PAGs is to covalently attach the polymer to insoluble molecules to make the resulting PAG-moleeule "conjugate" soluble.
- the water-insoluble drug paeliiaxel when coupled to PEG, becomes water-soluble.
- Greenwald, et at, J. Org. Chern., 60:331-336 (1995) PAG conjugates are often used not only to enhance solubility and stability, but also to prolong the blood circulation half-life of molecules and later distribution within the body.
- the PAG derivatized compounds conjugated to the aptamers of the invention are typically between 5 and 80 kDa in size, however any size can be used, the choice dependent on the aptamer and application.
- Other PAG derivatized compounds of the invention are between 10 and 80 kDa in size.
- the PAG moieties derivatized to compositions of the invention are PEG moieties having a molecular weight ranging from 5, 30, 15, 20, 25, 30, 35, 40, 45, 50, 55, 60, 65, 70, 75, 80, 85, 90, 95 or 100 kDa in size, in some embodiments, the PEG is linear PEG, while in other embodiments, the PEG is branched PEG. In still other embodiments, the PEG is a 40kDa branched PEG as depicted in Figure 6. In some embodiments, the 40 kDa branched PEG is attached to the 5' end of the aptamer as depicted in Figure 7.
- Branched activated PEGs will have more than two termini, and in cases where two or more termini have been activated, such activated higher molecular weight PEG molecules are herein referred to as, multi-activated PEGs. In some cases, not all termini in a branched PEG molecule are activated. In eases where any two termini of a branched PEG molecule are activated, such PEG molecule is referred to as a bi-activated PEG. In some cases where only one terminus in a branched PEG molecule is activated, such PEG molecule is referred to as mono-activated. In other cases, the linear PEG molecule is di- functional and is sometimes referred to as "PEG diol".
- the terminal portions of the PEG molecule are relatively non-reactive hydroxy! moieties, the -OH groups, that can be activated or converted to functional moieties for attachment of the PEG to other compounds at reactive sites on the compounds.
- Such activated PEG diols are referred to herein as homo bi-activated PEGs.
- the molecules are generated using any of a variety of art-recognized techniques.
- one or both of the terminal alcohol functionalities of the PEG molecule can be modified to allow for different types of conjugation to a nucleic acid. For example, converting one of the terminal alcohol
- amine or a thiol allows access to urea and thiourethane conjugates.
- Other functionalities include, e.g., maleimides and aldehydes.
- the PEG molecule on one end is cap the PEG molecule on one end with an essentially non-reactive moiety so that the PEG molecule is mono-functional (or mono- activated).
- mono-functional activated PEGs lead to extensive cross-linking, yielding poorly functional aggregates.
- one hydroxy! moiety on the terminus of the PEG diol molecule typically is substituted with a non-reactive methoxy end moiety, -OCH 3 .
- the polymer can be represented by MeO-CH 2 CH 2 0- (CH 2 CH 2 0)a-CH 2 CH 2 -OH and is commonly referred to as "mPEG", where n typically ranges from 4 to 10,000.
- the other, un-capped terminus of the PEG molecule typically is converted to a reactive end moiety' that can be activated for attachment at a reactive site on a surface or a molecule, such as a protein, peptide or oligonucleotide.
- a hetero bi-functional PEG reagent where one end of the PEG molecule has a reactive group, such as an N-hydroxysuccinimide or nitrophenyl carbonate, while the opposite end contains a maleimide or other activating group.
- a reactive group such as an N-hydroxysuccinimide or nitrophenyl carbonate
- two different functionalities for example, amine and thiol, may be conjugated to the activated PEG reagent at different times.
- the invention also includes pharmaceutical compositions comprising an aptamer that binds to TFPI.
- the compositions include a therapeutically effective amount of a pharmacologically active TFPI aptamer or a pharmaceutically acceptable salt thereof, alone or in combination, with one or more pharmaceutically acceptable carriers or diluents.
- the compositions may comprise one or more TFPI aptarners.
- the compositions may comprise ARC 19499.
- the compositions may comprise ARC19882.
- the compositions may comprise ARC 19499 and another TFPI aptamer.
- the aptarners may, optionally, be tethered or otherwise coupled together.
- the compositions comprise ARC 19499, either alone or in combination with another TFPI aptamer.
- the compositions comprise a TFPI aptamer in combination with another agent.
- the compositions comprise ARC 19499 in combination with another agent.
- the terms "pharmaceutically acceptable salt” refers to salt forms of the active compound that are prepared with counter ions that are non -toxic under the conditions of use and are compatible with a stable formulation.
- pharmaceutically acceptable salts of TFPI aptarners include hydrochlorides, sulfates, phosphates, acetates, fumarates, maieates and tartrates.
- pharmaceutically acceptable carrier means being compatible with the other ingredients of the formulation and not deleterious to the recipient thereof.
- Pharmaceutically acceptable carriers are well known in the art. Examples of pharmaceutically acceptable carriers can be found, for example, in Goodman and Gilimans, The Pharmacological Basis of Therapeutics, latest edition.
- the pharmaceutical compositions will generally include a therapeutically effective amount of the active component(s) of the therapy, e.g., a TFPI aptamer of the invention that is dissolved or dispersed in a pharmaceutically acceptable carrier or medium.
- a pharmaceutically acceptable carrier or medium examples include, but are not limited to, physiological saline solution, phosphate buffered saline solution, and glucose solution.
- other pharmaceutically acceptable carriers may also be used.
- examples of other pharmaceutically acceptable media or carriers include any and all solvents, dispersion media, coatings, antibacterial agents, antifungal agents, isotonic and absorption delaying agents and the like.
- compositions include, but are not limited to, ion exchangers, alumina, aluminum stearate, lecithin, serum proteins, such as human serum albumin, buffer substances, such as phosphates, glycine, sorbic acid, potassium sorbate, partial glyeeride mixtures of saturated vegetable fatty acids, water, salts or electrolytes, such as protamine sulfate, disodium hydrogen phosphate, potassium hydrogen phosphate, sodium chloride, zinc salts, colloidal silica, magnesium trisilicate, polyvinyl pyrrolidone, cellulose-based substances, polyethylene glycol, sodium carboxymethylcellulose, polyacrylat.es, waxes, polyethylene-polyoxypropylene- block polymers, polyethylene glycol and wool fat.
- buffer substances such as phosphates, glycine, sorbic acid, potassium sorbate, partial glyeeride mixtures of saturated vegetable fatty acids, water, salts or electrolytes, such as protamine
- compositions may also contain pharmaceutically acceptable excipients, such as preserving, stabilizing, wetting or emulsifying agents, solution promoters, salts, or buffers for modifying or maintaining pH, osmolality, viscosity, clarity, color, sterility, stability, rate of dissolution or absorption of the formulation.
- excipients include pharmaceutical grades of mannitol, lactose, starch, magnesium stearate, sodium saccharin, talcum, cellulose, glucose, sucrose, magnesium carbonate and the like.
- compositions are prepared according to conventional mixing, granulating or coating methods, and typically contain 0.1% to 99.9%, for example, 0.1 % to 75%, 0.1% to 50 %, 0.1%. to 25%», 0.1% to 10%, 0.1 to 5%», preferably 1% to 50%, of the active component.
- compositions may be formulated as injectables, either as liquid solutions or suspensions; solid forms suitable for solution in, or suspension in, liquid prior to injection; as tablets or other solids for oral administration; as time release capsules for slow release formulations; or in any other form currently used, including eye drops, creams, lotions, salves, inhalants and the like.
- the compositions may also be formulated as suppositories, using for example, polyalkylene glycols as the carrier. In some embodiments, suppositories are prepared from fatty emulsions or suspensions.
- sterile formulations such as saline-based washes, by surgeons, physicians or health care workers to treat a particular area in the operating field ma ⁇ ' also be particularly useful.
- compositions may be formulated as oral dosage forms, such as tablets, capsules, pills, powders, granules, elixirs, tinctures, suspensions, syrups and emulsions.
- oral dosage forms such as tablets, capsules, pills, powders, granules, elixirs, tinctures, suspensions, syrups and emulsions.
- the active drug component can be combined with an oral, non-toxic, pharmaceutically acceptable carrier, such as ethanoi, glycerol, water and the like.
- suitable binders, lubricants, disintegrating agents and coloring agents can also be incorporated into the mixture.
- suitable binders include starch, magnesium aluminum silicate, starch paste, gelatin,
- Lubricants used in these dosage forms include sodium oleate, sodium stearate, magnesium stearate, sodium benzoate, sodium acetate, sodium chloride, silica, talcum, stearic acid, its magnesium or calcium salt and/or polyethylene glycol and the like.
- Disintegrators include, without limitation, starch, methyl cellulose, agar, bentonite, xanthan gum starches, agar, alginic acid or its sodium salt, or effervescent mixtures and the like.
- Diluents include, e.g. , lactose, dextrose, sucrose, mannitol, sorbitol, cellulose and/or glycine.
- compositions can also be formulated in liposome deliver ⁇ ' systems, such as small unilamellar vesicles, large unilamellar vesicles and multilamellar vesicles.
- Liposomes can be formed from a variety of phospholipids containing cholesterol, stearylamine or phosphatidylcholines.
- a film of lipid components is hydrated with an aqueous solution of drug to a form lipid layer encapsulating the drug, as described in U.S. Pat. No. 5,262,564.
- the aptamers described herein can be provided as a complex with a lipophilic compound or non-immunogenic, high molecular weight compound constructed using methods known in the art.
- liposomes may bear aptamers on their surface for targeting and carrying cytotoxic agents internally to mediate cell killing.
- An example of nucleic- acid associated complexes is provided in U.S. Patent No. 6,01 1 ,020.
- compositions of the invention may also be coupled with soluble polymers as targetable drug carriers.
- soluble polymers can include polyvinylpyrrolidone, pyran copolymer, polyhydroxypropyl-methacrylamide-phenol, polyhydroxyethylaspanamidephenol, or poly ethyleneoxidepoly lysine substituted with palmitoyl residues.
- compositions of the invention may be coupled to a class of biodegradable polymers useful in achieving controlled release of a drug, for example, polylactic acid, polyepsilon caprolactone, polyhydroxy butyric acid, polyorthoesters, polyacetals, polydihvdropyrans, polycyanoaerylates and cross- linked or amphipathic block copolymers of hydrogels,
- compositions of the invention may also be used in conjunction with medical devices,
- the quantity of active ingredient, and volume of composition to be administered depends on the host animal to be treated. Precise amounts of active compound required for administration depend on the judgment of the practitioner and are peculiar to each individual.
- a minimal volume of a composition required to disperse the active compounds is typically utilized. Suitable regimes for administration are also variable, but would be typified by initially administering the compound and monitoring the results and then giving further controlled doses at further intervals.
- compositions may be administered to a vertebrate, preferably a mammal, and more preferably a human.
- a vertebrate preferably a mammal, and more preferably a human.
- patient and subject are used interchangeably throughout the application, and these terms include both human and veterinary subjects.
- the TFPI aptamers are antagonist aptamers
- the TFPI aptamer compositions provided herein are administered to subjects in an amount effective to inhibit, reduce, block or otherwise modulate TFPI-mediated inhibition of blood coagulation.
- the TFPI aptamer compositions may completely or partially inhibit, reduce, block or otherwise modulate TFPI-mediated inhibition of blood coagulation.
- the TFPI aptamers are considered to inhibit or otherwise modulate TFPI activity when the aptamers cause an increase in thrombin generation (such as, for example, peak thrombin, endogenous thrombin potential or lag time) over hemophilic plasma that is equivalent to at least 1 -2% of factor replacement.
- compositions may be administered by numerous routes of administration.
- routes of administration include, but are not limited to, oral routes; topical routes, such as intranasally, vaginally or rectally; and parenteral routes, such as intravenous, subcutaneous, intradermal, intramuscular, intraarticular and intrathecal administration.
- Suitable routes of administration may also be used in combination, such as intravenous administration followed by subcutaneous administration.
- the route of administration is determined by the attending physician.
- the formulations are administered intravenously.
- the formulations are administered subcutaneously.
- Oral dosage forms may be administered as tablets, capsules, pills, powders, granules, elixirs, tinctures, suspensions, syrups or emulsions.
- Topical dosage forms include creams, ointments, lotions, aerosol sprays and gels for intranasal vehicles, inhalants or transdermal patches.
- Parenteral dosage forms include pre-tilled syringes, and solutions and lyophilized powders that are reconstituted prior to administration,
- the dosage regimen utilizing the aptamers of the invention is selected in accordance with a variety of factors including type, species, age, weight, sex and medical condition of the patient; the severity of the condition to be treated; the route of administration; the renal and hepatic function of the patient; and the particular aptamer or salt thereof employed.
- An ordinarily skilled physician or veterinari n can readily determine and prescribe the effective amount of the drug required to prevent, counter or arrest the progress of the condition.
- compositions may be administered using various treatment regimens.
- the compositions may be administered as a maintenance therapy at a defined dose for a defined period of time, such as when a patient is not suffering from a bleeding episode.
- the compositions may be administered on demand, i.e. , as needed, such as when a patient is suffering from a bleeding episode.
- the compositions may be administered as a combination of maintenance therapy and on demand therapy.
- the compositions may be administered as a maintenance therapy at a defined dose for a defined period of time until a bleed occurs, in which case the dosage of the compositions would be increased on an as needed basis until the bleeding stopped, at which point the dosage of the compositions would be decreased back to the prior maintenance level.
- the compositions may be administered as a maintenance therapy at a defined dose for a defined period of time until a bleed occurs, in which case another bleeding disorder therapy would be administered to the patient (such as Factor VIII) until the bleeding stopped, at which point the other bleeding disorder therapy would be discontinued. During this entire time, the compositions would continue to be administered as a maintenance therapy.
- the compositions may be administered as a maintenance therapy at a defined dose for a defined period of time until a bleed occurs, in which case the dosage of the compositions would be decreased and another bleeding disorder therapy would be administered to the patient (such as Factor VIII) until the bleeding stopped, at which point the dosage of the compositions would be increased back to the prior maintenance level and the other bleeding disorder therapy would be discontinued.
- another bleeding disorder therapy such as Factor VIII
- another bleeding disorder therapy (such as FVIII) may be administered as a maintenance therapy at a defined dose for a defined period of time until a bleed occurs, in which case the dosage of the other bleeding disorder therapy would be decreased and the compositions would be administered to the patient until the bleeding stopped, at which point the dosage of the other bleeding disorder therapy would be increased back to the prior maintenance level and therapy with the compositions would be discontinued.
- compositions are used to treat, prevent, delay the progression of or ameliorate tissue factor pathway inhibitor (TFPI)-mediated pathologies, including the treatment of bleeding disorder pathologies involving TFPI-mediated inhibition of blood coagulation.
- TFPI tissue factor pathway inhibitor
- coagulation factor deficiencies congenital or acquired, mild or moderate or severe, including hemophilia A (Factor VIII deficiency), hemophilia B (Factor IX deficiency) and hemophilia C (Factor XI deficiency): hemophilia A or B with inhibitors; other factor deficiencies (V, VII, X, XIII, prothrombin, fibrinogen); deficiency of a2-plasmin inhibitor; deficiency of plasminogen activator inhibitor 1 ; multiple factor deficiency: functional factor abnormalities (e.g.
- dysprothrombinemia joint hemorrhage (hemarthrosis), including, but not limited to, ankle, elbow and knee; spontaneous bleeding in other locations (muscle, gastrointestinal, mouth, etc.); hemorrhagic stroke; intracranial hemorrhage; lacerations and other hemorrhage associate with trauma; acute traumatic coagulopathy; coagulopathy associated with cancer (e.g. , acute promyelocyte leukemia); von Willebrand's Disease; disseminated intravascular coagulation; liver disease; menorrhagia; thrombocytopenia and hemorrhage associated with the use of anticoagulants (e.g., vitamin K antagonists, FXa antagonists, etc.).
- anticoagulants e.g., vitamin K antagonists, FXa antagonists, etc.
- compositions may also be administered prior to, during and/or after a medical procedure.
- the pharmaceutical compositions may be administered in conjunction (before, during and/or after) with medical procedures, such as; prophylaxis and/or treatment, associated with bleeding caused by dental procedures, orthopedic surgery including but not limited to arthroplasty (e.g. , hip replacement), surgical or radionuclide synovectomy (RSV), major surgery, venipuncture, transfusion and amputation.
- medical procedures such as; prophylaxis and/or treatment, associated with bleeding caused by dental procedures, orthopedic surgery including but not limited to arthroplasty (e.g. , hip replacement), surgical or radionuclide synovectomy (RSV), major surgery, venipuncture, transfusion and amputation.
- arthroplasty e.g. , hip replacement
- RSV radionuclide synovectomy
- tissue factor pathway inhibitor would be expected to enhance the generation of thrombin via the tissue factor/Factor Vila pathway (also known as the extrinsic pathway).
- tissue factor/Factor Vila pathway also known as the extrinsic pathway.
- activation of the extrinsic pathway stimulates initiation of the thrombin generation response, resulting in a small amount of activated thrombin.
- this pathway is rapidly deactivated by the inhibitor ⁇ ' action of TFPI.
- Subsequent propagation of the thrombin generation response depends upon thrombin-mediated feedback activation of the intrinsic pathway, which includes Factor VIII (FV! II) and Factor XX (FIX).
- Propagation is necessary to generate a sufficiently large quantity of thrombin to catalyze the formation of a stable clot.
- Individuals with a deficiency of either Factor VIII (hemophilia A) or Factor IX (hemophilia B) have an impaired propagation response.
- Individuals with a severe deficiency ( ⁇ I %) cannot produce thrombin via the intrinsic pathway that is dependent on these proteins. This condition results in the inability to produce sufficient thrombin to have adequate platelet activation, fibrin generation and stable clot formation. However, these individuals have an intact extrinsic pathway.
- TFPI inhibition could permit continuation of the initiation response and enable propagation to occur via the extrinsic pathway, permitting sufficient thrombin generation to partially or completely replace the deficient intrinsic pathway and thus reduce bleeding risk.
- TFPI inhibition may provide a hemostatic stimulus that could control bleeding.
- Patients with other deficiencies of clotting factors, platelet deficiencies, and vascular defects associated with bleeding might also benefit from a treatment that would inhibit TFPL
- One embodiment, of the invention comprises a TFPI aptamer or a salt thereof or a pharmaceutical composition used in combination with one or more other treatments for bleeding diseases or disorders, such as other proeoagulant factors or other inhibitors of coagulation cascade regulatory molecules.
- compositions may also be administered in combination with another drug, such as; activated prothrombin complex concentrates (APCC), Factor Eight Inhibitor Bypass Agent (FEIB *), recombinant Factor Vila (e.g., Novoseven ® ), recombinant Factor VIII (Advate* Kogenate ® , Recombinate ⁇ , Helixate ® , ReFacto* ' ), plasma- derived Factor VIII ( f -fumate P ® , flemofil MT !
- APCC activated prothrombin complex concentrates
- FFIB * Factor Eight Inhibitor Bypass Agent
- recombinant Factor Vila e.g., Novoseven ®
- recombinant Factor VIII e.g., Novoseven ®
- recombinant Factor VIII Advanced* Kogenate ® , Recombinate ⁇ , Helixate ® , ReFacto* '
- compositions may be administered in combination with another therapy, such as: blood or blood- product transfusion, plasmapheresis, immune tolerance induction therapy with high doses of replacement factor, immune tolerance therapy with immunosuppressive agents (e.g., prednisone, rituximab) or pain therapy.
- another therapy such as: blood or blood- product transfusion, plasmapheresis, immune tolerance induction therapy with high doses of replacement factor, immune tolerance therapy with immunosuppressive agents (e.g., prednisone, rituximab) or pain therapy.
- immunosuppressive agents e.g., prednisone, rituximab
- the currently available dosage forms of the known therapeutic agents and the uses of non-drug therapies for use in such combinations will be suitable.
- Combination therapy includes the administration of a TFPI aptamer and at least a second agent or treatment as part of a specific treatment regimen intended to provide the beneficial effect from the co-action of these therapeutic agents or treatments.
- the beneficial effect of the combination includes, but is not limited to, pharmacokinetic or pharmacodynamic co-action resulting from the combination of therapeutic agent or treatments.
- Administration of these therapeutic agents or treatments in combination typically is carried out over a defined time period (usually minutes, hours, days or weeks depending upon the combination selected).
- Combination therapy may, but generally is not, intended to encompass the administration of two or more of these therapeutic agents or treatments as part of separate monotherapy regimens that incidentally and arbitrarily result in the combinations of the invention.
- Combination therapy is intended to embrace administration of the therapeutic agents or treatments in a sequential manner. That is, wherein each therapeutic agent or treatment is administered at a different time, as well as administration of these therapeutic agents or treatments, or at least two of the therapeutic agents or treatments, in a substantially simultaneous manner.
- Substantially simultaneous administration can be accomplished, for example, by administering to the subject a single injection ha ving a fixed ratio of each therapeutic agent or in multiple, single injections for each of the therapeutic agents,
- each therapeutic agent or treatment can be effected by any appropriate route including, but not limited to, topical routes, oral routes, intravenous routes, subcutaneous routes, intramuscular routes, and direct absorption through mucous membrane tissues.
- the therapeutic agents or treatments can be administered by the same route or by different routes.
- a first therapeutic agent or treatment of the combination selected may be administered by injection while the other therapeutic agents or treatments of the combination may be administered subcutaneously.
- all therapeutic agents or treatments may be administered subcutaneously or all therapeutic agents or treatments may be administered by injection.
- the sequence in which the therapeutic agents or treatments are administered is not critical unless noted otherwise.
- Combination therapy also can embrace the administration of the therapeutic agent or treatments as described above in further combination with other biologically active ingredients.
- the combination therapy comprises a non-drug treatment
- the non-drag treatment may be conducted at any suitable time so long as a beneficial effect from the co-action of the combination of the therapeutic agent and non-drug treatment is achieved.
- the beneficial effect is still achieved when the non-drug treatment is temporally removed from the administration of the therapeutic agent, perhaps by days or even weeks.
- the invention further relates to agents that reverse the effects of the TFPI aptamers, referred to herein as "TFPI reversal agents".
- the agent can be any type of molecule, such as a protein, antibody, small molecule organic compound or an oligonucleotide.
- a TFPI reversal agent is a nucleic acid that is 10-15 nucleotides in length. However, there are no limits to the length of the reversal agent.
- a TFPI reversal agent binds to a TFPI aptamer.
- a TFPI reversal agent may bind to a full length TFPI aptamer or a fragment thereof. Such binding may be through ionic interactions, covalent bonding, complementary base pairing, hydrogen bonding, or any other type of chemical bond. Preferably, such binding is via complementary base pairing.
- a TFPI reversal agent acts by hybridizing to a TFPI aptamer, thereby disrupting the TFPI aptamer' s secondary and tertiary structure and preventing the binding of the TFPI aptamer to TFPI.
- the effect of the binding interaction e.g., therapeutic effect, and/or stimulation or inhibition of the molecular pathway, can be modulated, providing a means of controlling the extent of the binding interaction and the associated effect.
- a TFPI reversal agent may be a ribonucleic acid, deoxyribonucleic acid or mixed ribonucleic and deoxyribonucleic acid.
- a TFPI reversal agent is single stranded.
- a TFPI reversal agent comprises all 2'-0 Methyl residues and a 3 '-inverted deoxythymidine.
- a TFPI reversal agent may contain any nucleotides, modified or unmodified, along with any other 3' or 5' modifications that may be found on aptamers.
- TFP I reversal agents include, but are not limited to: SEQ ID NO: 15, which is ARC23085; SEQ ID NO: 16, which is ARC23087; SEQ ID NO: 17, which is
- ARC23088 and SEQ ID NO: 58, which is ARC23089.
- the TFPI reversal agent is a nucleic acid comprising the structure set forth below:
- mA-mG-mC-mC-mA-mA-mG-niU-niA-mU-mA-mlJ-mU-mC-mC (SEQ ID NO: 15), wherein "mN" is a 2'-0 Methyl containing residue (which is also known in the art as a 2'-OMe, 2'- methoxy or 2'-OCH 3 containing residue).
- the TFPI reversal agent is a nucleic acid comprising the structure set forth below:
- the TFPI reversal agent is a nucleic acid comprising the structure set forth below:
- the TFPI reversal agent is a nucleic acid comprising the structure set forth below:
- ARC23085 The chemical name of ARC23085 is 2'-OMe-adenylyl-(3' ⁇ 5')- 2'-OMe-guanylyl- (3' ⁇ 5')- 2 '-OMe-cytidyiyl-(3 ' ⁇ 5 ')- 2'-OMe-cytidylyl-(3' ⁇ 5')- 2'-OMe-adenylyl-(3' ⁇ 5 ')- 2' ⁇ OMe-adenylyl-(3' ⁇ 5') ⁇ 2'-QMe ⁇ guanyfy ⁇
- ARC23087 is 2'-OMe-uracylyl-(3' ⁇ 5')- 2'-OMe-adenylyl-
- ARC23088 The chemical name of ARC23088 is 2 '-OMe-cytidy lyl-(3 ' ⁇ 5')- 2'-OMe-uracylyl-
- ARC23089 is 2 '-OMe-cy tidylyl-(3 ' ⁇ 5 ')- 2'-OMe-adenylyl- (:r ⁇ 5')- 2'-OMe-cytidylyi-(:r ⁇ 5')- 2'-OMe-cytidylyl-(:r ⁇ 5') 2'- OMe-adenylyl-(3 ' ⁇ 5 ')- 2 '-OMe-adenylyl-(3 ' ⁇ 5 ')- 2'-OMe-cytidylyl-(3 ' ⁇ 5 ')- 2 '-OMe- guany lyl-(3 ' ⁇ 5 ')- 2 ' -OMe-adenyly l-(3 ' ⁇ 5 ')- 2 ' -OMe-guany lyl-(3 ' ⁇ 5 ')- 2 ' -OMe-adenyly l-(3
- the invention also includes TFPI reversal agents that have 70% identity or more to any one of SEQ ID NOs: 15, 16, 17 or 18.
- the TFPI reversal agents ma ⁇ ' have 70, 75, 80, 85, 90, 95 or 100% identity to one of SEQ ID NOs: 15, 16, 17 or 18.
- the invention also includes pharmaceutical compositions containing TFPI reversal agents that bind to TFPI aptamers.
- the compositions include an effective amount of a pharmacologically active TFPI reversal agent or a pharmaceutically acceptable salt thereof, alone or in combination, with one or more pharmaceutically acceptable carriers.
- the compositions may contain one or more different TFPI reversal agents.
- the TFPI reversal agents are administered to subjects in an amount effective to reverse the therapeutic effect of the TFPI aptamer.
- the compositions may be administered by numerous routes of administration, such as, for example, topically, intranasally or parenterally.
- the dosage regimen for a TFPI reversal agent will depend on a variety of factors including type, species, age, weight, sex and medical condition of the patient; the severity of the condition to be treated; the route of administration, the renal and hepatic function of the patient; the amount of TFPI aptamer used to treat, a patient; and the particular TFPI reversal agent or salt thereof employed.
- An ordinary skilled physician or veterinarian can readily determine and prescribe the effective amount of the TFPI reversal agent required to reverse the therapeutic effect of a TFPI aptamer,
- the invention further includes agents that neutralize the hemostatic activity of the TFPI aptamer.
- agents that neutralize the hemostatic activity of the TFPI aptamer may bind to TFPI and prevent its inhibition by the TFPI aptamer, or the agent may inhibit downstream coagulation factors (e.g., FXa or thrombin) in a manner that counteracts the hemostatic activity of the TFPI aptamer.
- agents may include, but is not limited to, anticoagulants, such as unfractionated heparin or low molecular weight heparin.
- heparin is well known to inhibit thrombin, FXa and other coagulation factors through an antitlirombin-dependent mechanism. These activities could neutralize the ability of TFPI aptamers to stimulate thrombin generation and clot formation. In the event that the hemostatic effects of TFPI aptamers were to induce thrombosis, one of these agents could be administered to arrest its progression. An ordinary skilled physician or veterinarian can readily determine and prescribe the effective amount of the anticoagulant or other neutralizing agent required to reverse the hemostatic effect of a TFPI aptamer.
- the pharmaceutical compositions may also be packaged in a kit.
- the kit will comprise the composition, along with instructions regarding administration of the TFPI aptamer.
- the kit may also comprise one or more of the following: a syringe or pre-filled syringe, an intravenous bag or bottle, a vial, the same TFPI aptamer in a different dosage form or another TFPI aptamer.
- the kit m ⁇ ' comprise both an intravenous formulation and a subcutaneous formulation of a TFPI aptamer of the invention.
- the kit may comprise Ivophilized TFPI aptamer and an intravenous bag of physiological saline solution or phosphate buffered saline solution.
- the kit, form is particularly advantageous when the separate components must be administered in different dosage forms (i.e., parenteral and oral) or are administered at different dosage intervals.
- the kit may further comprise a TFPI reversal agent, along with instructions regarding administration of the reversal agent.
- the kit may contain both an intravenous formulation and a subcutaneous formulation of the TFPI reversal agent.
- the kit may contain lyophilized TFPI reversal agent and an intravenous bag of solution.
- kits are stored at 5 ⁇ 3 °C.
- the kits can also be stored at room temperature or frozen at -20 °C.
- the invention also provides a method for regulating TFPI in which a molecule binds or otherwise interacts with one or more portions of TFPI, wherein at least one portion is outside of the K.1 and K2 domains of TFPI, such as the K3/C terminal region.
- the molecule can be any type of molecule, such as, for example, a small molecule organic compound, an antibody, a protein or peptide, a nucleic acid, a siRNA, an aptamer, or any combination thereof.
- the molecule is a small molecule organic compound. More preferably, the molecule is an antibody. Most preferably, the molecule is an aptamer.
- the molecule may bind to or otherwise interact with a linear portion or a conformational portion of TFPI.
- a molecule binds to or otherwise interacts with a linear portion of TFPI when the molecule binds to or otherwise interacts with a contiguous stretch of amino acid residues that are linked by peptide bonds.
- a molecule binds to or otherwise interacts with a conformational portion of TFPI when the molecule binds to or otherwise interacts with non-contiguous amino acid residues that are brought together by folding or other aspects of the secondary and/or tertiary structure of the polypeptide chain.
- the molecule binds at least in part to one or more portions of mature TFPI (for example, Figure 3 A) that are selected from the group consisting of; amino acids 148-170, amino acids 150-170, amino acids 155-175, amino acids 160-180, amino acids 165-185, amino acids 170-190, amino acids 175-195, amino acids 180-200, amino acids 185- 205, amino acids 190-210, amino acids 195-215, amino acids 200-220, amino acids 205-225, amino acids 210-230, amino acids 215-235, amino acids 220-240, amino acids 225-245, amino acids 230-250, amino acids 235-255, amino acids 240-260, amino acids 245-265, amino acids 250-270, amino acids 255-275, amino acids 260-276, amino acids 148-175, amino acids 150- 175, amino acids 150-180, amino acids 150-185, amino acids 150-190, amino acids 150-195, amino acids 150-200, amino acids 150-205, amino acids 150-210, amino acids 150-21
- the molecule preferably comprises a dissociation constant for human TFPl, or a variant thereof, of less than 100 ⁇ , less than 1 ⁇ , less than 500 nM, less than 100 nM, preferably 50 nM or less, preferably 25 nM or less, preferably 30 nM or less, preferably 5 nM or less, more preferably 3 nM or less, even more preferably 1 nM or less, and most preferably 500 pM or less.
- a dissociation constant for human TFPl or a variant thereof, of less than 100 ⁇ , less than 1 ⁇ , less than 500 nM, less than 100 nM, preferably 50 nM or less, preferably 25 nM or less, preferably 30 nM or less, preferably 5 nM or less, more preferably 3 nM or less, even more preferably 1 nM or less, and most preferably 500 pM or less.
- ARC26835 is the aptamer described in SEQ ID NO: I
- ARC 17480 is the aptamer described in SEQ ID NO: 2.
- ARC 19498 is the aptamer described in SEQ ID NO: 3.
- ARC 19499 is the aptamer described in SEQ ID NO: 4.
- ARC 19500 is the aptamer described in SEQ ID NO: 5.
- ARC19501 is the aptamer described in SEQ ID NO: 6.
- ARC26835 is the core aptamer sequence for each of ARC 17480, ARCI9498, ARC 19499, ARCI9500 and ARC 19501.
- ARC31301 is the aptamer described in SEQ ID NO: 7.
- ARCI 8546 is the aptamer described in SEQ ID NO: 8.
- ARC 19881 is the aptamer described in SEQ ID NO: 9,
- ARC 19882 is the aptamer described in SEQ ID NO: 10.
- ARC31301 is the core aptamer sequence for each of ARC18546, ARC19881 and ARC19882.
- oligonucleotide molecules each of which contained dC, mA, mG and mU residues, and recombinant human tissue factor pathway inhibitor (TFPI), which was obtained from American Diagnostica (catalog #4500PC, Stamford, CT). Iterative rounds of selection for binding to TFPI, followed by amplification, were performed to generate ARC 14943, an 84 nucleotide long precursor to ARC 19499. ARC 14943 was minimized from 84 nucleotides to 32 nucleotides (ARC26835) using computational folding prediction programs and systematic deletion.
- TFPI human tissue factor pathway inhibitor
- Radiolabeled ARC 17480 was incubated with different concentrations of TFPI.
- ARC 17480 bound to TFPI was then captured on a nitrocellulose filter membrane.
- the ratio of radiolabeled ARC 17480 bound to the nitrocellulose filter over total radiolabeled ARC 17480 added was determined and plotted as the percentage of ARC17480 bound as a function of protein concentration.
- An example of an ARC17480/TFPI binding plot is shown in Figure 12 A.
- the data were fit to models for monophasic and biphasic aptamer-protein binding. This experiment was repeated eleven times and DS using both monophasic and biphasic binding models were determined for each data set.
- the mean 3 ⁇ 4 determined using a monophasic fit was 4.0 ⁇ 1.5 iiM and using a biphasic fit was 1.7 ⁇ 0.7 nM.
- Both monophasic and biphasic fits to the data assume different models for the interaction of ARC 17480 to TFPI, although the fits in and of themselves do not explicitly support either binding model. Regardless of the model used to fit the data, the KD determined for binding of ARC 17480 to TFPI was essentially the same. When the KDS determined from both the monophasic and biphasic fits were taken into consideration, the mean D of AR C 17480 binding to TFPI was 2.9 ⁇ 1.6 nM. This mean D does not assume a mode of binding interaction between ARC 17480 and TFPI and, as such, is the most robust determination of the binding interaction between the aptamer and the protein.
- ARC 17480 maintained binding to human TFPI in the presence of tR A, indicating that the binding was specific.
- a shift in binding affinity of ARC 17480 to TFPI was observed in the presence of 0.3 mg/mL tRNA with a mean KD of 42 ⁇ 32 nM.
- An example plot of ARC 17480 binding to TFPI in both the presence and absence of tRNA is shown in Figure 12B.
- This example demonstrates that unlabeled ARC17480, ARC 19498, ARC19499, ARC26835, ARC19500, ARC19501, ARCS 1301 , ARC 18546, ARC19881 and ARC19882 compete with radiolabeled ARC 17480 for binding to TFPI. This example also demonstrates that all of these aptamers have affinities for TFPI that are similar to that observed with ARC 17480.
- Figure 13A-E shows graphs of competition experiments with ARC 17480, ARC19498, ARC 19499, ARC26835, ARC19500, ARC19501, ARC31301 , ARC18546, ARC19881 and ARC! 9882. These molecules all competed similarly with radiolabeled
- ARC 17480 was tested for binding to a variety of proteins that are key molecules in the coagulation cascade, molecules whose inhibition would show a similar profile to TFPI inhibition, or molecules that are similar in structure or function to TFPL Proteins investigated were TFPI, Factor Va (FVa), Factor XII (FXII), antithrombm (ATlll ), heparin cofactor 11 (HCII), alpha-thrornbin, prothrombin, Factor Vila (FVIIa), Factor IXa (FIXa), Factor Xa (FXa), Factor XIa (FXIa), kallikrein, plasmin, alpha- 1 antitrypsin (serpin-Al ), TFPl-2, and G ST-TFPI-2.
- ARC ! 7480 did not ha ve any significant affinity for the sequence- and mechanistically-related proteins tested ( Figure 14A-D).
- ARC 17480 showed some binding to FXII at higher concentrations of protein. This binding was eliminated in the presence of 0.1 mg/ ' niL tRNA ( Figure 14D), indicating that the binding was likely non-specific.
- This example demonstrates that ARC 19499 binds tightly to TFPI in a plate-based binding assay. This example also demonstrates that ARC 19498 binds tightly to TFPI due to its competition with ARC 19499 for binding to TFPI in a plate -based binding assay.
- recombinant human TFPI protein (0.5 nig/mL) was diluted in Dulbecco's Phosphate -buffered Saline (DPBS) to a final concentration of 15 p,g/n:iL, and 100 ⁇ . was added to a 96-well Maxisorb plate and incubated overnight at 4 °C. The TFPI solution was then removed and the plate was subsequently washed 3 times with 200 LSL wash buffer (DPBS + 0.05% Tween 20) at room temperature. The plate was then blocked with 200 ⁇ , of 10 mg/ ' mL bovine serum albumin (BSA) in DPBS for 30 minutes at room temperature.
- BSA bovine serum albumin
- the BSA. blocking solution was then removed and the plate was washed again 3 times with 200 ⁇ wash buffer.
- Serially diluted ARC 19499 in DPBS with 0.1% BSA was then added to the plate and incubated for 3 hours at room temperature.
- 100 ⁇ ,, of 0.5 ,g/mL rabbit monoclonal anti-PEG antibody (Epitomics) was added to the plate and incubated for 60 minutes at room temperature.
- the anti-PEG antibody solution was then removed and the plate was washed as described above. Then, 100 ⁇ L anti-rabbit IgG-HRP secondary antibody (Cell Signaling Technology), diluted 1000-fold in assay buffer, was added to each well and incubated for 30 minutes.
- ARC19499 TFPI binding competition assay was set up. Recombinant human TFPI protein (0.5 mg/mL) was diluted in DPBS to a final concentration of 15 pg/nxL, and 100 ⁇ was added to a 96-well Maxisorb plate and incubated overnight at 4 °C. The TFPI solution was then removed and the plate was subsequently washed 3 times with 200 ⁇ wash buffer (DPBS + 0.05% Tween 20) at room temperature. The plate was then blocked with 200 ⁇ of 10 mg/raL BSA in DPBS for 30 minutes at room temperature. The BSA blocking solution was then removed and the plate was washed again 3 times with 200 ⁇ wash buffer. ARC! 9498 was serially diluted and mixed at different concentrations with 20 nM ARC 19499 in DPBS in 0. 1 % BSA. The
- ARC 19498 ARC 19499 mixtures were added to the plate and incubated for 3 hours at room temperature. After washing 3 times with 200 ⁇ wash buffer, 100 ⁇ L of 0.5 ⁇ g/mL rabbit monoclonal anti-PEG antibody (Epitomics) was added to the plate and incubated for 60 minutes at room temperature. The anti-PEG antibody solution was then removed and the plate was washed as described above. Then, 100 ⁇ anti-rabbit IgG-HRP secondary antibody (Ceil Signaling Technology), diluted 1000-fold in assay buffer, was added to each well and incubated for 30 minutes. After washing 3 times with 200 ⁇ L wash buffer, 100 ⁇ .
- TMB solution (Pierce) was added to each well and incubated for 2 minutes before adding 100 iiL stop solution (2N I I2SO4) to each well to stop the reaction.
- the assay plate was then read at 450 nm using a Victor'V 1420 rnultilabel counter (Perkin Elmer). The percent inhibition of ARC 19499 binding was calculated using 0 nM ARC 19498 in 20 nM ARC! 9499 as 0% inhibition, and 0 nM
- ARC19498 and 0 nM ARC19499 as 100% inhibition were calculated based on 4- parameter logistics using Graphpad Prism 4 software.
- Figure 16 shows two replicates of this experiment, both of which gave an I C5.3 of 20 nM for ARC 19498 competition with ARC 19499 in this assay.
- This example examines the regions on TFP where ARC 17480 binds. Dot blot binding experiments were carried out with radiolabeled ARC 17480 and various truncated TFPI proteins, and binding-competition experiments were carried out with radiolabeled ARC 17480, TFPI, and heparin or low molecular weight heparin (LMWIT). The proteins used for binding experiments are described in Table 1 below.
- FIG. 17A shows that ARC 17480 had reduced binding to TFPI-His when compared to its binding to full-length TFPI. This experiment suggested that the C-terminai 20 amino acids of TFPI, which are missing in TFPI-His but present in full-length TFPI, contribute to binding of ARC 17480 to TFPI.
- FIG. 17B shows that ARC 1 7480 had no detectable binding to truncated TFPI-K1 K2 and very weak binding to the K3-C-terminal domain protein that was only detectable at higher concentrations of the protein. Trace amounts of radiolabeled ARC 17480 were incubated with different concentrations of the C-terminal peptide (10 ⁇ -0.17 nM) (Table I ).
- Neutravidin (- 100 nM monomer) was then added to the binding solution to assist in the capture of aptamenpeptide complexes on a nitrocellulose filter.
- the amount of radiolabeled aptamer captured on a nitrocellulose filter was quantitated and compared to the total amount of radiolabeled aptamer to generate a binding curve, which is shown in Figure 17B, ARC 17480 showed weak binding to the C-terminal peptide at high concentrations of peptide, [00483] Trace amounts of radiolabeled ARC! 7480 were incubated with different
- the K3-C-terminai regions of TFPI have been implicated in glyocalyx binding, and this is the region of the protein where heparin and LMWH should bind.
- This example examines the regions on TFPI where ARC 17480 and ARC 19499 bind.
- antibodies that bind to different regions on TFPI were used to compete for binding to TFPI with ARCl 9499 in a plate-based binding assay, or to compete for binding to TFPI with ARC 17480 in a dot-biot binding assay.
- the antibodies used for competition are shown in Table 2 below.
- TFPI American Diagnostics, cat# 4900PC
- DPBS Dulbecco's Phosphate-buffered Saline
- TMB solution (Pierce, #34028) solution was added to each well and incubated for 2 minutes, followed by addition of 100 joL stop solution (2N H 2 S0 4 ) to each well to stop the reaction.
- the assay plate was then read at 450 nm using a VictorV 1420 multilabel counter (Perkin Elmer). Percent inhibition of binding was calculated using 0 nM antibody in 25 nM ARC 19499 as 0% inhibition, and 0 nM antibody and 0 nM ARC 19499 as 100% inhibition.
- the IC 50 was calculated based on 4-parameter logistics using Prism 4 Graphpad software.
- the antibodies in Table 2 were also tested in a dot, blot-based competition binding assay. In these experiments, trace amounts of radiolabeled ARC 17480 were incubated with 10 nM recombinant TFPI, with or without the addition of antibody. Antibodies were tested at 1000 nM, 333 nM, 1 1 1 nM, 37.0 nM, 12.4 nM, 4.12 nM, 1.37 nM, 0.46 nM, 0.15 nM and 0.051 nM. ARC 17480 was included as a competitor in every experiment as a control. For each molecule, the percentage of radiolabeled ARC 17480 bound at each competitor aptamer concentration was vised for analysis.
- y the percentage of radiolabeled ARC 17480 bound
- x the concentration of aptamer
- max the maximum radiolabeled ARC 17480 bound
- mt the y-intercept, to generate an IC 50 value for binding- competition.
- Figure 20 shows the binding-competition experiments carried out with ACJK-1, ACJK-2, ACJK-3, ACJK-4, ACJK-5, AD4903 and AD4904.
- ARC 19499 has in vitro activity inhibiting TFPI in the extrinsic tenase (Xase) inhibition assay.
- tissue factor (TF) was mixed with Factor Vila (FVIIa) and phospholipid vesicles.
- Factor X (FX) was added and aliquots were removed and quenched at various time points.
- FXa a chromogenic substrate for Factor Xa
- FXa chromogenic substrate for Factor Xa
- ARC26835, ARC 17480, ARC19498, ARC19499, ARC19500, ARC19501 , ARC31301, ARC18546, ARC19881 and ARC19882 have TFPI- inhibitory activity in the Factor Xa (FXa) activity assay.
- Each aptamer was evaluated for inhibition of TFPI in a Factor Xa (FXa) activity assay.
- FXa Factor Xa
- the ability of FXa to cleave a chromogenic substrate was measured in the presence and absence of TFPI, with or without the addition of aptamer.
- 2 nM human FXa was incubated with 8 nM human TFPI.
- 500 ⁇ chromogenic substrate and aptamers were added, and FXa clea vage of the substrate was measured by absorbance at 405 nm (A405) as a function of time.
- ARC 17480 was included as a control in each experiment.
- the rate of FXa substrate cleavage in the presence of TFPI and the absence of aptamer was subtracted from the corresponding value in the presence of both TFPI and aptamer for each aptamer at each concentration.
- FIG. 22A-C show graphs of FXa activity assays with ARC26835, ARCl 7480, ARC19498, ARCl 9499, ARCl 9500, ARC19501, ARC3130I , ARC 18546, ARC 19881 and ARC19882. These aptamers all inhibited TFPI in these assays, as evidenced by an increase in FXa activity as a function of aptamer concentration. These aptamers all had similar activity in the FXa assay.
- FXa (1 nM), TFPI (2,5 nM), ARC 1 499 (0-500 nM) and Spectrozyme Xa (American Diagnostica) chrornogenic substrate (200 ⁇ ) were incubated in HEPES-buffered saline (20 raM HE PES, 150 mM NaCI, pH 7.4) containing 2 mM CaCl 2 and 0.1 % PEG-6,000 (HBSP2 buffer) at 37 °C until equilibrium was achieved (5 minutes).
- the rate of Spectrozyme FXa hydrolysis was determined using a ThermoMax instrument (Molecular Devices) and plotted as the %FXa activity compared to no TFPI (100%).
- ARC 19499 protects the extrinsic FXase complex, which is composed of tissue factor.
- Factor Vila (FVIIa) and Factor Xa (FXa) from inhibition by TFPI in a chrornogenic activity assay with purified components.
- phosphatidyl choliiie/25% phosphatidyl serine; 20 ⁇ ) and ARC 19499 (0-1000 nM) were incubated in HBSP2 buffer at 37 °C for 10 minutes, followed by the simultaneous addition of FX (1 ⁇ . ⁇ ) and TFPI (2.5 nM). Aliquots were removed every 30 seconds for 5 minutes and quenched into HBS buffer containing 20 niM EDTA and 0.1% PEG. Spectrozyme FXa substrate (200 ⁇ ) was added, the rate of substrate hydrolysis was measured, and the concentration of active FXa was estimated from a calibration curve.
- Tissue factor (TF; 1 nM), FVIIa (2 nM) and ARC 19499 (0-7.5 nM) were incubated in HBSP2 at 37 °C for 10 minutes, followed by the simultaneous addition of a fluorogenie substrate SN-17c (50 ⁇ ) and TFPI (8 nM).
- the rate of substrate hydrolysis was measured in a fluorescence plate reader (BioTek).
- TFPI inhibited approximately 50% of TF:FVIIa activity under these conditions (Figure 25).
- Thrombin generation was initiated with 5 pM relipidated tissue factor (TF) added to a mixture of procoagulants and coagulation inhibitors (Factors V, VII, Vila, VIII, IX, X, XI, prothrombin, antithrombin and TFPI; all at mean physiologic concentrations) and 50 ⁇ PCPS (75% phosphatidyl choline/25% phosphatidyl serine). Thrombin generation over time was measured in a chromogenic assay using the Spectrozyme TH substrate (American Diagnostica).
- ARC 19499 was tested at increasing concentrations of 1 nM, 2.5 nM, 5 nM and 10 nM in a fully reconstituted system (healthy control) or in reconstituted systems in which either FVIII (severe hemophilia A) or FIX (severe hemophilia B) was omitted.
- the selected FVIII concentrations covered the range observed in severe ( ⁇ 1%), moderate (1-5%) and mild (5-40%) hemophilia A patients.
- thrombin generation was suppressed at all FVIII concentrations tested, up to and including 40%.
- the peak thrombin level observed in the 40% FVIII proteome was approximately 50% of the "healthy control" (filled diamonds).
- the addition of ARC 19499 at a concentration of 1 nM was sufficient, to significantly boost thrombin generation by shortening the initiation phase and increasing peak thrombin levels (Figure 30).
- Figure 32 shows additional synthetic coagulation proteome data for 0% FVIII in the presence of a series of ARC 19499 concentrations (0, I, 2.5, 5 and 10 nM) compared to a "healthy control" and a "No TFPI" control.
- Figure 33 shows the data for 100% FVIII for the same range of ARC 19499 concentrations.
- Figures 34, 35 and 36 show the data for 2%, 5% and 40% FVIII in the presence of 0, 1 and 2.5 nM ARC19499, respectively.
- ARC 19499 showed a significant procoagulant response, causing the initiation phase (lag time) to decrease and the peak thrombin to increase.
- FVIII deficiency (0-40% FVIII)
- ARC 19499 was able to restore a normal thrombin generation profile.
- ARC 19499 In this experiment, the ability of ARC 19499 to affect thrombin generation in the calibrated automated thrombogram (CAT) assay, which measures the generation of thrombin over time following initiation of the tissue factor coagulation pathway, was tested in three different plasma conditions.
- increasing concentrations of ARC 19499 were added to pooled normal plasma (PNP) and mixed with a solution containing tissue factor (TF) and phospholipids so that the TF concentration was either 0.1 or 1.0 pM in the final reaction volume (Figure 37), Thrombin generation was initiated by the addition of a mixture containing calcium chloride and a tluorogenic substrate for thrombin. The reaction took place at, 37 °C, and fluorescence intensity was measured periodically over 1 hour.
- ARC 19499 was tested at the following concentrations in the plasma: 0,1 , 1, 10, 100 and 1000 nM.
- Thrombin generation was measured as described above with 0.01 , 0,1 or 1.0 pM TF.
- the results in Figure 38A show that the thrombin generation curves measured for each TF concentration were distinct from each other, but within a specific TF concentration there was essentially no difference in thrombin generation as the ARC 19499 concentration was increased. This was also seen in the parameters measured in the CAT assay. There was little or no change in ETP, peak thrombin or lag time as the ARC 19499 concentration increased ( Figure 38B-D), independent of TF concentration.
- ARC19499 activity was tested in a third set of plasma conditions.
- PNP was incubated with a polyclonal antibody against TFPL in order to neutralize all TFPl activity
- ARC 19499 was then added to this antibody -treated plasma ( Figure 39)
- thrombin generation was initiated with either 0.01 , 0.1 or 1 ,0 pM TF
- Addition of the polyclonal antibody enhanced thrombin generation at all three TF concentrations because the TFPI was neutralized; however, increasing concentrations of ARC 19499 appeared to cause no further increases in thrombin generation (Figure 39A-C).
- Platelet-poor plasma from a normal, healthy volunteer was treated with an anti-FVIII antibody to generate a hemophilia A-like state.
- Thrombin generation in this antibody-treated plasma was similar to that observed with hemophilia A plasma ( Figure 41).
- Addition of ARC 19499 to the a tibody -treated plasma resulted in a dose-dependent increase in thrombin generation.
- ARC 17480 and ARC 19499 decreased the lag time in hemophilia B plasma, below what was achieved with pooled normal plasma and hemophilia B plasma without any drug ( Figure 43 ). (00524] These results show that ARC 17480 and ARC 19499 inhibit TFPI with similar potency in hemophilia B plasma in vitro,
- ARC 19499 to enhance thrombin generation was tested in three platelet- poor hemophilia plasmas: plasma pooled from 7-8 patients with severe hemophilia A ( ⁇ 1% FVIII levels; referred to as “hemophilia A plasma”), plasma from three different hemophilia A patients with high titers of anti-FVIII antibodies (>160 Bethesda units (BU)/mL; referred to as “inhibitor plasma”), and plasma pooled from two patients with severe hemophilia B ( ⁇ 1 % FIX levels; referred to as "hemophilia B plasma”). All plasmas were from George King Bio-Medical (Overland Park, KS).
- Thrombin generation was measured using the calibrated automated thrombogram (CAT) assay.
- CAT calibrated automated thrombogram
- plasma and aptamer were mixed together and added to a reagent containing phospholipids and tissue factor.
- Thrombin generation was initiated by the addition of a mixture containing calcium chloride and a fluorogenic substrate for thrombin. The reaction took place at 37 °C, and fluorescence intensity was measured periodically over 1 hour. The final concentrations of tissue factor and phospholipids were 1 pM and 4 ⁇ , respectively.
- Thrombin generation in the presence of ARC19499 0.3, 1, 3, 10, 30, 100, 300 and 1000 nM
- Plots of ETP, peak thrombin and lag time are shown in Figure 44.
- Hemophilia A. plasma had a slightly shorter lag time and a markedly decreased ETP and peak thrombin (-50% and -75%, respectively) compared to normal plasma.
- Increasing concentrations of A RC" 19499 largely corrected the defect in thrombin generation.
- ETP was corrected to near-normal levels with 3 nM ARCH 9499, and peak thrombin was corrected with 300 nM aptamer ( Figure 44A).
- Inhibitor plasma also had decreased ETP and peak thrombin (-50% and -70%, respectively) compared to normal plasma.
- ARC 19499 increased thrombin generation in this plasma.
- the sequence of the negative control aptamer, ARC32603, used in this example was: mG-mG-mA-niA-mU-niA-mU-mA-dC-mU-mU-mG-niG-dC-mU-mG-dC-mU-mG-dC-m.
- the TFPI-inhibitory activity of each aptarner was evaluated in the C AT assay in pooled hemophilia A plasma at 500 nM, 167 nM, 55.6 nM, 18.5 nM, 6.17 riM and 2.08 nM aptamer concentration.
- ARC 17480 was included in every experiment as a control.
- the endogenous thrombin potential s i . ⁇ and peak thrombin values at each aptamer concentration were used for analysis.
- the ETP or peak thrombin value for hemophilia A plasma alone was subtracted from the corresponding value in the presence of aptarner for each molecule at each concentration.
- ETP endogenous thrombin potential
- peak thrombin ail functionally inhibited TFPI in the CAT assay, as evidenced by a concentration-dependent increase in both ETP and peak thrombin in hemophilia A plasma.
- ETP endogenous thrombin potential
- ARC 19499 to affect thrombin generation compared to that of NovoSeven ® was tested using the calibrated automated thrombogram (CAT) assay.
- the C AT assay generates a number of parameters to compare thrombin generation.
- the lag time is a measure of the length of time that it takes for thrombin generation to begin.
- Peak thrombin is a measure of the highest amount of thrombin to be generated at n ⁇ ' one point.
- EDP endogenous thrombin potential
- Thrombin generation was initiated by the addition of a mixture containing calcium chloride and a fluorogenie substrate for thrombin. The reaction took place at 37 °C, and fluorescence intensity was measured periodically over 1 hour. The final concentrations of tissue factor and phospholipids were 1 pM and 4 ⁇ , respectively. The drugs were tested at, the following concentrations in the plasma: 0.3, 1 , 3, 10, 30, 100 and 300 nM.
- ARC 19499 had no effect on the lag time, while NovoSeven ' ⁇ showed a dose-dependent decrease of lag time (Figure 49C). Standard error associated with the inhibitor plasma was higher than that seen in the healthy plasma or hemophilia A pool. This was most likely due to the difference in titers between the three inhibitor patients (160 BU/mL, 533 BU/mL and 584 BU/mL). [00537] Overall, with the exception of the lag time, ARC 19499 and NovoSeven ® had very comparable effects on thrombin generation in all plasmas tested.
- the TEG ® assay measures the mechanical properties of a developing clot.
- a cup containing the blood product and any activators oscillates freely around a pin that is attached to a torsion wire.
- newly formed fibrin strands connect the oscillating cup to the stationary pin and begin to pull on the pin, thus generating force on the torsion wire.
- This force is converted to a signal by the computer to monitor clot formation, and is displayed as a tracing of signal height versus time.
- the R-value measures the time that it takes for an initial clot to develop.
- the angle is a measure of the rate at which the clot forms.
- the maximum amplitude (MA) is a measure of clot strength and stability.
- ARC 19499 also increased the angle, but the value appeared to plateau by 10 nM of aptamer, at a similar level as that achieved with mitreated blood (Figure 5 IB).
- the effect on MA was minimal with both drugs, primarily because there does not appear to be a large difference in the MA of whole blood, with or without FVIII antibody treatment. Both drugs resulted in MA values that fell between those achieved with untreated blood and those achieved with antibody -treated blood ( Figure 51C).
- FIG. 53 A shows the ETP of hemophilia A plasma with different concentrations of FVIII added (dashed lines). Addition of ARC 19499 resulted in a dose-dependent increase in thrombin generation in hemophilia A plasma and in hemophilia A plasma with 5% FVIII added. ARC ! 9499 mediated a procoagulant effect in hemophilia A plasma that was similar to 14% FVIII at 1-10 nM aptamer when ETP was evaluated ( Figure 53 A) or 10-30 nM when peak thrombin was evaluated.
- TFPI Factor Vlll-dependent propagation of thrombin generation.
- the key property of the spatial experimental model is that blood plasma clotting is activated by a surface covered with immobilized tissue factor (TF).
- TF tissue factor
- the fibrin gel then propagates into the bulk of plasma. Clotting takes place in a specially designed chamber ( Figure 54 A). Plasma samples are loaded into the well of the chamber that is subsequently placed in the thermostat. All experiments are performed at 37 °C. Clotting is initiated by immersion of an insert with TF immobilized on its end face into the chamber. Clot formation is registered by light scattering from fibrin gel using a CCD camera ( Figure 54B).
- the chamber is uniformly illuminated with monochromatic light and images are captured every 15 seconds. The acquired series of images is then processed by computer and parameters of spatial dynamics of blood clotting are calculated.
- TF densities were derivatized with TF densities in the range of 1-100 pmole/'m .
- the density of TF on the surface was characterized by the ability to activate Factor X (Enzyme Research Laboratories) in the presence of excess Factor Vila (Novoseven 3 ⁇ 4 ; Novo Nordisk) using a chromogenic Factor Xa substrate S-2765
- Each light scattering image was processed by calculating the mean light scattering intensity (based on pixel intensity) along a perpendicular drawn to activating surface.
- the data from each image was depicted as a single contour line on a plot of light scattering intensity versus distance from the activating surface ( Figure 55).
- Clot propagation was depicted qualitatively by successive contour lines of increasing light scattering intensity, determined from images taken at consecutive timepoints up to 90 minutes ( Figure 55), or quantitatively, by plotting clot size versus time ( Figure 56).
- the clot size for each image was determined as the coordinate (in micrometers or millimeters) along the contour line where the scattering intensity is half-maximal.
- clot size versus time plots Based on clot size versus time plots, the following parameters were calculated: lag time (delay between contact of plasma with activator and beginning of clot formation), initial velocity of clot growth (a or Y'mitiai; mean slope of the clot size versus time curve over the first 10 minutes after the lag time), spatial or stationary velocity of clot growth ( ⁇ or s tationary; mean slope over the next 30 minutes) and clot size after 60 minutes of the experiment (an integral parameter of clot formation efficiency). For each experiment, four perpendiculars were drawn from different points along the activator surface. Profiles of clot size versus time were analyzed and four values of each clotting parameter were obtained and then averaged to obtain means.
- FIG. 57 shows averaged lag time dependence on activator TF density.
- the magnitude of TFPI inhibition by ARC 19499 depended on TF density and became more significant as the density decreased (up to 2.5-fold shortening of the lag time at TF densities of 1 -3 pmole/m').
- Figure 57B shows the averaged initial clot growth velocity dependence on activator TF density.
- FIG. 57C illustrates the stationary clot growth velocity dependence on activator TF density; ARC! 9499 had little effect on clot propagation velocity throughout the entire range of activators.
- Figure 57D shows the averaged clot size after 60 minutes. Inhibition of TFPI affected clot size at densities of 1-4 pmole/m 2 TF; ARC! 9499 effects became insignificant as the TF density increased.
- TF densities were chosen for further studies of ARC19499: low, 1-2 pmole/m 2 , and medium, 10-20 pmole/ m z .
- Lag time ( Figure 58 A) decreased with increasing ARC 19499 concentration up to 30 nM, and then stabilized.
- Initial velocity ( Figure 58B) increased by -30% with increasing ARC! 9499 concentration, while stationary velocity ( Figure 58C) was not significantly affected throughout the entire range of concentrations. There was a detectable increase in clot size at 60 minutes ( Figure 58D) with increasing ARC 19499 concentration.
- Figure 59 shows means ( ⁇ SEM) of clotting parameters for 0 and 300 nM. of ARC 19499 at low TF density combining the raw data from Figures 57 and 58 (n :::: 6).
- ⁇ SEM means ( ⁇ SEM) of clotting parameters for 0 and 300 nM. of ARC 19499 at low TF density combining the raw data from Figures 57 and 58 (n :::: 6).
- Asterisks indicate statistical significance (P ⁇ 0.05), that the difference between values ⁇ ARC 19499 was different from zero.
- the effects on all four parameters were statistically significant, although the effects on lag time and clot size were the largest.
- Figure 61 show r s the statistical analysis comparing 0 and 300 nM ARC 19499 for all four clotting parameters. Although some of the differences appear statistically significant (indicated by asterisk), the effects of ARC 19499 on clotting in normal plasma activated by medium TF density were very small.
- Typical spatial clot formation activated by low density TF in hemophilia A plasma is shown in Figure 62.
- the plots show profiles of light scattering as a function of distance from the activator for hemophilia A plasma alone ( Figure 62A) and hemophilia A plasma containing 100 iiM ARC 19499 ( Figure 62B) or 100 iiM rVIIa ( Figure 62C).
- Example light scattering images from which this data was derived are shown in Figure 63
- a plot of clot size versus time derived from the processed data is shown in Figure 64, with a normal plasma profile included for comparison. Based on these data, ARC 19499 improved spatial clot formation by shortening lag time and increasing clot size.
- 100 nM ARC 19499 partially normalized clot formation, facilitating clot propagation from the activating surface.
- 100 nM rVIIa stimulated potent TF-mdependent clotting. Rather than stimulating normalization of spatial clot, propagation from the activating surface, rVIIa at this concentration induced clotting throughout the reaction chamber.
- Figure 70 shows the dependence of clot size at 60 minutes on ARC 19499 (Figure 70A) and rVIIa (Figure 70B).
- the clot size at 60 minutes increased 1.5-2 fold with increasing concentrations of ARC19499 from 0 up to 30 nM, with no significant further change at higher ARC 19499 concentrations.
- a statistical analysis of the low TF density data, comparing each parameter for 0 and 300 nM ARC 19499, is shown in Figure 71.
- ARC 19499 had significant effects on lag time ( Figure 71 A), initial velocity (Figure 7 IB) and clot size at 60 minutes (Figure 7 ID), but no effect on stationary velocity (Figure 71C).
- Figures 72, 73 and 74 show the effects of ARC19499 and rVIIa on spatial clot formation activated by medium density TF in plasmas of patients #4, #5 and #6, respectively.
- ARC 19499 had little effect on clotting parameters for the medium density activator through the entire range of concentrations tested.
- a statistical analysis of the medium TF density data comparing each parameter for 0 and 300 nM ARC 19499 is shown in Figure 75.
- ARC! 9499 had no significant effect on any of the four clotting parameters under these conditions.
- Figure 76 shows the mean parameters of clotting for hemophilia A and hemophilia A with 300 nM of ARC 19499 in comparison to normal plasma.
- ARC 19499 shortened the lag time below the normal level and normalized the initial velocity, but had no effect on stationary velocity.
- ARC 19499 increased the clot size at 60 minutes approximately 2- fold from 30% up to 60% of the normal value.
- Figure 79 compares clotting parameters for hemophilia A plasma alone with 300 11M ARC 19499 or with 30 11M rVIIa.
- Figure 79A-D show lag time, initial clot growth velocity, stationary velocity and clot size after 60 minutes, respectively.
- ARC 19499 increased clot size primarily by shortening the lag time and increasing initial velocity; it had no effect on spatial propagation stage (V st ationary).
- ARC 19499 significantly improved clotting in norma! and hemophilia A plasma in the spatially heterogeneous system at low TF density (1-3 pmole/ ⁇ .
- the lag time was shortened, and initial velocity of spatial propagation and clot size at 60 minutes were increased by ARC 19499 up to 2-fold, with little effect on spatial propagation velocity far from the activator.
- hemophilia A plasma this resulted in complete normalization of the lag time and initial velocity parameters, while clot size at 60 minutes was partially normalized (increases from 30% to 60% of normal upon addition of ARC! 9499).
- This example demonstrates that ARC 19499 can improve clotting in whole blood and cell-free (plasma) clot-time assays, in samples collected from hemophilia A and hemophilia B patients.
- Blood samples (20 mL) were collected from 12 subjects, including seven severe hemophilia A (subjects #1, 3, 5, 8, 10, 11 and 12) subjects, two severe hemophilia B (#4 and 9) subjects and three healthy controls (#2, 6 and 7). Blood was collected into 0.5 niM EDTA and 0.1 mg/mL corn trypsin inhibitor (CTI; Haematologic Technologies Inc.). Approximately half of each sample was used for whole blood assays, while the other half was centrifuged to prepare platelet poor plasma (PPP).
- CTI corn trypsin inhibitor
- TF-activated clotting time is a whole blood assay performed using the Hemochron 3 " Response Whole Blood Coagulation System (International Technidvne Corp.), a commonly used system for measuring patient responses to unfractionated heparin and protamine.
- Standard ACTs measured by this instrument use tubes containing an activator of the "contact” or “intrinsic” pathway of coagulation (e.g., celite or kaolin).
- an activator of the "contact” or "intrinsic" pathway of coagulation e.g., celite or kaolin.
- the tubes designed for measuring standard ACTs were rinsed of contact-activating reagent. In its place wa s added 12 ⁇ .
- Dilute prothrombin time (dPT) assays were performed on PPP prepared from the same blood samples as described for the TF-ACT assays.
- the standard prothrombin time (PT) is performed by adding thromboplastin, consisting of tissue factor (- 1 nM), calcium chloride and phospholipids, to plasma to evaluate the integrity of the "tissue factor” or "extrinsic" pathway of coagulation.
- the clot time in a normal plasma sample measured using the standard PT protocol is typically -11 seconds.
- the PT is commonly used for measuring patient responses to warfarin, and is largely insensitive to deficiencies in contact pathway factors like FVIII and FIX.
- the dPT uses a very low TF concentration and clot times measured by this assay are sensitive to factors in both the TF and contact pathways.
- thromboplastin reagent Innovin; Dade-Behring
- tris-buffered saline (20 mM tris, pH 7.5, 150 niM NaCl) to reach a concentration of 0.3 pM TF.
- the dPT was performed by mixing 120 ⁇ , of PPP with 60 ⁇ _ of the dilute TF solution and incubating at 37 °C for 3 minutes before adding 60 ⁇ , of 25 nxM CaCI? to the plasma/TF mixture.
- Clotting time was recorded on an A.CL-8000 coagulometer (from Instrumentation Laboratory, Bedford, MA) and the data for all subjects is shown in tabular format in Figure 82.
- Baseline clot times in PPP samples from all normal and hemophilia B subjects, and 6 of 7 hemophilia A subjects were >360 seconds, which was the pre-set, maximum measurable clot time on the coagulometer.
- One hemophilia A subject, (#10) displayed a baselme dPT of 169 seconds.
- Increasing concentrations of ARC! 9499 added to the PPP typically resulted in decreased dPT clot times.
- the average clot times for the normal and hemophilia B groups under the same conditions were 204 ⁇ 37 seconds and 226 ⁇ 22 seconds, respectively.
- Higher ARC 19499 concentrations caused only moderate, further decreases in clot times.
- Average clot times at 500 nM ARC 19499 were 179 ⁇ 6 seconds, 200 ⁇ 21 seconds and 161 ⁇ 3 seconds for the normal, hemophilia A (excluding #10 and #12) and hemophilia B groups, respectively.
- ROTEM thromboelastometry
- Blood samples were collected from 39 healthy volunteers (27 male and 12 female) and 40 hemophilia patients (all male). Of the 40 hemophilia patients, 3 hemophilia B (HB) patients and 28 hemophilia A (HA) patients were diagnosed as severe (baseline factor activity ⁇ ! %), one HA and one HB patient suffered from moderately severe hemophilia (baseline factor activity 1-5%), four HA and two HB patients had mild hemophilia (baseline factor activity >5%). Using a 21 -gauge butterfly needle, blood samples were drawn into plastic Vacuette tubes (Greiner Bio-One) containing 3.8% sodium citrate at a volume ratio of 1 :9.
- Coagulation was analyzed by ROTEM (Pentapharm GmbH), which is based on the original thromboelastography system (TEGTM).
- TAGTM original thromboelastography system
- CT clotting time
- CFT clot formation time
- MCF maximum clot firmness
- alpha alpha angle
- the clot formation time describes the subsequent period until an amplitude of 20 mm is reached.
- the alpha angle is given by the angle between the center line and a tangent to the curve through the 2 mm amplitude point. Both the CFT and the alpha angle denote the speed of clot development.
- the MCF is calculated from the maximum amplitude of the ROTEM trace and describes clot stability and strength; the MCF is largely dependent on fibrinogen and platelet function.
- CTI corn trypsin inhibitor
- Haematologic Technologies Inc corn trypsin inhibitor
- Comparisons between different concentrations of ARC 19499 in any of the measured parameters were calculated with the Wilcoxon signed rank test with a Bonferroni Correction.
- a Mann- Whitney U-test was used to analyze the correlation of hemostatic parameters to Factor VIII (FVHI) activity.
- FVHI Factor VIII
- a p- value smaller or equal to 0.05 was considered statistically significant.
- the clot time was substantially improved by ARC 19499, but not fully normalized.
- the MCF though not significantly different between controls and patients, was significantly augmented by ARC 19499 (p ⁇ 0.G5 for 0 nM ARC 19499 compared to >2 nM in hemophilia patients and 200 nM in healthy controls).
Abstract
Description


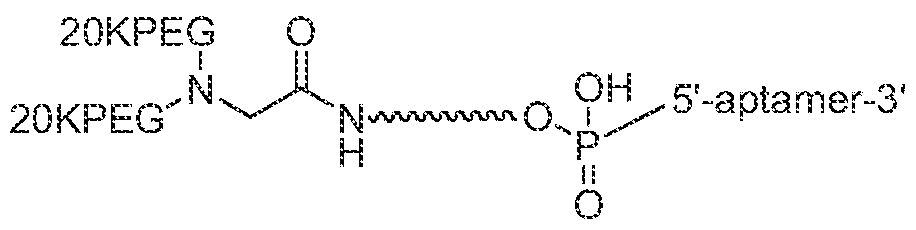


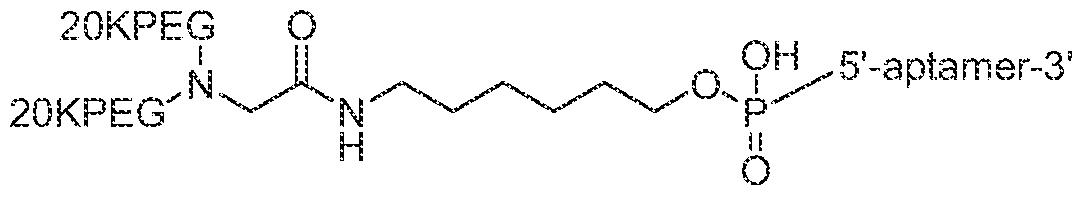


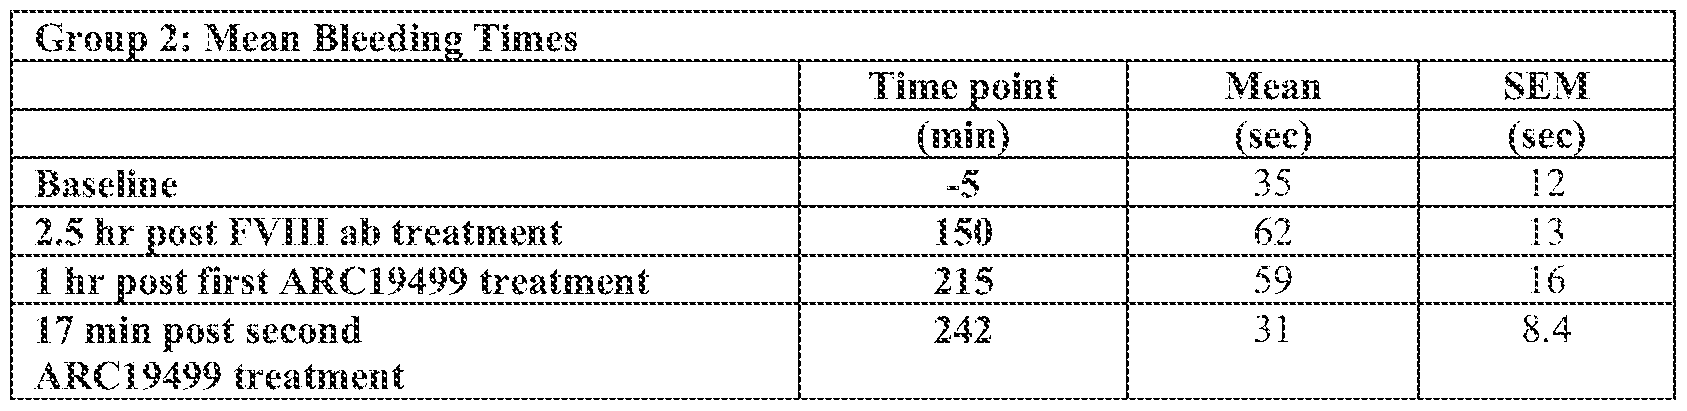


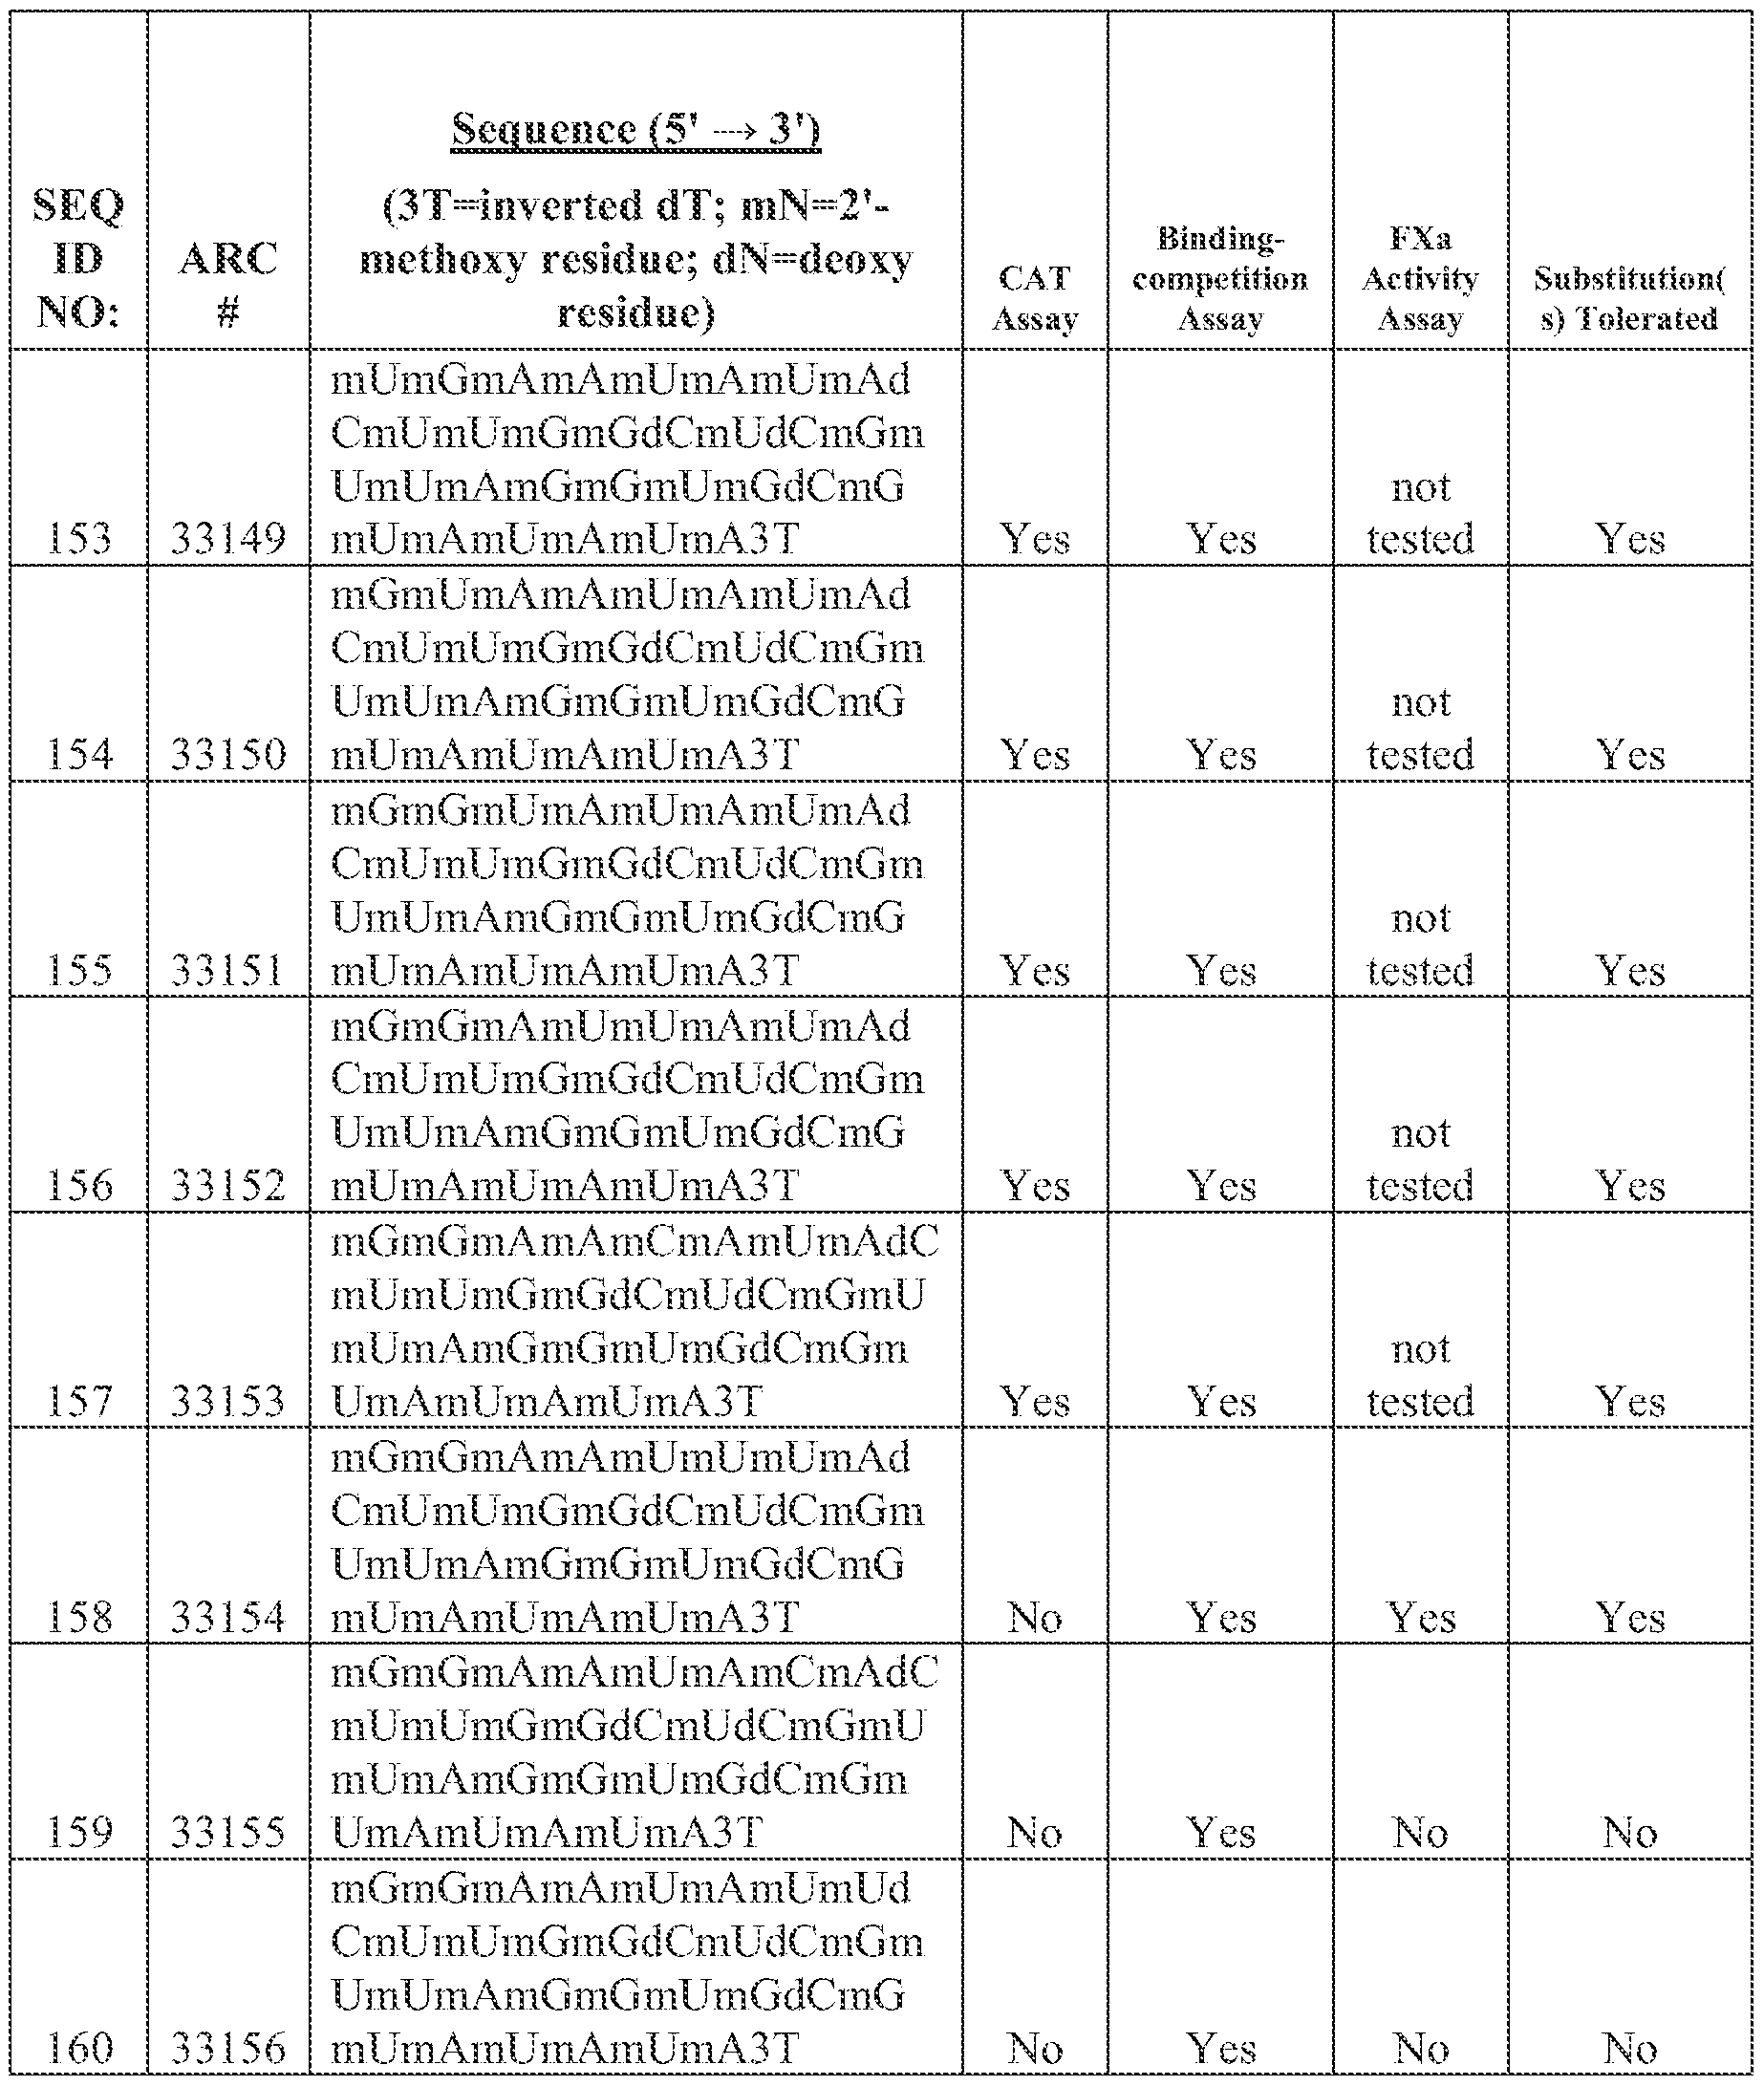


Claims
Priority Applications (4)
| Application Number | Priority Date | Filing Date | Title |
|---|---|---|---|
| AU2012214148A AU2012214148A1 (en) | 2011-02-11 | 2012-02-13 | Aptamers to tissue factor pathway inhibitor and their use as bleeding disorder therapeutics |
| CA2827160A CA2827160A1 (en) | 2011-02-11 | 2012-02-13 | Aptamers to tissue factor pathway inhibitor and their use as bleeding disorder therapeutics |
| JP2013553643A JP6002691B2 (en) | 2011-02-11 | 2012-02-13 | Aptamers for tissue factor pathway inhibitors and their use as therapeutic agents for bleeding disorders |
| EP12706378.2A EP2673364A1 (en) | 2011-02-11 | 2012-02-13 | Aptamers to tissue factor pathway inhibitor and their use as bleeding disorder therapeutics |
Applications Claiming Priority (2)
| Application Number | Priority Date | Filing Date | Title |
|---|---|---|---|
| US13/026,165 | 2011-02-11 | ||
| US13/026,165 US8598327B2 (en) | 2009-08-18 | 2011-02-11 | Aptamers to tissue factor pathway inhibitor and their use as bleeding disorder therapeutics |
Publications (1)
| Publication Number | Publication Date |
|---|---|
| WO2012109675A1 true WO2012109675A1 (en) | 2012-08-16 |
Family
ID=45771912
Family Applications (1)
| Application Number | Title | Priority Date | Filing Date |
|---|---|---|---|
| PCT/US2012/024916 WO2012109675A1 (en) | 2011-02-11 | 2012-02-13 | Aptamers to tissue factor pathway inhibitor and their use as bleeding disorder therapeutics |
Country Status (5)
| Country | Link |
|---|---|
| EP (1) | EP2673364A1 (en) |
| JP (1) | JP6002691B2 (en) |
| AU (1) | AU2012214148A1 (en) |
| CA (1) | CA2827160A1 (en) |
| WO (1) | WO2012109675A1 (en) |
Cited By (4)
| Publication number | Priority date | Publication date | Assignee | Title |
|---|---|---|---|---|
| WO2013142153A3 (en) * | 2012-03-22 | 2014-01-09 | Baxter International Inc. | Aptamers to tissue factor pathway inhibitor and their use as bleeding disorder therapeutics |
| US9574011B2 (en) | 2008-12-22 | 2017-02-21 | Novo Nordisk A/S | Antibodies against tissue factor pathway inhibitor |
| USRE47150E1 (en) | 2010-03-01 | 2018-12-04 | Bayer Healthcare Llc | Optimized monoclonal antibodies against tissue factor pathway inhibitor (TFPI) |
| CN111411164A (en) * | 2020-05-26 | 2020-07-14 | 中国检验检疫科学研究院 | Method for detecting tomato canker pathogen by using digital PCR and kit reagent used by method |
Families Citing this family (1)
| Publication number | Priority date | Publication date | Assignee | Title |
|---|---|---|---|---|
| KR101969402B1 (en) * | 2016-10-27 | 2019-04-16 | 대한민국 | Apparatus for mounting Water Injection Mortar |
Citations (12)
| Publication number | Priority date | Publication date | Assignee | Title |
|---|---|---|---|---|
| US5262564A (en) | 1992-10-30 | 1993-11-16 | Octamer, Inc. | Sulfinic acid adducts of organo nitroso compounds useful as retroviral inactivating agents anti-retroviral agents and anti-tumor agents |
| US6011020A (en) | 1990-06-11 | 2000-01-04 | Nexstar Pharmaceuticals, Inc. | Nucleic acid ligand complexes |
| US6207646B1 (en) | 1994-07-15 | 2001-03-27 | University Of Iowa Research Foundation | Immunostimulatory nucleic acid molecules |
| US6214806B1 (en) | 1997-02-28 | 2001-04-10 | University Of Iowa Research Foundation | Use of nucleic acids containing unmethylated CPC dinucleotide in the treatment of LPS-associated disorders |
| US6239116B1 (en) | 1994-07-15 | 2001-05-29 | University Of Iowa Research Foundation | Immunostimulatory nucleic acid molecules |
| US6426334B1 (en) | 1997-04-30 | 2002-07-30 | Hybridon, Inc. | Oligonucleotide mediated specific cytokine induction and reduction of tumor growth in a mammal |
| US6429199B1 (en) | 1994-07-15 | 2002-08-06 | University Of Iowa Research Foundation | Immunostimulatory nucleic acid molecules for activating dendritic cells |
| US6498148B1 (en) | 1997-09-05 | 2002-12-24 | The Regents Of The University Of California | Immunization-free methods for treating antigen-stimulated inflammation in a mammalian host and shifting the host's antigen immune responsiveness to a Th1 phenotype |
| US6514948B1 (en) | 1999-07-02 | 2003-02-04 | The Regents Of The University Of California | Method for enhancing an immune response |
| WO2007014749A2 (en) * | 2005-07-29 | 2007-02-08 | Universiteit Van Maastricht | Regulation of tissue factor activity by protein s and tissue factor pathway inhibitor |
| WO2010071894A2 (en) * | 2008-12-19 | 2010-06-24 | Baxter International Inc. | Tfpi inhibitors and methods of use |
| WO2011022427A1 (en) * | 2009-08-18 | 2011-02-24 | Archemix Corp. | Aptamers to tissue factor pathway inhibitor and their use as bleeding disorder therapeutics |
Family Cites Families (1)
| Publication number | Priority date | Publication date | Assignee | Title |
|---|---|---|---|---|
| FR2942232B1 (en) * | 2009-02-19 | 2015-03-13 | Lfb Biotechnologies | MEANS FOR THE PURIFICATION OF A PROTEIN OF COAGULATION AND METHODS FOR ITS IMPLEMENTATION |
-
2012
- 2012-02-13 JP JP2013553643A patent/JP6002691B2/en active Active
- 2012-02-13 WO PCT/US2012/024916 patent/WO2012109675A1/en active Application Filing
- 2012-02-13 CA CA2827160A patent/CA2827160A1/en not_active Abandoned
- 2012-02-13 EP EP12706378.2A patent/EP2673364A1/en not_active Withdrawn
- 2012-02-13 AU AU2012214148A patent/AU2012214148A1/en not_active Abandoned
Patent Citations (13)
| Publication number | Priority date | Publication date | Assignee | Title |
|---|---|---|---|---|
| US6011020A (en) | 1990-06-11 | 2000-01-04 | Nexstar Pharmaceuticals, Inc. | Nucleic acid ligand complexes |
| US5262564A (en) | 1992-10-30 | 1993-11-16 | Octamer, Inc. | Sulfinic acid adducts of organo nitroso compounds useful as retroviral inactivating agents anti-retroviral agents and anti-tumor agents |
| US6653292B1 (en) | 1994-07-15 | 2003-11-25 | University Of Iowa Research Foundation | Method of treating cancer using immunostimulatory oligonucleotides |
| US6239116B1 (en) | 1994-07-15 | 2001-05-29 | University Of Iowa Research Foundation | Immunostimulatory nucleic acid molecules |
| US6429199B1 (en) | 1994-07-15 | 2002-08-06 | University Of Iowa Research Foundation | Immunostimulatory nucleic acid molecules for activating dendritic cells |
| US6207646B1 (en) | 1994-07-15 | 2001-03-27 | University Of Iowa Research Foundation | Immunostimulatory nucleic acid molecules |
| US6214806B1 (en) | 1997-02-28 | 2001-04-10 | University Of Iowa Research Foundation | Use of nucleic acids containing unmethylated CPC dinucleotide in the treatment of LPS-associated disorders |
| US6426334B1 (en) | 1997-04-30 | 2002-07-30 | Hybridon, Inc. | Oligonucleotide mediated specific cytokine induction and reduction of tumor growth in a mammal |
| US6498148B1 (en) | 1997-09-05 | 2002-12-24 | The Regents Of The University Of California | Immunization-free methods for treating antigen-stimulated inflammation in a mammalian host and shifting the host's antigen immune responsiveness to a Th1 phenotype |
| US6514948B1 (en) | 1999-07-02 | 2003-02-04 | The Regents Of The University Of California | Method for enhancing an immune response |
| WO2007014749A2 (en) * | 2005-07-29 | 2007-02-08 | Universiteit Van Maastricht | Regulation of tissue factor activity by protein s and tissue factor pathway inhibitor |
| WO2010071894A2 (en) * | 2008-12-19 | 2010-06-24 | Baxter International Inc. | Tfpi inhibitors and methods of use |
| WO2011022427A1 (en) * | 2009-08-18 | 2011-02-24 | Archemix Corp. | Aptamers to tissue factor pathway inhibitor and their use as bleeding disorder therapeutics |
Non-Patent Citations (33)
| Title |
|---|
| "Chemistry of Antisense Oligonucleotides", 2000, WILEY-VCH, article "New Trends in Synthetic Medicinal Chemistry", pages: 261 - 335 |
| "CpG Motifs in Bacterial DNA and Their Immune Effects", AMU. REV. IMMUNOL., vol. 20, 2002, pages 709 - 760 |
| ALTSCHUL ET AL., J MOL. BIOL., vol. 215, 1990, pages 403 - 410 |
| ALTSCHUL ET AL., NUCLEIC ACIDS RES., vol. 15, 1997, pages 3389 - 3402 |
| AUSUBEL, F. M. ET AL.: "Current Protocols in Molecular Biology", 1987, GREENE PUBLISHING ASSOC. AND WILEY-INTERSCIENCE |
| BAUGH ET AL., J BIOL CHEM, vol. 273, no. 8, 1998, pages 4378 - 86 |
| E. K. WATERS ET AL: "Aptamer ARC19499 mediates a procoagulant hemostatic effect by inhibiting tissue factor pathway inhibitor", BLOOD, vol. 117, no. 20, 19 May 2011 (2011-05-19), pages 5514 - 5522, XP055028948, ISSN: 0006-4971, DOI: 10.1182/blood-2010-10-311936 * |
| FADEEVA ET AL., BIOCHEMISTRY, vol. 75, 2010, pages 734 - 743 |
| FRANSSEN ET AL., BIOCHEM J, vol. 323, 1997, pages 33 - 7 |
| GIRARD, NATURE, vol. 338, 1989, pages 518 - 520 |
| GOODMAN; GILLMANS: "The Pharmacological Basis of Therapeutics" |
| GORCZYCA MONIKA E ET AL: "Inhibition of tissue factor pathway inhibitor (TFPI) by ARC19499 improves clotting of hemophiliac blood", BMC PHARMACOLOGY, BIOMED CENTRAL, LONDON, GB, vol. 10, no. Suppl 1, 16 November 2010 (2010-11-16), pages A44, XP021073607, ISSN: 1471-2210, DOI: 10.1186/1471-2210-10-S1-A44 * |
| GREENWALD ET AL., J. ORG. CHEM., vol. 60, 1995, pages 331 - 336 |
| HIROSE ET AL., TET. LETT., vol. 28, 1978, pages 2449 |
| HUANG ET AL., J BIOL CHEM, vol. 268, no. 36, 1993, pages 26950 - 26955 |
| HUANG ET AL., J BIOL CHEM, vol. 268, no. 36, 1993, pages 26950 - 5 |
| LIU ET AL.: "Improved coagulation in bleeding disorders by Non-Anticoagulant Sulfated Polysaccharides (NASP", THROMB. HAERMOST., vol. 95, 2006, pages 68 - 76, XP009128550 |
| MATHEWS, D.H.; DISNEY, M.D.; CHILDS, J.L.; SCHROEDER, S.J.; ZUKER, M.; TURNER, D.H.: "Incorporating chemical modification constraints into a dynamic programming algorithm for prediction ofRNA secondary structure", PROCEEDINGS OF THE NATIONAL ACADEMY OF SCIENCES, US, vol. 101, 2004, pages 7287 - 7292 |
| MAYER ET AL., BIOCHIM BIOPHYS ACTA, vol. 858, no. 1, 1986, pages 161 - 8 |
| NEEDLEMAN; WUNSCH, J MOL. BIOL., vol. 48, 1970, pages 443 |
| OVANESOV ET AL., J THROMB HAEMOST, vol. 3, 2005, pages 321 - 331 |
| PANTELEEV ET AL., BIOPHYS J, vol. 90, 2006, pages 1489 - 1500 |
| PCDCRSEN ET AL., J BIOL CHEM, vol. 265, no. 28, 1990, pages 16786 - 93 |
| PCTCRSCN, EUR J BIOCHCM, vol. 235, 1996, pages 310 - 316 |
| PEARSON; LIPMAN, PROC. NAT'L. ACAD. SCI. USA, vol. 85, 1988, pages 2444 |
| PEDERSEN ET AL., J BIOL CHEM, vol. 265, no. 28, 1990, pages 16786 - 93 |
| POOL ET AL.: "High-potency antihaemophilic factor concentrate prepared from cryoglobulin precipitate", NATURE, vol. 203, 1964, pages 312 |
| PRASAD: "Efficacy and safety of a new-class of hemostatic drug candidate, AV513, in dogs with hemophilia A", BLOOD, vol. 111, 2008, pages 672 - 679, XP002574599, DOI: doi:10.1182/blood-2007-07-098913 |
| ROBERT ET AL.: "Is thrombin generation the new rapid, reliable and relevant pharmacological tool for the development of anticoagulant drugs", PHARMACOL RES., vol. 59, 2009, pages 160 - 166, XP025992468, DOI: doi:10.1016/j.phrs.2008.12.003 |
| SINAURIDZE ET AL., BIOCHIM BIOPHYS ACTA, vol. 1425, 1998, pages 607 - 616 |
| SMITH; WATERMAN, ADV. APPL. MATH., vol. 2, 1981, pages 482 |
| SOOD ET AL., NUCL. ACID RES., vol. 4, 1977, pages 2557 |
| WESSELSCHMIDT ET AL.: "Structural requirements for tissue factor pathway inhibitor interactions with factor Xa and heparin", BLOOD COAGUL FIBRINOLYSIS, vol. 4, 1993, pages 661 - 669 |
Cited By (5)
| Publication number | Priority date | Publication date | Assignee | Title |
|---|---|---|---|---|
| US9574011B2 (en) | 2008-12-22 | 2017-02-21 | Novo Nordisk A/S | Antibodies against tissue factor pathway inhibitor |
| EP2379600B2 (en) † | 2008-12-22 | 2020-10-14 | Novo Nordisk A/S | Antibodies against tissue factor pathway inhibitor |
| USRE47150E1 (en) | 2010-03-01 | 2018-12-04 | Bayer Healthcare Llc | Optimized monoclonal antibodies against tissue factor pathway inhibitor (TFPI) |
| WO2013142153A3 (en) * | 2012-03-22 | 2014-01-09 | Baxter International Inc. | Aptamers to tissue factor pathway inhibitor and their use as bleeding disorder therapeutics |
| CN111411164A (en) * | 2020-05-26 | 2020-07-14 | 中国检验检疫科学研究院 | Method for detecting tomato canker pathogen by using digital PCR and kit reagent used by method |
Also Published As
| Publication number | Publication date |
|---|---|
| EP2673364A1 (en) | 2013-12-18 |
| JP2014507147A (en) | 2014-03-27 |
| JP6002691B2 (en) | 2016-10-05 |
| AU2012214148A1 (en) | 2013-08-29 |
| CA2827160A1 (en) | 2012-08-16 |
Similar Documents
| Publication | Publication Date | Title |
|---|---|---|
| AU2010284329B2 (en) | Aptamers to tissue factor pathway inhibitor and their use as bleeding disorder therapeutics | |
| US8461318B2 (en) | Aptamers to tissue factor pathway inhibitor and their use as bleeding disorder thereapeutics | |
| AU2007223796B2 (en) | Complement binding aptamers and anti-C5 agents useful in the treatment of ocular disorders | |
| US7998939B2 (en) | Aptamers that bind thrombin with high affinity | |
| KR20150003344A (en) | SERPINC1 iRNA COMPOSITIONS AND METHODS OF USE THEREOF | |
| MX2007002772A (en) | Aptamers to von willebrand factor and their use as thrombotic disease therapeutics. | |
| US9012420B2 (en) | Aptamer for chymase, and use thereof | |
| WO2012109675A1 (en) | Aptamers to tissue factor pathway inhibitor and their use as bleeding disorder therapeutics | |
| CN111093771A (en) | Methods and compositions for treating bleeding events in subjects with hemophilia | |
| WO2010091396A2 (en) | Aptamers to von willerbrand factor and their use as thrombotic, hematologic and cardiovascular disease therapeutics | |
| US11473089B2 (en) | Aptamer for ADAMTS5 and use for aptamer for ADAMTS5 | |
| CN113557023A (en) | Serpinc1 iRNA compositions and methods of use thereof | |
| AU2016204713B2 (en) | Complement Binding Aptamers and Anti-C5 Agents Useful in the Treatment of Ocular Disorders |
Legal Events
| Date | Code | Title | Description |
|---|---|---|---|
| 121 | Ep: the epo has been informed by wipo that ep was designated in this application |
Ref document number: 12706378 Country of ref document: EP Kind code of ref document: A1 |
|
| ENP | Entry into the national phase |
Ref document number: 2013553643 Country of ref document: JP Kind code of ref document: A Ref document number: 2827160 Country of ref document: CA |
|
| NENP | Non-entry into the national phase |
Ref country code: DE |
|
| ENP | Entry into the national phase |
Ref document number: 2012214148 Country of ref document: AU Date of ref document: 20120213 Kind code of ref document: A |
|
| WWE | Wipo information: entry into national phase |
Ref document number: 2012706378 Country of ref document: EP |