
Aerial Identification of Fruit Maturity in Amazonian Palms via Plant-Canopy Modeling


1
School of Engineering, Pontificia Universidad Javeriana Bogota, Cra. 7 No. 40-62, Bogota 110221, Colombia
2
The OMICAS Institute, Pontificia Universidad Javeriana, Cali 760031, Colombia
*
Author to whom correspondence should be addressed.
Remote Sens. 2023, 15(15), 3752; https://doi.org/10.3390/rs15153752
Submission received: 7 June 2023
/
Revised: 24 July 2023
/
Accepted: 24 July 2023
/
Published: 28 July 2023
(This article belongs to the Section Remote Sensing in Agriculture and Vegetation)
Abstract
:UAV-based multispectral imagery was used to characterize and associate the canopy features of the Moriche palm with the maturity state of its fruits, by correlating variations in the palm’s reflectance at different wavelengths throughout the phenological cycle. Several approaches for feature extraction were compared based on vegetation indices and graph-based models. A comprehensive dataset was collected and labeled, containing spatial–temporal variations in the features. Experimental results reported an accuracy of 72% in the estimation of the fruit maturity state, applying the proposed system to the dense forests of Colombia Amazonian region. Also, this UAV-based vision system enables monitoring, inventorying, palm identification, and fruit maturity identification, providing support to the local indigenous organizations of the Amazon.
1. Introduction
The Moriche palm (Mauritia Flexuosa) species is found in tropical moist forest ecosystems (in northern South America) and produces palm fruits rich in proteins, fats, vitamins and carbohydrates [1,2,3]. For the department of Guaviare and other regions of the Colombian Amazon, the oil extracted from the Moriche fruits plays a significant role in local economies [4,5,6]. The palm is also fundamental for the conservation of the Amazonian biome, regulating the neotropical wetlands of the rain forest [7]. Given that this variety grows mainly in flooded areas within dense forests, remote sensing approaches are necessary to improve crop monitoring and management practices [8].
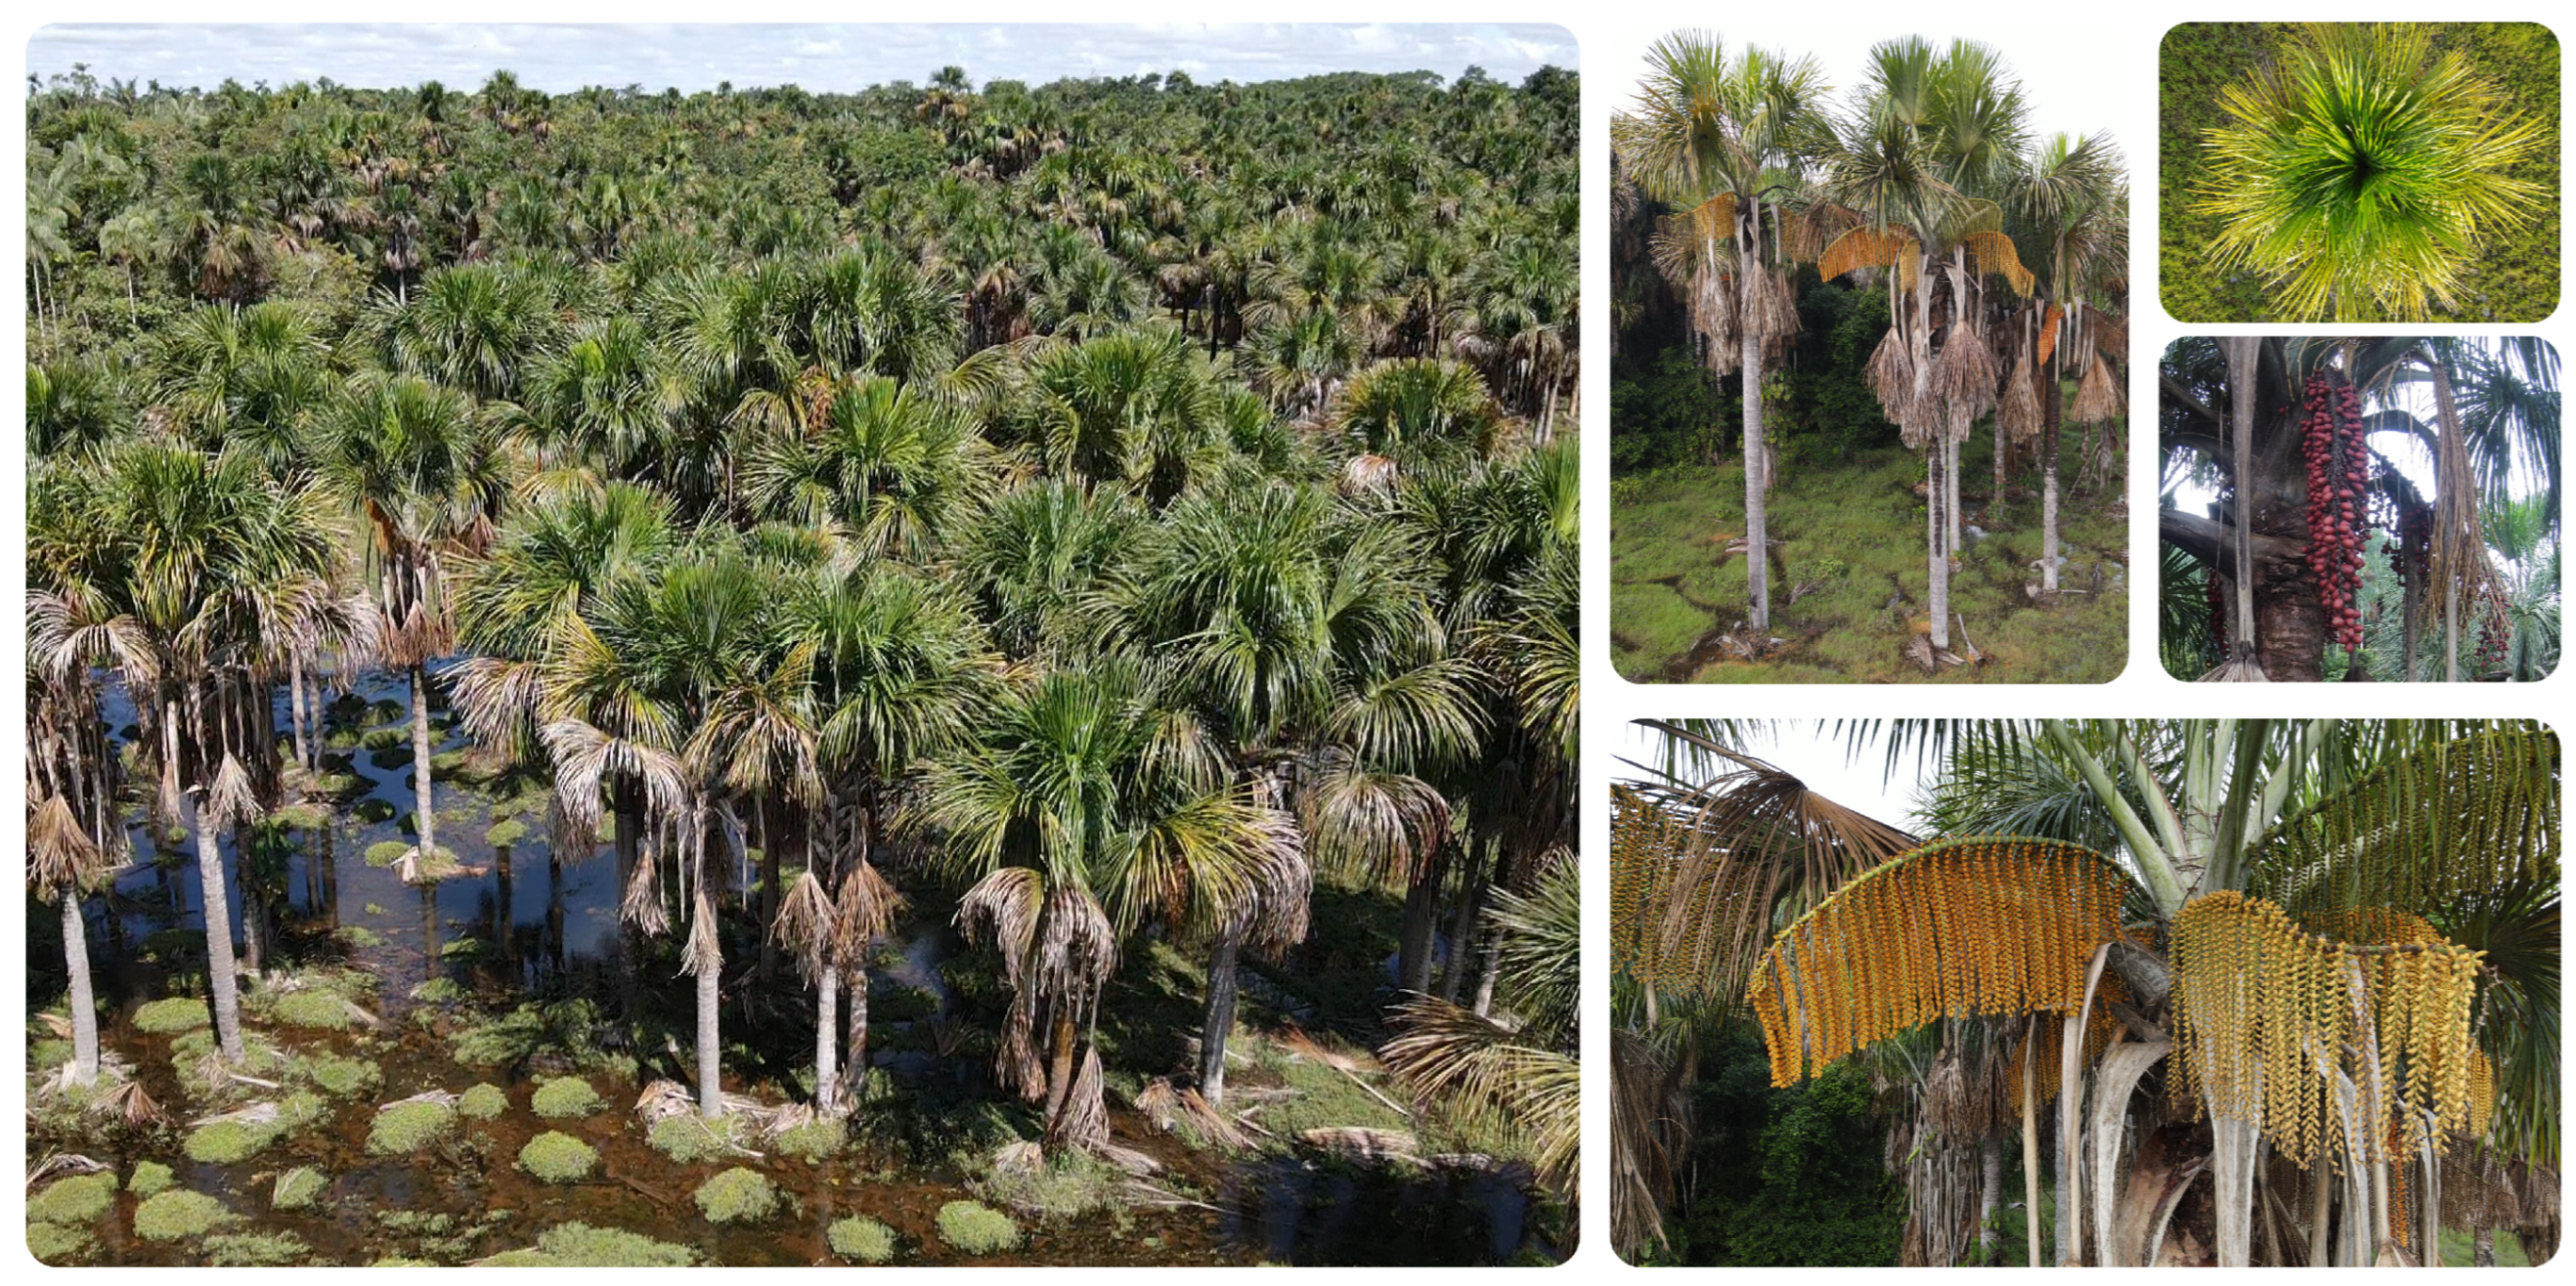
In Colombia, the Amazonian Scientific Research Institute (SINCHI (https://www.sinchi.org.co/, accessed on 20 November 2022)) recently published comprehensive data on the physiology and fruit maturity in the Moriche palm. Their studies highlight the importance of characterizing the fruit maturation process in relation to the palm’s phenological cycle to establish biological correlations between the palm canopy and the ripeness of its fruits. Due to the challenges of accessing these dense forests, remote sensing approaches are being considered to streamline crop assessment practices for local communities [9]. In this regard, we propose the deployment of an unmanned aerial vehicle (UAV) equipped with multi-spectral sensors to automate the process of fruit maturity characterization using deep learning models. Figure 1 presents photos of the Moriche palms located in the dense forests of the Colombian Amazon region.
The use of UAVs with computer vision techniques in precision agriculture has been extensively researched [10]. Numerous applications have been developed for estimating chlorophyll concentration, nitrogen levels, biomass accumulation, fruit quantity, and for predicting maturity in traditional crops [11]. However, limited research has been carried out on unstructured crops, such as Amazonian palms located in dense forests [12]. Considering the advancements in the field and the need to reduce the time and risks associated with the harvesting of such crops, this study proposes a hypothesis to determine fruit maturity via correlations with the observed characteristics of the palm canopy.
Literature Review
Studying plant physiology in the agricultural context can provide valuable information on specific crops throughout their growing cycle, which can translate into indicators for monitoring plant health, detecting anomalies, and predicting optimal times for harvest. This section provides an overview of the multiple applications for drone or UAV use in agriculture and outlines the various sensors used for data acquisition. It also outlines computer vision concepts, including image processing techniques, feature extraction methods, and different algorithms associated with machine learning (ML) and deep learning (DL). By combining these technologies, we can enhance our understanding and analysis of plant-related data in agricultural settings.
In plants, chlorophyll adsorbs blue and red light radiation, while other bands of light are not adsorbed but reflected. In [13], chlorophyll and carotenoids were identified as being responsible for absorbing and converting light energy into chromophore molecules that respond to solar radiation, associating the green bands with chlorophyll production and the yellow-orange bands with carotenoids. This molecular process produces ethylene, a phytohormone that accelerates leaf development, ripening, and flowering in many plants [13]. Through the monitoring of ethylene levels, correlations can be established between fluctuations in this hormone in plants and fruit maturity.
Furthermore, in terms of plant morphology, this adjusts the positions of their leaves over those of their neighbors at the same altitude of the plant canopy to avoid a reduction in light incidence, especially the red/far red ratio. The leaves contain an organ, the Pulvinus, that controls their movement according to lightness–darkness. During the day, the leaflets are open and in a horizontal position, while at night, they close into a vertical position. The pulvinus is approximately 2–7 mm in length and 2–3 mm in diameter. The flowering process for each specie occurs synchronously for all individuals of that specie in the same geographical area to ensure their genetic exchange and reproductive success. During the fruiting process, there is a relationship between the leaf and fruit, and the elimination of leaves at the beginning of the cell division phase in the fruit leads to a decrease in sucrose. In this regard, ethylene is not only activated in large quantities during the fruit-ripening process but is also activated during leaf abscission and floral senescence [13].
Stress, whether biotic or abiotic, causes changes in leaf color, reduces the photosynthetic rate, and inhibits photosynthesis and respiration, as well as activating senescence and abscission. Finally, [13] the authors state that ethylene is not only activated in large quantities during the fruit-ripening process in climacteric plants but is also activated during leaf abscission and floral senescence. Likewise, a wound in the plant or any type of water or nutritional stress also activates it, and it is also found to produce the downward curvature of the leaves.
As observed in Figure 1, the Moriche palm is a tall tree that can grow up to 40 m in height. It has a spherical crown and palmate leaves, usually between 11 and 14 in number, which can be 2.5 to 4.5 m long and wide, respectively. The leaves are divided into about 200 segments. The palm produces up to eight inflorescences, which emerge from between the leaves. The fruit is elliptical, 7 cm long and 5 cm in diameter, and when ripe, it is dark orange-red to reddish-brown, fleshy, and oily. The Moriche palm grows in seasonally or permanently flooded wetlands and forms large populations/forms clusters or stands called cananguchales, aguajales or morichales. The fruit growth and development of the Moriche palm lasts for around 250 days and each fruit usually has a single seed. Fruits exhibit typical climacteric behavior during the initial stage of development before entering a period of stability until maturity. There was an absence of ethylene observed during the sampling periods [8].
The right plots of Figure 1 detail the inflorescence of the palms. Flowering takes between two and eight months, and fruiting between 10 and 12 months. However, the timing of these processes varies in each region; in the Guaviare Amazon area of Colombia, female flowering occurs between May and July during the period of heavy rains, and between August and December, a period in which rainfall decreases slightly. Inflorescence occurs between the leaves, each with up to 100,000 male flowers and 6000 female flowers [14]. One palm produces between four and eight bunches of palm fruits per year, each bunch containing up to 730 fruits, each weighing 85 g. From a single palm, 100 to 200 kg of fruit can be harvested per year. Each fruit takes approximately four months to grow and four more months to ripen [14]. Figure 2 shows the five types of maturity stages by following the classification presented by [5].
The experiments with apple crops conducted by [15] observed low photochemical performance in the early stages of crop growth. It was found that leaves from non-harvested crops have lower photochemical yield than those from harvested crops. The total chlorophyll per leaf area remained constant from the beginning to the middle of the cycle. In crops that fructified, chlorophyll levels increased and showed a positive and linear correlation with fructification.
The experiments conducted by [16] with potato crops demonstrated that fruit-bearing plants exhibit higher respiration rates and net photosynthetic yields. In a study on Tommy mango crops conducted by [17], it was observed that photosynthetic rates decrease under water deficit conditions, with the greatest impact occurring during the fruiting stage rather than the physiological maturity stage. Ref. [18] documented that coffee plants exposed to direct sunlight develop smaller leaves, along with leaf abscission during the fruiting season.
In [19], it was observed that leaf development begins to increase during fruiting and reaches the maximum leaf area during the later stages of growth and fruit maturity. Subsequently, the leaf area decreases and undergoes accelerated abscission during harvesting. According to [20], ethylene is a plant hormone produced in various plant organs and plays a key role in processes such as leaf abscission, fruit ripening, and flowering. Additionally, ethylene regulates the senescence of these plant organs.
In a study conducted in the southeastern region of the Guárico state in Bolivia, Ref. [6] investigated the physiognomic and floristic characteristics of fruit fall. They observed that fruit fall coincided with the rainy season and the ripening period. Additionally, they found that certain individuals exhibited flowering and inflorescence one year but not in the following year, suggesting a cyclical pattern of reproductive behavior. Regarding the Moriche fruit, Ref. [21] reported that it exhibits climacteric behavior. In its green state, the fruit presents low respiration and ethylene production. From 180 to 320 days, there is a slight increase in respiration and ethylene production, followed by stability until the fruit reaches full ripeness.
The authors of [22] proposed a land classification method that utilizes VI based on the visible spectrum, specifically the Visible Band Difference Vegetation Index (VDVI). This index aims to capture information related to plant greenness. It is worth noting that VI based on RGB (red-green-blue) channels are generally sensitive to plant greenness as mentioned in [23]. In another study by [24], the Green-Red Vegetation Index (GRVI) was identified as an effective phenological indicator for biomass estimation. This index leverages the differences in reflectance between the green and red bands to provide insights into plant biomass dynamics. Additionally, the Modified Green Red Vegetation Index (MGRVI) was found to enhance the reflectance differences between specific bands, thereby improving the estimation of plant biomass and serving as a predictor of chlorophyll content as discussed in [25].
In [26], additional VI are introduced, including the Visible Atmospheric Resistance Index (VARI) and the Normalized Green-Red Difference Index (NGRDI). These indices are employed to estimate the vegetation fraction in a given area. Indices such as the excess green index (ExG) and the color index of vegetation (CIVE) have been tested for identifying green vegetation, while the Normalized Difference Vegetation Index (NDVI), initially proposed by [27], demonstrated a strong correlation with changes in plant maturation stages, as indicated by [28]. In their study, Ref. [28] also combined multiple VI to enhance the correlation for estimating chlorophyll variations during crop growth, flowering, and fruiting. They observed that chlorophyll levels at the canopy level were lower during the fruiting stage.
While VI have been used to investigate various plant phenomena by exploiting light reflectance, Ref. [29] proposes the evaluation of characteristics beyond VIs. The author suggests a data-fusion technique based on graphs using multispectral image data.
In [30], multispectral imaging combined visible/near-infrared (VIS/NIR) and thermal infrared (TIR) data acquired from a UAV to estimate the chlorophyll concentration. A ML model was used, and results compared with ground truth data obtained from in situ measurements taken using a SPAD device directly on the leaves. Their findings revealed a strong correlation between in situ readings and NDVI measurements. Similarly, in [31], the researchers focused on the remote estimation of chlorophyll in corn and soybean crops. They highlighted the significant variation in chlorophyll concentration throughout the crop growing season.
In [28], variations in chlorophyll levels were recorded during different stages of crop growth, including flowering and fruiting. In [32], a deep learning algorithm was employed to model the net photosynthesis behavior of plants based on three inputs: light level, concentration of , and temperature. The results showed impressive predictions with an accuracy exceeding 95%.
In [33], a significant study was carried out on disease detection in wheat plantations using near-infrared (NIR) bands and the visible range. It was found that the NIR range, along with the visible range, provided valuable information for detecting diseases and predicting chlorophyll levels during the mid-stages of grain development and maturity. They also observed a strong correlation between NIR measurements and visual assessments conducted by human operators.
In a recent study conducted by [34], it was found that plant leaf area, terrain topography, and canopy architecture all play a crucial role in detecting plant disease. By using heat maps and evaluating the plant’s state using the normalized difference vegetation index (NDVI), a random forest machine learning model was trained and achieved a correlation result of 71%. Similarly, in study [35], the ripening period of a vineyard was monitored using a portable visible/near-infrared (VIS/NIR) spectrometer. The data analysis was enhanced through principal component analysis (PCA) and partial least squares discriminant analysis. The authors emphasized that leaf metabolites undergo variations during the vegetative cycle, particularly during ripening.
In [29], a novel methodology for feature extraction in agricultural applications is presented, offering an alternative approach to traditional VI. The authors propose the use of graph-based data fusion techniques to extract meaningful information from the multispectral bands of an image for change detection and prediction of agricultural variables. The methodology involves constructing graphs from the multispectral data, and then extracting feature vectors and eigenvalues from them. These extracted features are subsequently used to train a classifier. However, since feature extraction by vectors can be computationally demanding, the authors address this issue by implementing an additional procedure called the Nystrom extension, which helps reduce the dimensionality of the feature vectors.
The necessary foundations in plant physiology can be found in the literature to understand the relationship between fruit maturity and the physiological and spectral changes in the leaf, mediated by the phytohormone ethylene. Additionally, computer vision tools, such as image processing, feature extraction using VIs, and graphs, as well as ML models, are addressed in order to develop a system capable of identifying the maturity state of the fruits using information obtained from the canopy of each palm. This approach aims to contribute to the development of a monitoring system for Moriche palms, an Amazonian species that is found in a dense, swampy, and difficult-to-access forest environment.
2. Materials and Methods
In order to achieve the identification of the fruit maturity state in the Amazonian Moriche palm, through correlations with the reflectance state at the canopy level, VIS/NIR images are captured by a UAV at a height of 60 m, equipped with a multispectral camera, throughout a phenological cycle. Each of the image bands is automatically segmented using the Mask R-CNN deep learning algorithm to identify the region of interest (RoI) and extract features based on VIs and graphs. This forms a dataset of two classes (green and ripe) to train various supervised ML models to predict the fruit maturity state. Additionally, an analysis and modeling of the dataset is performed to understand its behavior, temporal variability, and correlation with the fruit maturity state.
Figure 3 illustrates the proposed system architecture for the acquisition of multispectral images and the subsequent identification of palm fruit maturity. The architecture consists of five modules:
- Module B1 is responsible for acquiring the multispectral images, which include five bands (R, G, B, RE, and NIR) as well as the RGB image.
- In Module B2, a palm identification model is utilized to segment and extract the region of interest (RoI) from each band.
- Module B3 conducts a temporal variability analysis and modeling of each feature to understand their response and correlation with the maturity stages of the fruit. The resulting data are structured and appropriately labeled.
- Module B4 is responsible for training, validating, and testing the ML models for identifying fruit maturity stages through correlations.
- In Module B5, the segmentation steps are performed using the ML model, feature extraction is carried out on the RoI, and fruit maturity is estimated by correlating it with the reflectance of the canopy.
Figure 3.
System architecture.

2.1. Protocol for Image Acquisition
UAV flight missions were conducted every two weeks over the course of one year, from October 2020 to September 2021, to capture multispectral imagery of palm plots located in the Guaviare Department, Colombia, as shown in Figure 4. The multispectral camera mounted on a Phantom 4 Multispectral UAV was used to capture imagery at altitudes of 60, 90, and 120 m above ground level. The camera had a resolution of 2.08 MP per band, and the image size was , with a resolution of 3.2 cm/pixel at 60 m altitude. Waypoints were set for the UAV to ensure coverage of each palm within the designated plots. The UAV autopilot was employed to capture images at the canopy level, covering the crown of the palms. In manual pilot mode, the drone was maneuvered as closely as possible to the surrounding vegetation to monitor the fruiting or inflorescence state of each palm. Relevant weather information, including temperature, wind speed, and sky conditions, was recorded for each flight.
The flight mission followed specific criteria for image classification, labeling, and storage. Images were categorized and labeled based on the date and genus, with additional labeling according to the plant and fruit state. The detailed procedure is as follows:
- General conditions: First, palms were selected by their genus and species and the location of each georeference. Then, palms were physically marked with reflective tape to differentiate between genders. Next, imagery was captured around each palm at a distance of less than three meters, with the UAV controlled manually following a polygon waypoint path. A dataset was created from the acquired images, along with the palm, fruit and weather conditions. To ensure consistency in the physiological state between the fruits and the canopy, days with similar illumination and solar radiation were selected for the UAV mission. A weekly flight was conducted for each variety, with local time between 9–11 a.m. and 3–5 p.m.
- Canopy level: The minimum flight altitude was determined at 60 m. Lower altitudes could result in partial or total exclusion of the palm due to geolocation precision and climatic factors.
- Fruit level: In order to capture images of the fruit clusters on each palm, manual flights were conducted, ensuring that sufficient space was maintained around each palm to maneuver the UAV and avoid collisions. Images should be captured of each cluster from multiple angles, distances, and heights, with a focus on capturing images as closely as possible. Additionally, images of the fruits and inflorescence were captured. The canopy around the palm and at the top should also be captured at various heights and distances.
- Segmentation (RoI): The region of interest (RoI) was extracted by applying a Mask R-CNN-based algorithm for object identification developed by the authors in previous work reported in [36]. Since the object detector of the original algorithms works with RGB images, a sub-process was designed for the extraction of the RoI to all spectral bands.
2.2. Segmentation and Extraction of RoI
The RoI segmentation and extraction process was performed using the Palma Moriche identification algorithm developed in a previous phase of this research [36]. This algorithm, based on Mask R-CNN, was modified in its final layers and retrained with images specifically focused on palm identification. As the object detector operates on RGB images, a subprocess was designed to extract the RoI in all spectral bands. This subprocess involved using the same mask for each object in RGB and assigning a label related to the corresponding image of the spectral bands, considering the possibility of multiple objects (palm instances in this case) in each image.
2.3. Feature Extraction
For this study, a comprehensive literature review was carried out to explore the use of vegetation indices (VIs) as a tool for extracting plant features. VIs are mathematical models that combine the various wavelengths of light associated with plant reflectance. The review aimed to identify and analyze the difference, and was carried out with various aspects of plant physiology and growth, including canopy structure, atmospheric stress, chlorophyll production, biomass and leaf nitrogen dynamics, plant senescence, and palm inflorescence.
2.3.1. Vegetation Indices
We selected 25 VI features as outlined in Table 1. Each feature, denoted as , is calculated as the mean value obtained by applying the vegetation index calculation to each region of interest as described by Equation (1). Additionally, Equation (2) enables us to model the behavior of each index by considering all the features extracted per flight, denoted as . Subsequently, these features are plotted in the time domain to identify the temporal changes in reflectance of the palms for each variable.
2.3.2. Graphs
Graphs consist of nodes and edges that contain valuable information and data, which can be processed and extracted for estimation purposes. Nodes within a graph can interact with nodes from other graphs, revealing information that may not be perceptible through other methods, such as VI. This enables us to calculate the relationships between data in each channel of an image.
Graph-based methods typically employ the Nyström extension theory [45,46,47,48] to determine relevant features from a dataset while applying comprehensive dimensionality reduction to select the most accurate features. To construct the graph, we utilized the model described in Equation (4), which enables the identification of temporal changes in the reflectance of the palms. Each image band contains pixels that can be interpreted as graph nodes. These nodes are connected pixel-by-pixel within each band, forming the edges. The graph, denoted as , consists of the set of nodes V and the set of edges E that describe the direct relationships between nodes. An edge connects two nodes, and a node can be connected to more than two nodes through the edges. The feature vector is obtained from the spectrum of the eigenvectors, and the mean of the vector is used for the corresponding modeling. The relationships among nodes are quantified by weights denoted as , as described in Equation (3):
where represents the Euclidean distance between the associated pixel values, and denotes the standard deviation of all the values:
where represents the mean value of the complete vector of eigenvalues for each RoI. This allows us to observe the temporal behavior of the variable throughout the phenological cycle and compare its performance with that of the VI.
2.3.3. Convolutional Neural Networks (CNNs)
CNNs have become the foundational framework for deep learning-based large-scale object detection [49]. Figure 5 illustrates the CNN-based model employed in this study, consisting of two main modules: (i) a feature extractor, comprising a series of convolutional filters applied to the input image to generate a feature map, and (ii) a fully connected layer classifier. The convolution process involves calculating the scalar product between the input matrix and the defined kernel, pixel by pixel. The size of the feature map depends on the kernel size and the defined strides, typically utilizing or kernels with 1, 2, or 3 strides. Equation (5) describes the convolution filters, while Equation (6) represents the non-linear activation function rectified linear unit (ReLU). The ReLU function is widely used to introduce non-linearity in neural networks, enabling the learning of complex patterns and enhancing performance. It is a simple and computationally efficient function that outputs the input value if it is positive, and outputs zero if it is negative. Equation (7) describes max pooling, where the maximum pixel value within each defined window is retained, effectively reducing the feature map.
2.4. Data Modeling and Classification
The process of data modeling involves examining the relationship between the variables of VI and graphs with the time variable. Pearson’s correlation coefficient is utilized to determine the strength of the relationship between two variables. Equation (8) presents the mathematical expression for Pearson’s correlation coefficient, where r is the coefficient and ranges between −1 and 1. An r value close to 1 indicates a strong positive correlation, while a value close to −1 suggests a strong inverse correlation. Coefficients near zero indicate no linear correlation. The symbol represents covariance, while and denote the standard deviation of x and y, respectively.
The time variable represents each date on which the flights were conducted to capture the images. These flights were carried out over a complete phenological cycle. A total of 30 flights were conducted on 30 different dates; therefore, the time variable is expressed in values from 1 to 30, corresponding to each of the flights conducted:
The dataset (CD) is organized into three groups of characteristics as follows: CD1 with the 25 VI; CD2 with the 50 characteristics of the graphs; and CD3 with the 25 VI and the sum of the components of the graphs, which gives as a result a total of 26 features for CD3. The dataset is divided into two classes: C1 (Class 1) for the maturity stages green, pinton 1 and pinton 2; and C2 (Class 2) for pinton 3 and ripe. This is illustrated in Figure 2.
For training and validation, the Lazy Predict (https://lazypredict.readthedocs.io/en/latest/index.html, accessed on 15 March 2020) tool was utilized, which provides a range of classification and regression models, offering metrics, such as accuracy, ROC-AUC, F1-Score, and processing time. Additionally, a conventional artificial neural network (ANN) with two hidden layers, rectified linear unit (ReLU) activation functions, and a Sigmoid activation function in the output layer was trained. The model used the binary cross-entropy loss function, the Adam optimizer with a learning rate of 0.001, and 100 epochs.
The proposed CNN architecture consists of three convolutional layers with increasing filter sizes and ReLU activation functions. Each convolutional layer is followed by max pooling with a size of . The model is trained using RGB images of size and employs the binary cross-entropy loss function, the Adam optimizer with a learning rate of 0.0005, and a batch size of 32. The classification task involves two classes: “green” and “mature”. To enhance the diversity and quantity of the training data, data augmentation techniques are applied. The augmentation parameters used are as follows: a rotation range of 50 degrees, a width shift range of 0.3, a height shift range of 0.3, a shear range of 15 degrees, a zoom range of [0.5–1.5], and both vertical and horizontal flips are enabled. The inclusion of data augmentation techniques helps in artificially increasing the dataset by applying various transformations to the original images. These transformations, such as rotation, shifting, shearing, zooming, and flipping, introduce additional variations and increase the model’s ability to generalize under different conditions and perspectives.
The classification processes involved training and validating the models using a database consisting of 1758 instances. The dataset was divided into two classes: the Green Class (GC) and the Mature Class (MC). Importantly, the dataset was fully balanced, meaning that the number of instances in each class was equal. To ensure an unbiased evaluation of the model’s performance, the dataset was split into training and validation sets. The training set comprised 70% of the data, while the validation set contained the remaining 30%. This division allows the model to learn from the training data and assess its performance on unseen instances from the validation set. The balanced nature of the dataset helps prevent biases towards any particular class and ensures that the model receives sufficient exposure to both the Green and Mature classes during training. This balanced distribution contributes to fair and accurate evaluations of the model’s classification performance on both classes. By employing this approach, the model’s ability to accurately classify instances from both the Green and Mature classes can be effectively evaluated and validated.
3. Results
3.1. Data Collection
An entire phenological cycle was captured from October 2020 to September 2021, during which a total of 60 UAV flight missions were conducted. Table 2 details the corresponding data. In addition, manual pilot flights were conducted immediately after each automatic flight to visually assess the state of maturity of the fruit and the overall condition of the plant from a 360-degree perspective. A total of 30 flights were executed per plot with four to seven images captured per palm using all bands of the multispectral camera. Figure 6 illustrates the same palms captured on four different dates, specifically the Moriche species in Plot 1.
Using the Moriche palm identification and segmentation model, images from farm 1 were processed to extract the RoI characteristics. The traversal of this farm consisted of 18 points or images, each image with more than one palm, to obtain a total of 59 palms, which is the same as 59 RoI. A total of 30 flights were made throughout the phenological year. In this way, a dataset of 1770 instances was consolidated. With the segmentation algorithm, the characteristics based on VI and graphs of each spectral band were extracted to finally structure a dataset for each group of defined characteristics. Figure 7 displays the extracted regions of interest for all bands of an image containing three palms.
3.2. Feature Extraction and Data Modeling
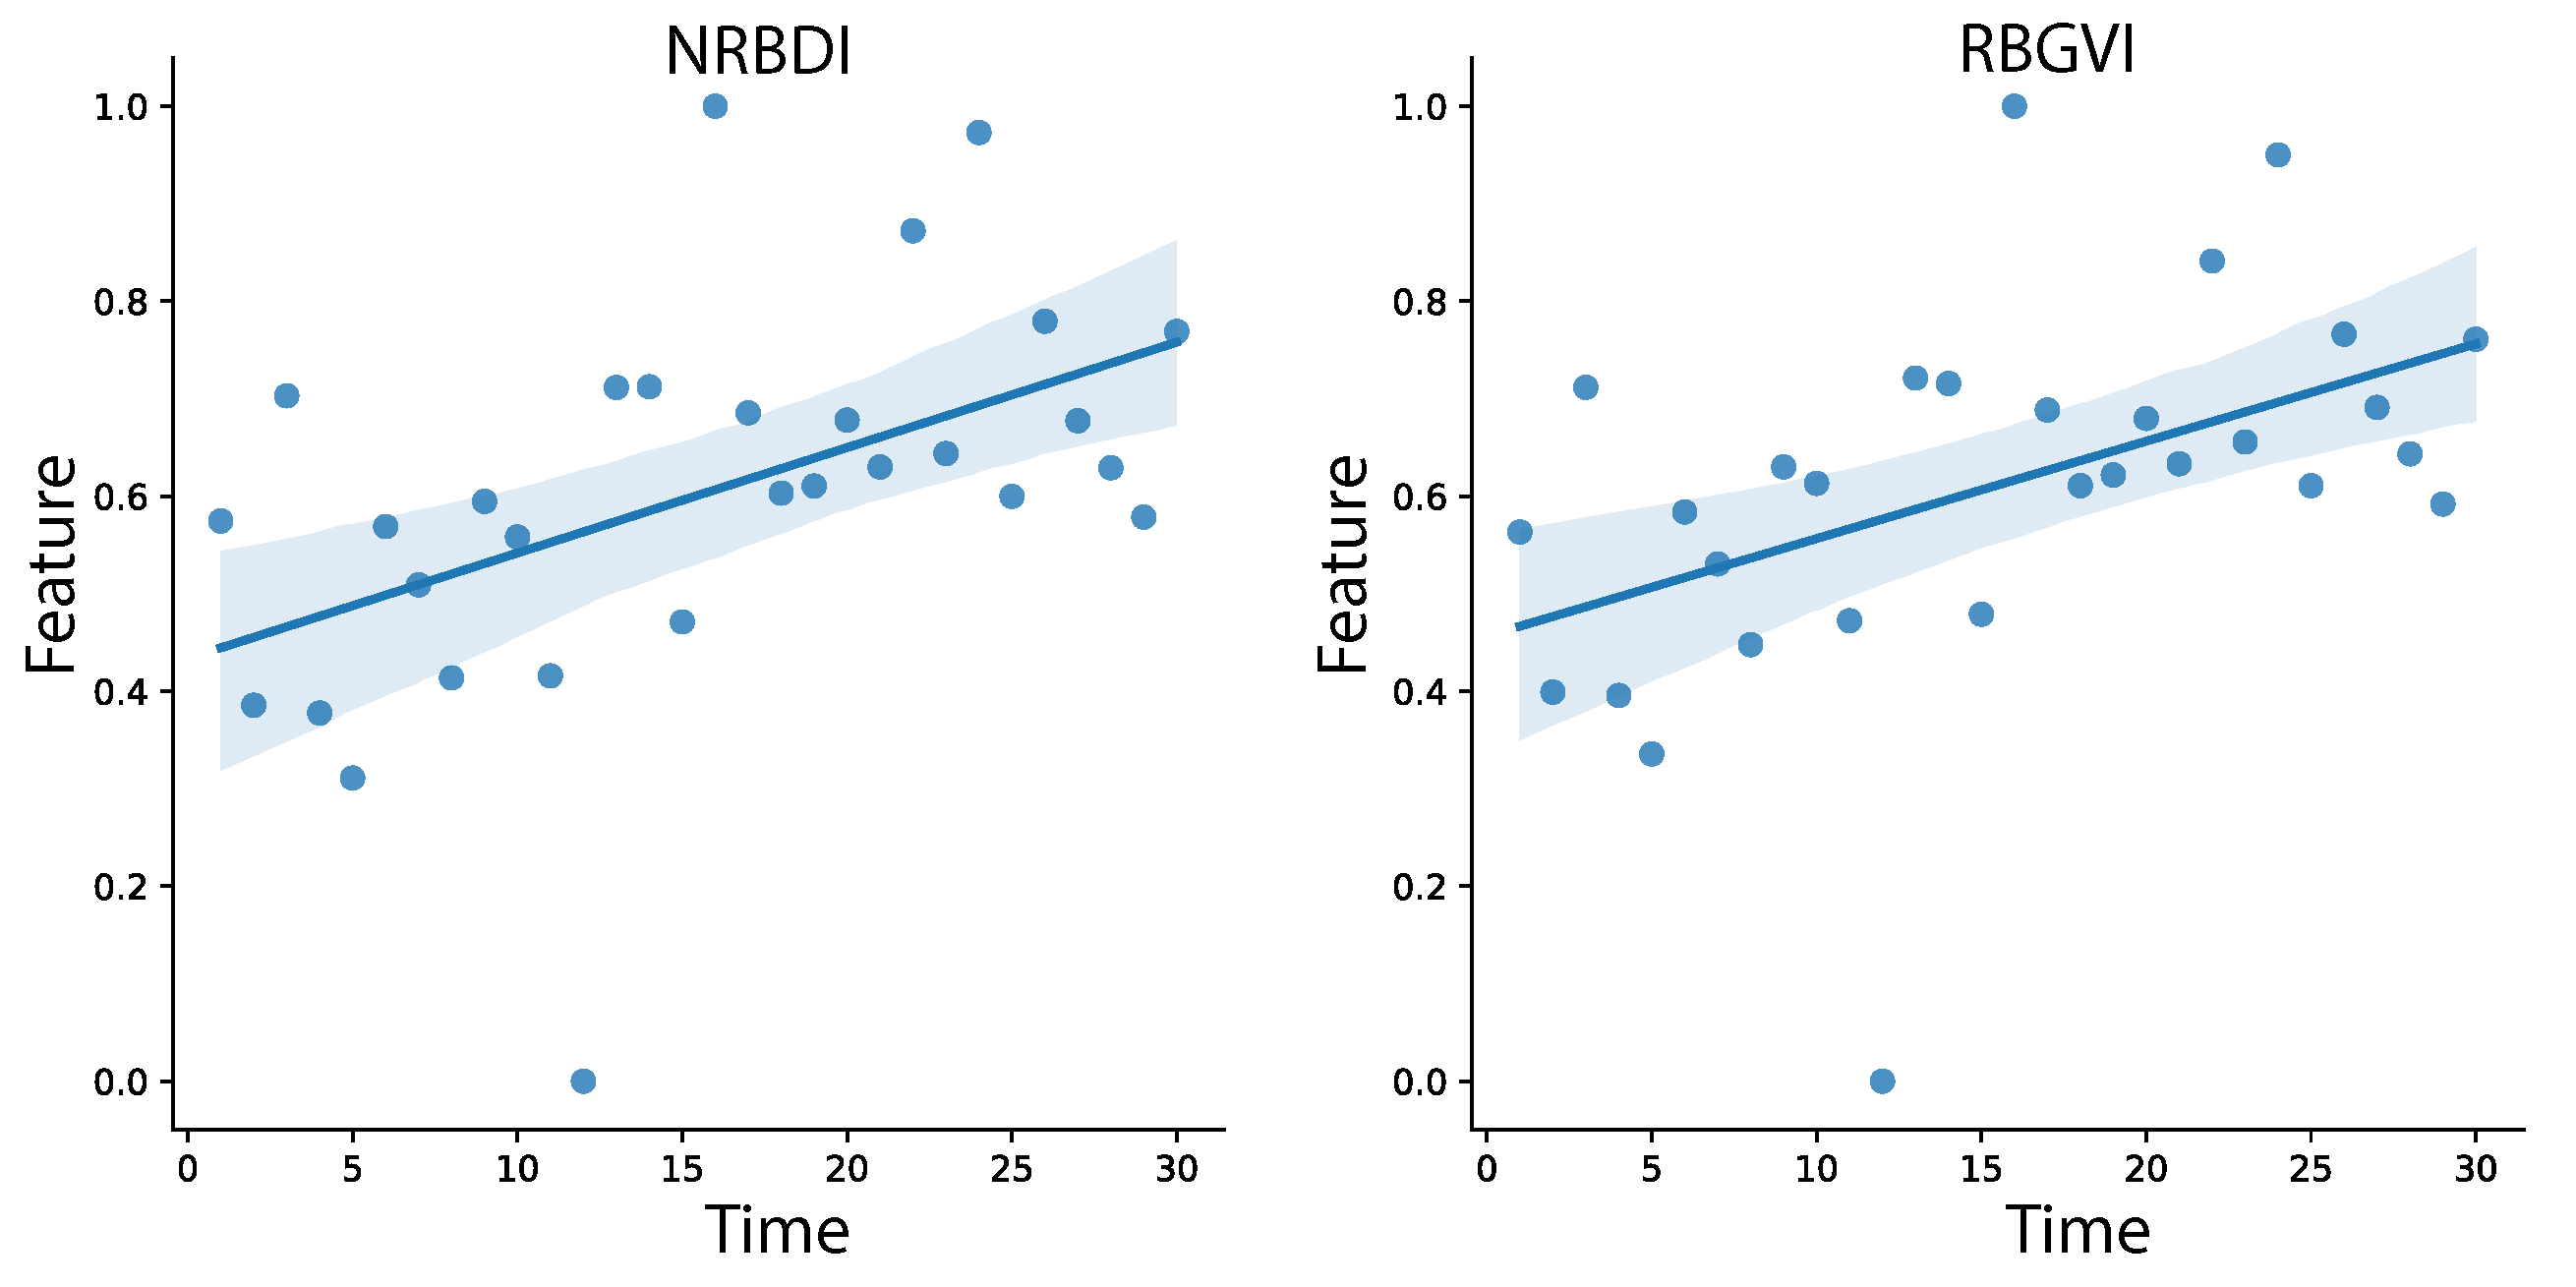
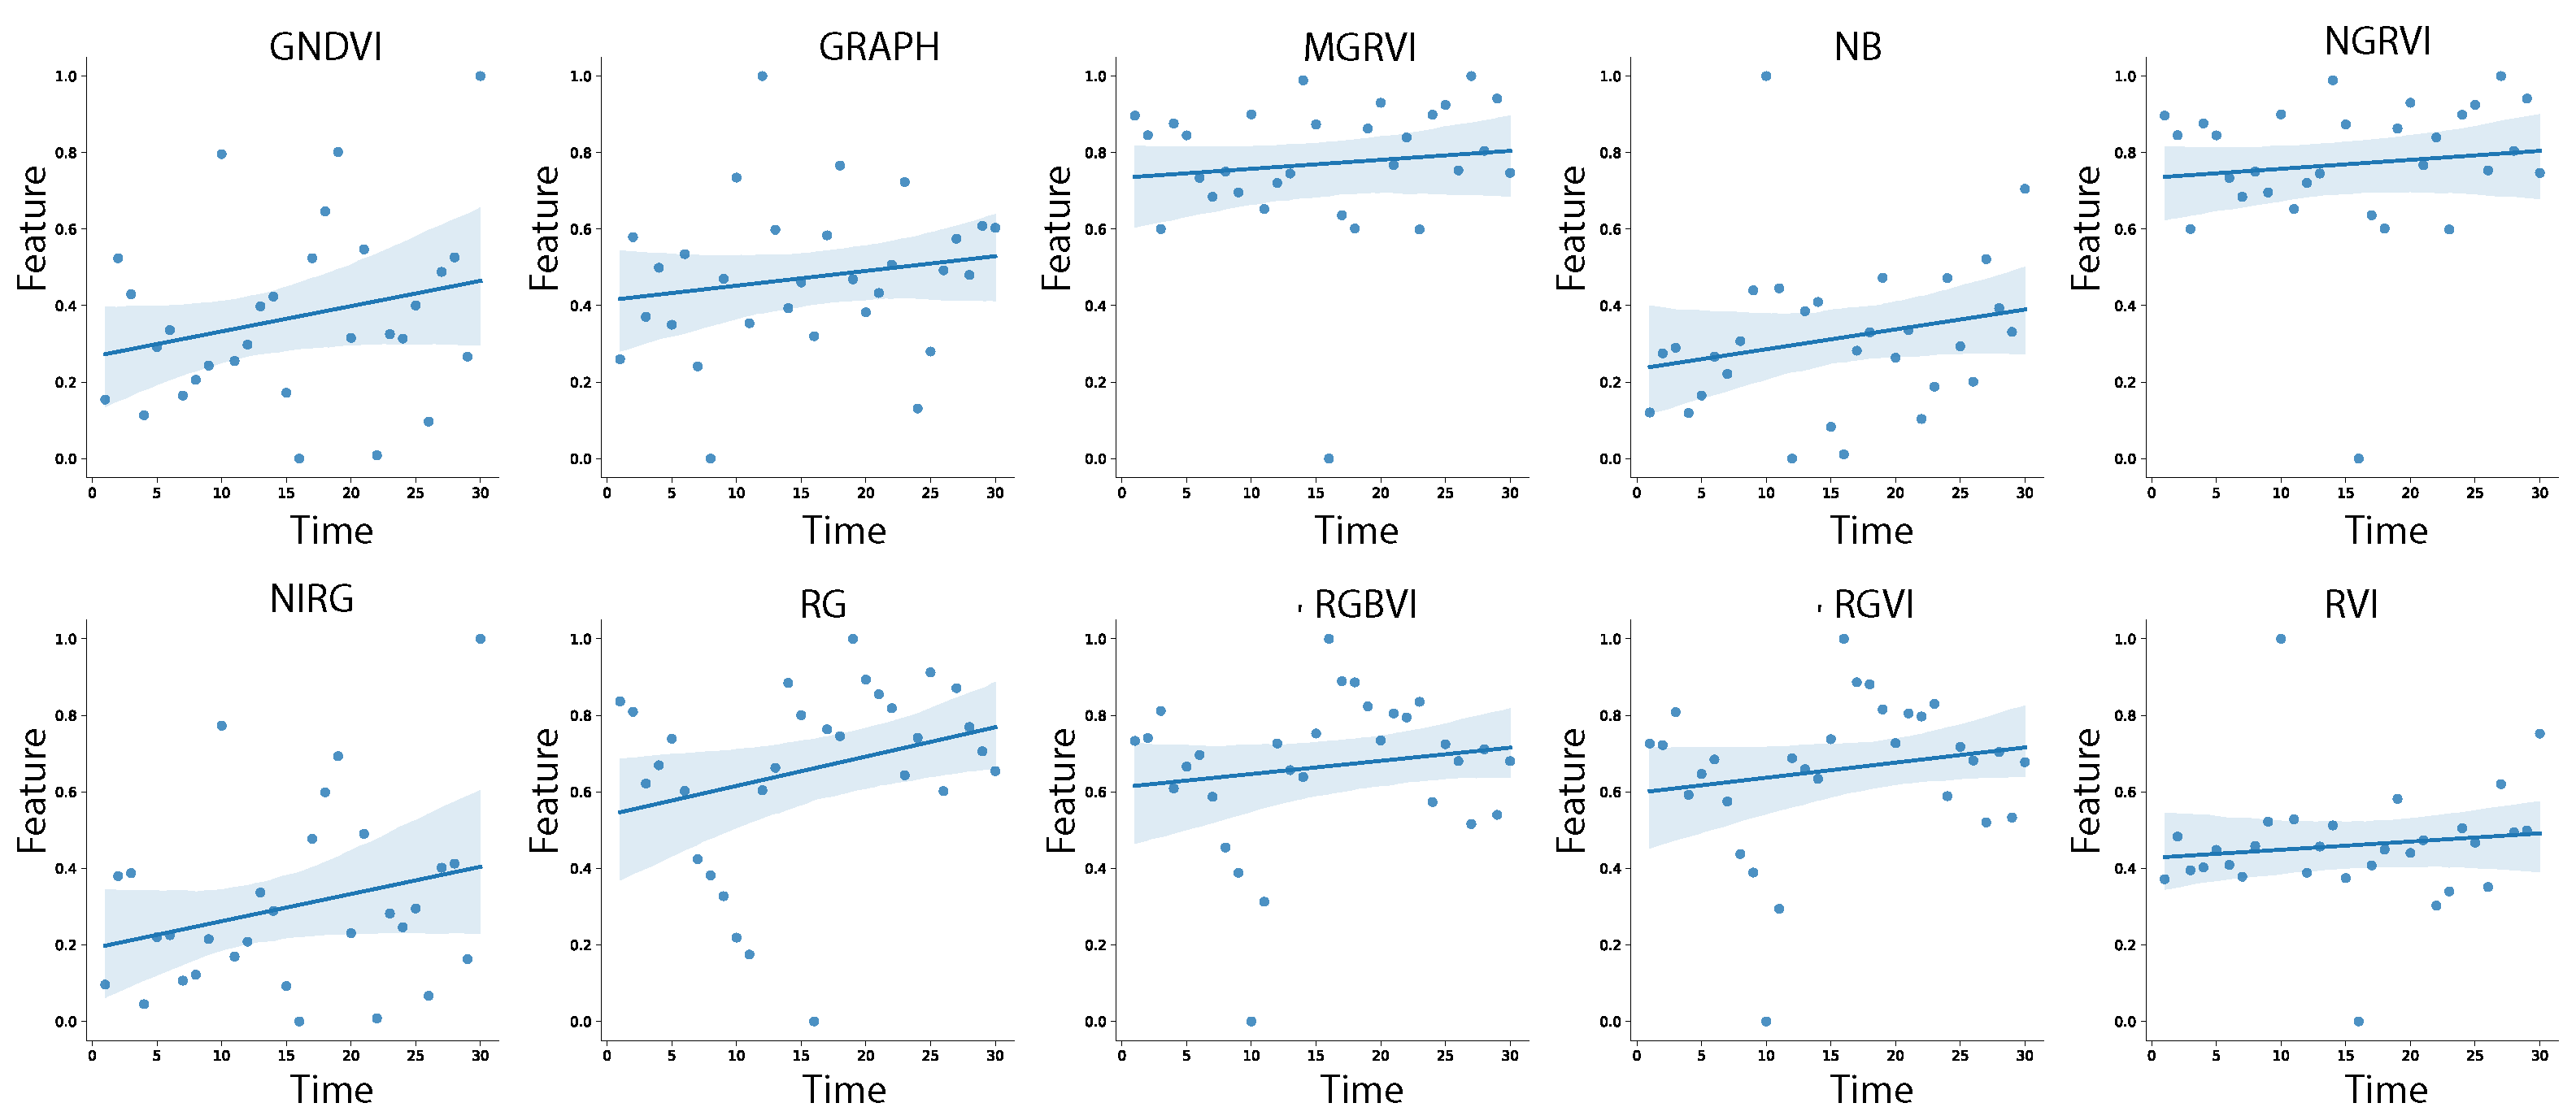
By applying the 25 VIs as feature extractions on the region of interest (RoI) for each image, a dataset of 1770 instances is created. Similarly, a dataset of 50 features per 1770 instances is constructed using graphs. To analyze the temporal changes in the data throughout the phenological cycle, Pearson’s correlation model is applied to the entire dataset. Figure 8 illustrates the Pearson correlation map, which displays the strength of relationships between each variable (VIs and graphs) and the time variable, ranging from 1 to 30. The Pearson correlation map, which represents the correlation matrix as a heat map, provides an overview of the relationships between variables. The map ranges from 1 (light colors) to −1 (dark colors), indicating the strength and direction of the correlations. In this study, the map reveals a moderate relationship for NRBDI and RBGVI indices, low correlation for GNDVI, RGVI, MGRVI, RG, RVI, NIRG, NB, RGBVI, NGRVI, and GRAPH, and low negative correlation for GRVI and VARI. Other characteristics, such as NDVI, exhibit a low linear correlation. Figure 9, Figure 10 and Figure 11 provide detailed information on the linear behavior of the characteristics with moderate, low, and negative correlation, respectively. Table 3 summarizes the numerical results.
3.3. Estimation of Maturity State through Correlations
For the estimation of fruit maturity, the ML models underwent training and validation. As mentioned, the dataset was divided into two classes, the Green Class (GC) and Mature Class (MC), with 1758 out of 1770 data points available. Twelve false positives were identified during the RoI review and subsequently removed from the datasets. The results for each method are presented below. The CNN training and validation process used a dataset with the same two categories (GC and MC). The progress of the training process over 100 epochs is illustrated in Figure 12, where the curve for the loss function shows a decreasing trend, indicating a reduction in error as training progresses. However, the accuracy curve exhibits fluctuations, suggesting inconsistent classification results.
To assess the model’s performance, three new datasets were created, each comprising 100 instances, with 50 instances each for the GC the MC. These datasets were used to evaluate the trained CNN. The resulting confusion matrices, displayed in Table 4, provide insight into the model’s performance on these datasets. The accuracy values obtained for the three datasets were 53%, 54%, and 48%, respectively, indicating the proportion of correctly classified instances. The confusion matrices present information on false positives (FPs) and true positives (TPs), which represent instances that were incorrectly and correctly classified, respectively. Overall, the evaluation results suggest that the CNN model achieved moderate accuracies on the new datasets, but there is room for improvement. The analysis of the confusion matrices can provide insights into specific areas where the model may be struggling or misclassifying instances.
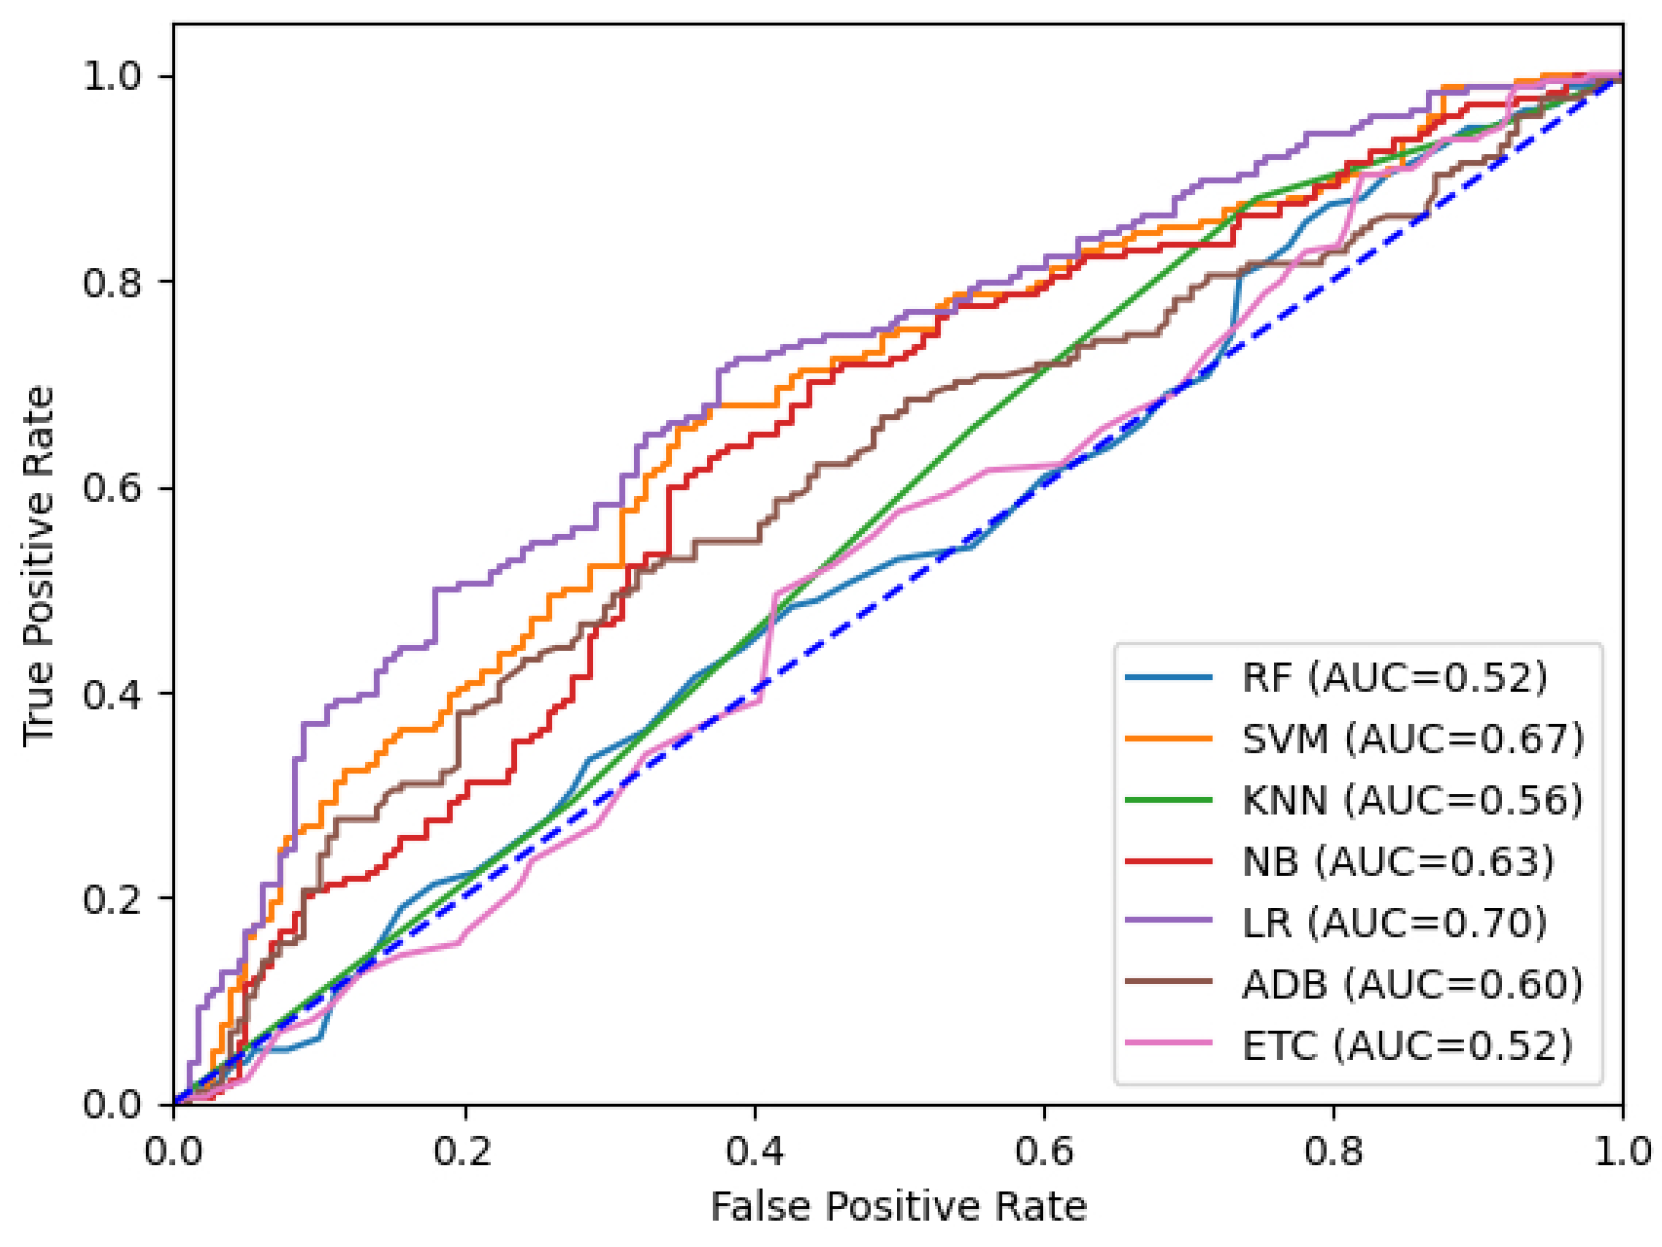
Table 5 presents the results obtained from training the ML models using the Scikit-learn Lazy Predict tool. The highest accuracy achieved during the training process was 70% with characteristic group VI. Seven ML models were trained using the same dataset. Figure 13 displays the ROC curve, which represents the training and validation outcomes. Notably, the linear regression (LR) model performed best, with an accuracy of 70%. The training was repeated using the group of characteristics corresponding to the 50 characteristics extracted with the graphs. It can be noted that the Naibes Bayes model is the one that behaved best, with an accuracy of only 57%. Additionally, Figure 14 shows the ROC curves for training an ANN using the three different feature groups. The group consisting of only graphs exhibited the lowest accuracy at 52%. In contrast, combining VI data with graphs resulted in the same 72% accuracy after training solely with vegetation indices.
4. Discussion
The classification results obtained using VI correlations confirm the experimental results with apples presented by [15]. They indicate that the total chlorophyll per leaf area remained constant from the beginning until the middle of the crop’s growing cycle, and then, only in those crops that fruited, chlorophyll increased and showed a positive and linear correlation with fruiting. Similarly, [16] demonstrated in their experiments on potato crops that plants which bear fruit have higher rates of respiration and net photosynthesis. They also reiterate that the highest yield in the fruiting process is associated with a high net photosynthetic rate.
Similar to [28], we found a correlation between the estimated data using VIs and the fruit maturity stage. However, for them, the VI that provided the most significant contribution was NDVI, while in our work, this VI did not make significant contributions.
Although we have variables with low or negative correlation, we do not discard them. This is because these variables can provide complementary information or capture nonlinear relationships with the temporary variable. Additionally, in some cases, including variables with low correlation can be useful to avoid multicollinearity issues in the model.
According to [13], ethylene affects leaf development by controlling leaf expansion. The study also suggests that plants modify the positions of their leaves in relation to their neighbors both horizontally and vertically within the plant canopy as a way to avoid a reduction in light incidence, especially in the red/far-red ratio. These movements could be detected using graph-based features or CNNs, but only if there are significant changes throughout the phenological cycle. However, based on the classification results using correlations, these changes occur over very short periods and at insufficient time scales to be detected. Our results from training a CNN with the images of the RoI from each canopy throughout the entire phenological cycle were not sufficient to detect changes that correlated with fruit maturity.
These results open up opportunities and avenues for further research to determine plant states through correlations with reflectance and other characteristics. Exploring other VI and feature extraction techniques for the RoI is also necessary. Additionally, collaborative and interdisciplinary work with experts in plant physiology could significantly contribute to identifying the physicochemical variables of plants and further deepen the correlations. Significant progress has been made in identifying fruit maturity through correlations, but for industrial applications, the classification accuracy must be improved. In this study, only five spectral channels were used and, undoubtedly, experimenting with more channels could substantially improve the results. The research conducted by [28] demonstrated the use of a hyperspectral camera for estimating leaf area. This highlights the application of advanced imaging technology in accurately assessing vegetation parameters. In another study, [30] combined data from cameras operating in the visible, near-infrared, and thermal ranges to estimate chlorophyll concentration. This innovative approach shows the potential of integrating multiple spectral bands to enhance the accuracy of chlorophyll estimation.
5. Conclusions
We found a significant correlation between canopy reflectance and fruit maturity stage. Out of the 25 VI, NRBDI and RBGVI showed a moderate correlation with the temporal variable. These indices used a combination of bands in the visible spectrum, specifically red and blue bands for NRBDI, and red, blue, and green bands for RBGVI. However, several indices utilizing the near infrared band demonstrated low correlations, which is important for classification processes. In the same group with low correlation, however, we found that in the extracted features through graphs, VIs contributed the most as features. The performance of the network with these features was approximately 50%. The best performing classifiers were artificial neural networks and logistic regression. The results of classification using convolutional neural networks were not accurate, achieving only 52% precision on average, over the three datasets. This result supports two possible theories: either CNNs perform best in object identification processes, or we did not obtain images of sufficient changes in the canopy at the morphological level, which corresponded to the fruit’s maturity stage. Overall, the ANN models obtained an accuracy of 72%.
Author Contributions
Conceptualization, W.M., J.D.C. and I.F.M.; methodology, W.M., J.D.C. and I.F.M.; software, W.M.; validation, W.M.; formal analysis, W.M., J.D.C. and I.F.M.; investigation, W.M.; resources, W.M.; data curation, W.M., J.D.C. and I.F.M.; writing—original draft preparation, W.M.; writing—review and editing, J.D.C. and I.F.M.; visualization, W.M., J.D.C. and I.F.M.; supervision, J.D.C.; project administration, W.M.; funding acquisition, W.M. All authors have read and agreed to the published version of the manuscript.
Funding
This study is funded by the Department of Guaviare and the Ministry of Science, Technology and Innovation (MinCiencias) of Colombia (Funding call #752 (2016): High-level human capital training for the Department of Guaviare, 2016, Cohort II, to finance doctoral studies). It is also funded by the OMICAS program (Optimización Multiescala In-silico de Cultivos Agrícolas Sostenibles, Infraestructura y validación en Arroz y Caña de Azúcar), based at the Pontificia Universidad Javeriana in Cali and funded within the Colombian Scientific Ecosystem by The World Bank, the Colombian Ministry of Science, Technology and Innovation, the Colombian Ministry of Education, the Colombian Ministry of Industry and Tourism, and ICETEX, under grant ID: FP44842-217-2018 and OMICAS Award ID: 792-61187.
Data Availability Statement
The data presented in this study are available on request from the corresponding author. The data are not publicly available due to patenting restrictions.
Acknowledgments
The authors would like to thank the SINCHI Amazon Institute for its support in the research stages, and Smart Life Technology SAS for the UAV equipment used for image capture. Also, to Pontificia Universidad Javeriana for supporting part of the research infrastructure and publication costs.
Conflicts of Interest
The authors declare no conflict of interest.
References
- Maciel, E.A.; Martins, F.R. Rarity patterns and the conservation status of tree species in South American savannas. Flora Morphol. Distrib. Funct. Ecol. Plants 2021, 285, 151942. [Google Scholar] [CrossRef]
- Navarro-Cruz, A.R.; Lazcano-Hernández, M.; Vera-López, O.; Kammar-García, A.; Segura-Badilla, O.; Aguilar-Alonso, P.; Pérez-Fernández, M.S. Mauritia flexuosa L. f. In Fruits of the Brazilian Cerrado; Springer: Cham, Switzerland, 2021; pp. 79–98. [Google Scholar] [CrossRef]
- Velarde V., M.J.; Moraes R., M. Densidad de individuos adultos y producci ón de frutos del asaí (Euterpe precatoria, Arecaceae) en Riberalta, Bolivia. Ecol. Boliv. 2008, 43, 99–110. [Google Scholar]
- Quintero-Angel, M.; Martínez-Girón, J.; Orjuela-Salazar, S. Agroindustrial valorization of the pulp and peel, seed, flour, and oil of moriche (Mauritia flexuosa) from the Bita River, Colombia: A potential source of essential fatty acids. Biomass Convers. Biorefinery 2022, 1, 1–9. [Google Scholar] [CrossRef] [PubMed]
- SINCHI. Fichas Palmas Amazónicas con Potencial Seje, Moriche y Asaí; SINCHI: Bogota, Colombia, 2018; ISBN 978-958-5427-05-1. Available online: https://www.sinchi.org.co/seje-moriche-y-asai-palmas-amazonicas-con-potencial (accessed on 6 June 2023).
- Ponce, M.E. Patrones de caída de frutos en Mauritia Flexuosa L.F. y fauna involucrada en los procesos de remoción de semillas. Acta Botán. Venez. 2002, 25, 119–142. [Google Scholar]
- van der Hoek, Y.; Solas, S.Á.; Peñuela, M.C. The palm Mauritia flexuosa, a keystone plant resource on multiple fronts. Biodivers. Conserv. 2019, 28, 539–551. [Google Scholar] [CrossRef]
- Hernández, M.S.; Castro, S.Y.; Giraldo, B.; Barrera, J. Seje, Moriche, Asaí: Palmas Amazónicas con Potencial, 1st ed.; Diana Patricia Mora Rodríguez: Bogotá, Colombia, 2018; p. 123. [Google Scholar]
- Cárdenas López, D.; Arias, G.J.C. Manual de Identificación, Selección y Evaluación de Oferta de Productos Forestales no Maderables; SINCHI: Bogota, Colombia, 2007; p. 32. ISBN 978-958-8317-22-9. Available online: https://sinchi.org.co/manual-de-identificacion-seleccion-y-evaluacion-de-oferta-de-productos-forestales-no-maderables (accessed on 6 June 2023).
- Ponce-Corona, E.; Guadalupe Sánchez, M.; Fajardo-Delgado, D.; Acevedo-Juárez, B.; De-La-Torre, M.; Avila-George, H.; Castro, W. A systematic review of the literature focused on the use of unmanned aerial vehicles during the vegetation detection process. RISTI-Rev. Iber. Sist. Tecnol. Inf. 2020, 2020, 82–101. [Google Scholar] [CrossRef]
- Coelho Eugenio, F.; Badin, T.L.; Fernandes, P.; Mallmann, C.L.; Schons, C.; Schuh, M.S.; Soares Pereira, R.; Fantinel, R.A.; Pereira da Silva, S.D. Remotely Piloted Aircraft Systems (RPAS) and machine learning: A review in the context of forest science. Int. J. Remote Sens. 2021, 42, 8207–8235. [Google Scholar] [CrossRef]
- Tian, H.; Wang, T.; Liu, Y.; Qiao, X.; Li, Y. Computer vision technology in agricultural automation—A review. Inf. Process. Agric. 2020, 7, 1–19. [Google Scholar] [CrossRef]
- Azcón-Bieto, J.; Talón, M. Fundamentos de fisiología vegetal. arXiv 2003, arXiv:1011.1669v3. [Google Scholar]
- Montero, I.M.; Barrera, J.A.; Giraldo, B.; Lucena, A. Fichas Tecnicas de Especies de uso Forestal y Agroforestal de la Amazonia Colombiana; Instituto Amazónico de Investigaciones Científicas SINCHI: Bogotá, Colombia, 2016; Available online: https://sinchi.org.co/index.php/fichas-tecnicas-de-especies-de-uso-forestal-y-agroforestal-de-la-amazonia-colombiana1 (accessed on 6 June 2023).
- Wünsche, J.N.; Greer, D.H.; Laing, W.A.; Palmer, J.W. Physiological and biochemical leaf and tree responses to crop load in apple. Tree Physiol. 2005, 25, 1253–1263. [Google Scholar] [CrossRef]
- Tekalign, T.; Hammes, P.S. Growth and productivity of potato as influenced by cultivar and reproductive growth: I. Stomatal conductance, rate of transpiration, net photosynthesis, and dry matter production and allocation. Sci. Hortic. 2005, 105, 13–27. [Google Scholar] [CrossRef]
- dos Santos, M.R.; Martinez, M.A.; Donato, S.L.; Coelho, E.F. ‘Tommy Atkins’ mango yield and photosynthesis under water deficit in semiarid region of Bahia. Rev. Bras. Eng. Agric. Ambient. 2014, 18, 899–907. [Google Scholar] [CrossRef] [Green Version]
- Larramendi, L.A.R.; Hernández, F.G.; Castro, H.G.; Flores, M.F.; Castañeda, J.C.G.; Ruiz, R.P. Anatomía foliar relacionada con la ruta fotosintética en árboles de café (Coffea arabica L., var. Caturra Rojo) expuestos a diferentes niveles de radiación solar en la Sierra Maestra, Granma, Cuba. Acta Agron. 2016, 65, 248. [Google Scholar] [CrossRef]
- González-Pérez, J.S.; Becerril-Román, A.; Quevedo-Nolasco, A.; Velasco-Cruz, C.; Jaén-Contreras, J. Área Foliar y Eficiencia en el uso de la Radiación del Ciruelo Japonés. Agro Product. 2018, 11, 19–26. [Google Scholar] [CrossRef]
- Alcantara Cortes, J.S.; Acero Godoy, J.; Alcántara Cortés, J.D.; Sánchez Mora, R.M. Universidad Francisco de Paula Santander. Av Gran Colombia # 12 E – 96 Barrio Colsag. Cúcuta, Colombia. Enfermera. Magister en Enfermería. Nova 2019, 17, 109–129. [Google Scholar] [CrossRef] [Green Version]
- Barrera, J.; Carrillo, M.; Pena, L.; Cardona, J.; Orjuela, N.; Garcia, L.; Castro, S.; Hernandez, M.S.; Martinez, O.; Giraldo, B. Growth and development of moriche fruits (Mauritia flexuosa) in Guaviare, Colombia. In Proceedings of the XXX International Horticultural Congress IHC2018: VII International Symposium on Tropical and Subtropical Fruits, Avocado, II International Symposium on Jackfruit and Other Moraceae and II International Symposium on Date Palm, Istanbul, Turkey, 12–16 August 2018; International Society for Horticultural Science: Leuven, Belgium, 2020; Volume 1299, pp. 141–146. [Google Scholar] [CrossRef]
- Liu, R.; Shang, R.; Liu, Y.; Lu, X. Global evaluation of gap-filling approaches for seasonal NDVI with considering vegetation growth trajectory, protection of key point, noise resistance and curve stability. Remote Sens. Environ. 2017, 189, 164–179. [Google Scholar] [CrossRef] [Green Version]
- Cen, H.; Wan, L.; Zhu, J.; Li, Y.; Li, X.; Zhu, Y.; Weng, H.; Wu, W.; Yin, W.; Xu, C.; et al. Dynamic monitoring of biomass of rice under different nitrogen treatments using a lightweight UAV with dual image-frame snapshot cameras. Plant Methods 2019, 15, 32. [Google Scholar] [CrossRef] [PubMed]
- Zhang, X.; Zhang, F.; Qi, Y.; Deng, L.; Wang, X.; Yang, S. New research methods for vegetation information extraction based on visible light remote sensing images from an unmanned aerial vehicle (UAV). Int. J. Appl. Earth Obs. Geoinf. 2019, 78, 215–226. [Google Scholar] [CrossRef]
- Ma, X.; Feng, J.; Guan, H.; Liu, G. Prediction of chlorophyll content in different light areas of apple tree canopies based on the color characteristics of 3d reconstruction. Remote Sens. 2018, 10, 429. [Google Scholar] [CrossRef] [Green Version]
- Wan, L.; Li, Y.; Cen, H.; Zhu, J.; Yin, W.; Wu, W.; Zhu, H.; Sun, D.; Zhou, W.; He, Y. Combining UAV-based vegetation indices and image classification to estimate flower number in oilseed rape. Remote Sens. 2018, 10, 1484. [Google Scholar] [CrossRef] [Green Version]
- Rouse, J.W.; Riter, S. Erts experiments compiled. IEEE Trans. Geosci. Electron. 1973, 11, 3–76. [Google Scholar] [CrossRef]
- Smith, A.M.; Bourgeois, G.; Teillet, P.M.; Freemantle, J.; Nadeau, C. A comparison of NDVI and MTVI2 for estimating LAI using CHRIS imagery: A case study in wheat. Can. J. Remote Sens. 2008, 34, 539–548. [Google Scholar] [CrossRef]
- Jimenez-Sierra, D.A.; Benítez-Restrepo, H.D.; Vargas-Cardona, H.D.; Chanussot, J. Graph-based data fusion applied to: Change detection and biomass estimation in rice crops. Remote Sens. 2020, 12, 2683. [Google Scholar] [CrossRef]
- Elarab, M.; Ticlavilca, A.M.; Torres-Rua, A.F.; Maslova, I.; McKee, M. Estimating chlorophyll with thermal and broadband multispectral high resolution imagery from an unmanned aerial system using relevance vector machines for precision agriculture. Int. J. Appl. Earth Obs. Geoinf. 2015, 43, 32–42. [Google Scholar] [CrossRef] [Green Version]
- Gitelson, A.A.; Viña, A.; Ciganda, V.; Rundquist, D.C.; Arkebauer, T.J. Remote estimation of canopy chlorophyll content in crops. Geophys. Res. Lett. 2005, 32, L08403. [Google Scholar] [CrossRef] [Green Version]
- Qu, Y.; Clausen, A.; Jørgensen, B.N. Application of Deep Neural Network on Net Photosynthesis Modeling. In Proceedings of the IEEE International Conference on Industrial Informatics (INDIN), Palma de Mallorca, Spain, 21–23 July 2021; Institute of Electrical and Electronics Engineers Inc.: Piscataway, NJ, USA, 2021; Volume 2021. [Google Scholar] [CrossRef]
- Barbedo, J.G.; Tibola, C.S.; Fernandes, J.M. Detecting Fusarium head blight in wheat kernels using hyperspectral imaging. Biosyst. Eng. 2015, 131, 65–76. [Google Scholar] [CrossRef]
- Vélez, S.; Ariza-Sentìs, M.; Velente, J. Mapping the spatial variability of botrytis bunch rot risk in vineyards using UAV multispectral imagery. Eur. J. Agron. 2020, 142, 126691. [Google Scholar] [CrossRef]
- Páscoa, R.N.; Lopo, M.; Teixeira dos Santos, C.A.; Graça, A.R.; Lopes, J.A. Exploratory study on vineyards soil mapping by visible/near-infrared spectroscopy of grapevine leaves. Comput. Electron. Agric. 2016, 127, 15–25. [Google Scholar] [CrossRef]
- Marin, W.; Mondragon, I.F.; Colorado, J.D. Aerial Identification of Amazonian Palms in High-Density Forest Using Deep Learning. Forests 2022, 13, 655. [Google Scholar] [CrossRef]
- Devia, C.A.; Rojas, J.P.; Petro, E.; Martinez, C.; Mondragon, I.F.; Patino, D.; Rebolledo, M.C.; Colorado, J. High-Throughput Biomass Estimation in Rice Crops Using UAV Multispectral Imagery. J. Intell. Robot. Syst. Theory Appl. 2019, 96, 573–589. [Google Scholar] [CrossRef]
- Xu, W.; Lan, Y.; Li, Y.; Luo, Y.; He, Z. Classification method of cultivated land based on uav visible light remote sensing. Int. J. Agric. Biol. Eng. 2019, 12, 103–109. [Google Scholar] [CrossRef] [Green Version]
- García-cervigón, D.; José, J. Estudio de Índices de Vegetación a Partir de Imágenes Aéreas Tomadas Desde UAS/RPAS y Aplicaciones de estos a la Agricultura de Precisión. Master’s Thesis, Technical University of Madrid, Madrid, Spain, 2015; p. 78. [Google Scholar]
- Du, M.; Noguchi, N. Monitoring of wheat growth status and mapping of wheat yield’s within-field spatial variations using color images acquired from UAV-camera System. Remote Sens. 2017, 9, 289. [Google Scholar] [CrossRef] [Green Version]
- Kanke, Y.; Tubaña, B.; Dalen, M.; Harrell, D. Evaluation of red and red-edge reflectance-based vegetation indices for rice biomass and grain yield prediction models in paddy fields. Precis. Agric. 2016, 17, 507–530. [Google Scholar] [CrossRef]
- Naito, H.; Ogawa, S.; Valencia, M.O.; Mohri, H.; Urano, Y.; Hosoi, F.; Shimizu, Y.; Chavez, A.L.; Ishitani, M.; Selvaraj, M.G.; et al. Estimating rice yield related traits and quantitative trait loci analysis under different nitrogen treatments using a simple tower-based field phenotyping system with modified single-lens reflex cameras. ISPRS J. Photogramm. Remote Sens. 2017, 125, 50–62. [Google Scholar] [CrossRef]
- Prabhakara, K.; Dean Hively, W.; McCarty, G.W. Evaluating the relationship between biomass, percent groundcover and remote sensing indices across six winter cover crop fields in Maryland, United States. Int. J. Appl. Earth Obs. Geoinf. 2015, 39, 88–102. [Google Scholar] [CrossRef] [Green Version]
- Gnyp, M.L.; Miao, Y.; Yuan, F.; Ustin, S.L.; Yu, K.; Yao, Y.; Huang, S.; Bareth, G. Hyperspectral canopy sensing of paddy rice aboveground biomass at different growth stages. Field Crops Res. 2014, 155, 42–55. [Google Scholar] [CrossRef]
- Morris, O.J.; Constantinides, A.G. Graph theory for image analysis: An approach based on the shortest spanning tree. IEE Proc. F Commun. Radar Signal Process. 1986, 133, 146–152. [Google Scholar] [CrossRef]
- Cousty, J.; Najman, L.; Dias, F.; Serra, J. Morphological filtering on graphs. Comput. Vis. Image Underst. 2013, 117, 370–385. [Google Scholar] [CrossRef] [Green Version]
- Farkas, I.J.; Derényi, I.; Barabási, A.L.; Vicsek, T. Spectra of “real-world” graphs: Beyond the semicircle law. Phys. Rev. E-Stat. Phys. Plasmas Fluids Relat. Interdiscip. Top. 2001, 64, 12. [Google Scholar] [CrossRef] [Green Version]
- Fowlkes, C.; Belongie, S.; Chung, F.; Malik, J. Spectral Grouping Using the Nyström Method. IEEE Trans. Pattern Anal. Mach. Intell. 2004, 26, 214–225. [Google Scholar] [CrossRef] [PubMed] [Green Version]
- Naranjo-Torres, J.; Mora, M.; Hernández-García, R.; Barrientos, R.J.; Fredes, C.; Valenzuela, A. A review of convolutional neural network applied to fruit image processing. Appl. Sci. 2020, 10, 3443. [Google Scholar] [CrossRef]
Figure 1.
Moriche palms: In these dense forests of the Amazonian region, local communities access these unstructured crops climbing individual palms to both assess maturity and harvest the palm fruits manually.
Figure 1.
Moriche palms: In these dense forests of the Amazonian region, local communities access these unstructured crops climbing individual palms to both assess maturity and harvest the palm fruits manually.

Figure 2.
Moriche fruit maturity typology.

Figure 4.
Geolocation of dense forest crops in the Colombian Amazon. Waypoints detail the UAV trajectory.
Figure 4.
Geolocation of dense forest crops in the Colombian Amazon. Waypoints detail the UAV trajectory.

Figure 5.
Convolutional neural network.

Figure 6.
The phenological cycle of the Moriche palm. Insets (a1–d1) represent the months of October, January, April, and July, respectively. Insets (a2–d2) provide detailed views of the inflorescence and the maturity stages of the palm fruits.
Figure 6.
The phenological cycle of the Moriche palm. Insets (a1–d1) represent the months of October, January, April, and July, respectively. Insets (a2–d2) provide detailed views of the inflorescence and the maturity stages of the palm fruits.

Figure 7.
The extraction of the RoI from each spectral layer. The RoI in RGB is displayed on the left, followed by the R, G, B, ER, and NIR bands individually from left to right.
Figure 7.
The extraction of the RoI from each spectral layer. The RoI in RGB is displayed on the left, followed by the R, G, B, ER, and NIR bands individually from left to right.

Figure 8.
The Pearson correlation map displays the relationships between the 25 VIs, graph characteristics (average vector), and the time variable. The strength of the correlations is indicated by the color bar on the right side of the map.
Figure 8.
The Pearson correlation map displays the relationships between the 25 VIs, graph characteristics (average vector), and the time variable. The strength of the correlations is indicated by the color bar on the right side of the map.

Figure 9.
Linear correlation of NRBDI, RBGVI characteristics with moderate correlation.

Figure 10.
Linear correlation of features GNDVI, RGVI, MGRVI, RG, RVI, NIRG, NB, RGBVI, NGRVI, and GRAPH with low correlation.
Figure 10.
Linear correlation of features GNDVI, RGVI, MGRVI, RG, RVI, NIRG, NB, RGBVI, NGRVI, and GRAPH with low correlation.

Figure 11.
Linear correlation of GRVI and VARI features with low negative correlation.

Figure 12.
The loss and accuracy curves for the training and validation of the CNN model. The left plot represents the loss curve, which depicts a trend of decreasing loss in both the training and validation data as the number of epochs increases. The right plot corresponds to the accuracy curve.
Figure 12.
The loss and accuracy curves for the training and validation of the CNN model. The left plot represents the loss curve, which depicts a trend of decreasing loss in both the training and validation data as the number of epochs increases. The right plot corresponds to the accuracy curve.

Figure 13.
ROC curve for seven ML models trained with 25 VIs.

Figure 14.
ROC curve obtainedwith the ANN model: (left) graph-based features, (middle) VIs features, (right) VI and graph-based features combined.
Figure 14.
ROC curve obtainedwith the ANN model: (left) graph-based features, (middle) VIs features, (right) VI and graph-based features combined.


Table 1.
VIS-NIR vegetation indices listed.
| VI | Description | Mathematical Expression |
|---|---|---|
| GRVI | Red Vegetation Index [37] | |
| RGVI | Green Vegetation Index [25] | |
| MGRVI | Modified Red Vegetation Index [37] | |
| NGRVI | Reciprocal transformation based on MGRVI normalization [24] | |
| GRBVI | Normalized Green-Red Difference Index [38] | |
| VARI | Visible Atmospherically Resistant Index [37] | |
| RG | Red Green Ratio [39] | |
| GR | Red Green Ratio Index [23] | |
| VDVI | Visible-Band Difference Vegetation Index [38] | |
| EXG | Excess green [38] | |
| CIVE | Color Index of Vegetation [26] | |
| NGBDI | Normalized Green-Blue Difference Index [40] | |
| NRBDI | Normalized Red-Blue Difference Index [25] | |
| RGBVI | Red, Blue-Green Vegetation Index [25] | |
| RBGVI | Red, Blue-Green Vegetation Index [25] | |
| NIRG | Green model [31] | |
| NIRRE | Red border model [31] | |
| NDVI | Normalized Difference Vegetation Index [27] | |
| RVI | Ratio Vegetation Index [41] | |
| DVI | Difference Vegetation Index [42] | |
| GNDVI | Green NDVI [43] | |
| CTVI | Corrected Transformed Vegetation Index [42] | |
| SAVI | Soil-Adjusted Vegetation Index [43] | |
| MSAVI | Modified SAVI [44] | |
| NBVI | Green NDVI |
Table 2.
Moriche palm datasets. Two crop plots were evaluated to ensure the proper spatial repetition.
Table 2.
Moriche palm datasets. Two crop plots were evaluated to ensure the proper spatial repetition.
| Plot | Flights | UAV Waypoints | Images |
|---|---|---|---|
| Plot 1 | 30 | 18 | 540 |
| Plot 2 | 30 | 51 | 1530 |
Table 3.
Ratio of the correlation coefficients of the characteristics with moderate, low and low negative correlation.
Table 3.
Ratio of the correlation coefficients of the characteristics with moderate, low and low negative correlation.
| Characteristic | Coefficient | Ratio |
|---|---|---|
| NRBDI | 0.482360 | Moderate |
| RBGVI | 0.465781 | Moderate |
| RG | 0.284647 | Low |
| NIRG | 0.268070 | Low |
| GNDVI | 0.248591 | Low |
| NB | 0.224336 | Low |
| RGVI | 0.178566 | Low |
| Grafo | 0.170969 | Low |
| RGBVI | 0.155478 | Low |
| RVI | 0.117775 | Low |
| MGRVI | 0.110696 | Low |
| NGRVI | 0.110696 | Low |
| GRVI | −0.178566 | Low negative |
| VARI | −0.274951 | Low negative |
Table 4.
Confusion matrix numerical results.
| Dataset 1 | Dataset 2 | Dataset 3 | |||||||||
|---|---|---|---|---|---|---|---|---|---|---|---|
| Class | FP | TP | Total | Class | FP | TP | Total | Class | FP | TP | Total |
| VC | 26 | 24 | 50 | VC | 34 | 16 | 50 | VC | 31 | 19 | 50 |
| MC | 21 | 29 | 50 | MC | 12 | 38 | 50 | MC | 21 | 29 | 50 |
| Total | 47 | 53 | 100 | Total | 46 | 54 | 100 | Total | 52 | 48 | 100 |
| Accuracy | 47% | 53% | 100% | Accuracy | 46% | 54% | 100% | Accuracy | 52% | 48% | 100% |
Table 5.
Ranked results of ML models integrated in the Lazy Predict tool. The ML models are each listed with their corresponding accuracy and F1 scores, and training and validation times.
Table 5.
Ranked results of ML models integrated in the Lazy Predict tool. The ML models are each listed with their corresponding accuracy and F1 scores, and training and validation times.
| Model | Accuracy | F1 Score | Time |
|---|---|---|---|
| RidgeClassifier | 0.7 | 0.7 | 0.02 |
| LinearSVC | 0.7 | 0.7 | 0.09 |
| CalibratedClassifierCV | 0.7 | 0.7 | 0.33 |
| LogisticRegression | 0.7 | 0.7 | 0.04 |
| RidgeClassifierCV | 0.69 | 0.69 | 0.02 |
| LinearDiscriminantAnalysis | 0.68 | 0.68 | 0.02 |
| NuSVC | 0.66 | 0.66 | 0.12 |
| Perceptron | 0.66 | 0.66 | 0.02 |
| QuadraticDiscriminantAnalysis | 0.66 | 0.66 | 0.02 |
| SVC | 0.66 | 0.66 | 0.07 |
| AdaBoostClassifier | 0.64 | 0.64 | 0.19 |
| ExtraTreesClassifier | 0.64 | 0.64 | 0.21 |
| LGBMClassifier | 0.64 | 0.64 | 0.11 |
| RandomForestClassifier | 0.64 | 0.64 | 0.34 |
| XGBClassifier | 0.63 | 0.63 | 0.11 |
| SGDClassifier | 0.63 | 0.63 | 0.02 |
| PassiveAggressiveClassifier | 0.61 | 0.58 | 0.01 |
| KNeighborsClassifier | 0.62 | 0.62 | 0.04 |
| BaggingClassifier | 0.61 | 0.61 | 0.12 |
| LabelSpreading | 0.60 | 0.60 | 0.10 |
| LabelPropagation | 0.60 | 0.60 | 0.08 |
| ExtraTreeClassifier | 0.54 | 0.54 | 0.01 |
| DecisionTreeClassifier | 0.54 | 0.54 | 0.03 |
| GaussianNB | 0.55 | 0.52 | 0.01 |
| NearestCentroid | 0.54 | 0.54 | 0.01 |
| BernoulliNB | 0.54 | 0.53 | 0.01 |
| DummyClassifier | 0.46 | 0.46 | 0.01 |
Disclaimer/Publisher’s Note: The statements, opinions and data contained in all publications are solely those of the individual author(s) and contributor(s) and not of MDPI and/or the editor(s). MDPI and/or the editor(s) disclaim responsibility for any injury to people or property resulting from any ideas, methods, instructions or products referred to in the content. |
© 2023 by the authors. Licensee MDPI, Basel, Switzerland. This article is an open access article distributed under the terms and conditions of the Creative Commons Attribution (CC BY) license (https://creativecommons.org/licenses/by/4.0/).
Share and Cite
MDPI and ACS Style
Marin, W.; Mondragon, I.F.; Colorado, J.D. Aerial Identification of Fruit Maturity in Amazonian Palms via Plant-Canopy Modeling. Remote Sens. 2023, 15, 3752. https://doi.org/10.3390/rs15153752
AMA Style
Marin W, Mondragon IF, Colorado JD. Aerial Identification of Fruit Maturity in Amazonian Palms via Plant-Canopy Modeling. Remote Sensing. 2023; 15(15):3752. https://doi.org/10.3390/rs15153752
Chicago/Turabian StyleMarin, Willintong, Ivan F. Mondragon, and Julian D. Colorado. 2023. "Aerial Identification of Fruit Maturity in Amazonian Palms via Plant-Canopy Modeling" Remote Sensing 15, no. 15: 3752. https://doi.org/10.3390/rs15153752
Note that from the first issue of 2016, this journal uses article numbers instead of page numbers. See further details here.