2019 House of Councillors Election Osaka Prefecture — part 1/2
This post is the second entry of the continuous series of reports or articles I am publishing to analyze the election results to the House of Councillors of July of 2019. You can access here the first post about the results in Saitama Prefecture.
This one about Osaka has been a special one. The short time I lived between 2018 and 2019 in Japan was in Osaka, specifically in the city of Osaka. It became a home for me in Japan, a special place, and I hope you all will like this post too.
First of all, I am going to introduce the Prefecture of Osaka. Technically Osaka is not a prefecture「県-Ken」but an administrative division called a fu 「府」. However, for the sake of clarity, I will use them indistinctly.
Osaka-fu finds itself at the heart of the Japanese region of Kansai (関西地方) also known as Kinki (近畿地方) which forms the Japanese counterpart to Kanto Region and Tokyo, the heart of Japanese politics since the Meiji restoration and before (Edo, or Tokyo, became in 1868 the place of residence for the Emperor henceforth; before it had already been the seat of the Tokugawa Shogunate but the Emperor remained in Kyoto).
In the Kansai Region, we find iconic cities of Japan: Osaka, Kobe, and also Kyoto and Nara, historical cities and ancient capitals of Japan.

Osaka itself has borders with several of these prefectures. We find Wakayama Prefecture to the South (和歌山県), Nara Prefecture to the East (奈良県), Kyoto-fu to the North (京都府) and Hyogo to the West (兵庫県). Osaka Bay completes the map of the prefecture.

Geographically, Osaka is a very interesting prefecture. On one side, to the west, you find Osaka bay, what has made throughout generations of Osaka and Sakai (a city to the south) cities very much related to the Sea and trade. On every other side, Osaka is surrounded by mountains, to Wakayama, Nara, Kyoto, and Hyogo as you can check in the next map.

This surrounding is only broken by the Yodogawa river (淀川) that flows from the northeast, from Kyoto and Lake Biwa in Shiga Prefecture towards Osaka.
In the last decade, politics in Osaka Prefecture have become especially interesting because of the appearance of a third political force that quickly became the majoritarian in Osaka and a strong force in neighboring places like Hyogo Prefecture. Besides the LDP and Komeito on one hand, and the new Opposition parties in the other (CDP, DPFP, JCP & SDP), a decade ago appeared in the scene a regionalist party that has become the governing party in Osaka: 維新の会 — Ishin no Kai, the Osaka Restoration Party, known before as the Osaka Restoration Association (I will not get here into many details about the complex history of the party and its jump to national politics). ****
For the time being, we should keep in mind that Ishin no Kai, as it is currently known, is an established party in Japan with a large presence in Kansai and, recently, it is trying to make inroads in the Kanto region (in Tokyo, Kanagawa, and Saitama). Ishin no Kai is understood to be a right-wing party, neoliberal in its economic policy and certainly a willing partner to reform the Japanese Constitution, what makes it a possible ally of current Prime Minister Shinzo Abe in the Diet (it is, though, the enemy of the LDP in Osaka and Hyogo).
The presence of these three-block forces makes of Osaka a fascinating place for politics.
Going back to the Election last July for the House of Councillors we have tot tackle first the turnout.
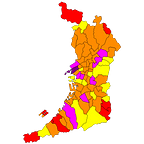
Turnout in Osaka was 48.63%
Taking a look at the map, there are hints of a division between the north and the south of Osaka. We can find the highest turnout in the North of the prefecture, next to the mountains that border Kyoto (places that, also, I should point, have a higher income). Meanwhile, the South has a lower turnout; the same maroonish color of the map can be found in the eastern suburbs of Osaka (in big cities like Yao and East Osaka) and in the downtown wards of Osaka city itself.

With that in mind, let’s jump straight into the election results.
ELECTION RESULTS
In Osaka Prefecture 4 SEATS were up, and the four incumbent candidates run for reelection. Just three of them were successful.

Accumulating around 40% of the vote, two candidates from Ishin took the first and second place. Behind, the Komeito and LDP incumbents. The candidate of the Japanese Communist Party, who was an incumbent, because of the presence of other strong candidates from the Opposition camp, was unable to be reelected in a major defeat for them.
Umemura Mizuho/梅村みずほ 「Ishin/維新」: First place/1位 20.9%
Umemura Mizuho, born in Nagoya in Aichi Prefecture, was a former TV personality, reporter and talent. In July of 2019 she run for office for the first time as an Ishin and, in what was not an easy feat, she won and was able to take the first place ahead of her party colleague Azuma Tooru who finished second.
Azuma Tooru/東徹「Ishin/維新」: Second place/2位 18.9%
Azuma Tooru, born in Osaka, is a more experienced politician compared to Umemura Mizuho. Azuma, first, was part of the Prefectural Assembly of Osaka from 2003 to 2013 in the district of Suminoe (Osaka City) 「大阪市住之江区」。In 2013 he was first elected to the House of Councilors.

In 2013 Azuma Tooru racked up more than a million votes and 28.8% of the vote to take the first place. This year, though, he lost 10 points and around 700k votes to place second behind the Umemura Mizuho. We can understand this big change because of this year Ishin, confident enough of its chances, presented two different candidates (both were successful but the vote totals were divided between the two).
2019 Ishin Umemura Mizuho 20.9% (729k) + Azuma Tooru 18.9% (660k) =1.389.946 total votes (39.8%)
2013 Ishin — Azuma Tooru 28.83% (1,056,815)
After 2016, 2019 was only the second time that Ishin has been able to place two candidates (out of four) in an HoC election in Osaka, a featuring that clearly shows the (staying and growing) power of Ishin no Kai in the prefecture, its power-base.
Sugi Hisatake/杉久武「Komeito/公明党」: Third place/3位 16.9%
Sugi Hisatake, born in Osaka, is currently a one-term incumbent who in 2019 was re-elected for the second time to the House of Councilors. From 2016 to 2017 he was also part of Shizo Abe Third Cabinet where he worked in the Ministry of Finance as a parliamentary official/Vice-Minister 「財務大臣政務官」.

From 2013 to 2019 Sugi Hisatake lost almost 100k votes. In 2019 he received close 17% of the vote, becoming the third candidate elected behind the Ishin representatives (and ahead fo the LDP candidate!).
2019 Komeito—Sugi Hisatake 16.93% (591k) = -100k
2013 Komeito — Sugi Hisatake 19.02% (697k)
The vote for him was mainly centered around two areas of the prefecture:
The first contains the lower wards of the city of Osaka, those closer to the port that have a lower average income. His second stronghold is found to the northeast of Osaka city in the bed-towns of Moriguchi, Daito, Neyagawa and, at its heart, Kadoma, where the headquarters of PANASONIC are located. On the other hand, it is in downtown Osaka (city) where Komeito’s Sugi Hisatake was weakest.
Oota Fusae/太田房江「LDP/自民党」: Fourth place/4位 16%
Behind Sugi Hisatake, the candidate from Komeito, the LDP was able to take the fourth and last seat in Osaka district with Oota Fusae.
Born in Hiroshima Prefecture, Oota Fusae became in 2000 the first woman Governor of Osaka and was reelected in 2004. In both elections, she received wide support not only from the LDP. She won with 45.98% of the vote in 2000, and that grew to 56.18% in 2004.
In 2013 she jumped to the house of Councillors and was elected in the LDP national proportional list 「比例代表」although she was the least voted candidate of his party nationwide.
This year she exchanged the proportional list for the prefecture-wide district election and presented her ultimately successful candidature in Osaka district.

This map is close to a mirror image of the support for Sugi Hisatake. Oota Fusae was weakest in the city of Osaka (wards along Osaka bay) and the eastern suburbs where Komeito is especially strong.

Oota Fusae run ahead of Sugi Hisatake in the northern part of Osaka Prefecture, in downtown Osaka city, and in the southeast at the foot of Kongo Mountain 「金剛山」close to where the borders of Osaka, Nara and Wakayama meet.
(Komeito won 7 seats in district elections around the country and the Komeito candidates were elected ahead of the LDP candidates only in two places: Hyogo and Osaka).
*** These larger trends can be observed in the results of the 2017 House of Representatives election in Osaka. In the national proportional vote, although Osaka was not the place where Komeito obtained its best results (Okinawa and Fukuoka were ahead), Osaka Prefecture was the place where Komeito had a larger -percentage- contribution to the government coalition cumulative results and where the LDP was weaker in comparison, only behind Okinawa: in 2017 in Osaka, Komeito contributed almost 37% of the total proportional vote of both LDP and itself, the highest proportion in the nation (I want to continue exploring the LDP-Komeito dynamics in Osaka)***
Tatsumi Koutarou/辰巳孝太郎「JCP/共産党」: Fifth place/5位 10.9% NOT ELECTED
Born in Osaka, Koutarou was first elected to the House of Councillors in 2013 becoming the first candidate from the Japanese Communist Party to win a seat after Miyamoto Takeshi 「宮本岳志」did it in 1998 (after retiring in 2004 when his term expired, Takeshi was elected from 2009 to 2019 in the proportional block of Kinki Region in the Lower House).
In 2019 Tatsumi Koutarou was the candidate of the Opposition parties that placed first, but it was not enough.

In 2019 Tatsumi Koutarou was the only incumbent in Osaka to lose reelection. The division of the Opposition vote provoked a loss of almost 100k votes that made it impossible to win a seat (despite having two different Ishin candidates in the race, But Ishin is so strong in Osaka it managed to put both candidates in the House of Councillors).
2019 JCP: Tatsumi Koutarou 10.9% (381.854) = -120k
2013 JCP: Tatsumi Koutarou 12.79% (468,904)
Koutarou’s support was scattered around the prefecture, but the map I made shows he was especially strong in the districts of Konohana, Nishi-Yodogawa (his home district) and Taisho, working-class-like wards of the city of Osaka (although I am not sure of the relationship, I think I should point out that we can find a numerous community of Okinawans in Taisho, what perhaps might explain to some degree the strength of the JCP. It needs to be said that Okinawa was the third-best prefecture for the JCP in the 2017 Lower House proportional election block).
In sum, these traditional neighborhoods in Osaka posted some of the best results for the Opposition.
Kameishi Michiko/亀石倫子「CDP/立憲民主党」: Sixth place/6位 10.2% NOT ELECTED
Born in Hokkaido, Kameishi Michiko run for the election as the candidate of the Constitutional Democratic Party of Japan; It was the first time the CDP run a candidate here since it was created. In the end, between Michiko and Koutarou, they divided the (weak) vote of the Opposition in the Prefecture with the disastrous result already known: they got 0 seats out of 4. After 2016, 2019 was the second time in a row that the Opposition parties were shutout of representing Osaka district.

Kameishi Michiko, who run roughly 30k votes behind Tatsumi Koutarou, was stronger in northern Osaka.

I love this map. It shows which Opposition candidate (either CDP’s Kameishi Michik or JCP’s Tatsumi Koutarou) placed first in each subdivision of Osaka Prefecture. It let us know very clearly the (very) different bases of support of each candidate. Kameishi Michiko was stronger in municipalities with a higher income and higher turnout. For example, the affluent cities of Shimamoto, Takatsuki and Toyono while Koutarou’s support was bigger and more evenly distributed around.
Nishanta/にしゃんた「DPFP/国民民主党」: Seventh place/7位 3.7% NOT ELECTED
The DPFP presented an immigrant-born candidate in Osaka. Nishanta, who is currently Japanese but was born in Sri Lanka, in the election he got no traction and barely won 130k votes.
FORCE OF POLITICAL BLOCKS
Besides seeing which candidate won in each municipality and district, I thought it would be very interesting to make some maps showing the political force of each party combining the support of their candidates:
- Ishin candidates — Umemura Mizuho & Azuma Tooru
- 自公「LDP & Komeito」 — Sugi Hisatake & Oota Fusae
- Opposition candidates「JCP, CDP & DPFP」 — Tatsumi Koutarou, Kameishi Michiko & Nishanta
The following maps do NOT show the vote support of each party in the national proportional vote ballot, but the sum of the candidate's share of the votes.
I quick glance at the three maps lets us know the bases of support of each group, which are very different geographically.
ISHIN CANDIDATES

Between Umemura Mizuho and Azuma Tooru, they won 39.8% of the votes. According to the map, their position is especially strong in two places: in the eastern part of the Osaka Plain at the foothills of Ikoma (生駒山) and other mountains that border with Nara, and in downtown Osaka city: The districts of Chuo, Nishi, Kita and Fukushima-Ku are the strongholds of Ishin in the whole prefecture. The fifth strongest ward of Ishin (which is detached from the other four) is Suminoe-Ku, which was represented by Azuma Tooru for 10 years in Osaka Assembly. The map to the left shows which candidate from Ishin placed first in each municipality or district. Azuma Tooru was able to maintain his status as the winner fo the election in the eastern suburbs of Osaka (around East Osaka city) and in the lower wards of Osaka along the bay. It should not be easy to underestimate what Umemura Mizuho accomplished displacing his colleague in such a big way.
自公/JICOU
Below Ishin candidates, the sum of LDP & Komeito candidates reached 33% of the vote, powered by stronger-than-average Komeito in Osaka.

Sugi Hisatake and Oota Fusae were stronger in two places: One is the base of Komeito’s candidate (as shown its own map) towards eastern Osaka.
The second places are southern Osaka along the Bay in its way towards Wakayama and Kansai International airport.
OPPOSITION
The Opposition candidates (JCP, CDP & DPFP) were very weak in 2019. Between them, they did not even reach 25% of the vote and their division made it impossible to win a single seat out to the four that were up for grabs.

The Opposition pulls an over average level of support in Northern Osaka, in some of the higher income municipalities of the Prefecture and where the several campuses of Osaka University are located.
This post was my second one since I started this fascinating journey. I have to admit that writing these articles has become a real learning experience for me; I am learning so much about Japanese Politics while reading, writing, researching, talking and debating on Twitter (@NihonPolitics) with all those that follow me.
I do think that this last article was easier to write than the first one I made about Saitama Prefecture. Probably it is due in part because this was the second one I have made, however, I think but it also had influence that I have lived in Osaka, while I have not lived in Saitama. I tried to put my best efforts into writing some good quality content here, however, mistakes are likely in a learning-process like this one.
Please let me know what you think about this post: mistakes, criticism, feedback of any kind is very much welcome!
If you liked the post, Retweet it, like it, and spread the word!
おおきに~
- *In the coming days, I will update this post with new data I have been working on, specifically some correlations between turnout, candidates, and Income in Osaka Prefecture***
Hello everyone, I hope you all liked the first part of the analysis of the Election in Osaka. Today, I finally have ready some data correlation I have been working on.
When I started working on this, it was disappointing in part. I have not been able to this day to find specific data about the average income in each district of the City of Osaka. Please, if anyone finds it, kindly let me know!
For that reason, I have been forced to include in the analysis the overall income of the whole city of Osaka, which obviously precludes a detailed ward-by-ward analysis (which would have been extremely interesting). A shame.
I will make the conclusion at the end, but I can advance that they fairly correlate with the results I had in Saitama Prefecture.
CORRELATION 1 TURNOUT — CANDIDATE
1* 2* Ishin candidates Umemura Mizuho and Azuma Tooru show very weak (negative) correlations. Insignificant. Both are strong across the board.


3* As it happened in Saitama, the Komeito candidate (in this case Sugi Hisatake) is stronger as turnout decreases through the prefecture. Very clear.

4* On the other hand, LDP’s Oota Fusae has a positive correlation with the turnout, weak though.

Following the pattern we say in Saitama, the Opposition parties do benefit from higher turnout. In big part, it is thanks to CDPJ candidates, in this case, 5* Kameishi Michiko’ whose correlation is the strongest.


The JCP (Tatsumi Kotarou) and DPFP (Nishanta) do not show a correlation.


CORRELATION 2 INCOME — CANDIDATE
Because I was not able to include individualized data of each ward in Osaka city, some of the nuances of the results have been lost. However, it is still interesting because it keeps giving hints about in what places each party (and its candidate is strong(er).
Overall, the correlation is not very significant with Ishin candidates, but the opposite results I got show how different the support base fo Umemura 1*, 2* Mizuho and Azuma Tooru are (take a look to the map 6):

Correlation is positive in the case of Mizuho, while it is negative with Azuma Tooru.

With respect to 3* Sugi Hisatake, the Komeito candidate, with have the same equation we found here in Osaka about turnout and in Saitama in the first entry of this blog. Komeito’s candidate was stronger in areas with lower income. Very sharply.

4* LDP’s Oota Fusae also shows a negative correlation.

Finally, once again, the situation is repeated with the Opposition. It as a very clear correlation: higher turnout, higher levels of support, a correlation on the back of the CDPJ and its candidate 5* Kameishi Michiko:

It is impressive. I am sensing a pattern here.

In the case of 4* Tatsumi Koutarou (JCP), I expected a negative correlation after analyzing the map, but it did not turn out that way (perhaps in Osaka city?).

In General, in the Prefecture of Osaka, there is POSITIVE correlation, albeit a weak one, between TURNOUT AND INCOME.

Finally, I have some interesting data here. I have included in the analysis the progressive grassroots group Reiwa Shinsengumi that although it did not run a candidate in the district it received 3.4% of the vote in the national proportional ballot. I will only post here the most interesting results.
First, the results. Reiwa is eminently an urban phenomenon and on that is stronger in places with higher income (its best districts in Osaka City correlate with Ishin candidates best results: Nishi-Ku, Kita-Ku, Fukushima-Ku, Chuo-Ku, Naniwa-Ku and Tennoji-Ku).

About its correlations, there is a very strong relationship between support for Reiwa (proportional ballot) and Ishin candidates in the district. For example, Reiwa’s two best results were in Osaka city Nishi and Chuo wards, where Ishin candidates had their best and third-best results.

There is a negative correlation with LDP/Komeito support though, especially with the LDP candidate Oota Fusae.

The relationship is positive with CDP and a little less so with the Opposition

It is also positive, strongly, with income, as it happened in Saitama. The result is limited, though, because I could not find detailed data of income in each ward of Osaka. However, I think it gives a fair idea of Reiwa’s base of support: It could be urban and of higher-income (more research must be done).

The correlation I have worked on do not provide definitive answers about which voters vote wich party or candidate; instead, I have tried to provide an overview of some relationship we can find in Japan’s political geography. The correlation and their results should be the starting point and serve for further research in Japanese political science.
I hope you liked this post too. Please spread the word about it! Like it, Retweet it, tell to your friends.
ありがとうございました!