
Abstract
This study is concerned with flood risk that can be assessed by integrating GIS, hydraulic modelling and required field information. A critical point in flood risk assessment is that while flood hazard is the same for a given area in terms of intensity, the risk could be different depending on a set of conditions (flood vulnerability). Clearly, risk is a function of hazard and vulnerability. This study aims to introducing a new approach of assessing flood risk, which successfully addresses this above-mentioned critical issue. The flood risk was assessed from flood hazard and vulnerability indices. Two-dimensional flood flow simulation was performed with Delft3D model to compute floodplain inundation depths for hazard assessment. For the purpose of flood vulnerability assessment, elements at risk and flood damage functions were identified and assessed, respectively. Then, finally flood risk was assessed first by combining replacement values assessed for the elements and then using the depth–damage function. Applying this approach, the study finds that areas with different levels of flood risk do not always increase with the increase in return period of flood. However, inundated areas with different levels of flood depth always increase with the increase in return period of flood. The approach for flood risk assessment adopted in this study successfully addresses the critical point in flood risk study, where flood risk can be varied even after there is no change in flood hazard intensity.
We’re sorry, something doesn't seem to be working properly.
Please try refreshing the page. If that doesn't work, please contact support so we can address the problem.
1 Introduction
This study is concerned with how we can assess flood risk in a given flood prone area. There are many examples of flood studies in different countries. Bangladesh is one of those countries where a significant number of studies have been carried out with flood issue. This research selected Bangladesh for the purpose of assessing flood risk.
Bangladesh is a deltaic country located at the lower part of the basins of the three mighty rivers—the Ganges, the Brahmaputra and the Meghna. This unique geographical setting, surrounded by mountains on three sides, together with extremely flat and low-lying floodplain topography, a low-lying coastline, and an extreme climate variability has rendered the country highly prone to natural hazards such as flood (Chowdhury et al. 1997; Hoque et al. 2011; Islam et al. 2010). About one-fifth to one-third of the country is annually flooded by overflowing rivers during pre-monsoon (April to May) and monsoon (June to September) periods. These floods cause physical damages to agricultural crops, buildings and other infrastructure, social disruptions in vulnerable groups, livelihoods and local institutions, and direct and indirect economic losses (Baky et al. 2012; Bhuiyan and Dutta 2012; Mirza 2011). The flood hazard problem in recent times is getting more and more frequent and acute due to growing population size and human interventions/socio-economic activities in the floodplain at an ever-increasing scale (Bhuiyan and Baky 2014; Paul and Routray 2010).
Flood mitigation approaches in Bangladesh have ranged from structural interventions (embankment, flow regulation structures, etc.) to non-structural approaches (forecasting and warning, flood preparedness before during and after the flood, flood proofing measures, etc.) (Paul and Routray 2010; Rahman and Salehin 2013). The Flood Action Plan (FAP) and French Engineering Consortium (FEC) conducted a feasibility flood control survey and a hydrological study in Bangladesh. They focused on agricultural adjustment processes (Younus 2012) and the impacts of floods when flood adaptation fails at the community level (Younus and Harvey 2014). Structural flood protecting projects even though have short-term positive impacts, the viability of those projects made over the years has often faced criticism because of their adverse hydraulic, environmental and socio-economic impacts (Burrel et al. 2007; Chowdhury et al. 1997; Shaw 2006). Those projects cause economic hardship to the poorer community of the society, which are dependent on many free resources (e.g. fisheries) of river (Chowdhury et al. 1997; Chowdhury 2010) and even on water transport by country boats (Hunting 1992). Furthermore, the benefits of structural flood control projects cannot be reached at all level of society. For example, aquaculture activities are becoming popular particularly in the coastal region of Bangladesh (Sohel and Ullah 2012) as polder-based flood control project is developing in the region. However, it is still unlikely for the marginal population to engage in such aquaculture activities since the activities need sufficient capital to start.
The experiences with structural flood control interventions gave way to new insights, which are a combination of structural and non-structural flood hazard mitigation measures depending on the specific local or regional needs (Van Alphen and Lodder 2006). Very recently, Bangladesh government has focused on both structural and non-structural flood management approaches to reduce vulnerability to flooding in the country (Paul 1995, 1997; Paul and Hossain 2013). Preparation of flood risk maps is the basic requirement before non-structural flood hazard mitigation approaches (Bhuiyan and Baky 2014; Bhuiyan et al. 2014; Demir and Kisi 2016; Giustarini et al. 2015; Hoque et al. 2011; Islam et al. 2010; Islam and Sado 2000). Flood risk mapping facilitates the administrators and planners to identify areas vulnerable to flood hazard and to determine infrastructure at risk and the degree they might be affected, and to map their capacity to respond and recover (Bhuiyan and Baky 2014; Bhuiyan et al. 2014; Hazarika et al. 2018; Sanyal and Lu 2009; Tran et al. 2009; Vojtek and Vojteková 2016). Most importantly, it helps in identifying and prioritizing the mitigation and response efforts and helps to inform emergency responses (Tran et al. 2009).
Despite having mentionable positive options of flood risk map, the study of flood risk mapping is limited. Chowdhury and Karim (1996) studied on risk-based zoning of storm surge prone area of the Ganges tidal plain. Hazard factors were based on simulated spatial distribution of 100-year flood depths, while the vulnerability factors were based on the distribution of population densities. Risk indices were then derived as a product of hazard and vulnerability factors as per Skakun et al. (2014). At that time, the application of hydraulic simulation and or satellite image in preparing flood hazard map was not so prominent. Therefore, the study outputs had question with accuracy. Afterwards, Islam and Sado (2000) used NOAA-AVHRR images with GIS to develop flood hazard maps for Bangladesh. Tingsanchali and Karim (2005) studied flood hazard, vulnerability and risk in the southwest region of Bangladesh. However, problem was that they assumed the vulnerability factor to be proportional to population density, which does not truly represent the flood damage data, thus questioning the output of vulnerability as well as risk. For assessing vulnerability, at first the approach should address the elements at risk, and then estimates the damage function. This is the theoretical basis of assessing vulnerability as given by Merz et al. (2007). Hasan (2006) followed this theoretical basis for assessing agricultural flood vulnerability in Tarapur union (the smallest rural administrative unit of Bangladesh), Gaibandha district, Bangladesh. Masood and Takeuchi (2012a), Dewan et al. (2007) and Dewan (2013) conducted flood hazard and risk assessment for Dhaka, Bangladesh. These studies, particularly the study by Masood and Takeuchi (2012a), indicated to identify elements at risk by following the land use mapping approach, thus improving the output of flood vulnerability.
Recently, we can observe some milestones in flood hazard and vulnerability studies, but not in flood risk study. The application of hydraulic model in flood hazard assessment is becoming popular. We can mention the studies by Afifi et al. (2019), Zin et al. (2018), and Tyrna et al. (2018) that applied different hydraulic models in studying flood hazard. At the same time, land use-based and community-based flood vulnerability study is also getting prioritised. The study by Masood and Takeuchi (2012b) is a comprehensive study showing a clear path of how to conduct flood risk study. The study shows the uses of one-dimensional hydraulic model for hazard assessment and analysis of land use for vulnerability assessment and finally finds out flood risk from hazard and vulnerability. Rakib et al. (2017) and very recently Hoque et al. (2019) introduce a new dimension in vulnerability assessment, and this dimension makes the vulnerability assessment become more community focused than before. Their methods include analysing satellite images, a structured questionnaire, criteria mapping, observation and secondary data.
Overall, the studies of flood hazard and vulnerability are good in number as well as they are updated. However, still now flood risk as a concept has not been addressed properly in flood studies. Flood risk is a function of hazard and vulnerability (Alexander 1991; Skakun et al. 2014). It is the probability of loss due to flood of a given intensity (Alexander 1991). The critical point is that while flood hazard is the same for a given area in terms of intensity, the risk could be different depending on a set of conditions and this set of conditions is referred by vulnerability (Crichton 1999). Since knowledge on flood risk is must for a planner to plan a disaster resilience society, addressing flood risk properly is a prerequisite, but it has not done yet. This study aims to introduce a new approach of assessing flood risk properly, which successfully addresses this above-mentioned critical issue. The focus of the flood risk of this study is the Baniachong Upazila (Sub-district), one of the flood-affected Upazilas in Bangladesh. Adopting the hydrodynamic behaviour certainly increases the accuracy of flood hazard map (Afifi et al. 2019), thereby ensuring better accuracy in flood vulnerability and risk maps. This study applied a 2D hydrodynamic model for the purpose of producing flood hazard map at different return periods of floods in the study site. The hazard maps were assessed under different land use categorizations. The subsequent attempt was to prepare flood vulnerability maps from flood depth–damage functions for cropping land and rural settlements. As a final attempt, the study estimated damage and produced risk maps from vulnerability index and hazard index.
2 Methodology
An integrated and interdisciplinary research approach was followed in this study. Technical assessments were integrated with stakeholders’ views on different aspects of flood hazards and risks. The interdisciplinary nature of the present study warranted the use of a wide range of technical and social research tools and methods. These are hydraulic modelling (with GIS application) of flood inundation, analysis of satellite images to determine different physical elements at risk and using quantitative method (questionnaire survey) to gather information about flood damages to different types of physical risk elements in the study area.
2.1 Description of the Study Area
The principal sources of floods in Bangladesh are the river floods from the major river systems in the monsoon months. A broad strip of land extending beyond the active river floodplains is subjected to this type of flood. The northern and north-eastern trans-boundary hill streams are susceptible to flash floods from the adjacent hills in India in the pre-monsoon months of April and May. Flash floods cause extensive damages to crop and property, particularly in the haor (wetland) areas in the northeast region (Brammer 1999). They cause massive damage to dry-season boro (rice variety) rice crop just before or at the time of harvesting. In case of property loss, they cause breaching to embankment and other flood controlling structures, road, railway, bridges, buildings, etc. In this study, one of such flash flood hazard prone areas, the Baniachong Upazila (sub-district) in Habiganj district, was selected for assessments of flood hazard, vulnerability and risk (Fig. 1).

Location of Baniachong Upazila and selected gauge stations within the model boundary
Baniachong Upazila with an area of 482.25 km2 is located in the Agro-ecological Zone—20: Eastern Surma-Kushiyara Floodplain. The mean annual rainfall in the area is about 2659 mm, as compared to the national average of 2300 mm. The rainfall varies considerably within a year, with 79% of rainfall occurring in 5 months from May to September.
The river network close to Baniachong includes Shutki, Old Kushiyara, Shaka, Borak, Shingli, and Bibiyana rivers (Fig. 1). These rivers are hydraulically connected with the Kushiyara–Kalni river system which flows down along the north of the sub-basin from northeast towards the southwest and provides a major source of flood water during the monsoon. The major portion of the basin lies outside Bangladesh and the area receives water from Tripura Hills on the south and the run-off from right bank floodplain of the Kushiyara–Kalni. The topography of the floodplain in the study area is generally flat with some depressions located in north and southwest portions of the study area (Elevation map—Fig. 1). The area surrounding the CBD (Central Business District) of the Upazila is positioned at higher elevation than distal floodplain of the local rivers (Elevation map—Fig. 1).
2.2 Derivation of Design Floods
2.2.1 Selection of Gauge Stations
A number of water level gauge stations were selected on the main rivers surrounding the study area to be subsequently used in determination of different flood levels corresponding to different return periods and subsequent analysis for floodplain inundation. Figure 1 shows the locations of such gauge stations. The stations selected include Kushiyara River at Sherpur (SW_175.5), Khowai River at Habigang (SW_159), Surma-Meghna at Markuli (SW_270) and Surma-Meghna at Azmiriganj (SW_271).
2.2.2 Frequency Analysis of Water Levels
For study area, frequency analysis of the maximum water level and or discharge during the months of April–May in pre-monsoon season was conducted since it is the flash flood inundation area. The source of the water level data is Bangladesh Water Development Board (BWDB). BWDB provides water level data at every 1-day interval. The time series water level and discharge data at the selected stations were first checked for trends. Frequency analysis was carried out with different probability distributions functions (PDFs). These PDFs are: Two-Parameter Log Normal (LN2), Three-Parameter Log Normal (LN3), Pearson Type III (P3), Log Pearson Type III (LP3) and Gumbel (EV1). To estimate peak discharge for different return periods, some of these five PDFs perform well in some cases. For example, Pumchawsaun (2018) found Log Pearson Type III (LP3) distribution fit well in case of estimation of peak discharges for 1-in-100 year flood; on the other hand, Khan and Sabbir (2018) found that Pearson Type III (P3) is the best fitted distribution for overall flood frequency analysis. Since in this present study, it is unknown which distribution fits well for the study area gauge stations; all these five PDFs were compared to get the best fitted distribution. Table 1 shows the equations of all these five distributions.
The PDFs were tested based on the probability plot correlation coefficient (PPCC) (Filliben 1975). Goodness-of-fit test based on PPCC is useful for assessing whether a proposed distribution is consistent with the at-site data sample (Stedinger 1993). The test uses the correlation coefficient ‘r’ between the ordered observations and the corresponding fitted quantiles, determined by plotting positions for each observation. Cunnane (1978) plotting position formula was used to obtain the fitted quantiles. The best fit PDFs were selected and subsequently used to determine the design flood level.
2.3 Flood Inundation Mapping
Preparing flood inundation maps based on all primary and secondary data and hydraulic model is the post-stage of derivation of design floods. The use of hydrodynamic models such as Delft3D, HEC-RAS, MIKE11, SOBEK, HEC-RAS, ISIS, ONDA and FLUCOMP is very common in flood inundation mapping at watershed level. For inundation modelling, Delft3D, a 3D modelling technique developed in the Dutch-based research institute (Deltares 2014) was used in this study. Delft3D is a fully integrated computer software suite applied to simulate hydrodynamics, sediment transport, waves, morphological developments, water quality and ecology for fluvial, estuarine and coastal environments. The Delft3D-FLOW, a module of Delft3D, is a hydrodynamic (and transport) simulation program which calculates non-steady flow and transport phenomena resulting from hydraulic and meteorological forcing on a curvilinear, boundary fitted grid or spherical coordinates.
An essential data required for Delft3D hydraulic simulation is the land topographic data. The NASA Shuttle Radar Topographic Mission (SRTM) digital elevation data, available as 1 arc second (approx. 30 m resolution), are very popular land topographic data. This dataset is found to use in many studies (e.g. Patro et al. (2009), Baugh et al. (2013)) related to flood inundation mapping using flow model. In this study, this SRTM data were used in hydraulic simulation. The DEM data were further processed using ArcGIS to fill in the no-data voids or cells. The C-band radar signal of SRTM dataset is unable to penetrate through vegetation canopy to the bare land surface, resulting in high absolute vertical error in dense forest area (Baugh et al. 2013). However, in open land surface this vertical error reduces significantly (Rodriguez et al. 2006). Ahead of this problem, in this study, there was an attempt to process the SRTM dataset with vegetation height data to get more accurate output. The vegetation height dataset was collected from Spatial Data Access Tool (SDAT) site. The site provides 1 km Forest Canopy Height globally. However, according to the dataset, canopy height was found zero in the study area. Therefore, regarding the problem with vegetation height, no further processing was carried out with the SRTM dataset.
The processed SRTM data were converted to the sizes required for 728 × 538 grids truncated for the study area using Delft3D-RGFGRID. Important considerations in constructing the computational grids were: (i) the grids must fit as closely as possible to the land–water boundaries of the area to be modelled; (ii) the grids must be orthogonal, i.e. the grid lines must intersect perpendicularly; and (iii) the grid spacing must vary smoothly over the computational region.
Figure 1 shows the model setup for the study area. Two boundary conditions were assigned: one upstream boundary and one downstream boundary. The upstream discharge was considered at location of Sherpur (SW175.5) which is part of the Kushiyara River and the downstream water level was considered at location of Habiganj (SW 159) which is part of the Barak River. The model was simulated for return periods of 2.33, 10, 20, 50 and 100 years. Out of the available time series data at the boundary station, time series were selected such that the peak pre-monsoon water levels are close to the water levels analysed for different return periods at that station. Time step used in simulation for this model is 4 min and the simulation time spanned over 3 months from 1st April to 31st May.
2.4 Flood Damage Vulnerability Analysis
2.4.1 Identification of Elements at Risk
The first step in vulnerability analysis was to identify the elements at risk in the study area. The elements at risk are defined as the level of exposure with reference to agricultural fields, buildings/infrastructure, population, economic activities, public services and utilities, etc., which can be impacted by the flood hazard (Dewan 2013). In this study, elements of risk were identified by analysing satellite images in the GIS environment and hence obtaining land use map, followed by overlying the elements onto flood inundation maps. Field observations and interviews were conducted to verify the elements identified.
Land use/land cover (LULC) dataset was generated from the digital image classification of Landsat, ETM + satellite images of 2011, downloaded from Global Land Cover Facility (https://glovis.usgs.gov/). Among various image classification techniques, the maximum likelihood algorithm is shown to produce useful outcome in deriving LULC (Dewan and Yamaguchi 2009; Jia 2019). Therefore, in this study supervised classification of maximum likelihood algorithm was applied to classify Landsat images into discrete land LULC categories. An overall workflow in preparing LULC map is shown in Fig. 2. The classification was performed on false colour composition of bands 4, 3 and 2 into following land use and land cover classes: cropping land, rural settlement, urban settlement, water bodies and bare land. Information collection during field survey as ground-truthing point was used to assess the accuracy of classification. The elements at risk identified for the study areas include cropping land and rural settlements (i.e. homesteads), because other land cover classes are not important from flood risk point of view. It is noted here that image classification did not yield roads as one land use classification. Finally, inundation layers were overlaid on land use layer to obtain the overlaid zones. From the ArcGIS overlay analysis, different sort of inundation statistics was generated.
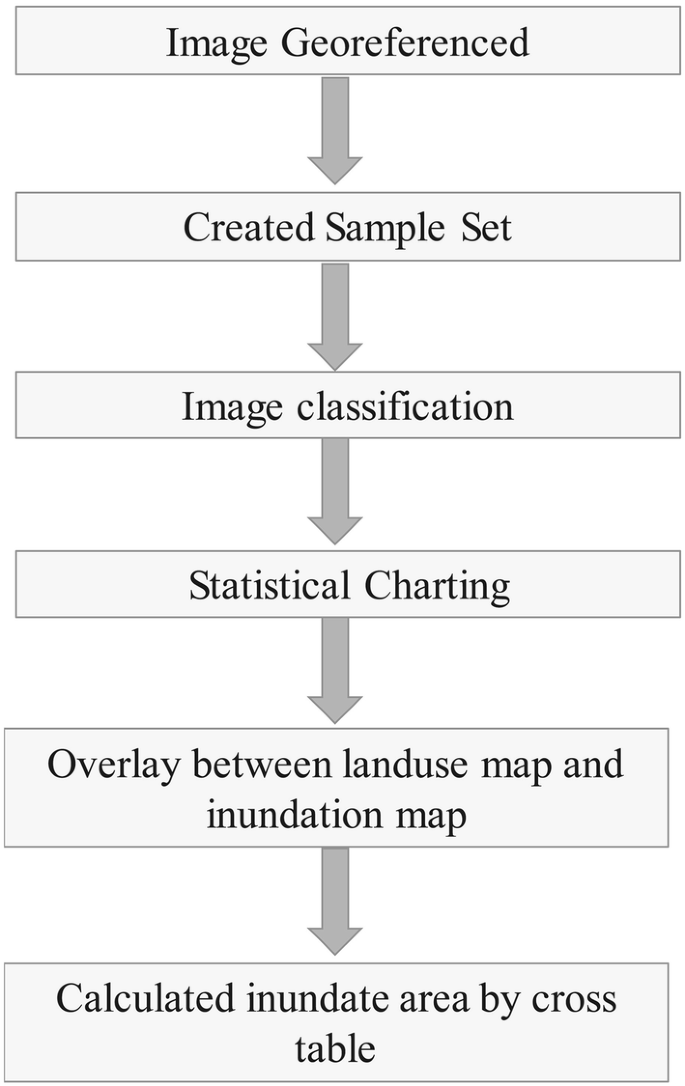
Workflow showing land use classification
2.4.2 Assessment of Flood Damage Functions
The quantification of vulnerability depends on the susceptibility of ‘elements at risk’. It can be termed as the degree of loss to a given element at a given severity level. It is usually expressed on a scale 0 (no damage) to 1 (total loss) unit. The present study considers ‘depth of inundation’ as the main parameter for assessing flood damage functions for croplands and rural settlements. The study further considers the direct economic damages of floods. Considering depth as the flood damage parameter, depth–damage relationships (alternatively called loss functions or vulnerability functions) were developed for different elements at risk: crops and settlements. Depth–damage relationship presents information on the relationship of flood damage of a certain element to a certain depth of flooding (or stage) (Smith 1994).
In this study, for developing depth–damage relationship for crop, the flood damage data were collected from different secondary literature and organizations, and extensive interviews with the local people were conducted as part of the questionnaire survey. A total of 120 local people including farmers, fishermen, and small businessman from the study site were interviewed as household basis. A questionnaire survey was preferred for this interview session as it provides insight into the information of inundation depth and associated flood damages. The survey was conducted following a random sampling method to select respondents for the household interviews. The structured questionnaire was first pre-tested in 15 randomly selected households. Then, modifications were made before the actual interviews of the sampled households. Additionally, the questionnaire was administered to respondents who (i) were aged 20 years and above, (ii) had lived in the respective area for at least 15 years, and (iii) were main decision makers in the household, and/or, in the absence of a family head, it was made with appropriate representative and knowledgeable member of the household. The questionnaire survey covered the local perceptions on crop and settlement damages associated with different remarkable flood events such as 1988, 1998, 2004 and 2007 as well as collected information on damage corresponding inundation depths. Damage was assessed in terms of the amount of money (presented as percentage of the total production value) necessary to recover the original production. Based on this flood depth–damage information from questionnaire survey, depth–damage curve was developed.
For developing the depth–damage relationship for settlement, a valuation survey was conducted for the settlement vulnerability assessment. Following the study by Islam (2005), settlements were classified into four types such as brick floor–brick wall (BB), brick floor–CI sheet wall (BC), mud floor–CI sheet wall (MC), and mud floor–mud wall (MM). For the selected properties, the survey quantified the damage of all items due to flood and their current value based on type, quality and degree of wear. This included information on the height above the floor of each item or the height taken as standard from house to house. The information for all samples of each element class was then averaged and stage-damage curves were constructed.
2.5 Flood Risk Assessment
As risk is a combination of hazard, vulnerability and exposure (i.e. elements at risk) (Skakun et al. 2014), in the final step of risk assessment, the expected damage of the risk element was estimated first by combining replacement values assessed for the elements and then following the stage-damage function. The following equations were followed to estimate expected damage.
where D is total direct property damage per cell of the raster map, ‘vul’ is the vulnerability value per cell which is the function of Depth (DP) in meter and duration (DR) of inundated land in days, A is the area of each cell in sq.m and P is the property value in monetary terms of each cell. Here, ED is the expected damage and T is the return period of flood.
Property value data per hectare of each land use class were collected from the field survey. Data on average unit prices of houses and cropping land under the present circumstances were collected from the field survey. After that, a land use-based raster map showing the monetary value for each land parcel was prepared (Economic Value in Fig. 3). Direct damages to properties of economic units were classified as settlement and agricultural damages (Vulnerability in Fig. 3). Then, the expected damage value was classified into several defined classes using GIS environment (Expected Damage in Fig. 3). The single output map algebra in Fig. 3 was the product of direct property damage (D) divided by return period pf flood (T). The conceptual model for entire flood risk mapping is shown in Fig. 3.

Conceptual model for flood risk assessment
3 Results and Discussion
3.1 Frequency Analysis of Water Levels
The fitted PDFs and the corresponding values of PPCC for annual maximum water levels of the selected gauge stations and for maximum discharge for Kushiyara River at Sherpur (SW_175.5) station are shown in Tables 2, 3, 4, 5, and 6. The probability plots along with 90% confidence interval for the annual maximum water levels of the selected gauge stations are shown in Fig. 4. It is seen that the observed values fall well within the 90% confidence interval of the fitted distributions for annual maximum water level.

Probability plot along with 90% confidence interval of the fitted distributions to the pre-monson peak water level data of different gauge stations in Baniachong Upazila
3.2 Model Calibration and Validation
After simulating the hydrodynamic model Delft3D, the first step was to calibrate and validate the model’s output with observed data. Water level (WL) data for the month April to May 2007 (pre-monsoon) of Markuli (SW 270) station were used for calibration purpose. The selected Markuli (SW_270) station belongs to the Surma-Meghna River system (Fig. 1). The calibrated parameter was the Manning’s roughness coefficient ‘n’ in the river. Similar to the study by Dutta and Nakayama (2009), land use types were the basis for estimating the roughness coefficients for rivers and surface in this present study. From the calibration, a close agreement between the observed and calculated water level (Fig. 5) using the roughness coefficients between 0.019 and 0.023 was found.

Water level calibration of the model at Markuli station (SW 270)
After calibration, the model was validated against the water levels (WL) for the month April to May 2007 of Azmiriganj (SW 271) station at Surma-Meghna river. The validation shows that the observed and computed water levels are close (Fig. 6). The computed water level at this station was found to vary within − 0.17 and the coefficient of determination (R2) is 0.72. Further validation was carried out between the observed flood extent of 1998, a 100-year flood event (Islam and Chowdhury 2002), and the modelled 100-year flood extent (Fig. 7). The extent of 1998 flood was maximum from 27th July 1998 to 07th September 1998 in the study site as per BWDB (2010). RADARSAT image covering the 1998 inundation extent was found available for 26th August, which is within the specified range of maximum flood extent. Therefore, this RADARSAT image was used for delineating the observed inundation extent of 1998 flood. It was found 76.5% accuracy between the modelled and the observed inundation extents when a GIS overlay operation was performed between these two extents.

Water level validation of the model at Azmiriganj station (SW 271)

Map showing 100-year flood inundation computed from modelled scenario (left) and 26 August 1998 flood inundation from observed scenario
3.3 Inundation Maps
Simulation by Delft3D model yielded floodplain inundation depths at different return periods, as presented in Fig. 8 and Table 7. It was found that overall with the increase in return period the inundated area increases substantially for the flood class of “Low (0–2 m)” and “Medium (2–4 m)”. However, exception is 20-year return period of flood, where inundated area for the flood class of “Low (0–2 m)” decreased as compared to the flood class of “Low” at 10-year return period. Noticeably, at 2.33-year flood event, only the north side of the study area was inundated, but with greater return period of flood the western and the southern sides of the study area were inundated gradually. There was no inundated area for “High (4–6 m)” class of flood at 2.33-year return period; however, at greater reoccurrence of flood (greater than 10-year) inundated area of “High” class of flood was present with slight extent (~ 1 km2). The percentage area of inundation increased from 28.77 to 80.28% corresponding to 2.33-year return period to 100-year return period, respectively, for flood class low. Whereas for medium and high class floods, the area of inundation increased from 0.31 to 10.23% and 0 to 0.28% for return period 2.33 years to 100 years, respectively.

Inundation depth (flood hazard map) for different return periods in Baniachong Upazila
At low reoccurrence interval of flood, the major river systems are not always seen to play major role in flooding the adjacent floodplains by their overbank flows. Rather, floodplains are inundated from the flows coming from local floodplain channels connected with the major river systems (Jeb and Aggarwal 2008; Luo et al. 2018; Tanaka et al. 2017). This is why the distribution of floodplain inundation can be sporadic at low reoccurrence interval of flood. However, at later stages of flood as water levels continue to rise, floodplains get closer to major river and meet flows directly coming from the river (Fantin-Cruz et al. 2011; Karim et al. 2016; Yin et al. 2013; Zin et al. 2018). Then, a vast expanse of the floodplain is inundated. The pattern of inundation in the study site showed similar behaviour at different return periods of flood. Except few areas, the whole study site was inundated (Fig. 8) by the overbank flows coming from the major rivers (Fig. 1) (the Kushiyara, the Khowai, the Surma-Meghna and the Barak) at recurrence interval of flood greater than 20. At relatively low recurrence intervals of flood, a small portion of the study site, northern portion mainly, was inundated possibly by local floodplain channels only. The floods with a relatively low return period have a large influence on the annual risk. At the same time as these floods may cause relatively low economic damage per event, their relatively frequent occurrence means that they should be fully considered in flood risk assessments (Ward et al. 2011).
The inundation extent in the study area simulated by Delft3D model is comparable to other studies. The percentage of flooded area in Baniachong Upazila was 86.63 as on June 13, 1998 (BWDB 2010). Study conducted by Bhuiyan et al. (2010) termed the 1998 flood is a return period of 75 to 100 years. In this study, for 100-year return period, 80.28% (399.34 km2) area was found under flooding (Table 7), which is quite close to the BWDB study.
3.4 Inundation of Different Land Use Categories
Supervised classification of LANDSAT image with ArcGIS yielded different land cover existing in Baniachong. The land cover map was assessed against Google Earth image. The assessment was 30 m apart sampling basis, since the LANDSAT image used in this study is approximately 30 m in resolution. Bai et al. (2015) also used Google Earth images when assessed land use map of China. Overall accuracy in the Bai et al. (2015) study varies from 48.6 to 68.9%. In the present study, the assessment shows 70%, 100%, 60%, 62% and 60% accuracy in water bodies, urban settlement, rural settlement, cropping land and bare land categories, respectively, in the derived land cover map.
The land use map of Baniachong is shown in Fig. 9. About ~ 4%, ~ 18%, ~ 27%, ~ 37% and ~ 15% are covered by water bodies, urban settlement, rural settlement, cropping land and bare land, respectively. This distribution of land use classes is representative to a typical rural area of Bangladesh (e.g. Khan et al. (2015), Parvin et al. (2017)).

Land use map of Baniachong Upazila
Figure 10 presents the percentage of inundation area for each land use class at different return periods of flood. It is found from Fig. 10 that the affected area increases with the increase of return period and flood depth for all land use classes. It is noticeable that, with the increase in return periods from 2.33 to 100 inundated areas become more than tripled for land use classes rural settlement (~ 37 to ~ 126 km2), urban settlement (~ 13 to ~ 63 km2) and bare land (~ 14 to ~ 57 km2), and more than doubled for land use class cropping land (~ 76 to ~ 188 km2). The percentage inundation of urban settlement (~ 16 to ~ 85) is higher than that of rural settlement (~ 15 to ~ 69) with the increase in return period. Water bodies were inundated much more (~ 29% at 2.33-year flood and ~ 90% at 100-year flood) than that of any other classes of land use. It reflects the loss of capture fisheries during flooding. The rising trend of inundated area for cropping land, which is the most dominant land use type, decreases with the increase of return periods. Noticeably, in case of higher reoccurrence interval of flood (e.g. 50 and 10-year floods), inundated area for cropping land remains the same with the increase of return period.

Percent of inundation area for each land use class at different return periods (years)
The settlement areas (both urban and rural) in the study site are slightly elevated locally, as like as other settlement areas in Bangladesh (Choudhury 1973). This is why these areas usually do not receive flood flow from major rivers nearby or even from local floodplain channels at low reoccurrence interval of flood. Furthermore, man-made structures, such as road network, obstruct lateral and longitudinal connectivity of flood water fluxes (Kumar et al. 2014), thereby reducing the chance of inundation in the settlement areas of Baniachong Upazila. As a result, only a negligible portion of the settlement areas (~ 28% for rural settlement and ~ 16% for urban settlement at 2.33-year flood) were inundated at low reoccurrence interval of flood as found from the simulation. However, at greater reoccurring interval of flood, the settlement areas received flood water as the flood flows defeat the settlement elevation and or overtop the man-made structures. This led to abrupt inundation of the settlement areas, thereby increasing the inundated area in percentage (~ 28% at 2.33-year flood to ~ 94% at 100-year flood) (Fig. 10). Cropping or agriculture land areas, which are typically as depressions or low elevated zone in active and older floodplain, often receive flood water from major rivers as well as from local floodplain channels (Charlton 2008). The cropping land area in Baniachong Upazila most probably has similar characteristics in terms of flood water connectivity with the major rivers and the local floodplain channels. Therefore, most of the area of cropping land was inundated at low reoccurrence interval of flood (~ 40% and ~ 80% at 2.33 and 10-year floods, respectively) and unlike settlement areas, the inundated area did not increase abruptly and even did not change at greater reoccurrence interval of flood (from 50- year to 100-year flood) (Fig. 10).
3.5 Floodplain Damage Vulnerability
3.5.1 Damage Function and Damage Vulnerability Mapping
Figure 11 shows the depth–damage curves for two elements of risks: cropping lands and rural settlements for the study site. Depth–damage functions for these two elements were constructed with the help of hazard maps shown in Fig. 8. It is noted here that the damage function shown here for rural settlement refers to an average for four dominant types of settlements usually found in the study site (as discussed in Sect. 2.4.2). This damage function was used to represent the physical vulnerability of the rural settlements since it was not possible to distinguish the four different types either in the satellite image processing or through field survey.

Flood damage vulnerability (depth–damage function) of cropping land and rural settlement
Using the hazard map (Fig. 8) and the stage-damage curve (Fig. 11), crops vulnerability maps for different return periods of flood were constructed, as shown in Fig. 12. In the crop vulnerability mapping, the flood depths were divided into five scales (0–0.5 m, 0.5–1 m, 1–1.5 m, 1.5–2 m and 2 m and above) and their respective vulnerability is: very low vulnerable (0–0.25), low vulnerable (0.25–0.45), medium high vulnerable (0.45–0.65), high vulnerable (0.65–0.84) and very high vulnerable (0.84–1) for different return periods of flood.

Vulnerability rank for cropping land at different return periods of flood
From Fig. 12, it is found that crop vulnerability increases with the increase in return period. Almost 20% of the total cropping land area is “high” and or “very high” vulnerable to 100-year flood. These areas are close to the rivers (Fig. 12), and further generally laying at low elevations (Elevation map—Fig. 1). On the other hand, ~ 42% of the total cropping land area is “low” to “medium high” vulnerable to 100-year flood. Most of these areas tended to be further away from the high drainage density areas. Significantly, the results in Fig. 12 depict the fact that the cropping land in northern portion of the study site is much more vulnerable to flood than any other area of the study site. This is due to the fact that the northern portion is very close to the Suriya-Kalakhai River system (Fig. 12), one of the major rivers in the study site. Furthermore, the area is a depression zone identified in the elevation map in Fig. 1. Consequently, the extent of flood damage would be higher in norther portion than any other portion of the study site. Note that, this proposition is true for same flood, in terms of intensity and exceedance probability. However, one might argue with different varieties of crop as crop vulnerability can differ from one variety to another variety (Cutter 1996). This is probably a scope of further study in future.
Rural settlement vulnerability maps for different return periods of flood were constructed, as shown in Fig. 13. In the rural settlement vulnerability map, the flood depths were divided into six scales (0–0.5 m, 0.5–1 m, 1–1.5 m, 1.5–2 m, 2–2.5 m and 2.5 m and above) and their respective vulnerability is: very low vulnerable (0–0.15), low vulnerable (0.15–0.35), medium low vulnerable (0.35–0.6), medium high vulnerable (0.6–0.75), high vulnerable (0.75–0.9) and very high vulnerable (0.9–1) for different return periods.

Vulnerability rank for rural settlement at different return periods of flood
The result of vulnerability map for rural settlement showing in Fig. 13 depicts that rural settlement vulnerability increases with the increase in return period. Overall, irrespective of any class of vulnerability, ~ 28% of the total rural settlement area is vulnerable to flood at 2.33-year return period. This percentage becomes ~ 95% at 100-year flood. Now, if looking on the basis of vulnerability class, only 0.2% of the total rural settlement area is “high” and or “very high” vulnerable to flood at 2.33-year return period. However, at 100-year flood this percentage increases to ~ 8. This increasing trend is probably due to the nearby Kalni River (Fig. 13). Noticeably, rural settlement area with “low” and or “very low” vulnerable to flood increases sharply with the increase in return period (~ 15% of the total rural settlement area at 2.33-year flood increase to ~ 30% of the total rural settlement area at 100-year flood). These areas where rural settlement vulnerability with “low” and or “very low” increases are tended to be either close to the Suti River and the Barak River (Fig. 13) or laying at relatively low elevations (Elevation map—Fig. 1). As a whole, distance from river to settlement determines the settlement vulnerability in the study site. However, type of settlement is obviously a factor in this regard, but it is out of scope in the present study.
3.5.2 Damage estimation and risk mapping
The expected damage of the inundated land use types was estimated using equation outlined in Sect. 2.5. The value of P (property value) was found to be Tk. 9.4 (Tk. 2820 per cell) for agriculture and Tk. 590 for settlement (Tk. 177,000 per cell). Thus, raster-based damage maps for various return of floods were produced.
Figure 14 shows the expected damage or risk map for cropping land at different return periods of flood. Figure 15 presents the percentage of cropping land area with different levels of risk at different return periods of flood. From Figs. 14 and 15, it is found that overall the cropping land area with different classes of flood risk increases with the increase in return period. However, cropping land areas with “Low” and “High” flood risk decrease (~ 30 km2 to ~ 28 km2 for “Low” and ~ 28 km2 to ~ 12 km2 for “High”) with the increase in return period from 10 to 100-years and 50 to 100-years, respectively (Fig. 14). The cropping land in southern portion of the study area is not under risk at 2.33-year flood, but in northern portion it is always under risk at all level of floods (Fig. 14).

Expected damage or risk map for cropping land at different return periods of flood

Percent of cropping land area with different levels of risk at different return periods of flood
The reason why cropping land areas with “Low” and “High” flood risk decrease with the increase in return period is probably because these areas are shifted to either risk class of “Medium” or “Very high” when affected by greater reoccurrence interval of flood. Overall, existing topography and river-channel network performing as vulnerability element and flood depth as hazard element determine the spatial distribution of different levels of flood risk for the cropping land in the study site. The northern portion of the study area has depression (Elevation map—Fig. 1), and this is probably the main reason for which the area is under flood risk at all level of floods. Furthermore, the Kalni River at north is also responsible for the area to be flooded at all level of floods. The drainage density in southern portion of the study area is relatively higher (Fig. 14), thus increasing the flood risk level for cropping land in respective area.
Figure 16 shows the risk maps for rural settlement at different return periods of flood. Figure 17 presents the percentage of rural settlement area with different levels of risk at different return periods of flood. Figures 16 and 17 show that except the area covered by the risk classes of “Low” and “Medium high” all other classes increase with the increase in return period. Significantly, the area covered by the risk class of “Very low” increases much more (~ 14 km2 at 2.33-year flood to ~ 67 km2 at 100-year flood) than any other classes. The rural settlement areas located south and south-east of the Suti River (Fig. 16) are not at risk to 2.33-year flood. However, at greater reoccurrence interval of floods, these areas, particularly the areas close to the Suti River, fall under the risk classes from “Medium low” to “Very high”. The reason could be the existence of intricated network of river-channels close to the area as shown in Fig. 16.

Expected damage or risk map for settlement at different return periods of flood

Percent of rural settlement area with different levels of risk at different return periods of flood
Overall, the study finds that areas with different levels of flood risk do not correspond to the areas of inundation at different return periods of flood. While the areas of inundation increase with increase in return period of flood, the areas with different levels of flood risk are determined by depth of inundation and depth–damage function (i.e. vulnerability index).
4 Conclusions
Baniachong Upazila represents a flash flood area where Boro rice is the dominant crop, and this variety of crop is a very important element for estimating risk. Area of inundation depth increases substantially with increasing return period, which has a considerable impact on the area of cropland and also the area of settlements. It was found that cropland is highly vulnerable at 2.8-m depth, while settlement is highly vulnerable above 3-m depth.
Traditionally, hydrologic/hydraulic models are commonly used to study or delineate the potential areas of flood hazard at given recurrence interval of flood. Determining the flood hazard using one of the popular hydraulic models, and then delineate the flood vulnerable and risk areas as carried out in this study for Baniachong Upazila is important for decision makers, planner and overall management activities. Importantly, this study shows an effective approach of integrating GIS, hydraulic model and field survey in the study of flood risk assessment, and this approach successfully assesses flood risk in the study site, where risk as a concept has been placed in terms of theoretical framework. Furthermore, the study showing approach to flood risk assessment is relatively inexpensive and easy to manage and more significantly allows interactive use by flood managers for continuing improvement.
Nonetheless, the study has a number of limitations mainly due to resource and time constraints. Damage due to floods can depend on a number of factors, including depth of flood inundation, duration of flooding, flow velocity, timing of occurrence, rate of rise of flood, etc. However, the study did not consider any other potential factor except ‘depth of inundation’ as the parameter for assessing flood damage functions. While flow velocity is typically an important damage parameter in such flash flood area, not considering it may be justified, since the area is much inland corresponding to a higher order catchment and the fact that the effect of velocity is maximum in the hilly, the border areas, which gradually diminishes with the increase in the order of the catchment. However, velocity is one important parameter while assessing flood damage due to storm surges and future study should be undertaken considering this parameter.
Another limitation is that only the direct economic damages of floods has been considered, while some studies (i.e. Smith (1994)) indicated that indirect flood damage (with multiplier effect) may assume a significant proportion of the total flood damage. While vulnerability due to flood hazards encompasses physical, social, economic and environmental dimensions, only the physical vulnerability aspects have been considered in the present study because of resource limitation and lack of time to carry out the investigation.
References
Afifi Z, Chu H-J, Kuo Y-L, Hsu Y-C, Wong H-K, Ali MZ (2019) Residential flood loss assessment and risk mapping from high-resolution simulation. Water 11:751
Alexander D (1991) Natural disasters: a framework for research and teaching. Disasters 15:209–226
Bai Y, Feng M, Jiang H, Wang J, Liu Y (2015) Validation of land cover maps in China using a sampling-based labeling approach Remote Sensing 7:10589–10606
Baky AA, Zaman AM, Khan AU (2012) Managing flood flows for crop production risk management with hydraulic and GIS modeling: case study of agricultural areas in Shariatpur. APCBEE Procedia 1:318–324
Baugh CA, Bates PD, Schumann G, Trigg MA (2013) SRTM vegetation removal and hydrodynamic modeling accuracy. Water Resour Res 49:5276–5289
Bhuiyan SR, Baky AA (2014) Digital elevation based flood hazard and vulnerability study at various return periods in Sirajganj Sadar Upazila. Bangladesh Int J Disaster Risk Reduct 10:48–58
Bhuiyan MJAN, Dutta D (2012) Analysis of flood vulnerability and assessment of the impacts in coastal zones of Bangladesh due to potential sea-level rise. Nat Hazards 61:729–743
Bhuiyan JA, Jakobsen F, Khan AS, Bhuiyan S (2010) Flood characteristics of Upper Meghna River Basin, Bangladesh. Int J Model Simul 30:428–433
Bhuiyan SR, Baky AA, Hoque MM, Salehin M, Islam AS, Islam T (2014) Development of cyclone hazard maps with effect of climate change scenario for Barguna Sadar Upazila. Bangladesh Int J Surf Groundwater Manag 01:6
Brammer H (1999) Agricultural disaster management in Bangladesh. University Press Ltd, Dhaka
Burrel BC, Davar K, Hughes R (2007) A review of flood management considering the impacts of climate change. Water Int 32:342–359
BWDB (2010) Flood report 1998. Bangladesh Water Development Board, Ministry of Water Resources
Charlton R (2008) Fundamentals of fluvial geomorphology. Routledge, London
Choudhury JR (1973) Low-rise low-cost housing and extreme wind related problems in Bangladesh National Bureau of Standards. US Department of Commerce, Washington DC
Chowdhury NT (2010) Water management in Bangladesh: an analytical review. Water Policy 12:32–51
Chowdhury J, Karim M (1996) A risk-based zoning of storm surge prone area of the Ganges Tidal Plain Journal of Civil Engineering. Inst Eng Bangladesh 24:221–233
Chowdhury J, Rahman M, Salehin M (1997) Flood control in a floodplain country: experiences of Bangladesh, Institute of Flood Control and Drainage Research Publication of the Islamic Education, Scientific and Cultural Organization (ISESCO), Rabat, Morocco
Crichton D (1999) The risk triangle. Nat Disaster Manag 102:103
Cunnane C (1978) Unbiased plotting positions—a review. Journal of Hydrology 37:205–222
Cutter SL (1996) Vulnerability to environmental hazards. Prog Hum Geogr 20:529–539
Deltares DD-F (2014) Users manual. Simulation of multi‐dimensional hydrodynamic flows and transport phenomena, including sediments
Demir V, Kisi O (2016) Flood hazard mapping by using geographic information system and hydraulic model: Mert River, Samsun. Turkey. Adv Meteorol 2016:9
Dewan AM (2013) Modeling flood hazards. In: Dewan AM (ed) Floods in a megacity: geospatial techniques in assessing hazards, risk and vulnerability. Springer, Berlin, pp 129–137
Dewan AM, Yamaguchi Y (2009) Land use and land cover change in Greater Dhaka, Bangladesh: using remote sensing to promote sustainable urbanization. Appl Geogr 29:390–401
Dewan AM, Islam MM, Kumamoto T, Nishigaki M (2007) Evaluating flood hazard for land-use planning in Greater Dhaka of Bangladesh using remote sensing and GIS techniques. Water Resour Manag 21:1601–1612
Dutta D, Nakayama K (2009) Effects of spatial grid resolution on river flow and surface inundation simulation by physically based distributed modelling approach. Hydrol Process Int J 23:534–545
Fantin-Cruz I, Pedrollo O, Castro NM, Girard P, Zeilhofer P, Hamilton SK (2011) Historical reconstruction of floodplain inundation in the Pantanal (Brazil) using neural networks. J Hydrol 399:376–384
Filliben JJ (1975) The probability plot correlation coefficient test for normality. Technometrics 17:111–117
Giustarini L, Chini M, Hostache R, Pappenberger F, Matgen P (2015) Flood hazard mapping combining hydrodynamic modeling and multi annual remote sensing data. Remote Sens 7:14200–14226
Hasan SI (2006) Application of geoinformatics for flood study at Tarapur Union of Gaibandha. M. Sc. Thesis, IWFM, Bangladesh University of Engineering and Technology
Hazarika N, Barman D, Das A, Sarma A, Borah S (2018) Assessing and mapping flood hazard, vulnerability and risk in the Upper Brahmaputra River valley using stakeholders’ knowledge and multicriteria evaluation (MCE). J Flood Risk Manag 11:S700–S716
Hoque R, Nakayama D, Matsuyama H, Matsumoto J (2011) Flood monitoring, mapping and assessing capabilities using RADARSAT remote sensing, GIS and ground data for Bangladesh. Nat Hazards 57:525–548
Hoque MA-A, Tasfia S, Ahmed N, Pradhan B (2019) Assessing spatial flood vulnerability at Kalapara Upazila in Bangladesh using an analytic hierarchy process. Sensors 19:1302
Hunting (1992) FCD/I Agricultural Study, FAP-12, Main Report 1
Islam KMN (2005) Flood loss potentials in non-agricultural sectors: assessment methods and standard loss database for Bangladesh Dhaka. Palok Publishers, Bangladesh
Islam A, Chowdhury JU (2002) Hydrological characteristics of the 1998 Flood in major rivers. In: Ali AM, Seraj SM, Ahmad S (eds) Engineering Concerns of Flood, pp 227–239
Islam MM, Sado K (2000) Development of flood hazard maps of Bangladesh using NOAA-AVHRR images with GIS. Hydrol Sci J 45:337–355
Islam A, Bala S, Haque M (2010) Flood inundation map of Bangladesh using MODIS time-series images. J Flood Risk Manag 3:210–222
Jeb DN, Aggarwal S (2008) Flood inundation hazard modeling of the River Kaduna using remote sensing and geographic information systems. J Appl Sci Res 4:1822–1833
Jia K et al (2019) Land use and land cover classification using Chinese GF-2 multispectral data in a region of the North China Plain. Front Earth Sci 13:327–335
Karim F, Petheram C, Marvanek S, Ticehurst C, Wallace J, Hasan M (2016) Impact of climate change on floodplain inundation and hydrological connectivity between wetlands and rivers in a tropical river catchment. Hydrol Process 30:1574–1593
Khan M, Sabbir M (2018) Flood hazard mapping of dharla river floodplain using HEC-RAS 1D/2D coupled model
Khan MMH, Bryceson I, Kolivras KN, Faruque F, Rahman MM, Haque U (2015) Natural disasters and land-use/land-cover change in the southwest coastal areas of Bangladesh. Reg Environ Change 15:241–250
Kumar R, Jain V, Babu GP, Sinha R (2014) Connectivity structure of the Kosi megafan and role of rail-road transport network. Geomorphology 227:73–86
Luo P et al (2018) Flood inundation assessment for the Hanoi Central Area, Vietnam under historical and extreme rainfall conditions. Sci Rep 8:12623
Masood M, Takeuchi K (2012a) Assessment of flood hazard, vulnerability and risk of mid-eastern Dhaka using DEM and 1D hydrodynamic model. Nat Hazards 61:757–770
Masood M, Takeuchi K (2012b) Flood Hazard and Risk Assessment in Mideastern part of Dhaka, Bangladesh FLOOD
Merz B, Thieken A, Gocht M (2007) Flood risk mapping at the local scale: concepts and challenges. In: Begum S, Stive MJF, Hall JW (eds) Flood risk management in Europe. Springer, Berlin, pp 231–251
Mirza MMQ (2011) Climate change, flooding in South Asia and implications. Region Environ Change 11:95–107
Parvin GA, Ali MH, Fujita K, Abedin MA, Habiba U, Shaw R (2017) Land use change in southwestern coastal Bangladesh: Consequence to food and water supply. In: Banba M, Shaw R (eds) Land use management in disaster risk reduction. Springer, Berlin, pp 381–401
Patro S, Chatterjee C, Mohanty S, Singh R, Raghuwanshi N (2009) Flood inundation modeling using MIKE FLOOD and remote sensing data. J Indian Soc Remote Sens 37:107–118
Paul BK (1995) Farmers’ responses to the flood action plan (FAP) of Bangladesh: an empirical study. World Dev 23:299–309
Paul BK (1997) Flood research in Bangladesh in retrospect and prospect: a review. Geoforum 28:121–131
Paul SK, Hossain MN (2013) People’s perception about flood disaster management in Bangladesh: a case study on the Chalan Beel Area. Stamford J Environ Hum Habitat 2:72–86
Paul SK, Routray JK (2010) Flood proneness and coping strategies: the experiences of two villages in Bangladesh. Disasters 34:489–508
Pumchawsaun P (2018) Integrated hydrodynamic and socio-economic damage modelling for assessment of flood risk in large-scale basin: the case study of Lower Chao Phraya River Basin in Thailand
Rahman R, Salehin M (2013) Flood risks and reduction approaches in Bangladesh. In: Shaw R, Mallick F, Islam A (eds) Disaster risk reduction approaches in Bangladesh. Springer, Berlin, pp 65–90
Rakib MR, Islam MN, Islam MN (2017) Flood vulnerability mapping to riverine floods: a study on the old Brahmaputra River. Am J Geosci 7:47–58
Rodriguez E, Morris CS, Belz JE (2006) A global assessment of the SRTM performance. Photogramm Eng Remote Sens 72:249–260
Sanyal J, Lu X (2009) Ideal location for flood shelter: a geographic information system approach. J Flood Risk Manag 2:262–271
Shaw R (2006) Critical issues of community based flood mitigation: examples from Bangladesh and Vietnam. Sci Cult 72:62
Skakun S, Kussul N, Shelestov A, Kussul O (2014) Flood hazard and flood risk assessment using a time series of satellite images: a case study in Namibia. Risk Anal 34:1521–1537
Smith DI (1994) Flood damage estimation-A review of urban stage-damage curves and loss functions. Water Sa 20:231–238
Sohel MSI, Ullah MH (2012) Ecohydrology: a framework for overcoming the environmental impacts of shrimp aquaculture on the coastal zone of Bangladesh. Ocean Coast Manag 63:67–78
Stedinger JR (1993) Frequency analysis of extreme events in handbook of hydrology
Tanaka T, Tachikawa Y, Ichikawa Y, Yorozu K (2017) Impact assessment of upstream flooding on extreme flood frequency analysis by incorporating a flood-inundation model for flood risk assessment. J Hydrol 554:370–382
Tingsanchali T, Karim MF (2005) Flood hazard and risk analysis in the southwest region of Bangladesh. Hydrol Process Int J 19:2055–2069
Tran P, Shaw R, Chantry G, Norton J (2009) GIS and local knowledge in disaster management: a case study of flood risk mapping in Viet Nam. Disasters 33:152–169
Tyrna B, Assmann A, Fritsch K, Johann G (2018) Large-scale high-resolution pluvial flood hazard mapping using the raster-based hydrodynamic two-dimensional model FloodAreaHPC. J Flood Risk Manag 11:S1024–S1037
Van Alphen J, Lodder Q (2006) Integrated flood management: experiences of 13 countries with their implementation and day-to-day management. Irrig Drain 55:159–171
Vojtek M, Vojteková J (2016) Flood hazard and flood risk assessment at the local spatial scale: a case study Geomatics. Nat Hazards Risk 7:1973–1992
Ward PJ, Moel Hd, Aerts J (2011) How are flood risk estimates affected by the choice of return-periods?
Yin J, Yu D, Yin Z, Wang J, Xu S (2013) Multiple scenario analyses of Huangpu River flooding using a 1D/2D coupled flood inundation model. Nat Hazards 66:577–589
Younus M (2012) Autonomous crop adaptation processes to extreme floods: A case study in Bangladesh. In: Water and climate: policy implementation challenges; Proceedings of the 2nd practical responses to climate change conference, 2012. Engineers Australia, p 124
Younus MAF, Harvey N (2014) Economic consequences of failed autonomous adaptation to extreme floods: a case study from Bangladesh. Local Economy 29:22–37
Zin WW, Kawasaki A, Takeuchi W, San ZMLT, Htun KZ, Aye TH, Win S (2018) Flood Hazard Assessment of Bago River Basin. Myanmar J Disaster Res 13:14–21
Acknowledgements
The study was financially supported by the Climate Change Trust Fund of Climate Change Cell under Ministry of Forestry and Environment (MoEF) of Government of Bangladesh. It was being implemented by Climate Change Study Cell housed at Institute of Water and Flood Management (IWFM), Bangladesh University of Engineering and Technology (BUET). The authors of the study sincerely acknowledge the help from Dr Ashraf Dewan, Senior Lecturer, School of Earth and Planetary Sciences (EPS) for providing a general outline to prepare this study. He is also acknowledged for providing the RADARSAT image of 1998 flood event, which was used in this study for validation purpose of the hydraulic model’s result.
Author information
Authors and Affiliations
Corresponding author
Rights and permissions
Open Access This article is distributed under the terms of the Creative Commons Attribution 4.0 International License (http://creativecommons.org/licenses/by/4.0/), which permits unrestricted use, distribution, and reproduction in any medium, provided you give appropriate credit to the original author(s) and the source, provide a link to the Creative Commons license, and indicate if changes were made.
About this article

Cite this article
Baky, M.A.A., Islam, M. & Paul, S. Flood Hazard, Vulnerability and Risk Assessment for Different Land Use Classes Using a Flow Model. Earth Syst Environ 4, 225–244 (2020). https://doi.org/10.1007/s41748-019-00141-w
Received:
Accepted:
Published:
Issue Date:
DOI: https://doi.org/10.1007/s41748-019-00141-w