Office Space
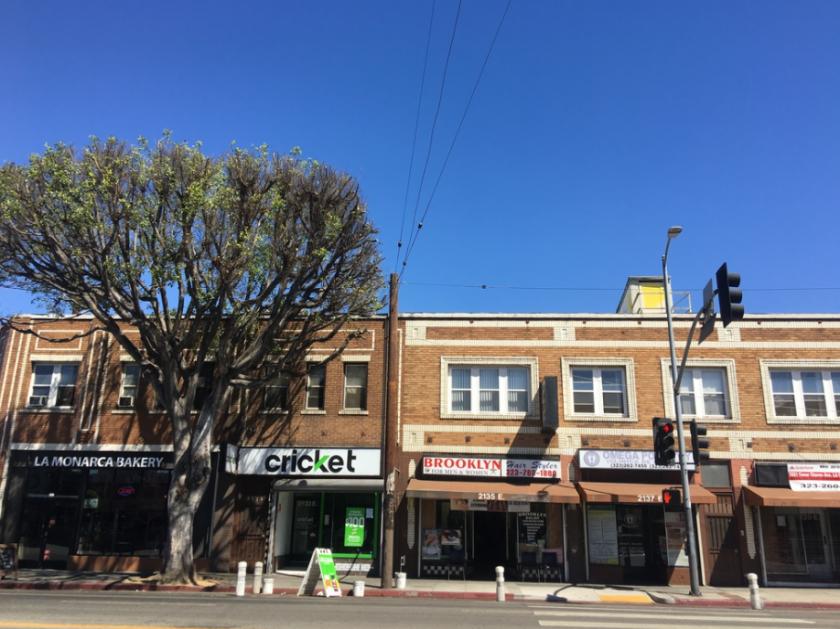
2127 East Cesar E Chavez Avenue Los Angeles, CA 90033
2127 East Cesar E Chavez Avenue Los Angeles, CA 90033
Details & Description
Property Highlights
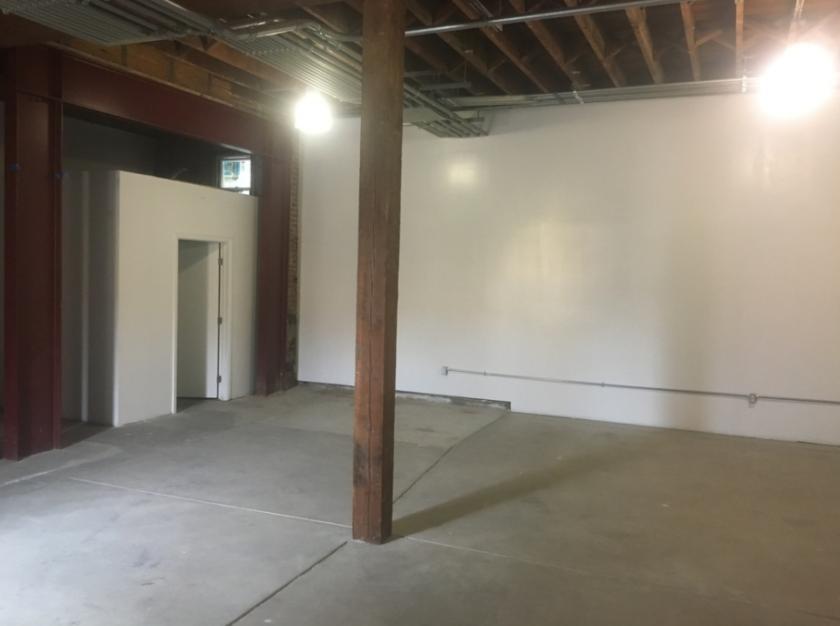
- • Small CreativeFlex space for Lease
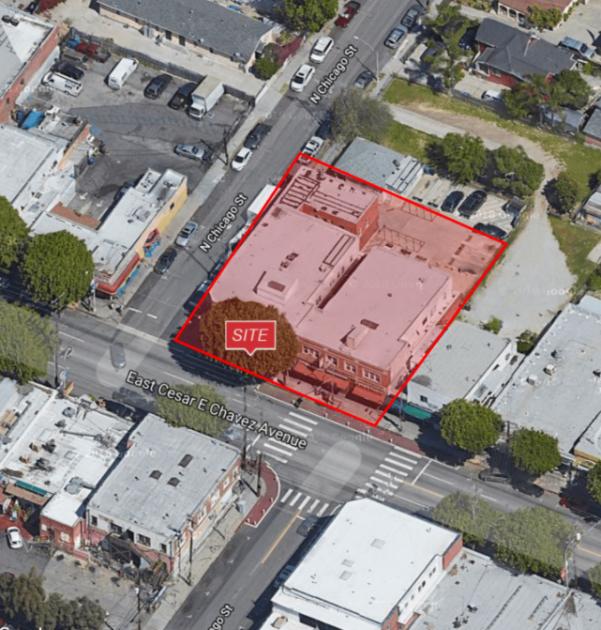
- • Close to Fwys and amenities
- • Great Boyle Heights Location
Additional Photos

Listing Agents

Tina Lamonica
O: 626-204-1523
M: 626-644-7632
tlamonica@naicapital.com
O: 626-204-1523
M: 626-644-7632
tlamonica@naicapital.com
While we strive to provide the most accurate information, all listing information, and demographic data, is provided by third-parties. As such, MyEListing will not be responsible for the accuracy of the information. It is strongly recommended that you verify all information with the listing agent, and any relevant agencies, prior to making any decisions.


