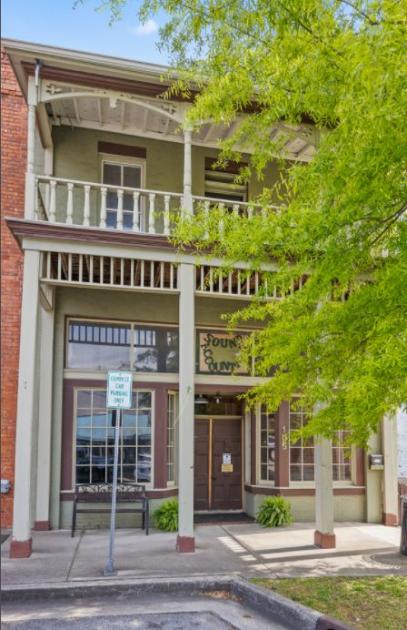
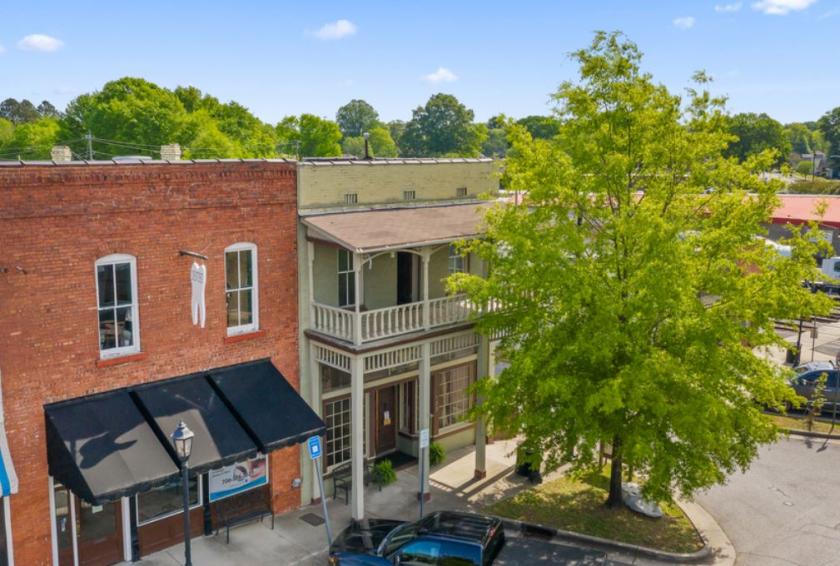
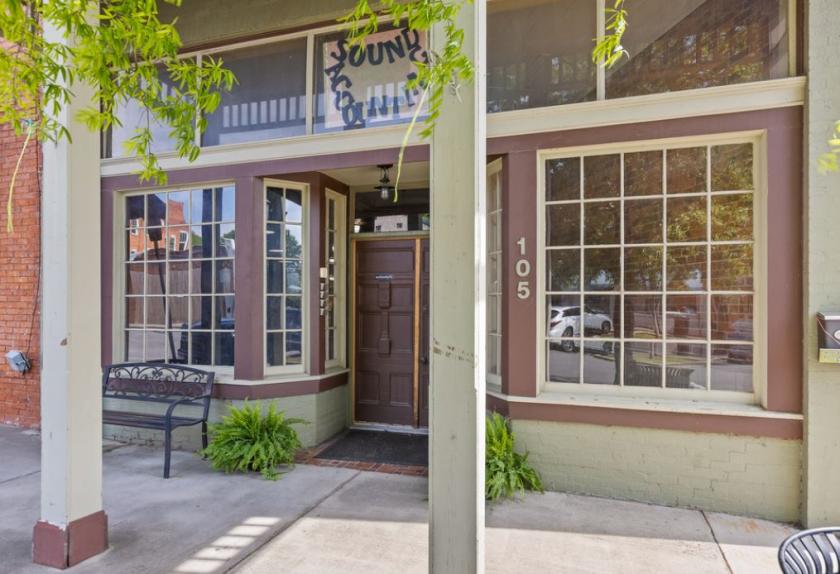
Beautifully restored historic building in downtown Chickamauga. Ideal Live / Work space or investment opportunity with 3110 sf office / flex space on street level with 1650 sf living space on second floor with two separate entrances.
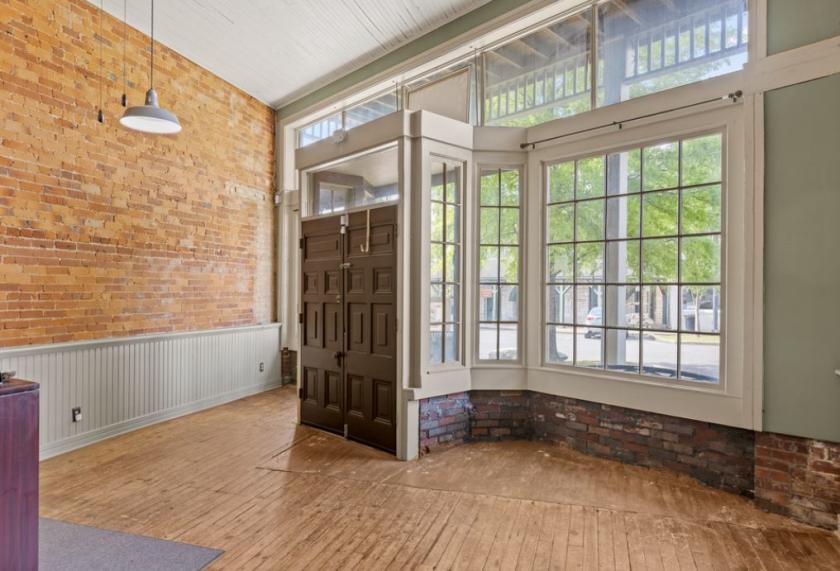
The building was built in 1889 with historic architectural details including hardwood and brick floors, brick walls, shiplap ceilings, exposed beams, vintage fireplaces, crown molding, fabulous pocket doors, built in shelving and more.
First floor office space has soaring ceilings, hardwood and brick floors, loads of natural light, fireplace, three offices, two restrooms, one ADA, "butler's pantry" and large private patio.
Second floor living space is 1650 sf. Brick and plaster walls, hardwood floors, floor to ceiling windows, fireplace, laundry, full bath, separate entrances and balcony create the perfect live / work, Airbnb, Bed & Breakfast, passive income investment.
Property has been used for restaurant, general store, architectural office space, and more.
Zoned for Gordon Lee and Chickamauga City Schools.
Located only 25 minutes from downtown Chattanooga,
Chickamauga city leaders recently approved a revitalization plan located here https://issuu.com/rsvpstudio/docs/chickamauga_final_report
Chickamauga has a large tourism industry with over 900,000 tourists visiting the Chickamauga & Chattanooga National Military Park annually. The Gordon Lee Mansion hosts numerous visitors for tours and weddings.
This property is located across the street from the newly remodeled Chickamauga Welcome Center and Depot. Tennessee Valley Railroad has trips from Chattanooga to Chickamauga every Saturday creating a wonderful tourism opportunity.