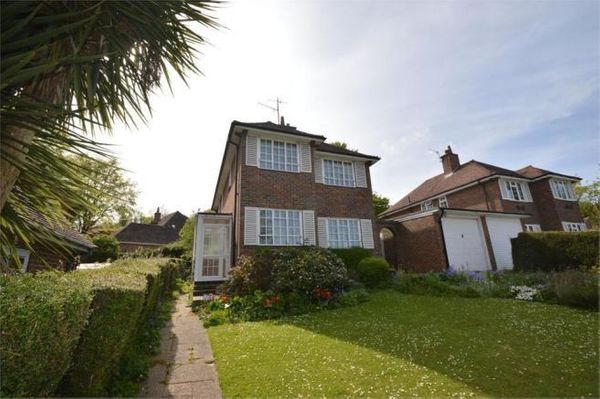
49 Upper Ratton Drive, Eastbourne is a 3 bedroom detached house spread over 1,227 square feet, making it one of the smaller properties here - it is ranked as the 6th most expensive property* in BN20 9BY, with a valuation of £496,000.
Since it last sold in September 2015 for £360,000, its value has increased by £136,000.
We expect this property to be in a reasonable condition based on its price per square foot.
At a sale price of £496k, we expect this property to be in a similar condition to the neighbouring properties in the road.
As it has a similar cost per square foot to the other properties in the road, we think it is likely to be in a reasonable decorative condition.
At a valuation of £496k this property has a cost per square foot of £404 - this is comparable with the average for properties for the area (which is currently £401).
If we valued this property using the average cost per square foot (CPSF):
The most paid for a property in Upper Ratton Drive, BN20 9BY was £565,000 in 2021.
| Date | Price | Change |
|---|---|---|
| Today's value* | £496,000 | 37.8% |
| 14 Sep 2015 | £360,000 | - |
49 Upper Ratton Drive has increased in price by £136,000 since it last sold in 2015 - this equates to a 3.8% rise each year.
At its last energy performance certificate inspection, it got a below average rating for this postcode with a score of 38 out of 100.
On a cost per square foot basis, this property is valued at 3% less than the other houses in this postcode.
This property is currently valued at £404 per square foot - the average cost per square foot for this postcode is £417.
A lower cost per square foot can indicate that the property is in a worse condition and needs more refurbishment work or that it has a smaller garden (for more information see our valuation review) of this property.
If the property was previously purchased in a bad state of repair, making home improvements could increase its sale price to £570,000.
Built between 1950 and 1966, the property has sold once over the last 29 years.
If no refurbishment work has been carried out since it was last purchased, we expect the property to sell for between £474k and £518k.
This property only has one recorded sale so it doesn't have a historic investment return or rating yet.
| Property | Valuation | ||
|---|---|---|---|
 |
51 Upper Ratton Drive, Eastbourne
3 bed | 1119 sq. ft. |
£493,000 | |
 |
49 Upper Ratton Drive, Eastbourne
3 bed | 1227 sq. ft. |
£496,000 | |
 |
47 Upper Ratton Drive, Eastbourne
3 bed | 1410 sq. ft. |
£582,000 | |
 |
52 Upper Ratton Drive, Eastbourne
4 bed | 1550 sq. ft. |
£647,000 | |
 |
53 Upper Ratton Drive, Eastbourne
3 bed | 1677 sq. ft. |
£688,000 | |
 |
54 Upper Ratton Drive, Eastbourne
4 bed |
£699,000 | |
|
55 Upper Ratton Drive, Eastbourne
|
£851,000 |
Most likely sale price: £496k

Our property valuation model calculates the latest property prices using data from trusted external sources in combination with available user-submitted information - this includes HM Land Registry which is the UK's official register for ownership of land and property in England and Wales.
The model takes into account what has sold, when and how prices have changed over time. It also brings in multiple datasources to cross reference accuracy with the latest sales data and cost per square foot benchmarks.
In addtion to this, we filter out bad data where we are able to identify it so we can improve accuracy.
If home improvements have been made or the property has been extended after it was last purchased, these improvements won't be taken into account if we don't know about them. For properties that have had home improvements made, you can get an updated valuation here.
A number of things can make a property more desirable and sell for more money per square foot than others in the area.
Some of the things that can cause a property to be worth more per square foot include:
We use multiple data sources to provide reliable property information to you.
Some of the data sources we use are:
* Excluding properties that we've been unable to calculate a valuation for.
** Excludes property transactions that occurred before 1995.
Whilst all reasonable effort is made to ensure the information in this website is current, The Move Market does not warrant the accuracy or completeness and accepts no liability for any loss or damage or costs.
Contains HM Land Registry data © Crown copyright and database right 2023. This data is licensed under the Open Government Licence v3.0.
The latest HM Land registry data covers property transactions up until 31/03/2024 - this was released on the 29/04/2024.


