
Livelihood Impacts of Forest Carbon Protection in the Context of Redd+ in Cross River State, Southeast Nigeria


1
Department of Geography, University of Sussex, Brighton BN1 9RH, UK
2
Department of Geography and Environmental Science, University of Calabar, 540271 Calabar, Nigeria
*
Author to whom correspondence should be addressed.
Sustainability 2021, 13(9), 5081; https://doi.org/10.3390/su13095081
Submission received: 16 February 2021
/
Revised: 26 April 2021
/
Accepted: 26 April 2021
/
Published: 30 April 2021
Abstract
:The rate of landcover change linked to deforestation and forest degradation in tropical environments has continued to surge despite a series of forest governance policy instruments over the years. These informed the launch of one of the most important international policies called Reducing Emission from Deforestation and Forest Degradation Plus (REDD+) to combat forest destruction. REDD+ assumes that communities will have increased assets to natural capital which will enhance their livelihood portfolio and mitigate the effects of climate variability and change across biomes. The aim of this study is to ascertain the livelihoods impacts of forest carbon protection within the context of REDD+ in Cross River State, Nigeria. Six forest communities were chosen across three agroecological zones of the State. Anchored on the Sustainable Livelihood Framework, a set of questionnaires were administered to randomly picked households. The results indicate that more than half of the respondents aligned with financial payment and more natural resources as the perceived benefits of carbon protection. More so, a multinomial logistic regression showed that income was the main factor that influenced respondent’s support for forest carbon protection. Analysis of income trends from the ‘big seven’ non-timber forest resources in the region showed increase in Gnetum africanum, Bushmeat, Irvingia gabonensis, Garcinia kola, while carpolobia spp., Randia and rattan cane revealed declining income since inception of REDD+. The recorded increase in household income was attributed to a ban in logging. It is recommended that the forest communities should be more heavily involved in the subsequent phases of the project implementation to avoid carbon leakages.
1. Introduction
The Food and Agricultural Organization of the United Nation [1] assessment report showed that 30% of world land is covered with forest while tropical and subtropical zones have 42% of their land under open and closed forest. In Africa, dry forest occupies 42% of its forested area, moist forest 33% and rainforest across 25% of the land [2,3]. Over the years, anthropogenic activities have and continue to attenuate African forest extent. The FAO [1] submitted that 3.9 million hectares of African forest was destroyed between 2010 and 2020 (compared to 3.4 million hectares between 2000 and 2010). It is also on record that between 1990 and 2015, African forest cover reduced by 3.5% [4]. In 2014, it was estimated that about 3148 flora species of Africa were at the verge of extinction [5]. Forest Resources Assessment report [1] indicated that Africa lost 3.3 million ha and 3.4 million ha of her forest cover from 1990 to 2000 and 2000 to 2010, respectively. Most of these forest cover destructions are taking place in west Africa where it is estimated that 90% of the regions natural forest has been cleared [3,6,7]. Deforestation in Nigeria has remained steadfast compared to other west African countries. The FAO [4] indicates that tree cover of the country in 1990, 2000, 2005 and 2010 was estimated to cover 17,234, 13,137, 11,089, and 9041 ha, respectively. In 2005, the Nigerian rate of deforestation of 12.5% was the highest in the world [8]. Nigeria is among the leading emitters of carbon dioxide in the world, ranked 17th in global greenhouse emission profile [9]. It is believed 87% of CO2 emissions in Nigeria comes from deforestation [10,11]. About 50% of Nigeria’s remaining rainforest is in the Cross River State. However, deforestation accounted for 5% of forest loss in the State between 2010 and 2015 [12], which was significantly ahead of the annual rate of forest cover loss of 1.32% for the region between 1991 and 2001 [13]. The increasing trend in the rate of forest loss in the region is spurred by population growth, agricultural expansion, rapid urbanization and most recently by foreign direct investment economies [3,14,15].
Drastic decreases in global as well as African tropical forest and their effects on carbon emissions resulted in the forest governance scheme called Reducing Emission from Deforestation and Forest Degradation (REDD) in 2007 [16]. REDD, as conceived by the Coalition of Rainforest Nations, led then by Papua New Guinea at the 11th Conferences of Parties (COP11) of the United Nations Framework Convention on Climate Change (UNFCCC) was created to reduce GHG emissions from forest cover loss. However, at the COP13 meeting held in Bali, Indonesia, the forest governance program was renamed REDD+. REDD+ is a unique conservation instrument that is meant to mitigate global climate change and enhance the living standards of forest-dwelling communities [17]. REDD+ was projected to reduce global greenhouse gases from land cover related anthropogenic activities in 2030 by 17 and 25% [18,19]. However, the mode of its implementation will determine the outcomes particularly in Nigeria where there are multifaceted and intertwined competing realities; poverty, a surging population, weak institutions, corruption, widespread legacies of natural resource cursed nations [20].
Cross River State is a pilot state for the implementation of the UNREDD+ project in Nigeria due to its sizeable tropical forest cover. Nigeria began the process of securing approval for the implementation of REDD+ project in 2008. The paperwork with the UNREDD+ was concluded in 2010 [7]. It should be noted that the CRS before the advent of UN-REDD+ was deeply involved in conservation projects and policies. The presence of many local and international consortiums of biodiversity conservation like CIDA, ODA, United Purpose, WWF, NGOOCE among others is a testament to the value attached to protecting the environment of the region. In addition to securing the remaining tropical forest in Nigeria, Adeniyi [21] believed the dwindling revenue base of the CRS was another motivation that propelled the need to key into REDD+. As a sign of its readiness, the government under Senator Liyel Imoke declared a halt on wood harvesting especially by multinational companies operating in the State (e.g., WEMCO) in 2008 [3]. The suspension of logging of any form particularly as a source of revenue to the government and the public has remained effective to this day. In addition to the highlighted factors, the government of the Federal Republic of Nigeria (FRN), was motivated to kick-start REDD+ in Cross River State on the understanding that the structures on ground, lessons learnt from government and non-government agencies in the State (CRS), will be useful in the subsequent implementations of REDD+ in other regions of the country [22]. To understand how REDD+ has fared in Cross River State, it is imperative that its impacts on the poor be explained. Sustainable Livelihood Framework provides a yardstick for assessing the effects of REDD+ on the poor.
The Sustainable Livelihood Framework (SLF)
Sustainable Livelihood Framework (SLF) according to United Nation Development Programme [22] involves all the skills, resources and practices used by individuals or a community to earn a living at any particular time. A key tenet of sustainable rural development is the need for development interventions to create an enabling environment that will embolden the capacity of intended local beneficiaries to sustained project outcomes at all times [23]. Chambers and Conway [23] further opined that the SLF is used to sustain livelihoods under varying scenarios; periods of stability, stress and shock and maintaining its natural potentials. In the last four decades, the precepts of SLF have been applied in analyzing the livelihood impacts of forest governance interventions in the tropics [24]. The framework identifies five types of livelihood capital; physical, social, financial, human and natural, needed to better the wellbeing of mankind [25,26]. However, Odero [27] had argued for the inclusion of ‘information’ among the assets. These livelihood assets are influenced by transformative dynamics expressed in the laws, policies, cultures and institutional processes used to manage them [26,28,29,30]. How these instruments are used to manage a project determines it outcomes. Scoones [28] (p. 3) rightly pointed out that ‘of particular interest in this framework are the institutional processes (embedded in a matrix of formal and informal institutions and organizations) which mediate the ability to carry out such strategies and achieve (or not) such outcomes’. Lawson [31] opined that the process should be ‘inclusive and non-threatening’ to the livelihood of the people. Lawson [31] also submitted that the usual top-down approach that undermined the intended beneficiaries will spur livelihood sustainability challenges. These challenges may threaten project outcomes as contemplated by the framework. The SLF template of expected project outcomes includes more income, improved wellbeing, reduced vulnerability, improved food security, inclusive participation in forest governance and more sustainable use of natural resources [32,33]. These go to attest that forest governance interventions are meant to put strategies in place that will lead to increased access to livelihood sources [33,34].
Putting the SLF within REDD+ context, the authors hinge the analysis on how institutional processes, in terms of forest communities’ awareness and participation in REDD+ project, influence their access to forest resources and income flow patterns with the inception of REDD+ in the sampled forest communities. Mucahid et al. [35] buttressed the link between forest governance processes and livelihood outcomes when they argued that institutional processes have significant impacts on livelihood developments patterns with Free, Prior and Informed Consent (FPIC) providing the gateway of interpreting the nature of the interface and the resultant outcomes. The aim of FPIC is to ensure that the local communities have control over how REDD+ is implemented especially when it comes to benefit sharing. For instance, Stern [19] had argued that REDD can not only achieve emission reduction but encourage socioeconomic development if wholesome participation of the local communities is consummated. The participation of forest-dependent communities (FDC) in REDD+ activities is one of the many ways of creating social safeguards. These safeguards are codified within the United Nations Declarations on the Rights of Indigenous People [36].
In brevity, FPIC in the lens of the SLF is a right-based (substantive or procedural rights) approach that boosts social and environmental benefits ensuing from the proper implementation of REDD+ activities. The SLF was used to understand how the implementation of REDD+ so far involved the forest-dependent communities and the impacts on selected sustainable livelihood outcomes. In view of these, the aim of this study is to determine the livelihood impacts of REDD+ projects on forest-dependent communities of Cross River State, Nigeria. To achieve this, this study was guided by the following objectives: (1) To examine the influence of forest-dependent communities’ (FDCs) socioeconomic variables on awareness and participation in REDD+ processes. (2) To assess the impacts of REDD+ intervention on FDCs livelihood portfolio. (3) To investigate the effects of FDCs socioeconomic status on the choice of perceived carbon stocks measurements benefits.
2. Materials and Methods
2.1. Study Area
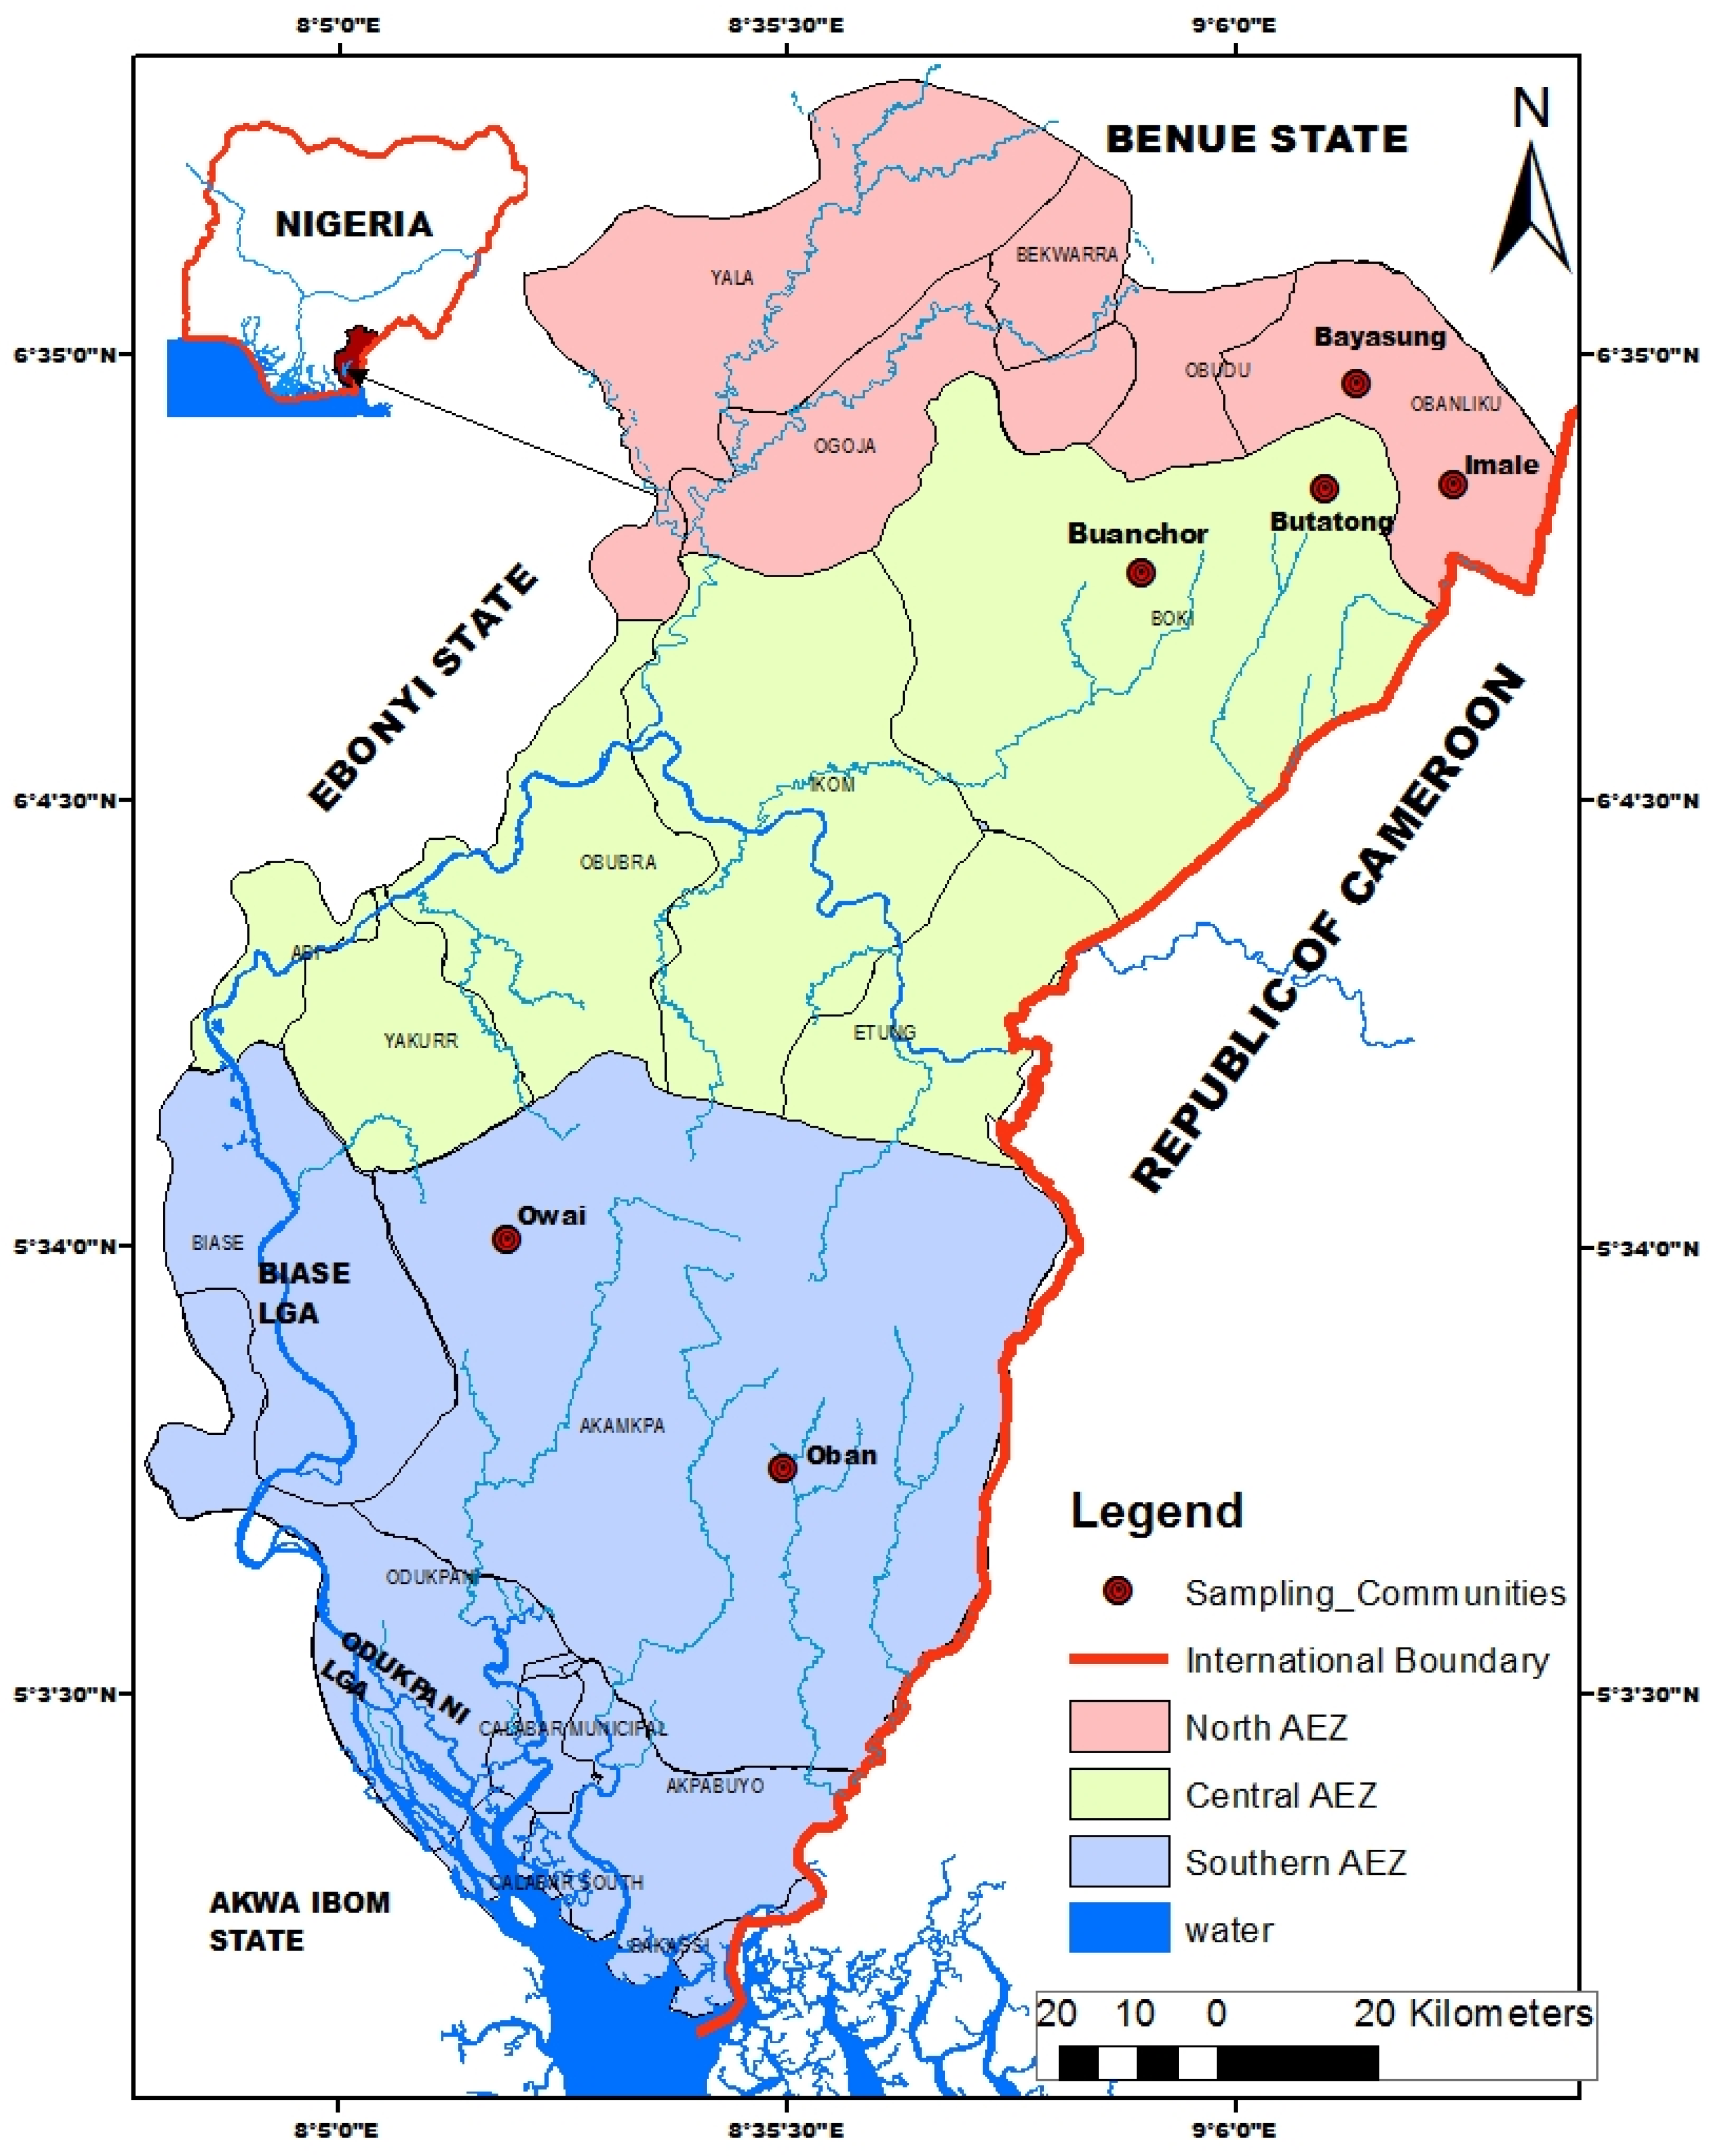
The study area is the Cross River State in southeast Nigeria, with an area of 20,156 km2 (Figure 1) with three agroecological zones (AEZ). The area covers an elevational range from 1800 m (5936 ft.) in the extreme north to 103 m above sea level in the southern part of the State [37]. It shares boundaries with Benue State in the north, Akwa Ibom, Ebonyi and Abia states in the west and the Atlantic Ocean in the south. Cross River State has five different vegetation types; mangrove, swamp, tropical rainforest which dominate the southern and central parts of the region, montane vegetation and savanna woodlands are dominant in the northern portion of the study area [37]. It is recognized as one of the biological hotspots in the world [38] and two locations—Oban and Okwongwu—are marked out as conservation spots. The Oban Division (OD) covers an area of 2800 km2 with 1568 identified plant species while the Okwongwu Division (OkD) has a land area of 800 km2 with 1545 plant species located in the area [39]. Analysis of extent of land cover types in the region shows mangrove occupy 480 km2, swamps 520 km2, tropical rainforest 729 km2, plantations 460 km2, other forest 216 km2 and other land uses 12,300 km2 [40].
Rainfall in the Cross River State is bimodal with varying durations of sessions across the three agroecological zones. The rainfall gradient is largely influenced by relief and nearness to coastal environment. The southern agroecological zone (SAZ) has a monsoon tropical climate with an annual mean rainfall of 3500 mm which sometimes peaked at 4000 mm around the Oban Massif [41]. The climate of the region is within the Tropical Monsoon (Am) classification scheme of Koppen [42]. The mean annual air temperature of the zone averages around 27 °C with little variation throughout the year, and with humidity between 78% and 91% [43]. In the central agroecological zone (CAZ), mean annual rainfall varies from 2300 to 3000 mm. The zone records mean annual air temperature ranges from 26.9 to 30 °C and humidity of the zone in most parts of the year is about 68% [41]. In the northern agroecological zone (NAZ), savanna ecosystems are common with mean annual rainfall of 1120 mm and temperature ranges from 15 to 30 °C [44]. The zone has two climate seasons; the rainy season which lasts for about eight months and the harmattan that lasts for about four months. In the montane ecoregion of Obanliku Mountains within the NAZ, climatic conditions are markedly different from other parts of the region. Air temperature has a mean annual range of 4 to 10 °C.
2.2. Data Collection
The data for the study were gathered between March and September 2019 using structured interviews and in depth content analysis. Before the administration of the questionnaire, one community liaison was picked from each of the sampled communities and trained on the process of data collection in the field. The questionnaire was personally administered to forest-dependent communities in Cross River States using a multistage sampling frame [45]. The sampling plan involved the stratification of the study area into the three agroecological zones [46]; SAZ, CAZ and NAZ. The second stage was the purposive selection of two forest-dependent communities per agroecological zone. The communities were selected either because there are REDD+ communities or they share boundary with REDD+ communities. Finally, random selections of household for the administration of the instruments of data collection was carried out [45,47].
The total households per sampled community was generated with the help of the community liaisons and 10% of the total household was randomly picked for the administration of the questionnaire [48] as shown in Table 1. To obtain questionnaire responses on the day, the researchers waited in the village while it was being filled without interference. Respondents were informed that they were free to withdraw their consent to be interviewed at any period of the interview in line with the research ethics of the University of Sussex, United Kingdom. Respondents were informed that any information provided is confidential, with no information disclosed leading to the identification of any individual either by the researcher or by any other party.
2.3. Analysis of Interview Data
The data collected from the administered questionnaire were coded and entered in SPSS (Statistical Package for Social Sciences) Version 22.0. Thereafter, the data were cleaned, and the variables named and categorized for analysis. Both descriptive and inferential statistical tools were used to analyze the data. The descriptive tools used included tables and percentages, while the inferential techniques employed were stepwise multiple regression and logistic regression. Multiple regression analysis was used to understand the influence of household income, education, household size and gender on the awareness of REDD+. The test was used to identify the main factor(s) that contribute to the respondents’ awareness of REDD+ as well as show the extent of explanation accounted by the identified predictor.
In addition, logistic regression analysis was used in the study to predict the influence of a set of predictors on a single criterion variable. Specifically, it was employed to examine the influence of education, income, household size and gender on carbon measurement benefits. The logistic model output via the Odd Ratio enabled us to identify the main socioeconomic variables that contributed most to carbon measurement benefits.
3. Results
3.1. Socioeconomic Profile of Respondents
Disaggregating the sampled respondents by sex showed that 48.1% were male while 51.9% were female across the three zones. More so, 19.7% of the respondents claimed to have First School Leaving Certificate while 41.2%, 34.3% and 4.8% of the sampled population said the highest level of education they have is Senior School Certificate (SSC), National Diploma or its equivalent (ND or NCE), and First Degrees and above, respectively. In terms of household size, 17.3% of the sampled households have a household size of between 1 and 3, while 46.4% have a household size of about 4–6 people and 36.3% have a household size of 7 and above. Analysis of the responses further revealed that 5 (1.7%) claimed to have an estimated monthly income of GBP 25. More so, 13.1% of the sampled population claimed to have mean monthly income of GBP 56 while 54 and 31.1% of the interviewed households said their monthly income ranges from GBP 81 to 92. On the main income source, 4.2% of the respondents said the earnings were from salary. In addition, 9% of those interviewed got their income from salary and sales of farm produce while 67.5% said farm produce is their main source of income. Analysis of the data further indicates that 18.3% of the respondents said farm produce sales and petty businesses constitutes their income sources and 1.0% claimed salary, farm produce and petty trading forms their major source of monthly revenue. On main source of household energy, many of the respondents rely on fuelwood as energy source (248 or 85.8%) while only 1.4% of those interviewed said gas is their main source of household energy.
3.2. REDD+ Project Design and Community Participation
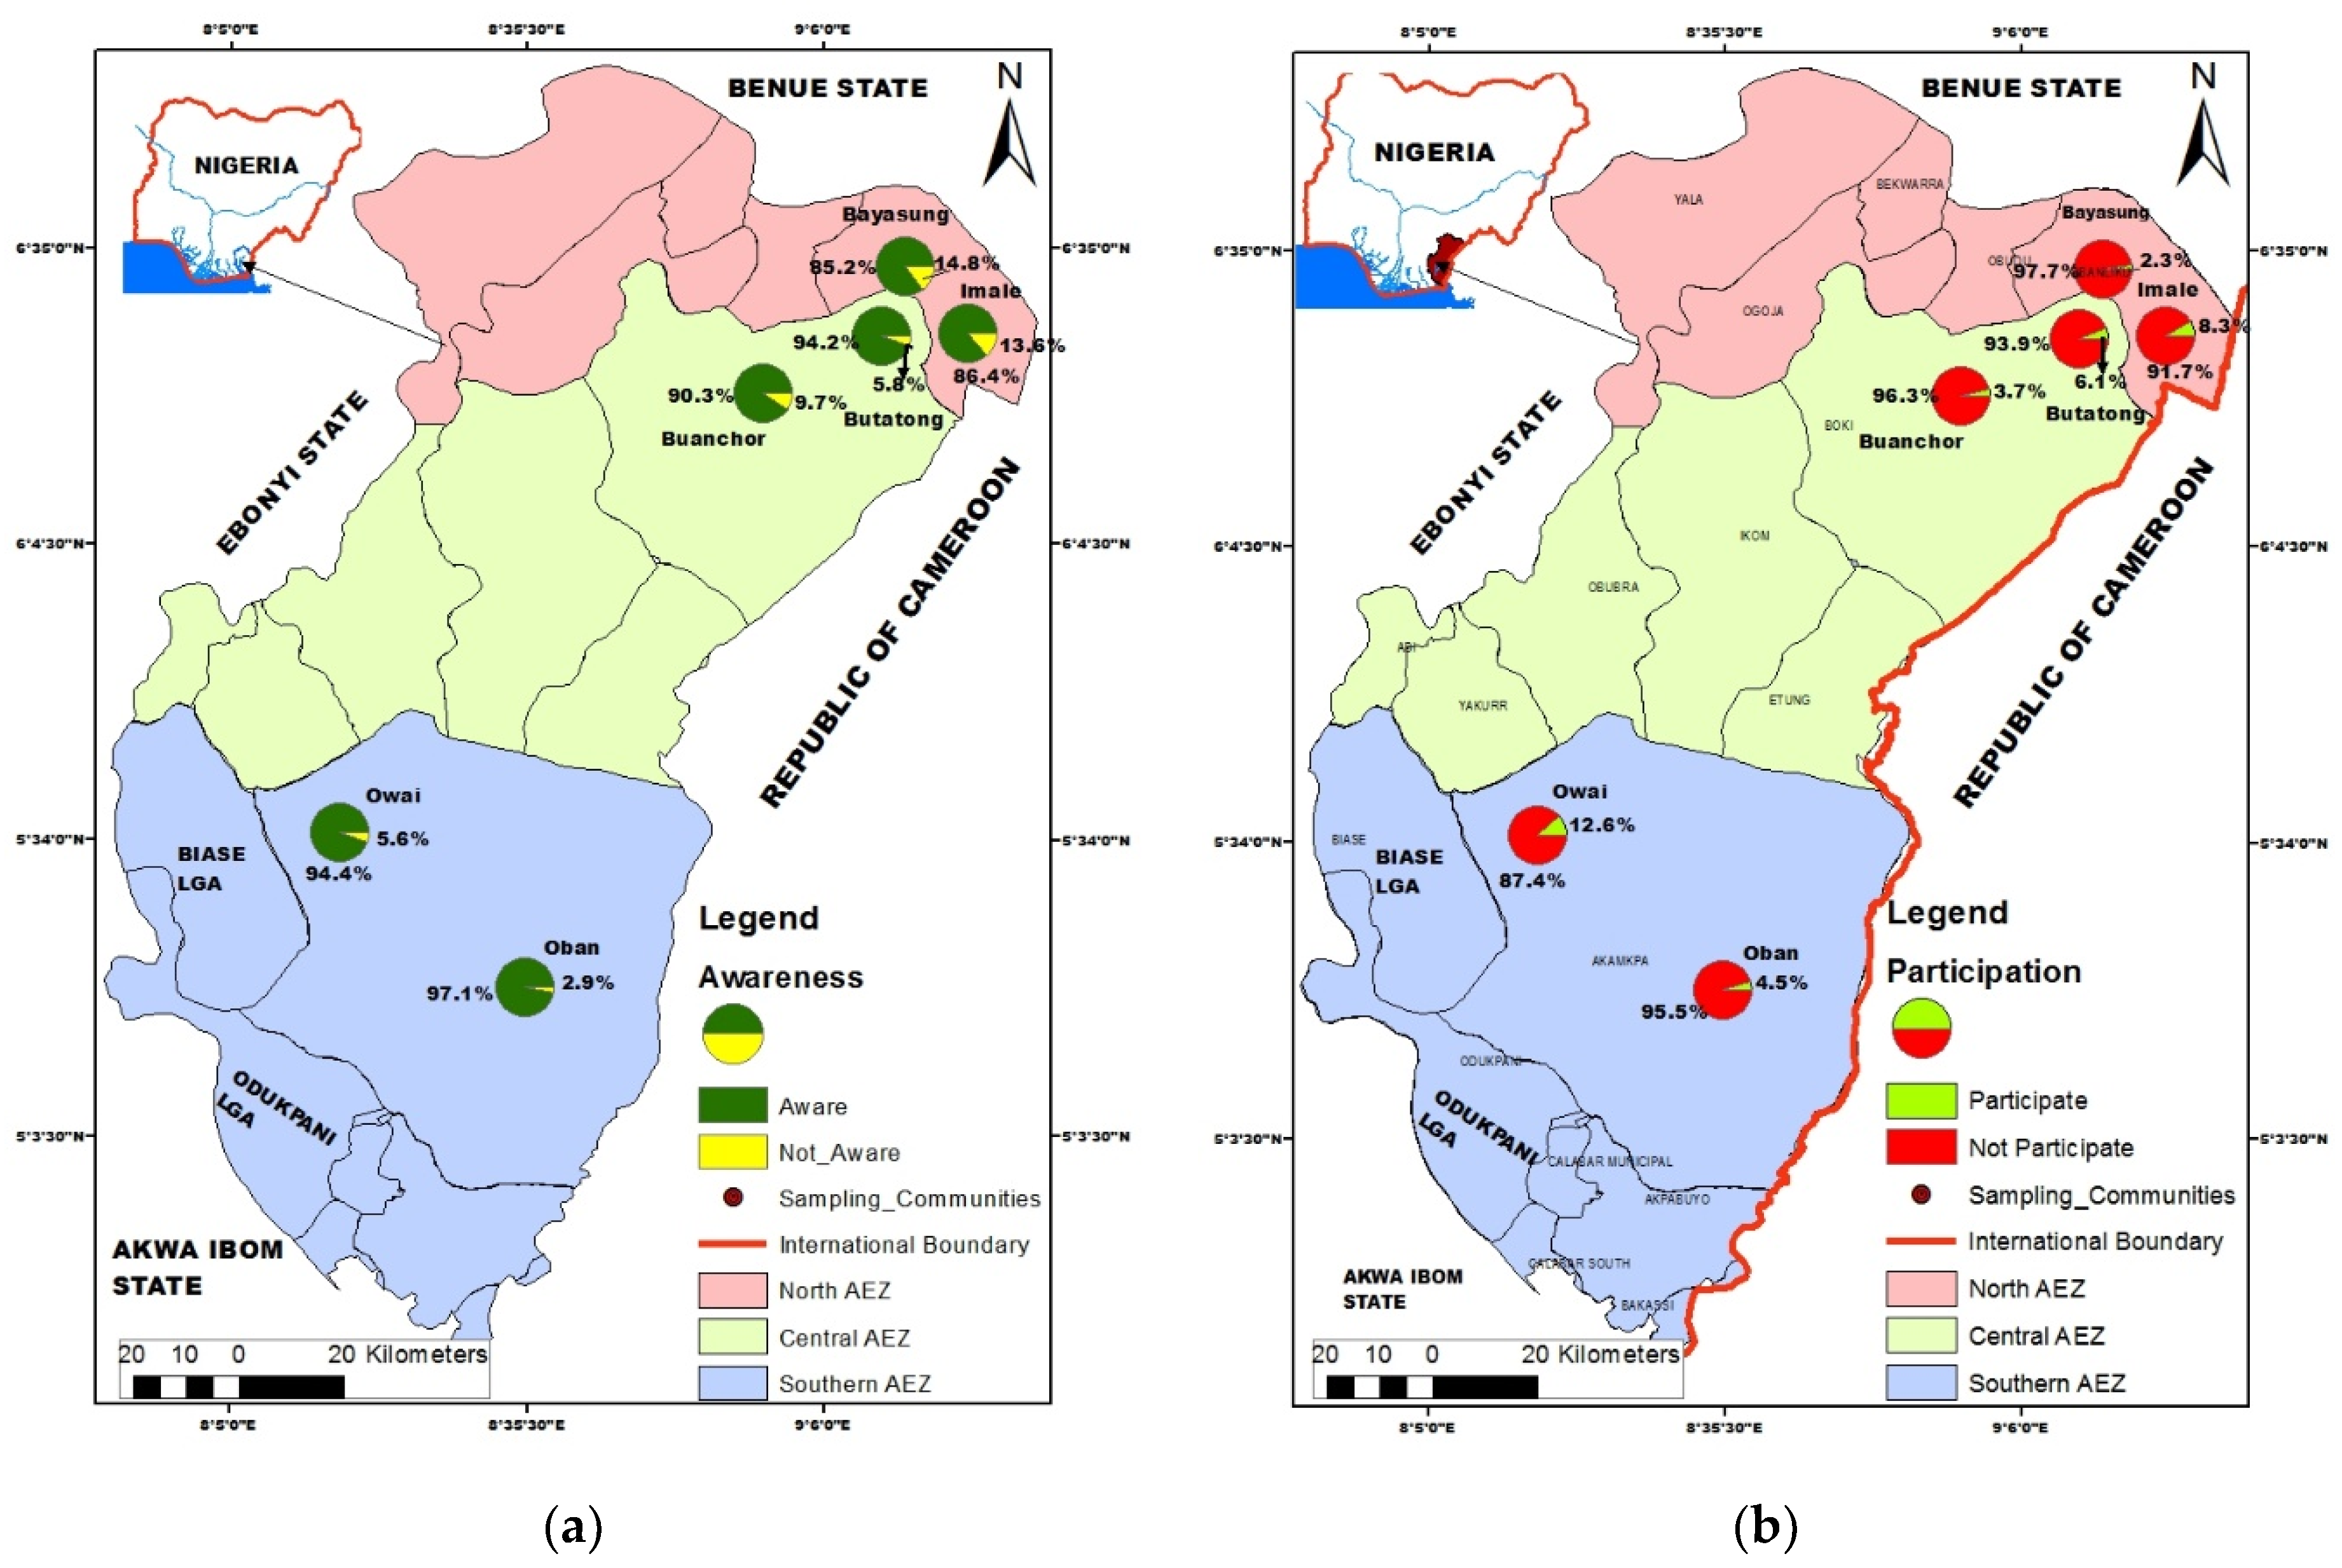
Community awareness and participation of REDD+ processes are shown in Figure 2a,b. It revealed that most of the sampled population in Beyasung, Imale, Buanchor, Butatong, Uwai and Oban (85.2%, 86.4%, 90.3%, 94.2%, 94.4% and 97.1%, respectively) claimed to be aware of REDD+ in their community. The figure also showed that only 14.8%, 13.6%, 9.7%, 5.8%, 5.6% and 2.9% of respondents in the respective sampled communities said they were not aware of the project. It is imperative to note that the high level of awareness arises by the restriction imposed on the community with regards to harvesting from the forest. However, the awareness level did correlate with the extent of participation in the decision and implementation process of REDD+ in the community. For instance, Figure 2b indicates that 97.7%, 91.7%, 93.9%, 96.3%, 87.4% and 95.5%, respectively, in Beyasung, Imale, Butatong, Buachor, Uwai and Oban of the respondents did not participate in any kind of REDD+ activity in the communities.
Although Nigeria UNREDD+ readily recognized the need for holistic consultation and participation of forest-dependent communities in her Readiness Preparation Proposal (R-PP) document [49], realities on the ground are not congruent with the preparatory document. In the R-PP, it was expressly stated that ‘attention will be given to all …especially women, youths, children and people with disabilities’ [50] (p. 9). This level of community involvement as seen here is within the tokenistic consultation frame of Armstein [51] cited in [32]. Here, government officials invited few chiefs and passed on the directives from His Excellency the Governor on what REDD+ project intends to do in the community. The participants thereafter were asked to sign papers as indication of attendance and transportation subsidies released to them. That was the end of it, as every other thing about REDD+ according to the key informant interview was heard from the media or family members.
To enhance our understanding of the rationale behind the low-level of participation of community members on REDD+ activities, the socioeconomic variables and level of awareness were subjected to inferential analysis. Results obtained (Table 2) show that household income, education, household size and gender were significant (F = 10.135, p < 0.05), and responsible for 12.5% of the variation in awareness of REDD+. The result further showed that household income, education, household size and gender had positive regression coefficients indicating increase in REDD+ awareness correlates with the increase in household income, education, household size and gender.
The results in Table 2 also showed that among the independent variables, household income (t = 2.767, p < 0.05) and education (t = 4.859, p < 0.05) exerted significant influence on REDD+ awareness, while household size and gender did not. The unstandardized regression coefficient also showed that education and household income had higher weights (0.246 and 0.196, respectively). It therefore means that education followed by household income are principal factors that influence REDD+ awareness.
3.3. Impacts of REDD Intervention on Forest Communities’ Livelihoods
The implementation of UN-REDD+ project is believed to have varying effects on the livelihood of tropical forest communities. The respondents’ general views on the areas of REDD+ intervention in the sampled communities is presented in Table 3. From the table, it can be observed that 93.4% of the sampled population said REDD+ did not provide any infrastructure while 5.2% and 1.4% of the respondents said REDD+ project trained them on domestication of non-timber forest products (NTFPs) and supported small and medium scale (SMS) business ventures, respectively. None of the sampled households were trained on forest governance or carbon accounting methods.
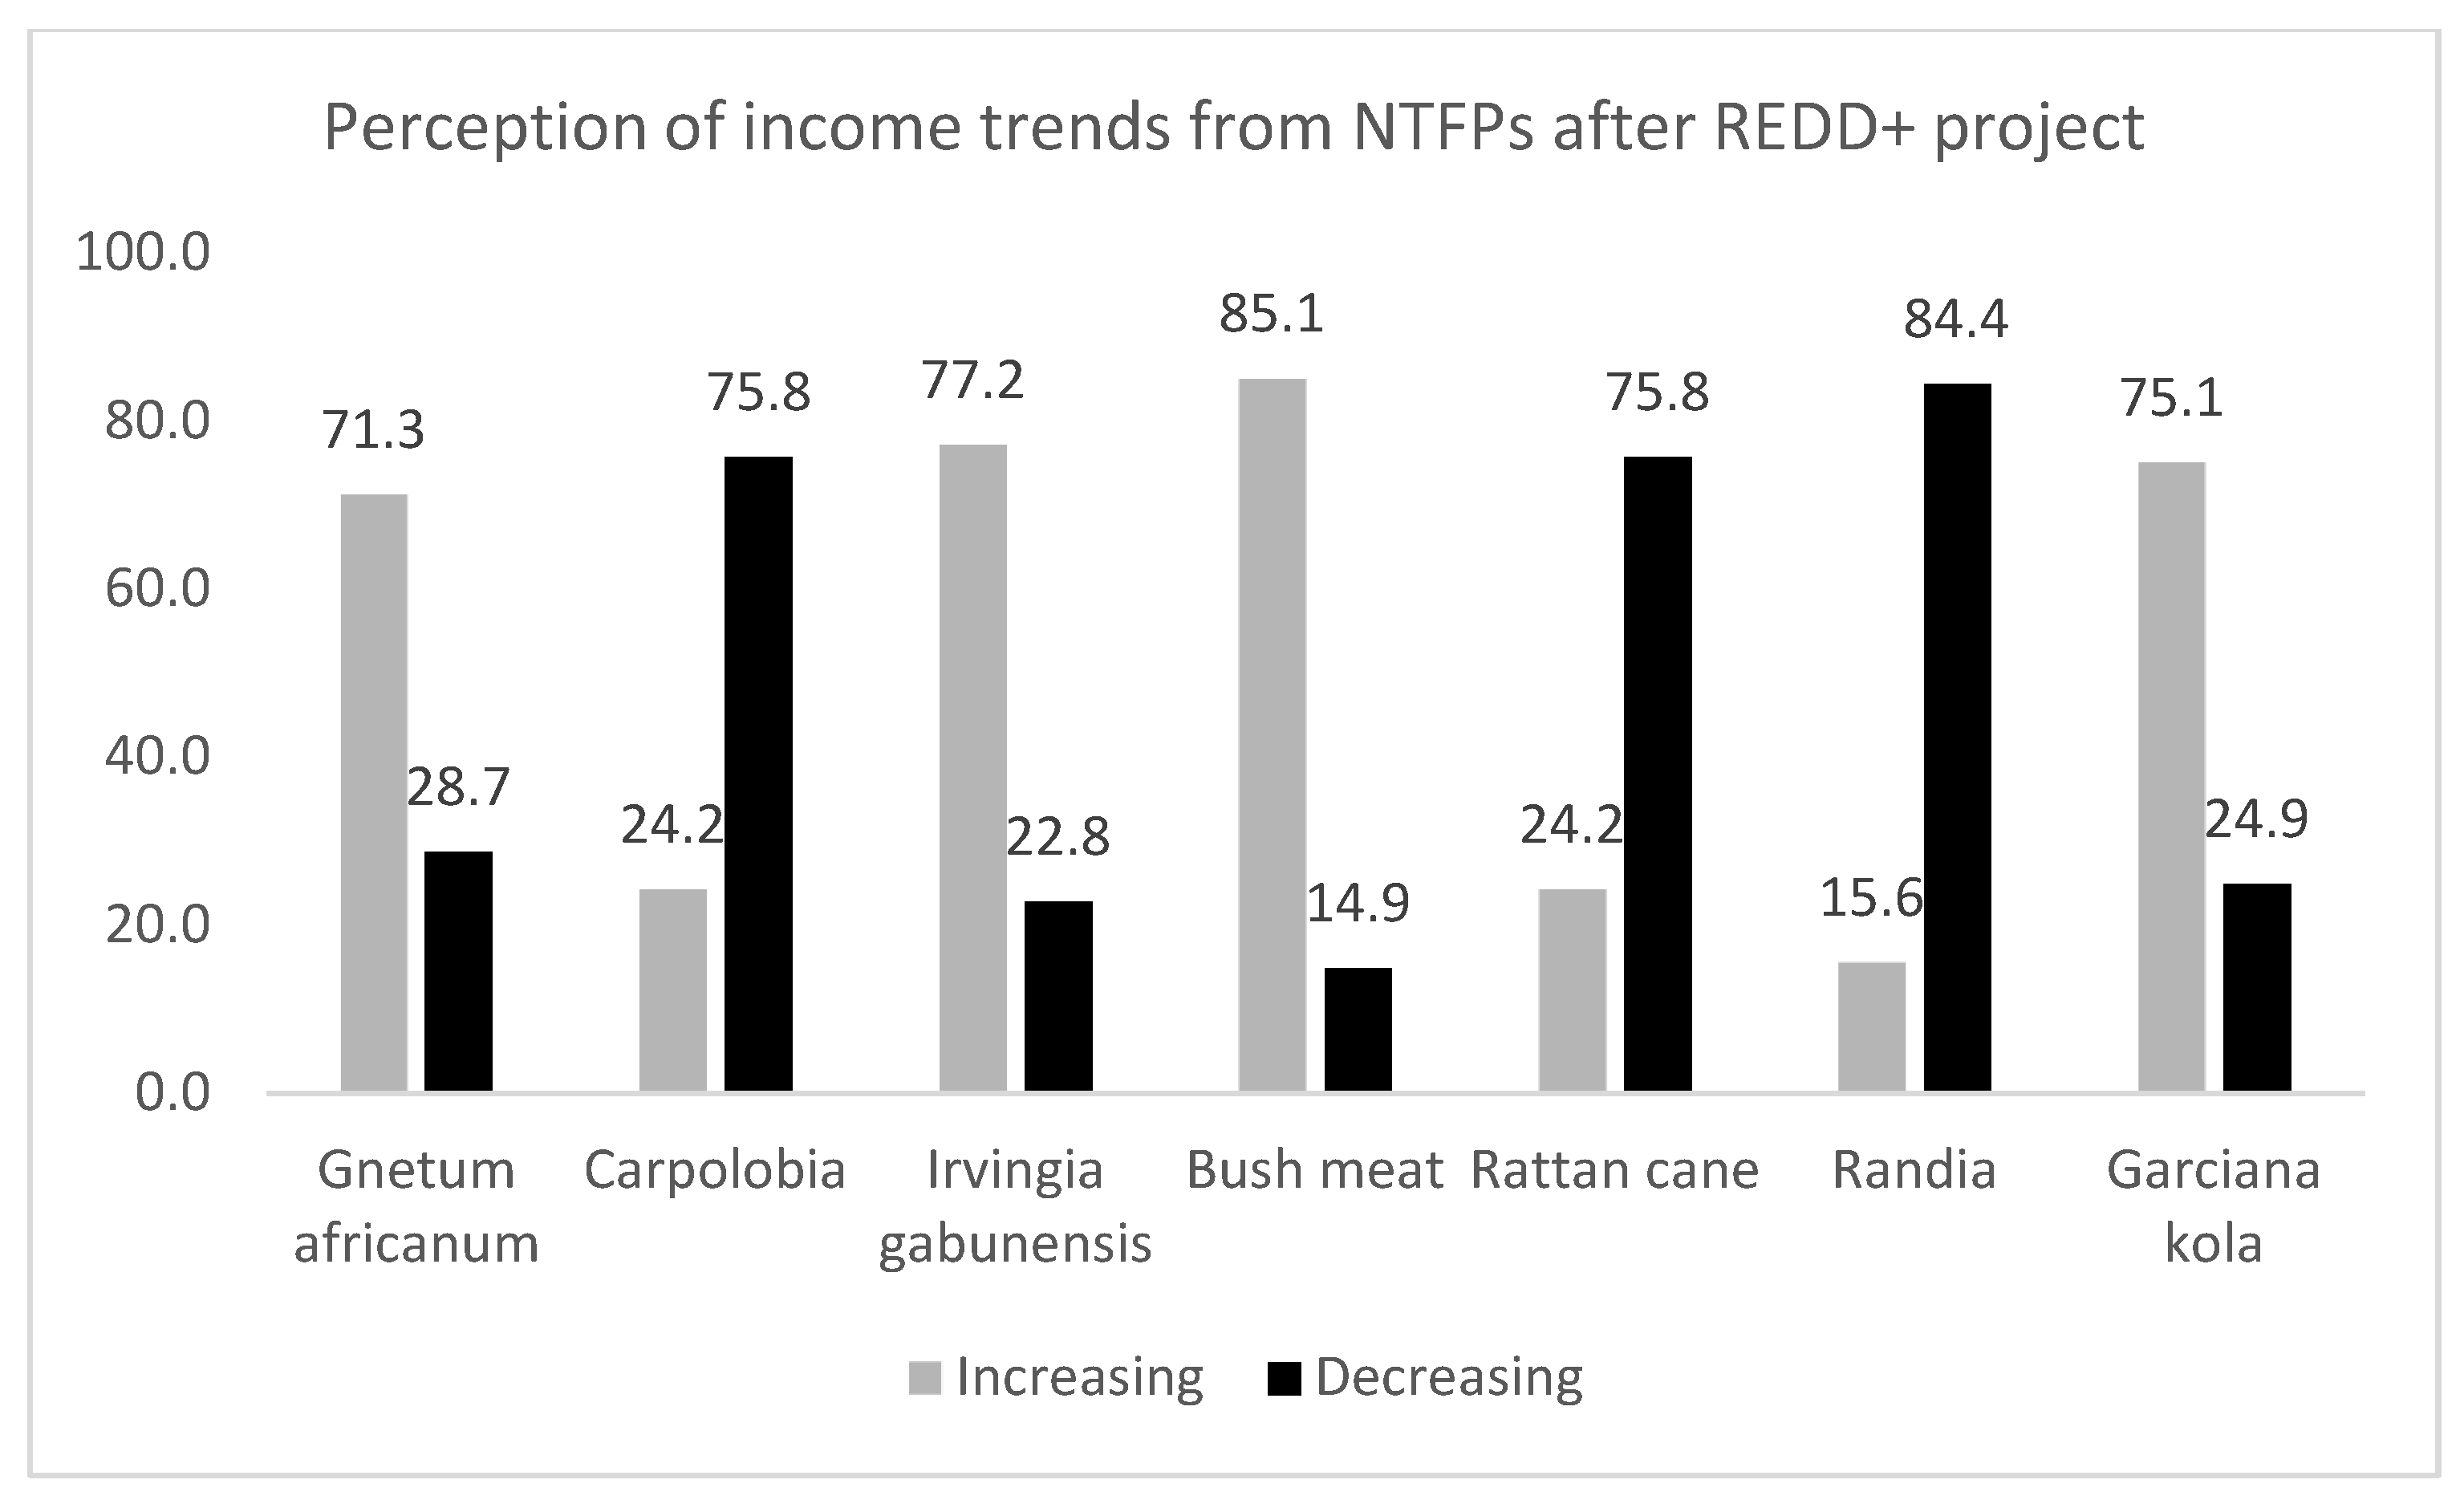
More so, Figure 3 shows the perception of the respondents on the effects of REDD+ intervention on income stream from non-timber forest products once community forest protection has begun. Respondents were asked if their income flow associated with the ‘Big Seven’ NTFPs (Gnetum africanum, Carpolobia, Irvingia gabunensis, Bush meat, Rattan, Randia and Garciana kola) changed after the advent of REDD+ projection on the bases of increase or decrease in income status. These NTFPs are the most economically valued in the Cross River State [21]. Out of 289 respondents sampled across the six communities, 71.3% said their income from Gnetum africanum (Afang) remained high even after REDD+ started while 28.7% said low income from the sales of the NTFPs became common. However, with the introduction of REDD+, 75.8% of the respondents said income from the sales of Carpolobia sp. (cattle stick) dropped while only 24.2% of those sampled agreed that money from Carpolobia has increased.
On the trend of income from the sales of Irvengia gabunensis (Bush mango), 77.2% of the sampled population agreed that there has been an increase in income from these valued NTFPs while 22.8% said otherwise. The figure also indicates that income from bushmeat after REDD+ was higher compared to when REDD+ was not introduced in the community as revealed by 85.1% of the respondents. On income from Rattan cane (Cane robe), 24.2% of the sampled population believed they experienced increase in income after REDD+ while the majority of the respondents said they have recorded less income since the inception of REDD+ project in their community. In addition, 84.4% accepted to have also gained less income from Randia (chewing stick) while about 15% claimed increased in income recorded. On the respondent’s perception on income trends from the sales of Garciana kola, it was observed that 75.1% of those sampled said it increased compared to 24.9% who submitted on the contrary.
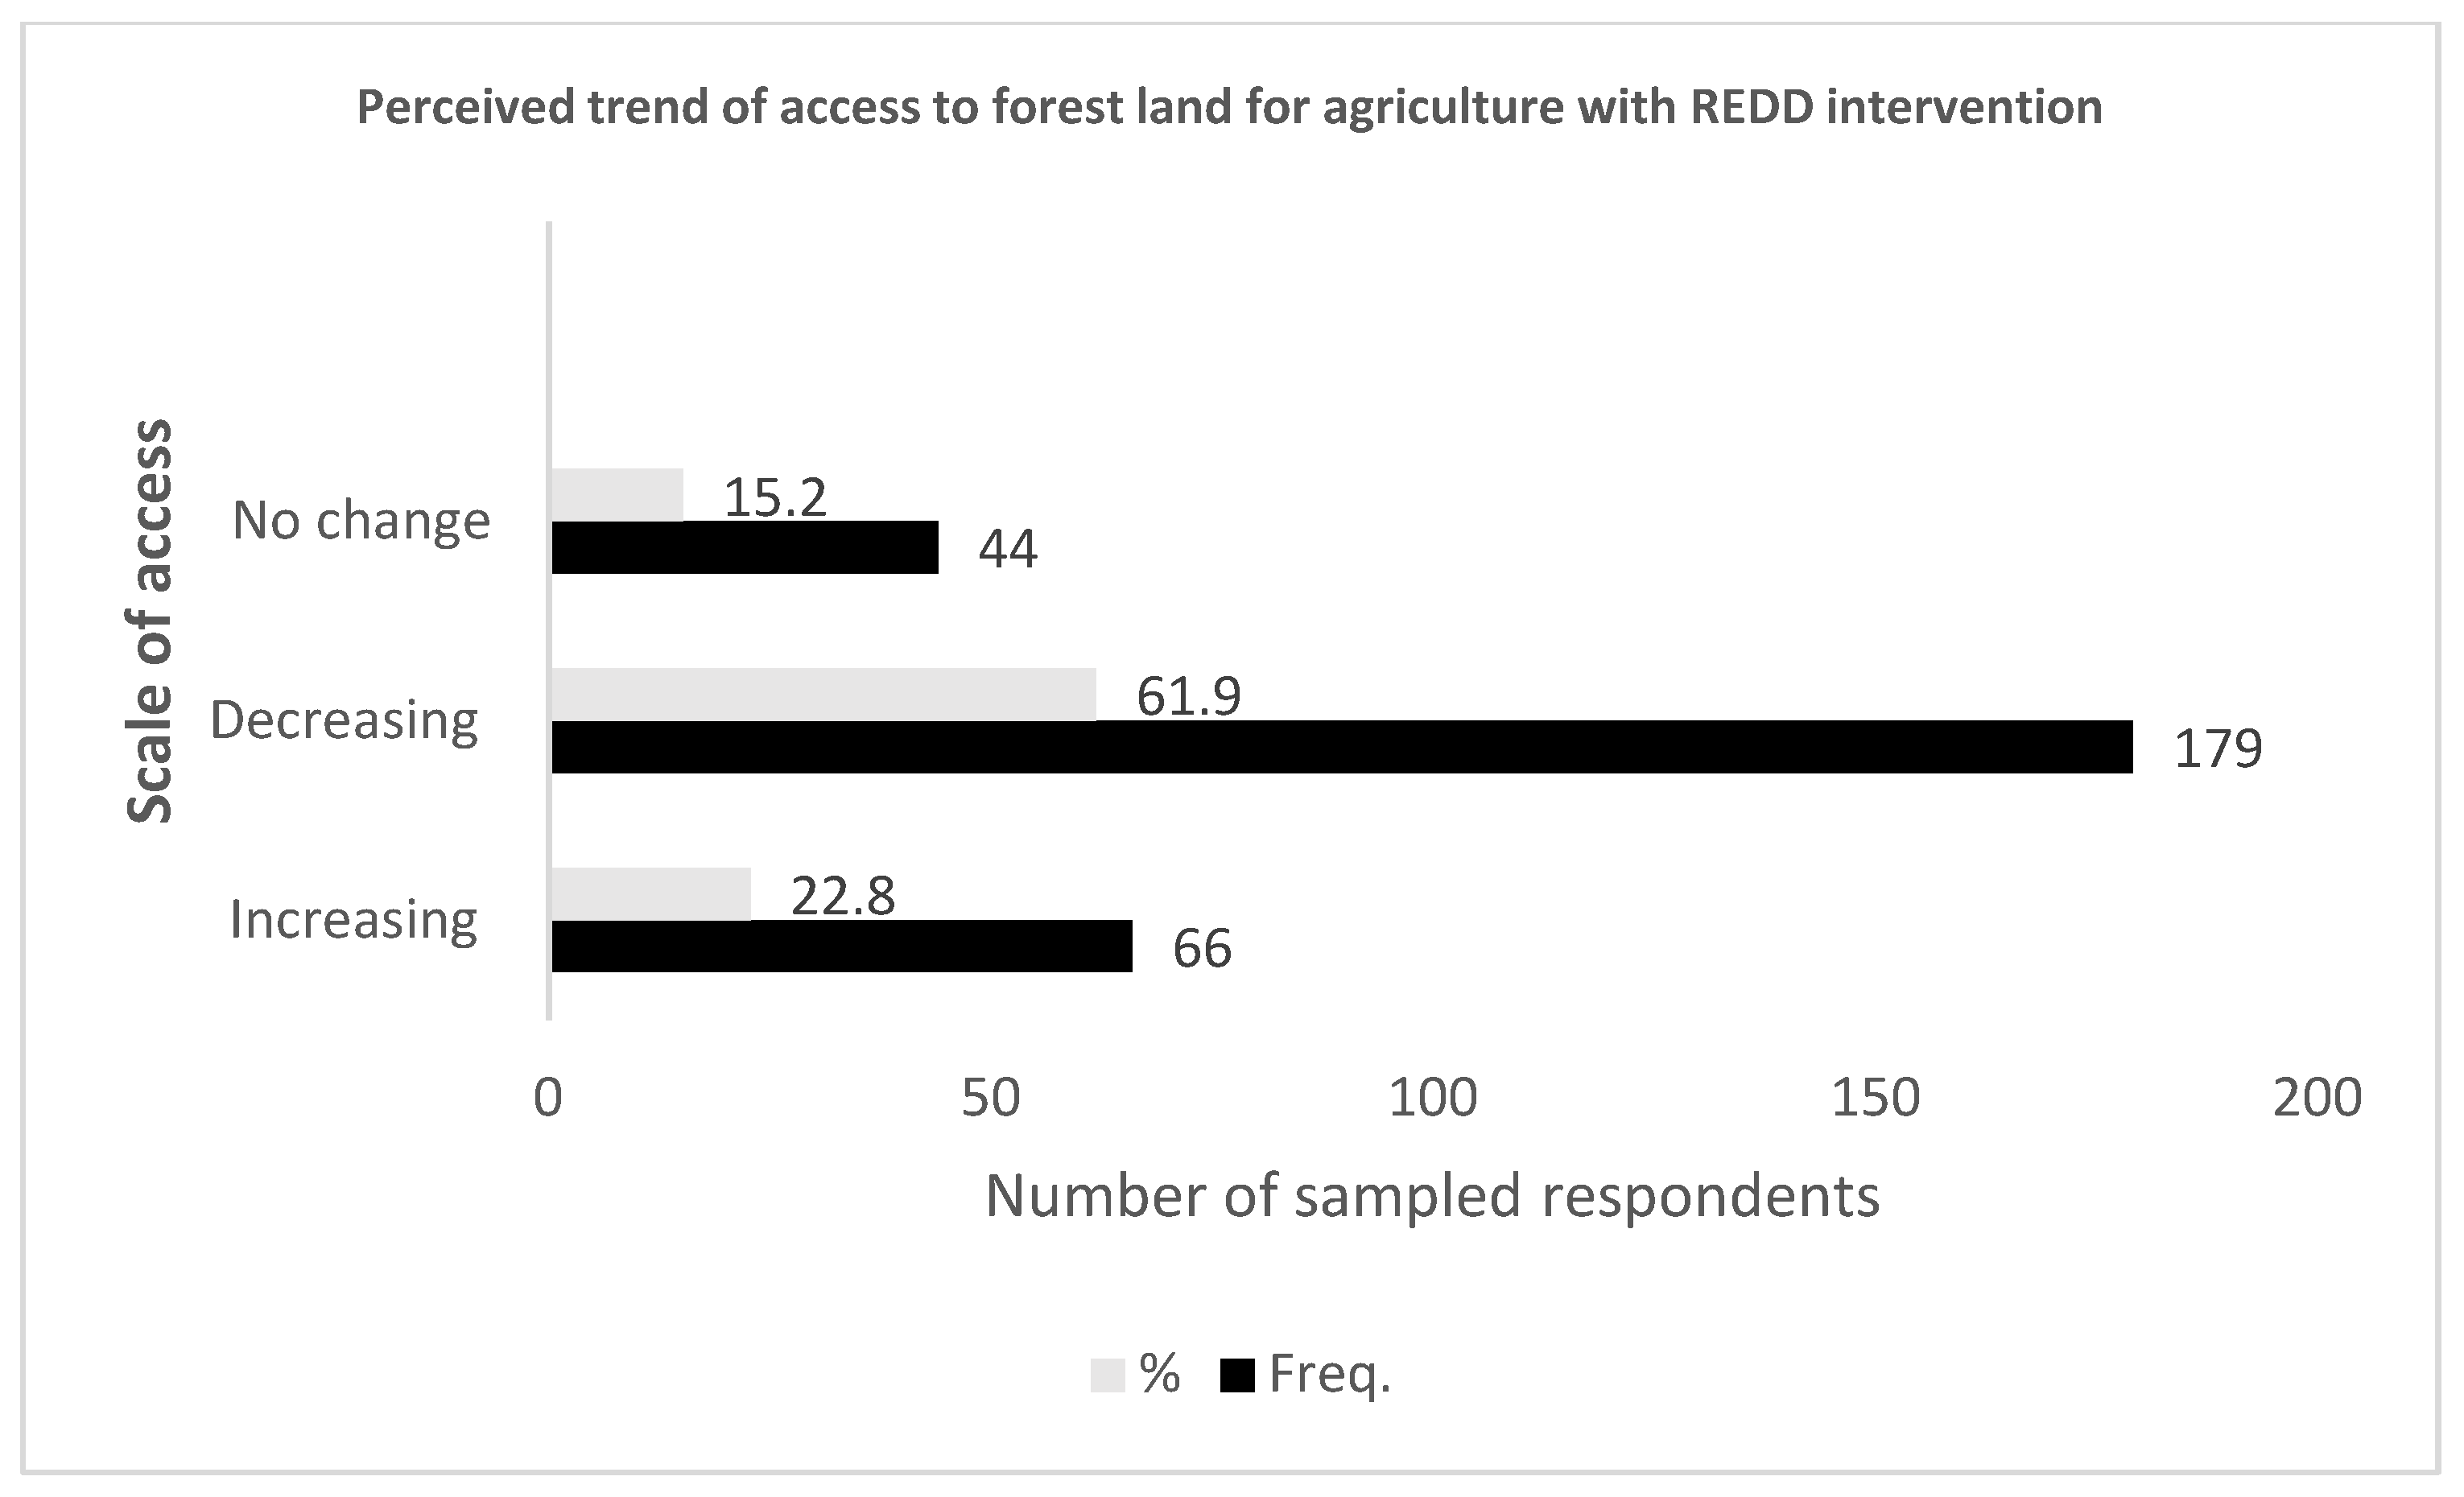
With the advent of REDD+ project in study area, farmers’ access to forest land for farming of staple food and cash crops showed a decreasing trend. Analysis of Figure 4 revealed that most of the sampled head of household claimed they had reduced access to forest land for agriculture unlike when REDD+ project has not been introduced in the community. It also showed that 44 (15.2%) of those sampled said they experienced no change while 66 (22.8%) of the sampled population support the fact that access to forest land has since increased with the launch of REDD+ project in the community.
The distribution of the perceived benefits of carbon measurements and protection in the context of REDD+ is presented in Table 4. The table shows that 34.9% of the sampled population said the protection of forest carbon will lead to payments for environmental services in the community. This was followed by the belief that REDD+ will lead to more natural resources for community members (34.3%). Table 4 also revealed that 20.4% of the respondents expect increases in community employment with the efficient implementation of REDD+ while 10.4% expect multiple economic returns from forest carbon protection in the community.
To understand how carbon benefits were influenced by the respondent’s socioeconomic variables, multinomial logistic regressions were used with results shown in Table 5. The result showed significance using a multivariate logistic regression (X2 = 15.365, p < 0.05) when using socioeconomic information on education, income, household size and gender. Yet, only two of the four variables contained significant coefficients; education (X2 = 6.438, p < 0.05) and income (X2 = 4.946, p < 0.05), while gender and household size did not contribute significantly to the prediction of carbon measurement benefits (p > 0.05). To recognize variables that contribute considerably to the prediction of carbon measurement benefits, the odds ratio (OR) was used. The result in Table 5 indicates that income had an odds ratio greater than 1 implying that it is more probable to predict carbon measurement benefits.
4. Discussions
This paper investigates how forest carbon measurement and protection for REDD+ have influenced livelihood systems of forest-dependent communities in Nigeria. The discussion is based on the study objectives; community awareness and participation in REDD+, livelihood impacts of REDD+ and respondents’ socioeconomic variables in relation to their perception of carbon measurement benefits. The discussion is further guided by the sustainable livelihood outcomes.
4.1. Local Community Awareness and Participation in REDD+ Activities
It is imperative to note that effective participation of community members in natural resources governance processes, either directly or by dependable representation, brings about shared benefits. More so, participation of local communities in forest carbon projects diminishes likely opposition to the project and will most probably enhance the success chances [52,53]. In addition, the holistic involvement of forest-dependent communities in forest carbon activities may likely lead to enhancements in livelihood portfolios, sustain biodiversity and mitigate the effects of climate change [54]. However, this study indicates that many of the sampled respondents were aware of REDD+ programs in their community but only a handful of the sampled population agreed to have participated in any form of REDD+ activities in the community. This contradicts a similar study carried out by Appiah et al. [55] in Ghana where 99% of the sampled respondents (155 respondents) claimed not to be aware of REDD+ project implementation in their community. However, the noninvolvement of the locals in REDD projects in tropical Africa is corroborated in earlier studies by Agrawal et al. [56], Lawlor et al. [32], and Awono et al. [57]. These authors stated that forest governance instruments implemented by outsiders continue to neglect local communities in conservation policy designs and implementations. Awono et al. [57] (p. 77) specifically concluded that ‘local communities are often marginalized in policy making processes, lacking official recognition of property rights to land’. The lack of inclusion of most of the locals in REDD+ project life cycle is a total deviation from the standards as recommended by Ostrom et al. [58], United Nations and World Bank [24]. This negates the Sustainable Development Framework where participation in decisions and involvement in natural resources governance is emphasized as the foundation for better livelihood outcomes.
The non-participation of forest communities in REDD+ activities leads to many challenges. Some of which included denying forest communities’ access to forest resources, destabilization of cultural institutions, centralization of forest governance, distortions of forest tenure systems, among others [31,35,59,60]. These intended and unintended distortions were aimed at maintaining land sparing regimes [61]. These styles of forest governance led to reduced income among forest-dependent communities [33] and exacerbated poor land use practices with attendant consequences of more carbon emissions [32].
Content analysis of Cross River State REDD+ documents showed that the processes of the project design fall short of the protocols of Voluntary Carbon Standards (VCS) and Climate Community and Biodiversity (CCB) Standards [62]. There was no evidence to show that the project was certified by either VCS or CCB. This further confirms that the locals may have been neglected at the designing stages of the project [63]. The lack of FDCs participation in REDD+ project lifecycle and loose FPIC by UN-Nigeria REDD+ in the Cross River region may threaten the livelihood of FDCs. The low participation of the locals in the implementation of REDD+ project in Cross River State has several implications; prominent among all is the negation of the people’s livelihood portfolios. This is contrary to the letter and spirit of Article 12.2 of the Kyoto Protocol which expressly advised carbon protection project technical teams to ensure the sustainable development of communities that may likely be impacted by its policies [64,65].
The non-involvement or low engagement of forest-dependent communities in forest carbon governance in tropical countries of the world has been linked to some socioeconomic variables like income status, educational qualifications, gender, among others Apipoonyanon et al. [66], Atele et al. [67]. The results in this study revealed that awareness and participation in REDD+ project activities are influenced by respondent’s household income, education, household size, and gender (F = 10.135 p < 0.05). The result further showed that household income and education had significant positive regression coefficients indicating that increase in REDD+ awareness and participation correlates with the increase in household income and education. Although, the brunt of poverty-environment trap is felt by farmers who may not have formal education, they are often neglected when it comes to decisions that directly affect them [32]. In addition, farmers or households with high income are often involved in community decisions [35] and hence their awareness of REDD+ programmes. The implication of this is that a unit increase in the income status by way of payment for environmental services of the residents may likely stimulate their interest and participation in forest carbon protection activities. This is in line with an earlier study by Tien et al. [54] where it was stated that payment for environmental services can on average help local people increase their household income as well as get their attention on forest governance programs.
4.2. Livelihood Impacts of REDD+
The aim of REDD+ is to ensure forest carbon protection and enhance social safeguards [35]. These are some of REDD+’s pathways to carbon emissions reduction [26,67]. The non-carbon (social safeguards) aspects of REDD+ are meant to cushion any negative outcomes that may arise from the protection of forest carbon [16]. Despite the interest of REDD+ on social safeguard outcomes, the implementation of REDD+ in Cross River State was observed to negate some principles common with non-carbon components of the project. The sampled population opined that no community member was trained on forest governance/carbon accounting. Extant studies [26,47,68] showed that participatory forest governance is a conservation paradigm that has boosted forest biodiversity and forest carbon in tropical regions. Training of FDCs on forest governance thematic areas like participatory forest carbon assessment, participatory monitoring, reporting and verification (MRV), among others, has been identified elsewhere as veritable strategies that aided in compensated reduction [69]. This is apt in Cross River State where three tiers of forest management regimes abound; national parks, forest reserves and community forests [38]. The failure to train the FDCs in MRV (a vital step to receiving carbon credit) simply implies that government will be the sole appropriator of the carbon credits. This could possibly reinforce and sustain governance issues [70] that have bedeviled the nation for too long.
In Cross River State like other parts of sub-Saharan Africa, non-timber forest products (NTFPs) hold high economic value to the rural population especially from Gnetume africanum, Bushmeat, Irvingia gabonensis, Rattan cane (Laccosperma and Eremospatha spp.), Garcinia kola, Randia and Carpolobia spp. These ‘big seven’ NTFPs constitute the economic buffers as they makes up 60% of households’ income especially among the most vulnerable groups (women and children) [71] and the poorest households in the study area [45,72]. Estimated annual income derived from the sales of Afang, rattan cane, carpolobia, garciana, randia and irvengia gabunensis in CRS is put conservatively at GBP 104,512, GBP 29,579.00, GBP 23,663.190, GBP 177,473.93, and GBP 244,528.625, respectively, while bush meat is believed to generate GBP 808,660.865 per year in the region [72]. However, these figures are simple estimates as there is no possible way of tracking all the harvested and sold NTFPs in the region [3].
From the study, income status of the respondents after the advent of REDD+ projects showed increases except incomes from Carpolobia spp., Randia and Rattan cane which showed decreases in income trends. The overall increase in income from NTFPs in the study area (for four out of seven NTFPs) could be attributed to the moratorium on logging put in place in the early stage of REDD+ by the state government since 2008 [73]. This according to Langat [74] can be attributed to the fact that the elites in the forest-dependent communities extract capital intensive forest products like logging of trees, establish large scale cocoa, banana, plantain farms, among others, and have access to markets. Income from these sources is used to support the regular income stream (emoluments from salaries). Lower-income members of the community do not have capital intensive and large-scale agricultural enterprises neither do they have a steady source of income outside the natural capital. Additionally, most importantly they do not also have access to capital intensive markets as they are content with subsistence-related livelihoods [72].
Therefore, REDD+ initiatives to ban logging has resulted in four out of seven NTFPs becoming more valuable for the communities within the Cross River State. Extant studies confirmed that forest cover removal correlates with reduction in NTFPs availability and consequently in income [75,76]. Ngansop et al. [77] also observed that the destruction of NTFP habitat by capital driven logging or commercial farming in southeast Cameroon was a major cause of income reduction of forest communities over the years. Conversely, when the habitat is good for non-timber forest products like Gnetum africanum which according to Ali et al. [78] is ‘a shade-loving climbing gymnosperm liana’ it grows into abundance within a short period of time. This partly explains the increased income experienced by farmers in the study communities from sales of Gnetum africanum. However, the decline in income from Carpolobia spp., Rattan cane and Randia after REDD+ project initiation may not be unconnected to the preferred harvesting method. Carpolobia spp. is often harvested at the tender age denying them opportunity to be sustained through re-shooting or seedling [72,79]. This approach leads to massive destruction of its ecology and importantly too, it is largely sought for by non-indigenes (Hausa and Fulani’s) in collusion with the locals. The control of the influx of these categories of buyers into the forest communities by Green Police (Forest Guard) in the region may also account for the fall in income from carpolobia spp. More so, the reduction in income from Rattan cane (Laccosperma robustum and L. secundiflorum and Eremospatha macrocarpa) may be linked to the control of the influx of buyers and its low economic rating by households in the study area. It is estimated that rattan cane makes up 0.8% of family income in Cross River State [72,80]. The low rating of rattan cane was confirmed during focus group discussions with selected NTFPs collectors. Most of those in the discussion session said choices of what NTFPs to harvest and sell is often determined by its economic value. Recently, most of the harvested rattan cane is for domestic usage. It is imperative to note that NTFPs with high economic value in the study area is highly favored by most of the households. For instance, Irvingia gabonensis is one of those NTFPs with high economic rating hence it constitutes about 50% of households’ yearly income in the study area and the adjoining Cameroon border communities [72,81].
More so, one major livelihood sector that is negatively affected by REDD+ project implementation in the study area is access to forest lands for food and cash crops cultivation. More than half of the sampled population claimed that their farm sizes have reduced because government officials banned the opening of the forest for agricultural activities. Most often, where the local communities succeed in establishing farmlands deep in the forest, they are later destroyed by government officials upon discovery. The respondents complained about the effects of government restrictions and other hampering activities on food security and their overall wellbeing. The repercussion of restricted access to farmland may deepen the worsening poverty situation as over 65% of the people of the study area rely on farming and forest related resources for subsistence [72]. Considering that part of the outlined objectives of the forest carbon protection scheme is to strengthen the forest community rights of access and sustainable utilization of natural capital [82] as climate change mitigative measures, it is therefore imperative that Nigeria-REDD+ should incorporate social safeguards while implementing its components in the region.
4.3. Influence of Forest-Dependent Communities’ Socioeconomic Status on Perceived Carbon Measurement Benefits
Analysis of the socioeconomic variables that determine the choice of carbon protection benefits showed that education, income, household size, and gender can predict carbon measurement (as the logistic regression was significant; X2 = 15.365, p < 0.05) but only education and income were the statistically significant predictors of the motivation for forest biomass protection in the study area. Subjecting the results to further statistical analysis revealed that only income had odds ratio of one (1), implying the expected income from non-timber harvesting and sales is a factor that encourages community members’ participation and are willing to support REDD+ in the State. This is expected as household income is one of the attractions for forest-dependent communities to adopt REDD+ programs which in the long-run help to increase household sources of income. This result and assertion lend support to the study of Druckman and Jackson [83] where they saw income as one of the key drivers of carbon emissions and rebound effect—which is a way of reducing carbon footprints. In another study, Liu, Zhang and Liu [84] found changes in household income associated with income inequality to significantly impact on household carbon emissions. The logistic regression result therefore identifies household income as a principal factor that influences carbon protection benefits.
More so, results from the expected benefits of carbon measurements and protection revealed that the majority of those interviewed have the expectation of receiving payments for carbon protection as well as more natural resources within their reach. This was followed by employment and multiplier economic benefits. It is imperative to note that FDCs expectations are within the mandate of REDD+ which, among others, includes cash payment for carbon protection in biomass, equitable benefits sharing, enhancement of livelihood of local and indigenous communities and importantly carbon ownership [35]. Nigeria has expressed her commitment to these precepts in the Readiness Plan Idea Note (R-PIN) submitted to the Forest Carbon Partnership Facility in 2013 [49]. However, the loose interface of UN-Nigeria REDD+ team with a select opinion leaders (Chiefs) of FDCs, ban of NTFPs collection, restriction of access to forest land for food and cash crops farming and the presence of Green Police without concrete supports or alternative means of livelihoods to the people, negates the spirit and letter of the R-PIN. These are disturbing facts especially in Nigeria like most African governments where a history of financial dishonesty in investment portfolio that will benefit the poor has remained fertile. The negation of FDCs in the design and implementation of REDD+ processes will not permit the people to own and benefit from the proceeds of forest carbon payments. Page and Okeke [85] detailed how billions of Naira meant for small and medium scale schemes for the poor in Nigeria were stolen by government officials between 2014 and 2018. Such financial malfeasance is likely to be sustained if FDCs are not carried along in all the steps of REDD+ processes.
5. Conclusions and Policy Recommendations
The researchers investigated the governance dynamics of REDD+ project in relation to the livelihood benefits of carbon measurements and protection in six purposively sampled forest-dependent communities in Cross River State, southeast Nigeria. The results from the study indicated that most of the sampled respondents were aware of REDD+ project. However, they were not involved in the design and implementation processes. The study further observed that only the community chiefs were invited to REDD+ meetings. However, their participation in the meeting was restricted to listening to the planned activities of government with regards to REDD+ project. In addition, the study used the logit regression model to establish the socioeconomic variables that determined sampled households’ awareness and participation in REDD+ activities. The result showed that income, education, household size and gender had significant influence on the level of awareness and participation in the REDD+ project in the study area.
More so, assessment of the livelihood impacts of carbon protection indicated that income status of the respondents increased after the REDD+ project commenced. This was noted in the income flow from Gnetume africanum, Bushmeat, Irvingia gabonensis and Garcinia sp. while Rattan cane (Laccosperma and Eremospatha spp.), Carpolobia spp. and Randia indicated a decline in income. The decline of income from Carpolobia spp. Rattan cane and Randia is most likely attributed to the harvesting system; which involves large scale destruction of the stems and the increased surveillance of forest in the region. The results of logit regression analysis of the socioeconomic determinants of forest carbon measurements and protection benefits revealed that income, household size, and gender of the sampled population were able to predict forest carbon measurement benefits. Specifically, education and income were significant predictors of carbon measurement and protection benefits in the study area.
Another fundamental sector that is negatively impacted by the implementation of REDD+ in the area is access to farmlands for food and cash crops cultivation. Almost every respondent complained about the reduction in access to land for farming. The government in recognition of the effects of deforestation and forest degradation and in keeping with requirements to secure funding from international donor agencies set up a security outfit (Green Sheriff) to guard the forest. The enforcement of forest protection is reducing the rate at which closed forest is opened for farming. However, those who succeed in cultivating in the forest may not harvest the crops as they are likely to be destroyed by the forest guards. This has affected the food and cash crops turnover rate in the study area since the inception of REDD+.
In view of the results, it is recommended that subsequent activities of REDD+ in the study area should be conducted in ways that meet international best practices as outlined by the sponsoring agencies. This will mean the holistic involvement of the population that may be directly or indirectly impacted by REDD+ project activities. The activities of REDD project should be seen to be creating opportunities that will enhance the standard of living of the people rather than accentuating poverty. REDD+ handlers should create avenues that increase the population access to food security, increase income from farm and off farm activities and at the same time protect the environment. In addition, such programs should promote good health of the people, as well as guarantee the sustainability of all the social safeguards.
It is imperative to note that forest carbon protection is one major strategy to reverse the strong hold of socioeconomic exclusion associated with poverty-environment trap in Nigeria and other tropical economics. With the increased access to livelihood assets, the living standard of the people could be enhanced. However, for such programs to achieve social inclusion, all stakeholders should be carried along from project design through implementation to evaluation. It is therefore apposite to counsel that achieving emission reduction is strongly correlated with community’s participation, provision of adequate safeguards and sustainability of the project. As this study rightly pointed out, tokenistic models have failed in the protection of forest lands in the region, therefore, the locals need to be in the driver’s seat. This way the people will own the processes and ensure its success. This approach, as has been established elsewhere, will ensure biodiversity stability, forest carbon increase and most importantly guarantee sustainable utilization of forest resources for livelihoods. In addition, forest-dependent communities should be trained on forest carbon estimation and periodic evaluation. This way, the people can determine biomass trends and take the full advantage of the benefits of REDD+. After the training, the Cross River State Forestry Commission may henceforth conduct participatory forest carbon measurement, reporting and validation (MRV).
Author Contributions
In this article, the conceptualization, data collection, analysis, draft preparation and funding acquisition was carried out by U.A.A. Significant contributions were received from Y.W., F.B. and A.S.A. in the areas of validation, review, editing, visualization, formal data analysis and overall supervision. The coauthors have agreed to be personally accountable to the content of the article as well as to its publication. All authors have read and agreed to the published version of the manuscript.
Funding
The authors wish to thank Tertiary Education Trust Fund (TETFUND) Nigeria for providing the required funds through the Federal College of Education, Obudu for this research. However, the content of this work remains the sole responsibility of the authors.
Institutional Review Board Statement
This study was conducted based on the School of Social Sciences & Arts C-REC (Certificate of approval reference N0. ER/UA53/1 dated 29 November 2018) of the University of Sussex, United Kingdom.
Informed Consent Statement
Informed consent was obtained from all subjects involved in the study.
Data Availability Statement
All the data will be in the University of Sussex, United Kingdom depository.
Conflicts of Interest
The authors have no conflict of interest.
References
- Food and Agricultural Organization. Global Forest Resources Assessment 2020—Key Findings; Food and Agricultural Organization: Rome, Italy, 2020. [Google Scholar] [CrossRef]
- Bodart, C.; Andreas, B.B.; Franc, B.D.; Andrea, L.; Philippe, M.; Achard, F. Continental estimates of forest cover and forest cover changes in the dry ecosystems of Africa between 1990 and 2000. J. Biogeogr. 2013, 40, 1036–1047. [Google Scholar] [CrossRef]
- Enuoh, O.O.; Bisong, F.E. Colonial Forest Policies and Tropical Deforestation: The Case of Cross River State, Nigeria. Open J. For. 2017, 5, 66–79. [Google Scholar] [CrossRef] [Green Version]
- FAO. Global Forest Resources Assessment; Food and Agriculture Organization of the United Nations: Rome, Italy, 2015. [Google Scholar]
- UNEP-WCMC. The State of Biodiversity in Africa: A Mid-Term Review of Progress towards the Aichi Biodiversity Targets; UNEP-WCMC: Cambridge, UK, 2016. [Google Scholar]
- Steve, N. The Territory and Current Status of the African Rainforest; ThoughtCo.: New York, NY, USA, 2019. [Google Scholar]
- Krause, A.; Pugh, T.A.M.; Bayer, A.D.; Li, W.; Leung, F.; Bondeau, A.; Arneth, A. Large uncertainty in carbon uptake potential of land-based climate-change mitigation efforts. Glob. Chang. Biol. 2019, 24, 3025–3038. [Google Scholar] [CrossRef]
- FAO. Global Forest Resources Assessment 2010. Forestry Paper 163; Food and Agriculture Organization of the United Nations: Rome, Italy, 2010. [Google Scholar]
- Carbon Brief. Available online: https://www.carbonbrief.org/the-carbon-brief-profile-nigeria (accessed on 10 December 2020).
- Odjugo, P.A. General overview of climate change impacts in Nigeria. J. Hum. Ecol. 2010, 29, 47–55. [Google Scholar]
- Inyang, M.P.; Esohe, K.P. Deforestations, environmental sustainability and health implications in Nigeria: A Review. Int. J. Sci. Environ. Technol. 2014, 3, 502–517. [Google Scholar]
- FAO. Guidelines on Sustainable Forest Management in Drylands of Sub-Saharan Africa. Arid Zone Forests and Forestry Working Paper No. 1; Food and Agriculture Organization of the United Nations: Rome, Italy, 2016. [Google Scholar]
- Bisong, F.E. Land Use and Deforestation in the Rainforest of South-Eastern Nigeria (1972–2001). Niger. Geogr. J. 2007, 5, 19–28. [Google Scholar]
- Moon, H.; Solomon, T. Forest decline in Africa: Trends and impacts of foreign direct investment: A review. Int. J. Curr. Adv. Res. 2018, 7, 16356–16361. [Google Scholar]
- Alister, D. Africa’s Deforestation Twice World Rate. U.N. Environment Programme (UNEP) about the 400-Page Atlas, a Meeting of African Environment Ministers in Johannesburg, South Africa. 2018. Available online: https://www.reuters.com/article/us-africa-environment/africas-deforestation-twice-world-rate-says-atlas-idUSL1064180420080610 (accessed on 23 January 2020).
- Agrawal, A.; Nepstad, D.; Chhatre, A. Reducing Emissions from Deforestation and Forest Degradation. Annu. Rev. Environ. Resour. 2011, 36, 373–396. [Google Scholar] [CrossRef] [Green Version]
- Irawan, S.; Triyoga, W.; Tacco, N.; Watts, J.; Bernadinus, S. Exploring the designing of jurisdictional REDD+: The case of central Kalimantan Indonesia. For. Policy Econ. 2013, 108, 101853. [Google Scholar] [CrossRef]
- Intergovernmental Panel on Climate Change. AR4 Climate Change 2007: The Physical Science Basis; Cambridge University Press: Cambridge, UK, 2007.
- Stern, N. The Economics of Climate Change: The Stern Review; Cambridge University Press: Cambridge, UK, 2007. [Google Scholar]
- Amuyou, U.A.; Kotingo, K.E.; Maiyanga, E.; Otop, O.O.; Ekwok, I.C. International Oil Companies Corporate Social Responsibility Failure as A Factor of Conflicts in the Niger Delta Area of Nigeria. J. Res. Humanit. Soc. Sci. 2016, 4, 65–72. [Google Scholar]
- Adeniyi, P.A.; Albert, A.A.; Usman, I. REDD+ in West Africa: Politics of Design and Implementation in Ghana and Nigeria. Forest 2017, 8, 78. [Google Scholar] [CrossRef] [Green Version]
- UNDP. Guidance Note: Application of Sustainable Livelihood Frameworks in Development Projects; UNDP: New York, NY, USA, 2017. [Google Scholar]
- Chambers, R.; Conway, G.R. Sustainable Livelihood Framework: Practical Concepts for the 21st Century; IDS Discussion Paper 296; Institute of Development Studies: Brighton, UK, 1992. [Google Scholar]
- Mucahid, M.; Lawal, M. Ten Years of REDD+: A Critical Review of the Impact of REDD+ on Forest-Dependent Communities. Sustainability 2016, 8, 620. [Google Scholar] [CrossRef] [Green Version]
- Chambers, R. Poverty and Livelihoods: Whose Reality Counts? IDS Discussion Paper 347; Institute of Development Studies: Brighton, UK, 1995. [Google Scholar]
- Agrawal, A. Studying the Commons, Governing Common-Pool Resource Outcomes: Some Concluding Thoughts. Environ. Sci. Policy 2014, 36, 86–91. [Google Scholar] [CrossRef]
- Odero, K. Information capital: 6th Asset of Sustainable Livelihood Framework. Discov. Innov. 2006, 18, 83–91. [Google Scholar] [CrossRef]
- Scoones, I. Sustainable Rural Livelihoods: A Framework for Analysis; Institute of Development Studies Working Papers 72; Institute of Development Studies: Brighton, UK, 1998; Available online: https://www.ids.ac.uk/ (accessed on 10 December 2020).
- Agrawal, A. Common Property Institutions and Sustainable Governance of Resources. World Dev. 2001, 29, 1649–1672. [Google Scholar] [CrossRef]
- Barnes, C.; Claus, R.; Peter, D.; Dos Santos, M.J.; George, M.A.; Laerhoven, F.V. Uniting forest and livelihood outcomes? Analyzing external actor interventions in sustainable livelihoods in a community forest management context. Int. J. Commons 2017, 11, 532–571. [Google Scholar] [CrossRef] [Green Version]
- Larson, A.M. Forest tenure reform in the age of climate change: Lessons for REDD+. Glob. Environ. Chang. 2011, 21, 540–549. [Google Scholar] [CrossRef]
- Lawlor, K.; Myers, M.E.; Blockhus, J.; Ganz, D.J. Community Participation and Benefits in REDD+: A Review of Initial Outcomes and Lessons. Forests 2013, 4, 296–318. [Google Scholar] [CrossRef] [Green Version]
- Barnes, C.; Laerhoven, V.F. Making it last? Analysing the Role of NGO Interventions in the Development of Institutions for Durable Collective Action in Indian Community. Environ. Sci. Policy 2015, 53, 192–205. [Google Scholar] [CrossRef] [Green Version]
- DFID. Sustainable Livelihoods Guidance Sheets; Department for International Development: London, UK, 2000; Available online: http://www.livelihoods.org/info/info_guidancesheets.htm (accessed on 15 December 2020).
- Mucahid, M.B.; Tran, N.T.; Lawal, M.M. Creating Social Safeguards for REDD+: Lessons Learned from Benefit Sharing Mechanisms in Vietnam. Land 2014, 3, 1037–1058. [Google Scholar] [CrossRef]
- UN-DRIP. United Nations Declarations on the Rights of Indigenous People; Resolution Adopted by the General Assembly, UN Doc. A/RES/61/29. Available online: https://www.un.org/development/desa/wp-content/ (accessed on 2 October 2007).
- UN-REDD+ Nigeria. Forest Reference Emission Levels (FRELs) for the Federal Republic of Nigeria: A Jurisdictional Approach Focused on Cross River State; Federal Department of Forestry, Federal Ministry of Environment: Abuja, Nigeria, 2018.
- USAIDS. Delivery Project. Final Country Report: Nigeria; Federal Republic of Nigeria: Abuja, Nigeria, 2006. [Google Scholar]
- Larsen, T.B. Butterflies of the Cross River National Park—Diversity Writ Large. In Proceedings of the Workshop: Essential Partnership—The Forest and the People, Calabar, Nigeria, 23–28 October 1997; pp. 229–235. [Google Scholar]
- Fon, P.; Akintoye, O.A.; Olorundami, T.; Nkpena, C.O.; Ukata, S.U.; Harrison, E.U. Forest Resources of Cross River State: Their Potentials, Threats and Mitigation Measures. Forest 2014, 8, 64–71. [Google Scholar]
- Jimoh, S.O.; Adesoye, P.; Adeyemi, A.; Emmanuel, T.I. Forest Structure Analysis in the Oban Division of Cross River NationalPark, Nigeria. J. Agric. Sci. Technol. 2012, 2, 510–518. [Google Scholar]
- Ayoade, J.O. Introduction to Climatology for the Tropics; Spectrum Books Ltd.: Ibadan, Nigeria, 2004; p. 207. [Google Scholar]
- Aigbe, H.I.; Omokhua, G.E. Tree species composition and diversity in Oban Forest Reserve, Nigeria. J. Agric. Stud. 2015, 3, 10–24. [Google Scholar] [CrossRef]
- NIMET. Obudu Weather Outlook, 2017; Unpublished Data.
- Olanrewaju, R.; Buku, E.; Akpan, G. Analysis of rainfall pattern and flood incidences in Warri Metropolis, Nigeria. J. Geogr. Environ. Sustain. 2017, 10, 83–97. [Google Scholar] [CrossRef] [Green Version]
- Bulktrade and Investment Company Limited. Soil and Land Use Survey of Cross River State; Main Report; Ministry of Agriculture and Natural Resources: Cross River State, Nigeria, 1998; p. 376.
- Atela, J.O.; Quinn, C.H.; Minang, P.A.; Duguma, L.A. Implementing REDD+ at the local level: Assessing the key enablers for credible mitigation and sustainable livelihood outcomes. J. Environ. Manag. 2015, 157, 238–249. [Google Scholar] [CrossRef]
- Lakpa, D.L.; Gopal, S.; Nazir, A.P.; Vineeta, P.P.; Sumit, C. Contribution of NTFPs on livelihood of forest-fringe communities in Jaldapara National Park, India. J. Sustain. For. 2018, 38, 213–229. [Google Scholar] [CrossRef]
- UN-REDD+ Nigeria. Annual Progress Report. 2013. Available online: http://www.un-redd.org/ (accessed on 8 October 2019).
- UN-REDD+ Nigeria. Nigeria R-PP. 2013. Available online: https://forestcarbonpartnership.org/system/files/documents/Nigeria%20REDD%2B%20R-PP%20November_2013%5B1%5D_Final.pdf (accessed on 20 December 2020).
- Arnstein, S.R. A ladder of citizen participation. J. Am. Plan. Assoc. 1969, 35, 216–224. [Google Scholar] [CrossRef] [Green Version]
- Chhatre, A.; Lakhanpal, S.; Larson, A.M.; Nelson, F.; Ojha, H.; Rao, J. Social safeguards and co-benefits in REDD +: A review of the adjacent possible, Current Opinion. Environ. Sustain. 2012, 4, 654–660. [Google Scholar] [CrossRef]
- Bisong, F.E.; Larwanou, M. Evaluation of forestry-based adaptation practices in flood and drought conditions, and determinants of their adoption in Anglophone Africa. Int. For. Rev. 2019, 21, 22–37. [Google Scholar] [CrossRef]
- Tien, N.D.; Rañola, R.F.; Thuy, P.T. Potential impact of the REDD+ program on poverty reduction in Nghe An Province, Vietnam. Forests 2017, 8, 376. [Google Scholar] [CrossRef] [Green Version]
- Appiah, D.O.; Bugri, J.T.; Eric, K.; Forkuo, E.K.; Yamba, S. Agricultural and Forest Land Use Potential for REDD+ among smallholder Land Users in Rural Ghana. Int. J. For. Res. 2016, 2016, 7218305. [Google Scholar] [CrossRef] [Green Version]
- Agrawal, A.; Chhatre, A.; Hardin, R. Changing governance of the world’s forests. Science 2008, 320, 1460–1462. [Google Scholar] [CrossRef]
- Awono, A.D.; Olufunso, A.S.; Eba, R.A.; Patrice, L. Tenure and participation in local REDD + projects: Insights from southern Cameroon. J. Environ. Sci. Policy 2014, 35, 76–86. [Google Scholar] [CrossRef]
- Ostrom, E. The potential role of communities in sustaining forest resources. In Proceedings of the XXIII IUFRO World Congress, Seoul, Korea, 23–28 August 2010. [Google Scholar]
- Phelps, J.; Edward, L.W.; Agrawal, A. Does REDD+ Threaten to Recentralize Forest Governance? Policy Forum 2010, 328, 312–313. [Google Scholar] [CrossRef] [PubMed]
- Hayes, T.M. A challenge for environmental governance: Institutional change in a traditional common-property forest system. Policy Sci. 2010, 43, 27–48. [Google Scholar] [CrossRef]
- Paul, C.; Knoke, T. Between land sharing and land sparing –what role remains for forest management and conservation? Int. For. Rev. 2015, 7, 210–230. [Google Scholar] [CrossRef]
- Wildlife Works. Carbon Credits for Kenya Project. In Wildlife Works REDD+ Project Developer, What We Do; Government of Kenya: Nairobi, Kenya, 2011.
- Sunderlin, W.D.; Larson, A.M.; Amy, E.D.; Ida, A.P.R. How are REDD+ Proponents Addressing Tenure Problems? Evidence from Brazil, Cameroon, Tanzania, Indonesia, and Vietnam. World Dev. 2014, 55, 37–52. [Google Scholar] [CrossRef]
- United Nation Framework Convention on Climate Change. In Proceedings of the Kyoto Climate Change Conference, Kyoto, Japan, 11 December 1997.
- Smith, J.; Scherr, S.J. Capturing the value of forest carbon for local livelihoods. World Dev. 2003, 31, 2143–2160. [Google Scholar] [CrossRef]
- Apipoonyanona, C.; Kuwornub, K.M.; Szaboa, S.; Shresthaa, S.R. Factors influencing household participation in community forest management: Evidence from Udon Thani Province, Thailand. J. Sustain. For. 2020, 39, 184–206. [Google Scholar] [CrossRef]
- Atela, J.O.; Quinn, C.H.; Minang, P.A. Are REDD+ projects pro-poor in their spatial targeting? Evidence from Kenya. Appl. Geogr. 2017, 52, 14–24. [Google Scholar] [CrossRef]
- Bisong, F.E. Community Institutions and Resource Management: Resilience and Adaptation of Traditional Mechanisms for Sustainability in South-South. J. Cult. Dev. 2001, 3, 92–131. [Google Scholar]
- Sunderlin, W.D.; Sills, E.O. REDD+project as hybrid of old and new forest management approaches. Opportunities and challenges under policy and market uncertainty. In Analyzing REDD+: Challenges and Choices; Angelsen, A., Ed.; CIFOR: Bogor, Indonisia, 2013; pp. 177–192. [Google Scholar]
- Igiebor, G.O. Political Corruption in Nigeria: Implications for Economic Development in the Fourth Republic. J. Dev. Soc. 2019, 35, 493–513. [Google Scholar] [CrossRef]
- Bisong, F.E.; Ajake, A.O. An Economic Analysis of Women’s dependence on Forest Resources in the Rainforest Communities of South-Eastern Nigeria. Glob. J. Pure Appl. Sci. 2001, 7, 345–350. [Google Scholar]
- Sunderland, T. Cross River State Community Forestry Project: Non-Timber Forestry Products Advisor Report; Technical Reported to DFID 2001; Environmental Resource Management and Scott Wilson Kirkpatrick and Co Ltd.: London, UK, 2001. [Google Scholar] [CrossRef]
- UN-REDD+ Nigeria. National Annual Program Report, Nigeria. January to December 2015. Available online: http://www.un-redd.org/ (accessed on 19 June 2019).
- Langat, D.K.; Maranga, E.K.; Aboud, A.A.; Cheboiwo, J.K. Role of Forest Resources to Local Livelihoods: The case of East Mau Forest Ecosystem, Kenya. Int. J. For. Res. 2016, 1–10. [Google Scholar] [CrossRef] [Green Version]
- Menton, M.C. Effects of logging on non-timber forest product extraction in the Brazilian Amazon: Community perceptions. Int. For. Rev. 2003, 5, 96–109. [Google Scholar] [CrossRef]
- Gillet, P.; Cédric, V.; Jean-Louis, D.; Codina, E.; Lehnebach, C.; Feintrenie, M. What are the impacts of deforestation on the harvest of Non-Timber Forest Products in Central Africa? Forest 2016, 7, 106. [Google Scholar] [CrossRef] [Green Version]
- Ngansop, T.M.; Biye, E.H.; Fongnzossie, F.E.; Forbi, P.; Cédric, C. Using transect sampling to determine the distribution of some key non-timber forest products across habitat types near Boumba-Bek National Park, South-east Cameroon. BMC Ecol. 2019, 19, 3. [Google Scholar] [CrossRef] [PubMed] [Green Version]
- Ali, F.; Mafu, A.A.; Carole, R. Gnetum africanum: A Wild Food Plant from the African Forest with Many Nutritional and Medicinal Properties. J. Med. Food 2011, 14, 1289–1297. [Google Scholar] [CrossRef] [PubMed] [Green Version]
- Nwidu, L.L.; Nwafor, P.A.; Wagner, V. The aphrodisiac herb Carpolobia: A biopharmacological and phytochemical review. Pharmacogn. Rev. 2015, 9, 132–139. [Google Scholar] [CrossRef] [Green Version]
- Sunderland, T.C.; Michael, P.B.B.; Asaha, S.; Malleson, R. The utilization and management of African rattans: Constraints to sustainable supply through cultivation. For. Trees Livelihoods 2008, 18, 337–353. [Google Scholar] [CrossRef]
- Zeh, A.F.; Fuashi, N.A.; Maurice, M.E. Flora composition, structure and diversity in the Kimbi Fungom National Park, North West Region, Cameroon. J. Ecol. Nat. Environ. 2019, 11, 1–13. [Google Scholar]
- Intergovernmental Panel on Climate Change. Available online: http://www.grida.no.climate/ipcc_tar/wgi/052.html#221 (accessed on 1 April 2021).
- Drunkard, A.; Jackson, T. Understanding households as drivers of carbon emissions. In Taking Stocks of Industrial Ecology; Clift, R., Drunkard, A., Eds.; Centre for Environmental Strategy, University of Surrey: Guildford, UK, 2016. [Google Scholar]
- Liu, Y.; Zhang, M.; Liu, R. The impact of income inequality on carbon emissions in China: A household-level analysis. Sustain. 2020, 12, 2715. [Google Scholar] [CrossRef] [Green Version]
- Page, M.; Okeke, F. Stolen Dreams: How Corruption Negates Government Assistance to Nigeria’s Small Businesses. Publication of Carnagie Endowment for International Peace. 2019. Available online: https://carnegieendowment.org (accessed on 19 February 2021).
Figure 1.
Location of sampled communities in Cross River State, Nigeria.

Figure 2.
(a,b) Community awareness and participation in REDD+ activities in Cross River State Nigeria.
Figure 2.
(a,b) Community awareness and participation in REDD+ activities in Cross River State Nigeria.

Figure 3.
Perception of income trends NTFPs after REDD+ project.

Figure 4.
Perceived trend of access to forest land for agriculture with REDD+ intervention.


Table 1.
Sample size at 10% of the total household.
| Community | Agroecological Zone | Total Households | 10% |
|---|---|---|---|
| Beyasung | NAZ | 480 | 48 |
| Imale | NAZ | 210 | 21 |
| Butatong | CAZ | 690 | 69 |
| Buachor | CAZ | 510 | 51 |
| Uwai | SAZ | 340 | 34 |
| Oban | SAZ | 660 | 66 |
| Total | 2890 | 289 |
Source: Authors field survey (2019).
Table 2.
Summary of multiple regression of the influence of household income, education, household size and gender on REDD+ awareness.
Table 2.
Summary of multiple regression of the influence of household income, education, household size and gender on REDD+ awareness.
| Independent Variables | Coefficients | ||
|---|---|---|---|
| B | Β | t-Value | |
| Education | 0.246 | 0.274 | 4.859 * |
| Household income | 0.196 | 0.155 | 2.767 * |
| Gender | 0.081 | 0.088 | 1.572 |
| Household size | 0.089 | 0.075 | 1.342 |
| F-value | 10.135 * | ||
| R | 0.353 | ||
| R2 | 0.125 | ||
| Constant | 0.899 | 10.195 * | |
* Significant at 0.05 significance level; probability value = 0.000.
Table 3.
Community perceived area of REDD+ intervention.
| Areas of Intervention | Frequency | Percentage |
|---|---|---|
| NTFP domestication training | 15 | 5.2 |
| Finance to SMS | 4 | 1.4 |
| Forest governance/carbon | 0 | 0 |
| No infrastructure interventions | 270 | 93.4 |
| Total | 289 | 100 |
Table 4.
Perceived carbon protection benefits.
| Carbon Measurement Benefits | Frequency | Percentage |
|---|---|---|
| Monetary payment | 101 | 34.9 |
| More natural resources | 99 | 34.3 |
| Employment | 59 | 20.4 |
| Multiplier economic effects | 30 | 10.4 |
| Total | 289 | 100.0 |
Source: Analysis by author (2020).
Table 5.
Summary of logistic regression result showing influence of education, gender, household size, and income on carbon measurement benefits.
Table 5.
Summary of logistic regression result showing influence of education, gender, household size, and income on carbon measurement benefits.
| Variables | Coefficient (b) | S.E. | Wald | Df | Sig. | Exp(E) Odds Ratio | |
|---|---|---|---|---|---|---|---|
| Sex | 0.182 | 0.245 | 0.550 | 1 | 0.458 | 0.834 | |
| Education | 0.632 | 0.249 | 6.438 * | 1 | 0.011 | 0.532 | |
| Household size | 0.392 | 0.332 | 1.393 | 1 | 0.238 | 0.676 | |
| Income | 0.828 | 0.372 | 4.946 * | 1 | 0.026 | 1.437 | |
| Constant | 1.596 | 0.471 | 11.476 | 1 | 0.001 | 4.933 | |
| Overall model estimation | |||||||
| Chi-square | Df | Sig. | |||||
| Step | 15.365 * | 4 | 0.004 | ||||
| Block | 15.365 * | 4 | 0.004 | ||||
| Model | 15.365 * | 4 | 0.004 | ||||
Nagelkerke R square = 0.069; * Significant at 5% confidence level.
Publisher’s Note: MDPI stays neutral with regard to jurisdictional claims in published maps and institutional affiliations. |
© 2021 by the authors. Licensee MDPI, Basel, Switzerland. This article is an open access article distributed under the terms and conditions of the Creative Commons Attribution (CC BY) license (https://creativecommons.org/licenses/by/4.0/).
Share and Cite
MDPI and ACS Style
Amuyou, U.A.; Wang, Y.; Bisong, F.; Antonarakis, A.S. Livelihood Impacts of Forest Carbon Protection in the Context of Redd+ in Cross River State, Southeast Nigeria. Sustainability 2021, 13, 5081. https://doi.org/10.3390/su13095081
AMA Style
Amuyou UA, Wang Y, Bisong F, Antonarakis AS. Livelihood Impacts of Forest Carbon Protection in the Context of Redd+ in Cross River State, Southeast Nigeria. Sustainability. 2021; 13(9):5081. https://doi.org/10.3390/su13095081
Chicago/Turabian StyleAmuyou, Ushuki A., Yi Wang, Francis Bisong, and Alexander S. Antonarakis. 2021. "Livelihood Impacts of Forest Carbon Protection in the Context of Redd+ in Cross River State, Southeast Nigeria" Sustainability 13, no. 9: 5081. https://doi.org/10.3390/su13095081
Note that from the first issue of 2016, this journal uses article numbers instead of page numbers. See further details here.