.JPG)


La Plata F4 Tornado - April 28, 2002
Click on the tabs below to learn more about one of the strongest tornadoes to impact our area.
Also, learn more about how far we have come with forecasting and warning tornadoes.


(Above Left) NASA satellite image from 2002 showing the damage path cutting through the middle of
La Plata, Maryland. The damage path appears as a brown streak from left to right across the center of the picture.
(Above Right) shows the same area 20 years later.
Warning for Tornadoes - 20 Years Later
IMPROVED: 1) DETECTION 2) MODELLING 3) COMMUNICATION
Much has improved in the 20 years since the 2002 La Plata tornado - in tornado detection, atmospheric modeling, and communication. In fact, the lack of casualties during a strong EF2 tornado that tore through Annapolis & Anne Arundel County Maryland with 125 mph winds this past September (2021) showcased a number of these improvements working together.
DETECTION: Meteorologists are better able to see them forming.
NWS Doppler Radars continue to advance their technology. With every passing year, they reveal the atmosphere and storms with increasing clarity. 20 years ago, they were able to show the basics of heavy rain and wind shear in the storm. Now they can see:
finer resolution - enabling us to see smaller rotations and spot them earlier.
hail signatures that reveal powerful updrafts
shape & size of raindrops that reveal further clues about the rotation
debris lofted by tornadoes from the ground
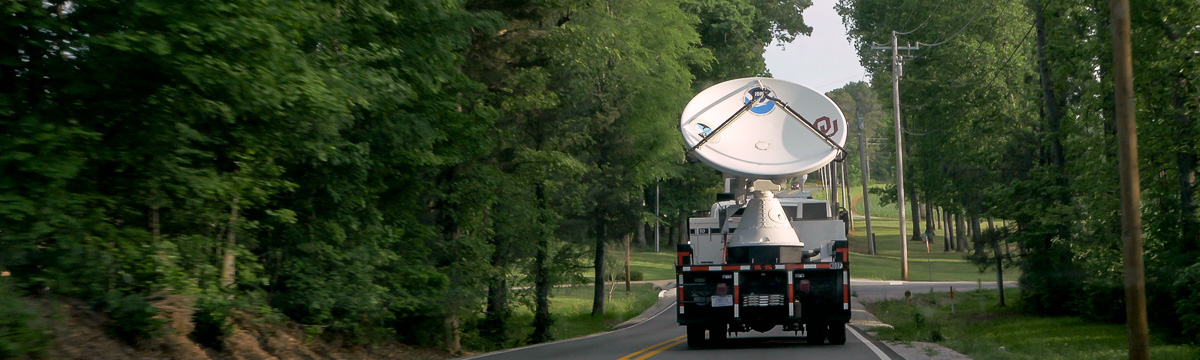
“New” FAA Terminal Doppler Radars
About 15 years ago, the NWS gained access to additional smaller doppler radars at the 3 major metro airports (DCA, IAD, BWI) and Joint Base Andrews (ADW).
In tandem with the NWS doppler network, these give additional perspectives on storms. More perspectives give greater insight on what is evolving within storms.

ATMOSPHERIC MODELING & RESEARCH: Improved modeling of the atmosphere/ research teams
Improved global models
As with the rest of forecasting, our ability to model storm systems that drive thunderstorm outbreaks improves year by year.
The development of “convective models”
Not only do we have models for the global atmosphere, but we now have regional models.
These have a fine enough resolution to simulate individual thunderstorms.
These models also continue to improve in their ability to show where severe storms and tornadoes are likely, and how extreme they might be.
Research Groups - Tornadoes
A number of research teams (such as VORTEX/NSSL) have been established and led over the past 20 years.
They have focused on understanding the complexities that come with forecasting tornadoes, and have helped to establish longer advanced warning for tornadoes.
Groups like these continue to monitor tornado outbreaks to this day, in hopes of discovering more methods of understanding tornadoes and how to forecast/warn for them.
COMMUNICATION: Getting the word out
Wireless Emergency Alerts (WEAs) to cell phones
One of the greatest advancements for Tornado Warning communication over the past two decades has been WEAs.
The fact is that most people have a phone on them. If the NWS issues a Tornado Warning that includes the cell tower that a phone is connected to, that smart phone will alert its owner that a Tornado Warning has been issued for their area.

Social Media
In the 20 years since La Plata, numerous social media platforms have risen into the mainstream, helping to connect us. NWS forecast & warning offices utilize Facebook, Twitter, and others. Every NWS Tornado Warning that gets issued will go out on our Twitter feed. With an overwhelming percent of the public population using social media, this only adds an extra layer of awareness when weather strikes.
Broadcast Media
The collaboration with forecast offices and broadcasters has expanded over the last 20 years. Wall-to-wall coverage when severe weather strikes has become quite common within news stations. A partnership with forecast offices and broadcast media allows for even more of the population to receive these dire warnings.
Impact Based Warning (IBW) Tags & Tornado Emergency
Text “tags” added to the bottom of Tornado Warnings let everyone, as well as broadcasters, know if the tornado is confirmed or radar indicated, as well as the size of the hail (if any) with the storm. These details allow even greater clarity on storm threat.
A Tornado Emergency (a special type of Tornado Warning) can now be issued by the NWS for a large, confirmed tornado that is headed towards a population center. This wording enhancement helps to convey an even higher level of threat.
Weather Ready Nation
This initiative is a part of NOAA’s effort to improve our nation’s readiness, responsiveness, and overall resilience against extreme weather, water, and climate events by enlisting our community to help.
Many business, group, and community partners within our area have committed to becoming Weather Ready Nation Ambassadors.
This empowers them to establish plans, exercises and discussions in advance of hazardous weather. And in response to potential tornadoes, many of our partners have created drills and steps to seek shelter in the unfortunate real world possibility for one to occur.
Will your business, group, or community commit to becoming an ambassador with Weather Ready Nation? https://www.weather.gov/wrn/ambassadors


The complexity with tornado forecasting has long been an extensive center of research within the meteorological community. In fact, it is one of many driving forces behind a lot of meteorologists' passion within forecasting. How can we improve lead time for tornadoes? Why is it happening now? What can we do to better prepare for it?
Questions continue to be raised, but it is impressive to see how far our society has come in detecting, communicating, and reacting to this powerful threat of nature. For now, we remember those affected by this event 20 years ago, and work hard to continue to make improvements to help warn and prepare our communities for when hazardous weather strikes.
The tornado originated from a supercell thunderstorm that developed in central West Virginia and moved east across the Appalachian Mountains. In eastern West Virginia, the storm produced hail; it first became tornadic near Quicksburg, VA.

Path of thunderstorm that ultimately produced the La Plata/southern MD tornado.
Z times are global Universal Time (UTC) on a 24-hour clock.
For EDT in P.M. on this map, subtract 16 hours.
Example: 21Z, minus 16, is 5 P.M. EDT.
Tornado warnings were issued for Rockingham and Shenandoah Counties, where a F2 tornado occurred (pictured below). The storm moved across Page, Culpeper, Fauquier and Prince William Counties, but produced little damage. Spotters tracking the storm reported rotation and funnel clouds, but no tornado occurred during this phase. In Prince William County, hail was reported.

A tornado touches down near Mount Jackson, VA, in Shenandoah County. As it crossed I-81, it turned over a tractor-trailer.
Meteorology / How did it happen?

Weather Features & Observations
5 P.M. Sunday April 28th
On April 28th, a strong, fast-moving low pressure system was heading towards the region. Its cold front was expected to move through the area during the late afternoon and evening. Ahead of that, over the Mid Atlantic a warm and very humid atmosphere was concerning the forecasters, both for flooding and severe storms. By midday, the morning clouds began to clear, and the sun began to rapidly destabilize the atmosphere. Temperatures rose into the 70s. The dewpoint (another measure of humidity) rose into the low to mid 60s.
Further to our west, several squall lines of storms had already formed well to our west over Kentucky and Ohio. Meanwhile, a thunderstorm formed in western West Virginia. That storm maintained its structure as it moved eastward across West Virginia and the Appalachian Mountains. Once it moved east of the mountains, it entered an increasingly powerful atmospheric environment with:
1) Deep instability - warm, humid low-level air below an atmosphere still generally cool in late April. This is the fuel that powers developing storms.
2) Strong wind shear - a rapid change of winds as you move up through the atmosphere. This ingredient helps to organize storms, make them long-lasting, and develop rotation.
As the developing supercell storm moved through that environment, it was able to spawn its first tornado, which briefly touched down in Rockingham and Shenandoah Counties in west-central Virginia. That proved to be a precursor of things to come for southern Maryland.
The visible satellite image below shows the storm (and associated cloud-to-ground lightning in green) crossing the Potomac into southern Maryland.

Preliminary Damage Reports Issued That Day


The tornado moved southeast across Spring Road about a half a mile north of Pisgah. It was F1 at this time (estimated maximum winds 75 to 112 mph). Its width was about 200 yds. The tornado hit a community along Ripley Road just southwest of Ripley and tore the entire roof off a home. Damage in this vicinity was rated F2 (maximum winds estimated at over 113 mph). Photo from Tim Marshall. |
The tornado continued southeast, where it maintained F1 intensity until it neared Rose Hill Road. Here the tornado appeared to strengthen, where extensive tree and structural damage was rated F2. At Valley Road, about a mile and a half west of La Plata, some F3 damage is seen (maximum winds estimated at over 158 mph). The width of the tornado also increased to about 330 yards wide. Photo from Tim Marshall. |
Between Valley Road and Morgans Ridge, trees were flattened (F2 damage). Tornado path (highlighted by brown streak and speckling of blue tarp roofs) moves from lower left (damage to homes along Morgans Ridge) to upper right (downtown La Plata). Photo submitted to Charles County Government by Warren Robinette. Photographer unknown. |
At Morgans Ridge and Quail Lane, several homes were destroyed. Some homes literally slid off the foundation when the tornado wind struck. This house on Morgans Ridge slid north. Picture by Barbara Watson, NOAA/NWS. |
Damaged house on West Quail Lane Picture by Barbara Watson, NWS/NOAA. |
Picture shows a destroyed house on Quailwood. Photo submitted to Charles County Government by Warren Robinette. Photographer unknown. |
A couple of houses, one on Quail Court and another on Quailwood (see photo above), showed F3 damage, while most were rated F1 to F2 intensity. East of Quailwood, the tornado destroyed part of the Archbishop Neale School (see photo below). Considering the amount of damage to the classrooms of this school, it is very fortunate that the tornado struck on a Sunday night when school was not in session. The heavy cement slabs that formed the roof lifted and fell into the classrooms, windows broke in, and walls were torn away in some places.
Damage to Archbishop Neale School. Photo submitted to Charles County Government by Warren Robinette. Photographer unknown. |
The intersection of U.S. Route 301 (right to left) and Route 6 (top left to bottom right). Quailwood is at the top of the picture with Archbishop Neale School below it. Photo submitted to Charles County Government by Warren Robinette. Photographer unknown. |
Damage to the United Methodist Church. Photo by Dawn Glencer. |
A truck sand blasted by tornado wind and debris. Photo by Dawn Glencer. |
Picture of what remains of the CVS (F3 damage). Photo by Dawn Glencer. |
What remains of the KFC near the CVS. Picture taken by Dawn Glencer. |
The tornado strengthened and widened further as it moved through downtown La Plata. Swaths of F3 and F4 damage were observed through town. These swaths and eyewitness accounts suggested that the tornado was multi-vortex (multiple, compact vortices circulating around the parent tornado circulation). Through downtown La Plata, the damage swath was almost one-half mile wide (approximately 650 yards). Some pictures from this section of La Plata can be viewed below.
The tornado likely was moving at an unusually fast speed of 58 mph as it moved through La Plata (nearly a mile a minute!). Therefore, the damage occurred in just a few seconds.
A view of the damage along Route 6 near Route 301. Cars were thrown and turned over, while others were hit with debris. Although many people were injured, it is surmised that the human impact could have been far worse had the tornado occurred on a weeknight instead of a Sunday night. Picture by Dawn Glencer. |
The water tower, once full of water, was blown over in the tornado. Picture by Barbara Watson, NOAA/NWS. |
The lumber yard building on Saint Marys Avenue. Cleanup had already occurred in the parking area (left). This building was a brick and steel structure with a large spanning roof. Damage here was F3. Damage intensified to F4 intensity east of the lumber yard. Photo submitted to Charles County Government by Warren Robinette. Photographer unknown. |
 Picture by Barbara Watson, NOAA/NWS. Picture by Barbara Watson, NOAA/NWS. |
Lumber yard is on left edge of picture. Orthodontist Office was on next street to the left. Farther left and prior to railroad tracks, two additional houses and garages were gone. This was the F4 damage streak. Photo submitted to Charles County Government by Warren Robinette. Photographer unknown. |
Significant damage to a building on north side of F4 damage streak across Lagrange Avenue. Picture by Barbara Watson, NOAA/NWS. |
Just west of the railroad tracks is Maple Avenue. Two houses and two separate garages once stood between Maple and Lagrange Avenues (just south of Port Tobacco Road). There was little to nothing left of the two two-story houses or the garages.
 Picture by Barbara Watson, NOAA/NWS. |
 Picture by Barbara Watson, NOAA/NWS. |
The following are two aerial views of the F4 damage through the heart of La Plata.
The tornado was moving from left to the lower right of the picture. Lagrange Avenue goes from the lower left corner up to Route 6 near the top of the picture. The heavy F4 damage streak enters the left of the picture and moves right to the railroad tracks. Photo submitted to Charles County Government by Warren Robinette. Photographer unknown. |
Picture taken from above Route 301 looking east. Route 6 moves up the left center of the picture. The tornado path moves up the center and to the right center of the picture. Photo submitted to Charles County Government by Warren Robinette. Photographer unknown. |
After crossing La Plata, the tornado moved east-southeast, damaging extensively a heavily wooded area and clipping the Clark Run subdivision. The tornado crossed Route 6 again. Three additional homes were leveled along this segment of the tornado path.
Damage swath. Route 6 moves from left to right across the center of the picture. Photo submitted to Charles County Government by Warren Robinette. Photographer unknown. |
Two homes off Normandie and Route 6 that were leveled and another house with no roof. Photo submitted to Charles County Government by Warren Robinette. Photographer unknown. |
Two destroyed homes are shown in the picture above (view is to the north). Seven people were inside one of these houses; all seven survived (3 were in the basement, 2 were on the first floor headed to the basement, and 2 were on the second floor). A second house (in the background) also was flattened. A closer view of this second house can be seen in the second photo below. The first floor remained attached to the foundation, but the rest of the house was swept away.
 Picture by Ed Pace, N3HJA, Skywarn volunteer for NWS and HAM Operator. |
This house appears to be well built and is on the north side of the damage swath. Picture by Barbara Watson, NOAA/NWS. |
This house was at the end of Normandie Woods Drive. It also had a block and brick foundation and no basement. Little remained except two cars, which were garaged slightly below ground level. Damage in this area east of Route 6 was F3 intensity. Picture by Ed Pace, N3HJA, Skywarn volunteer for NWS and HAM Operator. |
The tornado continued across Horseshoe Drive and through a heavily wooded area, including the Kerrick Swamp. Photo submitted to Charles County Government by Warren Robinette. Photographer unknown. |
Damage to heavily wooded area as well as a classic convergent and cyclonic pattern to how the trees fell. Photo submitted to Charles County Government by Warren Robinette. Photographer unknown. |
The tornado moved up the hill to Hawkins Gate Road, where several additional homes were destroyed. Picture by Ed Pace, N3HJA, Skywarn volunteer for NWS and HAM Operator. |
The house shown, which is on the bottom center edge of the picture to the left, was a only a couple of days old before the tornado hit.  Picture by Ed Pace, N3HJA, Skywarn volunteer for NWS and HAM Operator. |
This home was swept nearly clean off its foundation. The damage was rated high F3, possibly F4. Picture by Ed Pace, N3HJA, Skywarn volunteer for NWS and HAM Operator. |
 Picture by Ed Pace, N3HJA, Skywarn volunteer for NWS and HAM Operator. |
 Picture by Ed Pace, N3HJA, Skywarn volunteer for NWS and HAM Operator. |
 Picture by Barbara Watson, NOAA/NWS. |
 Picture by Barbara Watson, NOAA/NWS. |
 Picture by Barbara Watson, NOAA/NWS. |
The path width at this location narrowed to about 400 yards. The tornado impacted mainly rural areas thereafter.
Powerplant on the Patuxent River can be seen in the distant haze. The Patuxent River is the border between Charles County and Calvert County. Photos submitted to Charles County Government by Warren Robinette. Photographer unknown. |
Numerous barns were destroyed and rural homes damaged. Photos submitted to Charles County Government by Warren Robinette. Photographer unknown. |
 Photos submitted to Charles County Government by Warren Robinette. Photographer unknown. |

The tornado entered Calvert County south of the Patuxent River Bridge (Route 231) at approximately 7:28 pm EDT after traversing 30 miles. Although it was weakening, it still was strong enough to destroy several homes and kill two people in Calvert County. The tornado damage in Calvert County was rated F1 to F2 intensity. The tornado moved offshore at approximately 7:45 pm. Additional tornado damage continued in Dorchester County across the Chesapeake Bay.
Homes in Calvert County suffered predominantly roof and siding damage. The occupants of the home shown below had safely taken cover in an interior bathroom.
Tornado direction was from behind house moving out of picture to the right. House is missing roof and front brick facing. Picture by Ed Pace, N3HJA, Skywarn volunteer for NWS and HAM Operator. |
Side view of the same house in picture to the left. In the foreground are downed trees and debris from a demolished barn or outbuilding. Picture by Ed Pace, N3HJA, Skywarn volunteer for NWS and HAM Operator. |
The damage path exited Calvert County and entered the Chesapeake Bay. The pictures below show damage to a swath of trees along the shoreline. Parts of trees were thrown into the Chesapeake Bay by the tornado.
 Pictures by Calvert County Emergency Management. |
 Picture from Calvert County Emergency Management. |
The tornado was seen moving east across the Chesapeake Bay from Calvert County's eastern shore. Tornado damage was rated F1/F2 at this point and had already traveled 38 miles. Pictures were taken by Charlie Boyer at Calvert Cliffs Plant. Copyrights may apply and permission must be asked before reuse.
 |
 |
|
 First tornado (left) plus a cyclic, second tornado (right). |
Hail Produced by the Storm
Hail up to softball size (4.5 inch diameter) was reported with the storm near La Plata. Many areas not damaged by the tornado were damaged from the large hail.
 |
 |
 |
 |
![]()
Page Last Updated: April 2022


 Coastal Flood
 FAQ
FAQ Follow us on YouTube