

Download - Provincial Government of Romblon
Download - Provincial Government of Romblon
Download - Provincial Government of Romblon

Create successful ePaper yourself
Turn your PDF publications into a flip-book with our unique Google optimized e-Paper software.
<strong>Provincial</strong> Pr<strong>of</strong>ile<br />
PROVINCE PROVINCE OF OF ROMBLON ROMBLON<br />
CY - 2012<br />
I. History<br />
The Negritoes were the aborigines <strong>of</strong> the islands comprising the province <strong>of</strong> <strong>Romblon</strong>. The<br />
Mangyans were the first settlers. Today, these groups <strong>of</strong> inhabitants are almost extinct with only a few<br />
scattered remnants <strong>of</strong> their descendants living in the mountain <strong>of</strong> Tablas and in the interior <strong>of</strong> Sibuyan<br />
Island. A great portion <strong>of</strong> the present population descended from the Nayons and the Onhans who<br />
immigrated to the islands from Panay and the Bicols and Tagalogs who came from Luzon as early as<br />
1870.<br />
<strong>Romblon</strong> was created as a regular province in 1901 but due to insufficient income, it became<br />
a sub-province <strong>of</strong> Capiz in 1907 until December 7, 1917, when Act No. 2724 reestablished the former<br />
province <strong>of</strong> <strong>Romblon</strong>. Under Commonwealth<br />
Act No. 581, enacted without executive<br />
approval on June 8, 1940, the province was<br />
reorganized with four towns, namely: Tablas<br />
(embracing Odiongan, Looc, Badajos, Sta. Fe<br />
and Despujols), <strong>Romblon</strong> (comprising Logbon,<br />
Cobrador and Alad), Banton (involving Simara<br />
and Maestre de Campo), and Sibuyan (with<br />
the towns <strong>of</strong> Cajidiocan, Magdiwang and San<br />
Fernando).<br />
The Japanese Imperial Forces<br />
maintained a garrison in <strong>Romblon</strong> during<br />
World War II from 1942 until the Naval Battle<br />
<strong>of</strong> Sibuyan on October 25, 1945. The islands<br />
became the center <strong>of</strong> considerable resistance<br />
movement under the direction <strong>of</strong> General<br />
Macario Peralta, Jr. from his Panay<br />
headquarters. One <strong>of</strong> the most exciting<br />
incidents <strong>of</strong> the Pacific War took place in the<br />
waters <strong>of</strong> <strong>Romblon</strong>, the Naval – Air Battles<br />
between Japanese Admiral Kurita’s Fleet from<br />
Singapore and Admiral Halseys’s carrier<br />
planes from the American Third Fleet then<br />
stationed east <strong>of</strong> the Philippines.<br />
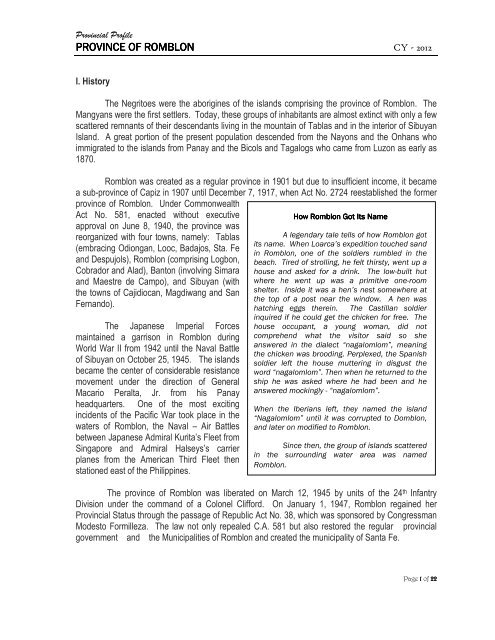
How How <strong>Romblon</strong> <strong>Romblon</strong> <strong>Romblon</strong> Got Got Its Its Name<br />
Name<br />
A legendary tale tells <strong>of</strong> how <strong>Romblon</strong> got<br />
its name. When Loarca’s expedition touched sand<br />
in <strong>Romblon</strong>, one <strong>of</strong> the soldiers rumbled in the<br />
beach. Tired <strong>of</strong> strolling, he felt thirsty, went up a<br />
house and asked for a drink. The low-built hut<br />
where he went up was a primitive one-room<br />
shelter. Inside it was a hen’s nest somewhere at<br />
the top <strong>of</strong> a post near the window. A hen was<br />
hatching eggs therein. The Castillan soldier<br />
inquired if he could get the chicken for free. The<br />
house occupant, a young woman, did not<br />
comprehend what the visitor said so she<br />
answered in the dialect “nagalomlom”, meaning<br />
the chicken was brooding. Perplexed, the Spanish<br />
soldier left the house muttering in disgust the<br />
word “nagalomlom”. Then when he returned to the<br />
ship he was asked where he had been and he<br />
answered mockingly - “nagalomlom”.<br />
When the Iberians left, they named the island<br />
“Nagalomlom” until it was corrupted to Domblon,<br />
and later on modified to <strong>Romblon</strong>.<br />
Since then, the group <strong>of</strong> islands scattered<br />
in the surrounding water area was named<br />
<strong>Romblon</strong>.<br />
The province <strong>of</strong> <strong>Romblon</strong> was liberated on March 12, 1945 by units <strong>of</strong> the 24 th Infantry<br />
Division under the command <strong>of</strong> a Colonel Clifford. On January 1, 1947, <strong>Romblon</strong> regained her<br />
<strong>Provincial</strong> Status through the passage <strong>of</strong> Republic Act No. 38, which was sponsored by Congressman<br />
Modesto Formilleza. The law not only repealed C.A. 581 but also restored the regular provincial<br />
government and the Municipalities <strong>of</strong> <strong>Romblon</strong> and created the municipality <strong>of</strong> Santa Fe.<br />
Page 1 <strong>of</strong> 22
<strong>Provincial</strong> Pr<strong>of</strong>ile<br />
PROVINCE PROVINCE OF OF ROMBLON ROMBLON<br />
CY - 2012<br />
II. Geo-Physical Environment<br />
The province <strong>of</strong> <strong>Romblon</strong> is strategically situated at the center <strong>of</strong> the Philippine Archipelago. It<br />
is composed <strong>of</strong> three major islands (Tablas, Sibuyan and <strong>Romblon</strong>) and seventeen minor and small<br />
islands. It is surrounded by deep waters, and is bounded by the islands <strong>of</strong> Masbate in the east,<br />
Mindoro in the west, Marinduque in the north and Panay in the south. It is approximately 187 nautical<br />
miles and 169 air miles south <strong>of</strong> Manila. The islands are dispersed and accessible only by sea<br />
transportation except for Tablas Island where a domestic airport is located in the municipality <strong>of</strong><br />
Alcantara.<br />
The total land area <strong>of</strong> the province is approximately 1,355.9 sq. km. representing about 5.30<br />
percent <strong>of</strong> the total land area <strong>of</strong> Region IV-B (MIMAROPA). Of its seventeen municipalities, nine are<br />
located in Tablas Island (San Agustin, Calatrava, San Andres, Odiongan, Ferrol, Santa Fe, Looc,<br />
Alcantara and Santa Maria), three in Sibuyan Island (Magdiwang, Cajidiocan and San Fernando) and<br />
five (<strong>Romblon</strong>, San Jose, Banton, Concepcion and Corcuera) are island municipalities.<br />
The province is generally mountainous with about forty percent <strong>of</strong> its land area having slopes<br />
greater than 50 percent. Only four percent <strong>of</strong> the total area has 3 to 8 percent slopes while a sparse<br />
ten percent has 0 to 3 percent inclination. Narrow strips <strong>of</strong> coastal lowlands, low hills and plains typify<br />
the topography <strong>of</strong> some <strong>of</strong> the islands.<br />
The major locations <strong>of</strong> areas that are highly productive and buildable are basically in Tablas<br />
and Sibuyan. In Tablas, these maybe found in Odiongan, San Andres, Looc and Santa Fe. All three<br />
municipalities in Sibuyan Island on the other hand, have substantial level to gently sloping lands.<br />
Over-all, good developable lands represents only about 13 percent <strong>of</strong> the province’s total area.<br />
The province <strong>of</strong> <strong>Romblon</strong> falls under Type III <strong>of</strong> the Corona’s climatic classification system. It<br />
is characterized by no pronounced wet and dry seasons. Generally, the wet season is from June to<br />
November and sometimes extends up to December when the southwest monsoon is predominant.<br />
The dry season is from January to May that is sometimes interrupted by erratic rainfall.<br />
III. Population and Social Environment<br />
As <strong>of</strong> Census 2010, <strong>Romblon</strong> has a population <strong>of</strong> 283,930. Among the five (5) provinces <strong>of</strong><br />
MIMAROPA region, <strong>Romblon</strong>’s population has consistently ranked 4 th for the three consecutive<br />
censuses <strong>of</strong> 2000, 2007 and 2010. It had 10.34 percent <strong>of</strong> the region’s population as per result <strong>of</strong> the<br />
2010 CPH. Palawan was at the top with 994,340 (including Puerto Princesa) or 36 percent, Oriental<br />
Mindoro has 785,602 or 29 percent, Occidental Mindoro has 452,971 or 17 percent while Marinduque<br />
has 227,828 or 8 percent <strong>of</strong> the region’s population. Among the seventeen (17) municipalities in the<br />
province <strong>of</strong> <strong>Romblon</strong>, Odiongan had the largest population with 43,676. The municipality <strong>of</strong> <strong>Romblon</strong>,<br />
the capital town, had the second largest population with 37,995 and San Fernando had the third<br />
largest with 22,466. The municipalities <strong>of</strong> San Agustin, Looc and Cajidiocan have posted a population<br />
Page 2 <strong>of</strong> 22
<strong>Provincial</strong> Pr<strong>of</strong>ile<br />
PROVINCE PROVINCE OF OF ROMBLON ROMBLON<br />
CY - 2012<br />
more than 20 thousand. San Agustin had 22,116, Looc had 21,841 and Cajidiocan had 21,198. The<br />
municipalities <strong>of</strong> Concepcion and Banton were the two least populated areas in the province. The<br />
population <strong>of</strong> Concepcion (4,445) and Banton (5,963) accounted for only 1.56 and 2.1 percent,<br />
respectively. The municipality <strong>of</strong> San Jose posted the highest growth rate at 2.27 percent, while Ferrol<br />
came in second with 1.39 percent. Magdiwang and Odiongan were in close third and fourth with 1.22<br />
and 1.12 percent, respectively. Meanwhile, the three municipalities <strong>of</strong> the “Maghali” group <strong>of</strong> islands<br />
posted a negative growth rate. Banton has -1.26, Corcuera has -0.99 and Concepcion has -0.52<br />
percent. The island-municipalities <strong>of</strong> Corcuera and San Jose are the two most-densely populated<br />
municipalities in the province by posting a population density <strong>of</strong> 424.6 and 356.2, respectively. On the<br />
other hand, Calatrava and San Fernando are the two least densely-populated municipalities by<br />
registering a population density <strong>of</strong> 112.8 and 118.2, respectively.<br />
Table 1. Demographic Features by Municipality, 2010<br />
Municipality<br />
Estimated Land<br />
Area (sq. km.)<br />
Population<br />
Population<br />
Density<br />
(per sq. km.)<br />
Population<br />
Growth Rate<br />
(2007-2010)<br />
1. Alcantara 71.9 15,428 214.58 0.13<br />
2. Banton 28.3 5,963 210.71 -4.66<br />
3. Cajidiocan 161.4 21,198 131.34 -0.16<br />
4. Calatrava 86.7 9,776 112.76 0.17<br />
5. Concepcion 23.3 4,445 190.77 2.39<br />
6. Corcuera 23.4 9,935 424.57 -3.26<br />
7. Looc 68.7 21,841 317.92 1.81<br />
8. Magdiwang 111.9 13,584 121.39 1.83<br />
9. Odiongan 137.9 43,676 316.72 1.38<br />
10. <strong>Romblon</strong> 127.1 37,995 298.94 0.44<br />
11. San Agustin 78.59 22,116 281.41 -0.003<br />
12. San Andres 75.5 15,028 199.05 2.29<br />
13. San Fernando 190.1 22,466 118.18 0.23<br />
14. San Jose 28.9 10,294 356.19 3.25<br />
15. Santa Fe 66.1 15,700 237.52 -1.39<br />
16. Ferrol 32.3 6,802 210.59 2.27<br />
17. Santa Maria (Imelda) 43.81 7,683 175.37 0.78<br />
Province Total 1,355.90 283,930 209.40 0.54<br />
Source: NSO, 2010 Census <strong>of</strong> Population<br />
Health Services<br />
There are eight hospitals in the province, all <strong>of</strong> which are government owned. The<br />
hospitals in Tablas Island are the following: <strong>Romblon</strong> <strong>Provincial</strong> Hospital (RPH) in Odiongan<br />
(75 beds), Tablas Island District Hospital (TIDH) in San Agustin (25 beds) Don Modesto<br />
Page 3 <strong>of</strong> 22
<strong>Provincial</strong> Pr<strong>of</strong>ile<br />
PROVINCE PROVINCE OF OF ROMBLON ROMBLON<br />
CY - 2012<br />
Formilleza District Hospital (DMFDH) in Looc (25 beds) and San Andres District Hospital (6<br />
beds). In Sibuyan Island, the Sibuyan District Hospital in Cajidiocan can accommodate 25 inpatients.<br />
In the island municipalities, the San Jose in San Jose has 10 beds, the Malipayon<br />
District Hospital in Corcuera has 10 beds and the <strong>Romblon</strong> District Hospital in the capital town<br />
<strong>of</strong> <strong>Romblon</strong> has 75 beds. Total bed capacity <strong>of</strong> the eight hospitals is 251 or a bed to<br />
population ratio <strong>of</strong> 1:1115.<br />
Education<br />
The Department <strong>of</strong> Education, Division <strong>of</strong> <strong>Romblon</strong> believes that every person has the<br />
right to education. Through formal and informal channels it has provided the school-age<br />
population basic and relevant education geared towards producing productive and quality<br />
Romblomanons. In line with the Department policy to provide education for all, 197 <strong>of</strong> the 219<br />
barangays in the 17 municipalities have established elementary schools that provide<br />
educational programs for the well-rounded development <strong>of</strong> the young people in the province.<br />
The Division <strong>of</strong> <strong>Romblon</strong> is composed <strong>of</strong> 13 districts. Twelve <strong>of</strong> these districts have<br />
full time district supervisors and the remaining 1 district has a coordinating principal. There are<br />
216 elementary schools in the division managed by 77 principals, 84 head teachers, 54<br />
teachers-in-charge. As <strong>of</strong> SY 2011-2012, the total number <strong>of</strong> regular teachers in the division is<br />
1,659.<br />
Early Childhood Education in the division is provided to pre-school age children<br />
through DepEd SRA Pre-schools, LGU and PTCA funded pre-schools and Service<br />
Contracting Program <strong>of</strong> the Department <strong>of</strong> Education. Equal opportunities are also provided<br />
for children with special needs. Three Special Education classes are maintained in <strong>Romblon</strong><br />
East Central School in the municipality <strong>of</strong> <strong>Romblon</strong> handled by three trained teachers. The<br />
class for the visually impaired was established in school year 2003-2004, the class for the<br />
mentally handicapped was established in school year 2004-2005 and the class for the hearing<br />
impaired was established in SY 2009-2010.<br />
Most <strong>of</strong> the schools in the division are provided with physical structures and facilities<br />
designed to facilitate learning process and inspire the learners to strive for the best<br />
performance. Some <strong>of</strong> these structures and facilities were constructed thru TEEP. These<br />
facilities include school buildings, water system, electricity, clinic, canteen, libraries, science<br />
laboratories and restrooms. Some schools also have equipment such as typewriters,<br />
computers, sports equipment, fax machine, etc.<br />
The overall pupil-textbook ratio in the elementary is 2:1 which is below the standard <strong>of</strong><br />
1:1, while the number <strong>of</strong> supplemental books is generally inadequate. But despite <strong>of</strong> this<br />
problem, the division enjoys a continuous increase for the last three years in the NAT MPS<br />
and it is now above the standard <strong>of</strong> 75%.<br />
Page 4 <strong>of</strong> 22
<strong>Provincial</strong> Pr<strong>of</strong>ile<br />
PROVINCE PROVINCE OF OF ROMBLON ROMBLON<br />
CY - 2012<br />
Through the years, the Division has consistently pushed for enhancement and<br />
upgrading <strong>of</strong> teachers’ knowledge and competency to teach the content areas through<br />
continuous pr<strong>of</strong>essional development programs such as INSET and other forms <strong>of</strong> teacher<br />
development program. Most <strong>of</strong> these trainings were funded by TEEP. School-based in-service<br />
trainings are encouraged and initiated by school heads depending on the priority needs <strong>of</strong><br />
teachers.<br />
On stakeholders’ participation, the division enjoys the strong support and cooperation<br />
<strong>of</strong> parents, LGUs and NGOs. The schools obtain funding from the Special Education Fund<br />
(SEF). This is aside from the regular allocation called the Maintenance and Other Operating<br />
Expenses (MOOE) which is coursed through the Division Office.<br />
DISTRICT<br />
Table 2<br />
NUMBER OF DISTRICTS AND PUBLIC SCHOOLS<br />
BY LEVEL OF EDUCATION AND TYPE<br />
SY 2011 – 2012<br />
NO. OF<br />
SCHOOLS<br />
NO. OF<br />
SCH. W/<br />
PRE-ELEM.<br />
CLASSES<br />
ELEMENTARY LEVEL SECONDARY LEVEL<br />
CE IE CP IP TOTAL<br />
Main/<br />
Independent<br />
Annex/<br />
Extension<br />
Alcantara 13 12 2 2<br />
Banton 8 4 2 2<br />
Cajidiocan- 14 12 14 0 0 0 14 4 4<br />
Magdiwang 10 3 9 0 1 10 1 1 2<br />
Concepcion 9 8 9 0 0 0 9 1 1 2<br />
Corcuera 13 13 13 0 0 0 13 2 2<br />
Looc 13 13 13 0 0 0 13 1 1 2<br />
Odiongan (N) 14 11 13 0 0 0 13 1 1<br />
Odiongan (S) 12 11 12 0 0 0 12 2 2<br />
Ferrol 6 6 6 0 0 0 6 1 1<br />
<strong>Romblon</strong> 29 27 27 0 2 0 29 3 3<br />
San Agustin 14 13 12 0 1 1 14 5 5<br />
Calatrava 8 7 8 0 0 0 8 1 1<br />
Santa Maria 6 5 4 1 1 0 6 1 1<br />
San Andres 13 13 13 0 0 0 13 2 2<br />
San Fernando 12 11 11 0 1 0 12 2 2<br />
Sta. Fe- 14 12 14 0 0 0 14 2 2<br />
San Jose 8 8 8 0 0 0 8 1 1<br />
DIVISION 216 189 206 1 6 2 215 34 3 37<br />
Source: DepEd, 2012<br />
The province <strong>of</strong> <strong>Romblon</strong> has a total <strong>of</strong> 17 municipalities and 219 barangays. Of the<br />
219 barangays, only 197 or 89.9 have established schools. Data above show 22 or 10.01<br />
have no schools; 9 in Banton, 3 in Cajidiocan, 1 in Concepcion, 2 in Corcuera, 1 in San<br />
Agustin, 2 in San Fernando, 1 in Sta. Maria and 3 in <strong>Romblon</strong>. In Banton, the number <strong>of</strong><br />
Page 5 <strong>of</strong> 22<br />
TOTAL
<strong>Provincial</strong> Pr<strong>of</strong>ile<br />
PROVINCE PROVINCE OF OF ROMBLON ROMBLON<br />
CY - 2012<br />
school age children in the barangays <strong>of</strong> Hambian, Mainit, Nabalay, Toctoc, Togong,<br />
Togbongan, and Yabawon is not enough to open a class. The same condition exists in Brgy.<br />
San Isidro in Sta. Maria and Pili, in Panangcalan, San Fernando. In Corcuera, Concepcion,<br />
San Agustin and <strong>Romblon</strong>, the central schools accommodate the pupils <strong>of</strong> nearby barangays.<br />
These are the reasons why some barangays have no existing schools despite the thrust <strong>of</strong> the<br />
National <strong>Government</strong> <strong>of</strong> “A School in Every Barangay”.<br />
Page 6 <strong>of</strong> 22
<strong>Provincial</strong> Pr<strong>of</strong>ile<br />
PROVINCE PROVINCE OF OF ROMBLON ROMBLON<br />
CY - 2012<br />
Performance PHILIPPINES MIMAROPA ROMBLON<br />
Indicators<br />
2007 2007 2008 2009 2010 2011 2007 2008 2009 2010 2011<br />
Literacy Rate<br />
Male<br />
Female<br />
Total Enrollment<br />
Elementary Level 13,121,648 436,431 445,909 453,630 442,591 51,615 51,123 50,113 50,024 50,439<br />
Secondary Level 6,317,226 173,789 189,928 182,367 186,293 22,737 24,314 23,403 23,250 22,936<br />
School Participation Rate<br />
Elementary Level (GER) 88.85 96.65 96.49 104.10 94.85 98.70 95.52 105.83 96.06<br />
Elementary Level (NER) 78.90 79.89 85.20 84.37 80.72 77.69 86.62 84.71<br />
Secondary Level (GER) 61.65 66.21 68.85 70.73 66.07 72.80 76.07 80.91 73.59<br />
Secondary Level (NER) 47.48 48.02 49.75 47.18 52.30 51.40 55.98 84.71<br />
Cohort Survival Rates<br />
Elementary Level 62.58 62.08 60.84 61.71 62.78 69.10 66.24 63.59 71.44<br />
Secondary Level 54.99 62.57 61.93 61.64 60.64 75.64 72.14 68.38 62.07<br />
Completion Rates<br />
Elementary Level 61.06 61.00 59.60 60.02 61.57 68.07 66.28 63.28 70.80<br />
Secondary Level 50.21 57.90 57.45 58.02 56.55 72.22 69.82 67.50 59.44<br />
Drop Out Rates<br />
Elementary Level 1.36 1.07 1.22 0.86 0.87 0.40 0.10 0.28 0.28 0.26<br />
Secondary Level 6.65 6.10 5.61 5.68 5.46 3.36 2.82 3.41 3.31<br />
Retention Rates<br />
Elementary Level 92.75 92.12 92.31 92.36 92.40 95.01 94.00 93.78 95.54<br />
Secondary Level 85.10 87.90 88.75 88.63 88.50 92.69 92.17 91.37 88.79<br />
Graduation Rates<br />
Elementary Level 97.65 97.17 96.74 97.69 97.82 98.68 98.96 98.63<br />
Secondary Level 91.20 91.13 92.70 91.78 93.75 95.49 96.72 94.23<br />
Promotion Rates<br />
Elementary Level 94.44 93.77 93.84 94.42 97.05 97.08 96.95 96.51<br />
Secondary Level 84.46 85.02 86.08 85.09 90.65 99.90 91.54 87.77<br />
Classroom Ratio<br />
Elementary Level 1:32 1:32 1:32 1:31 1:30<br />
Secondary Level 1:49 1:52 1:45 1:43 1:40<br />
Teacher Ratio<br />
Page 7 <strong>of</strong> 22
<strong>Provincial</strong> Pr<strong>of</strong>ile<br />
PROVINCE PROVINCE OF OF ROMBLON ROMBLON<br />
CY - 2012<br />
Elementary Level 1:35 1:30 1:30 1:30 1:30 1:30<br />
Secondary Level 1:39 1:34 1:37 1:35 1:35 1:33<br />
Table 2.<br />
Education Performance Indicators: Philippines, MIMAROPA and <strong>Romblon</strong>,<br />
2007 – 2010<br />
Data Source: BEIS<br />
Page 8 <strong>of</strong> 22
<strong>Provincial</strong> Pr<strong>of</strong>ile<br />
PROVINCE PROVINCE OF OF ROMBLON ROMBLON<br />
CY - 2012<br />
a. Literacy Rate<br />
The performance indicators above show the trend in the schools for the last<br />
four years. (in percentage). The last three school years’ trends in seven performance<br />
indicators show a decrease in completion rate and cohort survival rate, increase in<br />
graduation and school leaver rate and fluctuating in participation, transition,<br />
promotion, repetition, failure and simple dropout rate.<br />
Completion Rate<br />
The decreased trend in completion rate from year 1 to 3 can be attributed to<br />
the poor economic condition <strong>of</strong> most families in far flung barangays. They utilized their<br />
children to help them in the farm or look for work to augment family income. Thus, few<br />
pupils completed elementary education, while the completion rate in the secondary<br />
level continuously decreased. This can be attributed to the attitude <strong>of</strong> students toward<br />
their studies. Some students are inclined to spend more time with their peers or<br />
barkadas than their studies, thus they lost interest in their studies or others prefer to<br />
do menial jobs in order to help their parents earn a living.<br />
Graduation Rate<br />
The graduation rate in elementary level for three school years is increasing<br />
due to significant number <strong>of</strong> out <strong>of</strong> school youths who returned to school and finished<br />
grade six. This is because several intervention programs and advocacy campaigns<br />
were implemented and conducted in the different schools in the division, while the<br />
graduation rates in secondary level reveal a fluctuating trend. Among the reasons<br />
cited for the increase in graduation rate is the opening <strong>of</strong> Open High School where out<br />
<strong>of</strong> school youth are encouraged to go back to school and students identified as<br />
SARDO are encouraged to have modular instructions.<br />
Promotion Rate<br />
This indicator assesses the extent <strong>of</strong> pupils who are promoted to the next<br />
grade level. The table above shows that the promotion rate in the division is<br />
fluctuating due to migration <strong>of</strong> families to other places. It can be observed that as the<br />
drop-out rate decreases, the promotion rate increases in elementary level, while in the<br />
secondary level, data reveal that the promotion rate shows a fluctuating trend. This<br />
can be attributed to the fact some students are determined to finish their studies while<br />
others prefer to leave school and help their parents earn a living.<br />
Page 9 <strong>of</strong> 22
<strong>Provincial</strong> Pr<strong>of</strong>ile<br />
PROVINCE PROVINCE OF OF ROMBLON ROMBLON<br />
CY - 2012<br />
b. School Participation and Drop-Out Rates<br />
Participation Rate<br />
The data show that the enrolment in SY 2008-2009 is higher than the<br />
enrolment in SY 2009-2010 but the net enrolment rate <strong>of</strong> 86.62% in SY 2009-2010 is<br />
higher than the 77.69% in SY 2008-2009. This is because <strong>of</strong> the higher percentage <strong>of</strong><br />
the enrolment in SY 2009-2010 belong to school age population. Secondary data<br />
shows is a fluctuating trend in enrolment, from SY 2007-2008 it increases in 2008-<br />
2009 but from 2009–2010 to present it has a decreasing trend <strong>of</strong> enrolment.<br />
Presumably the varying trend in enrolment has been influenced by various factors as<br />
poverty, frequent absenteeism, and dismal health condition <strong>of</strong> the students.<br />
Generally, the total enrolment for the given school years shows a fluctuating trend<br />
during the five-year period.<br />
The Net Enrolment Rate or Participation Rate in the elementary level for the<br />
last three years is fluctuating. From 80.72 in SY 2007-2008, it decreased to 77.69 in<br />
SY 2008-2009 and made a quantum leap to reach 86.62 in SY 2009-2010 an again it<br />
decreases to 84.71 in SY 2010-2011. The decrease in SY 2008-2009 can be<br />
attributed to the difficult economic conditions experience during the period caused by<br />
the occurrence <strong>of</strong> calamities and typhoons like Frank that affected the livelihood <strong>of</strong><br />
families in the province. This situation forced some parents not to send their children<br />
to school. The following year, the economic condition has improved and that explains<br />
the big increase in the net enrolment rate for SY 2009-2010, but again it decreases to<br />
84.71 for the SY 2010-2011.<br />
Based on data, the gross enrolment is increasing while the Net enrolment is<br />
fluctuating. Comparing the data for the participation rate it is noted that the Gross<br />
participation rate from 2007-2008 up to 2009-2010 is increasing, while the Net<br />
Participation rate is fluctuating. The reason for the increase can be attributed to those<br />
OSY who avail <strong>of</strong> the services <strong>of</strong> the OHS and the campaign for Balik-Aral where in<br />
those who drop out from school and repeaters were motivated to enroll again, giving<br />
them some modular instructions so that they can still help their parents earn a living.<br />
The Net Enrolment in 2008-2009 decreased but in 2009-2010 it increased again<br />
resulting from a fluctuating trend <strong>of</strong> the Participation rate. Considering and giving<br />
attention to the National EFA target in terms <strong>of</strong> Participation rate which is 78% we are<br />
still very far because in the year 2009-2010-the average participation rate is only<br />
55.98% which is 22.02% far from the National EFA target. Another factor that can be<br />
considered in the fluctuating trend <strong>of</strong> the participation rate is the preference <strong>of</strong> school<br />
age children to quit schools after their elementary graduation due to economic status<br />
and typhoons that hit the province.<br />
Page 10 10 10 <strong>of</strong> 22
<strong>Provincial</strong> Pr<strong>of</strong>ile<br />
PROVINCE PROVINCE OF OF ROMBLON ROMBLON<br />
CY - 2012<br />
Simple Dropout Rate<br />
Although the simple dropout rate is fluctuating due to migration <strong>of</strong> some<br />
families to other places to seek greener pasture, still the division’s dropout rate is<br />
lowest in the region and one among the lowest in the country. The dropout rate in the<br />
secondary level decreased in the year 2009. The factor that can be attributed to the<br />
decrease are the interventions done regarding the DORP such as home visitation,<br />
counseling and Adopt a scholar project <strong>of</strong> some schools in the division <strong>of</strong> <strong>Romblon</strong>.<br />
Another factor that can be attributed in the decrease <strong>of</strong> dropout is that there are 8<br />
secondary schools in the division for the last three years who <strong>of</strong>fer OHS and because<br />
<strong>of</strong> this there are schools who achieved a zero dropout rate, since those students who<br />
are at the risk <strong>of</strong> dropping are advised to enroll in the open high school. In 2010 the<br />
dropout rate increase, the reason behind is due to migration to other places to look for<br />
family subsistence and due to personal reasons such as early marriage and poor<br />
academic performance.<br />
Table 3. School Enrolment and Drop-Out Rates SY 2006-2008 to SY 2010-2011<br />
Municipality<br />
Enrolment Simple DropOut Rate<br />
2006-<br />
2007<br />
2007-<br />
2008<br />
2008-<br />
2009<br />
2009-<br />
2010<br />
2010-<br />
2011<br />
2011-<br />
2012<br />
2006-<br />
2007<br />
2007-<br />
2008<br />
2008-<br />
2009<br />
2010-<br />
2011<br />
ALCANTARA<br />
Elementary 2,993 2,984 2,894 2,784 2,719 2,517 0.87% 0.44% 0.14% 0.26%<br />
Secondary 1,406 1521 1755 1650 1,586 1,516 4.17% 5.11% 3.92% 1.71%<br />
BANTON<br />
Elementary 925 961 946 936 905 832 0.00% 0.00% 0.00% 0.11%<br />
Secondary 546 513 532 562 522 558 2.99% 1.66% 0.78% 1.58 %<br />
CAJIDIOCAN<br />
Elementary 4,056 4,159 4,199 4,121 4,017 4,156 0.59% 0.45% 0.10% 0.87%<br />
Secondary 1,945 1993 2107 2121 2,111 2089 4.46% 3.49% 2.05% 2.39 %<br />
CALATRAVA<br />
Elementary 1,916 1,975 1,982 1,963 1,924 1,973 0.00% 0.00% 0.00% 0.00%<br />
Secondary 634 640 706 669 696 773 3.55% 5.83% 2.05% 2.73 %<br />
CONCEPCION<br />
Elementary 695 702 780 694 712 696 0.00% 0.30% 0.00% 0.00%<br />
Secondary 230 216 227 237 234 233 4.75% 2.17% 3.21% 2.13 %<br />
CORCUERA<br />
Elementary 2,088 2,097 2,095 2,097 2,120 2,207 0.00% 0.00% 0.00% 0.05%<br />
Secondary 946 1005 1081 1020 1,020 992 2.12% 0.96% 2.24% 1.89 %<br />
FERROL<br />
Elementary 1,307 1,423 1,482 1,352 1,344 1,166 0.00% 0.16% 0.07% 0.00%<br />
Secondary 343 435 444 464 427 435 0.00% 0.00% 0.00% 0.75 %<br />
LOOC<br />
Elementary 3,827 3,778 3,703 3,577 3,567 3,537 0.99% 1.78% 0.00% 0.03%<br />
Secondary 2,046 2088 2221 2092 2,037 2,025 2.89% 2.08% 1.87% 1.67 %<br />
MAGDIWANG<br />
Elementary 2,538 2,592 2,602 2,498 2,483 2,484 1.08% 0.75% 0.08% 0.80%<br />
Secondary 1,276 1355 1467 1492 1,461 1,390 5.55% 5.81% 3.87% 5.58 %<br />
ODIONGAN<br />
Elementary 6,551 6,418 6,167 6,138 5,997 6,058 0.05% 0.00% 0.00% 0.02%<br />
Secondary 2,633 2774 2894 2712 2,689 2,597 4.47% 3.30% 3.65% 2.83 %<br />
ROMBLON (Capital)<br />
Elementary 6,890 6,816 6,790 6,631 6,559 6,539 0.98% 1.07% 0.43% 0.57%<br />
Secondary 3,386 3521 3707 3575 3,545 3,356 7.93% 5.24% 3.72% 2.80 %<br />
SAN AGUSTIN<br />
Elementary 4,201 4,330 4,339 4,245 4,205 4,348 0.24% 0.07% 0.02% 0.43%<br />
Page 11 <strong>of</strong> 22<br />
22
<strong>Provincial</strong> Pr<strong>of</strong>ile<br />
PROVINCE PROVINCE OF OF ROMBLON ROMBLON<br />
CY - 2012<br />
Municipality<br />
Enrolment Simple DropOut Rate<br />
2006- 2007- 2008- 2009- 2010- 2011- 2006- 2007- 2008- 2010-<br />
2007 2008 2009 2010 2011 2012 2007 2008 2009 2011<br />
Secondary<br />
SAN ANDRES<br />
1,316 1424 1600 1591 1,580 1,611 6.29% 3.92% 4.23% 2.16 %<br />
Elementary 2,436 2,509 2,501 2,517 2,508 2,628 0.00% 0.04% 0.00% 0.00%<br />
Secondary<br />
SAN FERNANDO<br />
1,066 1076 1048 1075 1,053 1,084 3.43% 2.59% 1.13% 1.75 %<br />
Elementary 4,896 4,912 4,652 4,440 4,542 4,693 0.06% 0.00% 0.08% 0.13%<br />
Secondary<br />
SAN JOSE<br />
1,540 1637 1818 1707 1,787 1,834 4.20% 4.70% 2.13% 2.36 %<br />
Elementary 1,692 1,710 1,775 1,934 2,083 2,989 0.00% 0.00% 0.00% 0.00%<br />
Secondary<br />
SANTA FE<br />
611 684 729 669 663 603 2.71% 2.10% 2.63% 2.70 %<br />
Elementary 2,856 2,866 2,878 2,842 2,913 2,149 0.15% 0.04% 0.18% 0.10%<br />
Secondary<br />
SANTA MARIA<br />
(IMELDA)<br />
1,275 1326 1418 1292 1,365 1,342 2.04% 0.96% 0.54% 0.24 %<br />
Elementary 1,322 1,383 1,338 1,344 1,426 1,467 0.54% 0.08% 0.00% 0.00%<br />
Secondary<br />
Division Total<br />
484 529 560 475 474 498 2.94% 4.32% 6.70% 3.38 %<br />
Elementary 51,189 51,615 51,123 50,113 50,024 50,439 0.42% 0.40% 0.10% 0.26%<br />
Secondary 21,683 22,737 24,314 23,403 23,250 22,936 4.49% 3.61% 2.82% 2.39 %<br />
Data Source: DepED-BEIS<br />
Three municipalities; Alcantara, Looc and <strong>Romblon</strong> has a decreasing trend<br />
<strong>of</strong> enrolment both in elementary and secondary level for the last three school year<br />
while San Fernando has continuous increase <strong>of</strong> enrolment for the last three school<br />
year both in elementary and secondary. The rest <strong>of</strong> other municipalities had a<br />
fluctuating trend <strong>of</strong> enrolment in elementary level and secondary level. The<br />
municipality <strong>of</strong> San Jose has an increasing trend <strong>of</strong> enrolment in elementary while<br />
decreasing in secondary level.<br />
Dropout Rates in five municipalities <strong>of</strong> Calatrava, Concepcion, San Andres,<br />
San Jose and Santa Maria had maintained the 0% in elementary level. The<br />
municipality <strong>of</strong> Cajidiocan has the highest percent <strong>of</strong> dropout rate in elementary and<br />
Magdiwang in secondary with 0.80% and 5.58% respectively for the SY 2010-2011.<br />
c. Cohort Survival Rates<br />
This indicator computes the percentage <strong>of</strong> a cohort <strong>of</strong> pupils who are able to<br />
reach grade six. For the last three years, the division’s cohort–survival rate is<br />
decreasing due to the growing number <strong>of</strong> pupils who stop schooling because <strong>of</strong> the<br />
poor economic conditions <strong>of</strong> their families and also the transfer <strong>of</strong> residences <strong>of</strong><br />
families. Same also with the cohort-survival rate in the secondary level, decreasing at<br />
a rate <strong>of</strong> 3.63 from Year 2007 to Year 2010. The decrease in survival rate <strong>of</strong> the<br />
division could be attributed to transfer <strong>of</strong> residence <strong>of</strong> students due to economic<br />
reasons.<br />
Page 12 <strong>of</strong> 22<br />
22
<strong>Provincial</strong> Pr<strong>of</strong>ile<br />
PROVINCE PROVINCE OF OF ROMBLON ROMBLON<br />
CY - 2012<br />
Planning Standard for Cohort is 78 for elementary and 77 for secondary;<br />
Planning Standard for Completion is 80% both in elementary and secondary<br />
2006-2007 2007-2008 2008-2009<br />
Municipality<br />
ALCANTARA<br />
Cohort Completion<br />
Yrs Input/<br />
graduate<br />
Cohort Completion<br />
Yrs Input/<br />
graduate<br />
Cohort Completion<br />
Yrs Input/<br />
graduate<br />
Elementary 79.70% 78.23% 6.86 75.85% 75.19% 6.98 66.36% 66.50% 7.42<br />
Secondary 72.99% 71.41% 4.89 82.01% 78.73% 4.76 81.30% 79.70% 4.63<br />
BANTON<br />
Elementary 89.34% 88.23% 6.48 82.92% 82.92% 6.53 76.64% 76.64% 6.79<br />
Secondary 81.70% 81.14% 4.70 64.13% 61.37% 5.37 77.81% 73.16% 4.87<br />
CAJIDIOCAN<br />
Elementary 53.98% 52.48% 8.74 55.79% 54.92% 8.26 56.99% 55.96% 8.00<br />
Secondary 74.00% 71.19% 5.20 70.82% 67.31% 5.54 64.89% 63.65% 5.55<br />
CALATRAVA<br />
Elementary 105.69% 104.36% 6.29 65.76% 63.79% 7.59 72.61% 72.88% 7.11<br />
Secondary 57.07% 52.49% 6.07 53.98% 54.77% 6.05 72.77% 70.95% 5.01<br />
CONCEPCION<br />
Elementary 89.70% 89.70% 6.48 84.01% 84.01% 6.36 146.66% 146.66% 4.83<br />
Secondary 32.25% 31.29% 8.83 69.08% 69.08% 5.00 80.90% 80.90% 4.23<br />
CORCUERA<br />
Elementary 75.78% 74.59% 6.87 70.74% 70.74% 7.16 78.06% 78.97% 6.56<br />
Secondary 74.97% 74.06% 4.73 81.17% 79.02% 4.56 78.97% 76.84% 4.79<br />
FERROL<br />
LOOC<br />
Elementary 68.04% 67.61% 7.37 78.67% 70.59% 7.63 76.63% 78.74% 5.99<br />
Secondary 85.64% 84.57% 4.42 109.47% 109.47% 3.76 69.71% 69.71% 4.73<br />
Elementary 57.81% 57.81% 7.91 65.07% 63.86% 7.61 65.31% 64.72% 7.50<br />
Secondary 84.86% 82.74% 4.46 85.53% 73.02% 5.11 72.39% 71.69% 4.75<br />
MAGDIWANG<br />
Elementary 67.51% 66.38% 8.08 67.43% 65.94% 7.95 75.69% 76.57% 6.70<br />
Secondary 76.84% 72.63% 4.96 56.69% 52.19% 5.65 65.03% 62.18% 5.32<br />
ODIONGAN<br />
Elementary 80.44% 80.27% 6.70 68.66% 68.80% 7.09 67.62% 68.06% 7.21<br />
Secondary 68.54% 67.33% 5.11 86.22% 84.70% 4.50 77.00% 75.09% 4.79<br />
ROMBLON (Capital)<br />
Elementary 64.11% 62.64% 7.83 71.14% 67.94% 7.59 69.79% 69.16% 7.36<br />
Secondary 61.48% 59.13% 5.78 74.28% 73.66% 4.89 74.36% 72.30% 4.98<br />
SAN AGUSTIN<br />
Elementary 64.56% 63.56% 7.77 76.87% 75.79% 7.16 69.59% 69.13% 7.12<br />
Secondary 77.68% 76.01% 4.79 73.47% 69.73% 5.10 71.92% 65.79% 5.26<br />
SAN ANDRES<br />
Elementary 63.72% 64.23% 7.33 76.94% 77.15% 6.57 61.30% 62.57% 7.13<br />
Secondary 64.55% 61.56% 5.45 70.49% 67.37% 5.02 60.17% 57.53% 5.60<br />
SAN FERNANDO<br />
Elementary 60.38% 60.12% 7.55 54.28% 54.28% 7.96 47.09% 47.80% 8.87<br />
Secondary 75.24% 72.40% 4.94 77.70% 73.16 4.87 68.29 % 64.25% 5.37<br />
SAN JOSE<br />
Elementary 74.45% 74.10% 7.21 66.87% 66.10% 7.54 78.73% 78.34% 6.83<br />
Page 13 13 <strong>of</strong> 22
<strong>Provincial</strong> Pr<strong>of</strong>ile<br />
PROVINCE PROVINCE OF OF ROMBLON ROMBLON<br />
CY - 2012<br />
Municipality<br />
2006-2007 2007-2008 2008-2009<br />
Cohort Completion<br />
Yrs Input/<br />
graduate<br />
Cohort Completion<br />
Yrs Input/<br />
graduate<br />
Cohort Completion<br />
Yrs Input/<br />
graduate<br />
Secondary 76.07% 75.50% 4.91 68.60 % 68.00% 5.08 65.43% 61.12% 5.73<br />
SANTA FE<br />
Elementary 93.12% 92.87% 6.21 80.80% 80.62% 6.73 71.34% 71.86% 6.97<br />
Secondary 80.50% 89.07% 4.49 80.50% 79.33% 4.75 81.84 % 81.45% 4.53<br />
SANTA MARIA<br />
(IMELDA)<br />
Elementary 73.67% 70.45% 7.57 89.54% 91.07% 6.38 47.43% 45.43% 9.28<br />
Secondary 68.17% 74.89% 5.34 82.48% 79.46% 5.02 53.91% 46.60% 6.75<br />
DIVISION TOTAL<br />
Elementary 69.60% 68.79% 7.35 69.10% 68.07% 7.35 66.24% 66.28% 7.31<br />
Secondary 70.30% 78.17% 5.12 75.64% 72.22% 4.97 69.82% 79.55% 5.03<br />
Note: Indicators were output <strong>of</strong> the previous years’ accomplishment<br />
Data Source: DepED-BEIS<br />
The above data reveals the elementary school in the municipalities <strong>of</strong><br />
Alcantara, Banton, Calatrava, Concepcion, Odiongan and Sta. Fe had a cohort<br />
survival rate that is above the standard <strong>of</strong> 78% as <strong>of</strong> March 2006 in elementary level<br />
and secondary school in Banton, Ferrol, Looc, San Agustin and Santa Fe had also<br />
reached the standard <strong>of</strong> survival rate; While as <strong>of</strong> March 2007, elementary schools <strong>of</strong><br />
Banton, Concepcion, Ferrol, Santa Fe and Santa Maria also had achieved the<br />
standard rate and secondary schools <strong>of</strong> Alcantara, Corcuera, Ferrol, Looc, Odiongan,<br />
San Fernando, Sata Fe, and Santa Maria; But only schools in six municipalities <strong>of</strong><br />
Alcantara, only in secondary level; Concepcion and Corcuera both in elementary and<br />
secondary level, Odiongan, and Santa Fe, secondary level and San Jose elementary<br />
level, had attained the required standard <strong>of</strong> cohort as <strong>of</strong> March 2008.<br />
Completion Rate <strong>of</strong> elementary and secondary schools in the municipalities<br />
<strong>of</strong> Banton and Santa Fe had above the standard and elementary schools in<br />
Calatrava, Concepcion and Odiongan while in secondary school, schools in Ferrol<br />
and Looc had also attained above standard as <strong>of</strong> March 2006; while the completion<br />
rate <strong>of</strong> elementary schools at Banton, Concepcion, Santa Fe and Santa Maria and<br />
secondary schools in Corcuera, Ferrol and Odiongan were only schools that reached<br />
the standard as <strong>of</strong> March 2007. In March 2008 only schools in Concepcion and Santa<br />
Fe, that had attained the completion rate above the standards. As we compared the<br />
years <strong>of</strong> input per graduate from the completion rate; we can conclude that the lower<br />
the completion rate, the longer years <strong>of</strong> input per graduate. The reasons behind were<br />
dropouts and failures.<br />
Page 14 14 <strong>of</strong> 22
<strong>Provincial</strong> Pr<strong>of</strong>ile<br />
PROVINCE PROVINCE OF OF ROMBLON ROMBLON<br />
CY - 2012<br />
d. Classroom – Pupil/Student Ratios<br />
Table 4. Classroom – Student Ratios, SY 2006-2007 to SY 2010-2011 (Standard: 1:40)<br />
School Name Municipality<br />
2006-<br />
2007<br />
Student : Inst’l Room Ratio<br />
2007- 2008- 2009-<br />
2008 2009 2010<br />
2010-<br />
2011<br />
2011-<br />
2012<br />
Clsrm Need<br />
Repair<br />
Major Minor<br />
Tugdan NHS Alcantara 85.40 62.86 40.46 37.31 36.08 33.42 2<br />
Alcantara NHS Alcantara 61.19 77.21 102.42 97.08 65.71 38.45 6 7<br />
Tungonan NHS Banton 19.25 21.14 19.50 18.88 15.00 15.89 3<br />
Banton NHS Banton 32.67 24.33 31.33 34.25 25.80 27.67 4 3<br />
Lumbang East NHS-(Caj.NHS Ext.) Cajidiocan 53.80 34.00 60.50 31.67 34.33 34.40 3<br />
Danao NHS Cajidiocan 33.54 36.46 35.79 32.33 35.93 32.50 11<br />
Cajidiocan NHS Cajidiocan 38.52 45.43 45.56 57.05 54.45 46.82 10 10<br />
Cambalo NHS Cajidiocan 66.67 67.33 75.00 70.00 0.00 6<br />
Calatrava NHS Calatrava 49.23 47.07 44.60 46.40 48.31<br />
Concepcion NHS (Main) Concepcion 16.80 14.30 14.20 15.10 16.44 15.67 5 3<br />
Concepcion NHS Annex (Bakhawan) Concepcion 18.25 21.25 21.50 21.50 18.40 2<br />
Mabini NHS Corcuera 43.07 39.93 43.93 41.07 35.00 28.63 6 10<br />
Corcuera NHS Corcuera 49.00 67.67 42.20 44.50 46.00 53.40 8<br />
Ferrol NHS Ferrol 62.14 34.15 35.69 32.85 33.46<br />
Looc NHS Looc 50.05 44.05 57.53 49.00 47.95 45.79 35 4<br />
Looc NHS Ext. (Buenavista) Looc 36.00 57.50 43.00 39.83 1<br />
Magdiwang NHS Magdiwang 58.00 51.61 52.43 43.81 43.31 41.46 10<br />
Agutay NHS-Magdiwang NHS Annex Magdiwang 168.00 87.00 44.12 41.88 34.67 3<br />
Libertad NHS Odiongan 42.93 45.07 38.56 38.38 37.00 35.38 15 1<br />
Mayha NHS-RNHS (Odiongan) Ext. Odiongan 50.33 44.83 49.12 54.56 35.25 7 3<br />
<strong>Romblon</strong> NHS, Odiongan Odiongan 53.47 52.42 52.84 44.87 42.26 45.94 3 14<br />
Agnipa NHS <strong>Romblon</strong> (Capital) 38.09 32.92 45.90 32.31 30.54 25.07 7 6<br />
Macario Molina MNHS <strong>Romblon</strong> (Capital) 62.50 42.69 79.71 59.50 59.50 43.53 5 2<br />
<strong>Romblon</strong> NHS, <strong>Romblon</strong> <strong>Romblon</strong> (Capital) 57.37 59.02 57.23 53.33 51.06 49.51 4 8<br />
Cabolutan NHS San Agustin 38.00 33.20 24.71 25.71 27.00 27.86 4<br />
Carmen NHS (Cabolutan NHS Ext.) San Agustin 39.20 33.71 36.71 31.14 23.67 24.22 1<br />
Bachawan NHS San Agustin 69.50 39.86 43.85 40.00 37.64 37.36 3 6<br />
Bachawan NHS Ext. (Binongaan) San Agustin 51.50 41.50 45.17 37.11 34.33 35.56 2<br />
San Agustin NTHS San Agustin 135.50 74.50 65.80 67.80 57.00 50.71 2 1<br />
Tan-agan NHS San Andres 38.80 54.00 46.44 39.91 37.00 37.64 2<br />
San Andres NHS San Andres 96.86 80.50 70.00 63.60 64.60 41.88<br />
España NHS San Fernando 51.08 45.36 102.29 52.92 41.93 35.35<br />
Don Carlos Mejias MNHS San Fernando 103.00 111.33 91.83 53.60 64.33 56.05<br />
San Jose Agricultural HS San Jose 43.64 45.60 45.56 44.60 41.44 35.47 7 9<br />
Guinbirayan NHS Santa Fe 47.30 42.17 47.83 45.82 37.69 37.67 2 2<br />
Sta. Fe NHS Santa Fe 53.47 51.25 44.42 41.47 46.05 46.84<br />
Santa Maria NHS Sta. Maria (Imelda) 96.80 88.17 93.33 59.38 59.25 49.80<br />
TOTAL 53.94 49.64 51.73 45.53 43.70 40.24 126 142<br />
Source: DepEd – <strong>Romblon</strong>, 2011<br />
Legend:<br />
No Classroom Available - Black<br />
More than 56 - Red - Does not meet RA 7880 with severe shortage<br />
51.00-55.99 -Gold - Does not meet RA 7880<br />
46.00-50.99<br />
Less than 46<br />
-Yellow<br />
-Blue<br />
-<br />
-<br />
Fails to meet RA 7880<br />
Meet RA 7880<br />
Page 15 <strong>of</strong> 22<br />
22
<strong>Provincial</strong> Pr<strong>of</strong>ile<br />
PROVINCE PROVINCE OF OF ROMBLON ROMBLON<br />
CY - 2012<br />
Cambalo NHS has no available instructional rooms; Don Carlos MNHS <strong>of</strong> San<br />
Fernando, reveals to have a severe shortage <strong>of</strong> classrooms. Followed by San Agustin NTHS<br />
and Corcuera NHS (Gold), which does not meet RA 7880, and Cajidiocan NHS, Calatrava<br />
NHS, <strong>Romblon</strong> NHS-<strong>Romblon</strong>, Santa Fe NHS and Santa Maria NHS are under Yellow which<br />
fails to meet the RA 7880. All the rest secondary schools meet the RA 7880.<br />
There are 126 instructional rooms that needs major repair and 142 needs minor repair.<br />
Table 5. Elementary Schools instructional rooms that needs repair:<br />
Instructional Rooms Needs<br />
Municipality<br />
Repair<br />
Major Minor Total<br />
ALCANTARA 20 46 66<br />
BANTON 3 29 32<br />
CAJIDIOCAN 24 54 78<br />
CALATRAVA 3 25 28<br />
CONCEPCION 14 17 31<br />
CORCUERA 10 49 59<br />
FERROL 12 18 30<br />
LOOC 24 56 80<br />
MAGDIWANG 15 33 48<br />
ODIONGAN 35 85 120<br />
ROMBLON (Capital) 53 124 177<br />
SAN AGUSTIN 20 34 54<br />
SAN ANDRES 48 18 66<br />
SAN FERNANDO 31 40 71<br />
SAN JOSE 8 25 33<br />
SANTA FE 10 43 53<br />
SANTA MARIA (IMELDA) 11 29 40<br />
Division Total 341 725 1066<br />
Source: DepEd/BEIS, 2011<br />
There are 341 instructional rooms in elementary level that needs major repair and 725<br />
minor repair. In the municipality <strong>of</strong> <strong>Romblon</strong>, there are 53 instructional rooms that needs major<br />
repair and 124 minor repair. Odiongan as the second highest number <strong>of</strong> instructional rooms<br />
that needs repair; 35 for major repair and 85 minor repair.<br />
Page 16 <strong>of</strong> 22<br />
22
<strong>Provincial</strong> Pr<strong>of</strong>ile<br />
PROVINCE PROVINCE OF OF ROMBLON ROMBLON<br />
CY - 2012<br />
e. Transition Rate<br />
Table 7. Transition Rate, SY 2006-2007 to SY 2008-2009<br />
Transition Rate<br />
Municipality<br />
2006-2007 2007-2008 2008-2009<br />
Trend<br />
Analysis<br />
ALCANTARA<br />
Elementary 100.00% 101.53% 97.56% Fluctuating<br />
Secondary 102.82% 104.85% 96.40% Fluctuating<br />
BANTON<br />
Elementary 98.64% 100.00% 100.00% Increasing<br />
Secondary 105.70% 93.98% 115.00% Fluctuating<br />
CAJIDIOCAN<br />
Elementary 94.88% 97.74% 98.88% Increasing<br />
Secondary 124.19% 123.75% 113.79% Decreasing<br />
CALATRAVA<br />
Elementary 98.23% 98.28% 100.00% Increasing<br />
Secondary 88.94% 93.83% 78.07% Fluctuating<br />
CONCEPCION<br />
Elementary 95.41% 96.64% 108.04% Increasing<br />
Secondary 51.67% 51.52% 63.11% Fluctuating<br />
CORCUERA<br />
Elementary 102.47% 97.87% 100.30% Fluctuating<br />
Secondary 84.66% 93.81% 91.01% Fluctuating<br />
FERROL<br />
Elementary 100.52% 94.26% 105.26% Fluctuating<br />
Secondary 60.26% 78.92% 68.45% Fluctuating<br />
LOOC<br />
Elementary 93.15% 91.05% 90.18% Decreasing<br />
Secondary 104.22% 104.31% 103.63% Fluctuating<br />
MAGDIWANG<br />
Elementary 95.70% 101.61% 97.68% Fluctuating<br />
Secondary 103.42% 125.71% 115.32% Fluctuating<br />
ODIONGAN<br />
Elementary 100.88% 100.10% 96.00% Fluctuating<br />
Secondary 74.62% 79.75% 80.21% Increasing<br />
ROMBLON (Capital)<br />
Elementary 92.68% 101.32% 99.26% Fluctuating<br />
Secondary 105.76% 107.87% 103.94% Fluctuating<br />
SAN AGUSTIN<br />
Elementary 95.48% 97.62% 98.69% Increasing<br />
Secondary 85.54% 77.05% 77.18% Fluctuating<br />
SAN ANDRES<br />
Elementary 93.10% 100.82% 96.91% Fluctuating<br />
Secondary 89.21% 74.59% 77.47% Fluctuating<br />
SAN FERNANDO<br />
Elementary 93.19% 103.12% 85.45% Fluctuating<br />
Secondary 70.17% 73.82% 70.40% Fluctuating<br />
SAN JOSE<br />
Elementary 100.92% 97.68% 100.38% Fluctuating<br />
Secondary 92.92% 87.89% 91.09% Fluctuating<br />
SANTA FE<br />
Elementary 104.66% 101.35% 98.43% Decreasing<br />
Secondary 87.57% 92.27% 87.32% Fluctuating<br />
SANTA MARIA (IMELDA)<br />
Elementary 97.63% 106.88% 95.63% Fluctuating<br />
Secondary 82.23% 83.80% 75.69% Fluctuating<br />
Division Total<br />
Elementary 96.69% 99.44% 96.66% Fluctuating<br />
Secondary 91.47% 93.40% 90.20% Fluctuating<br />
Source: DepEd/BEIS, 2009<br />
Page 17 17 <strong>of</strong> 22
<strong>Provincial</strong> Pr<strong>of</strong>ile<br />
PROVINCE PROVINCE OF OF ROMBLON ROMBLON<br />
CY - 2012<br />
IV. Local Economy<br />
Transition rate in the elementary level and secondary level increases from SY 2006-<br />
2007 to 2007-2008 and decreased from 2007-2008 to 2008-2009. Municipalities <strong>of</strong> Banton,<br />
Cajidiocan, Calatrava, Concepcion and San Agustin had an increasing trend <strong>of</strong><br />
transition rate in elementary level while the municipalities <strong>of</strong> Looc and Sta. Fe had a<br />
decreasing trend. In secondary level there is no municipality that has an increasing trend while<br />
only Cajidiocan had a decreasing trend. All the rest <strong>of</strong> the municipality had a fluctuating trend<br />
both in elementary and secondary level.<br />
Agriculture and Livestock<br />
Agriculture is the main industry in the province. Coconut is the number one crop with a total<br />
planted area <strong>of</strong> 58,270.44 hectares. San Agustin has the most extensive area with coconut plants<br />
followed by <strong>Romblon</strong> and Cajidiocan. Rice is the next crop being produced particularly in Odiongan,<br />
Looc, Cajidiocan and Santa Fe. Other crops grown include root crops, vegetables and fruits.<br />
Odiongan, Banton and Magdiwang have the greatest areas planted with root crops and<br />
correspondingly, with the highest volume <strong>of</strong> production. Vegetable production is mostly for home<br />
consumption and grown in small scale.<br />
Livestock development and poultry production is a viable small scale enterprise for farmers in<br />
the province. The provincial government maintains breeding facilities in strategic locations<br />
provincewide to encourage farmers to engage in livestock and poultry production to augment their<br />
income. Livestock and poultry management training and seminars is provided to interested clients.<br />
Due to the geographical condition <strong>of</strong> the province, crops and livestock production is generally<br />
deficient as compared to the food requirements <strong>of</strong> <strong>Romblon</strong> population. To meet the rice requirements,<br />
<strong>Romblon</strong> relies on imports from the neighboring provinces while vegetables, poultry meat, vegetables<br />
and fruits are supplied mostly by Luzon.<br />
Coastal Marine Resources<br />
Fishing industry can be a major enterprise as <strong>Romblon</strong> is surrounded by bodies <strong>of</strong> water. The<br />
fishing ground <strong>of</strong> <strong>Romblon</strong> is a migratory path <strong>of</strong> fishes from Sulu and Visayan Seas passing Tablas<br />
Strait, Sibuyan Sea and <strong>Romblon</strong> Pass. The waters also abound with demersal fishes due to the coral<br />
reefs surrounding the islands.<br />
Because the province has a great potential for aqua/marine development, the province<br />
implemented a coastal and resource management program. Each municipality established a fish<br />
sanctuary and passed laws on fishery. The use <strong>of</strong> compressor in the municipal waters was regulated<br />
and banned altogether in some municipalities.<br />
Page 18 18 <strong>of</strong> 22
<strong>Provincial</strong> Pr<strong>of</strong>ile<br />
PROVINCE PROVINCE OF OF ROMBLON ROMBLON<br />
CY - 2012<br />
Mineral Resources<br />
Marble is the most significant mineral deposit <strong>of</strong> <strong>Romblon</strong> and is the most renowned product<br />
<strong>of</strong> the province. Based on statistics, <strong>Romblon</strong> is the second biggest provincial marble producer <strong>of</strong> the<br />
country next to Bulacan. <strong>Romblon</strong> marble is <strong>of</strong> very high quality and comes in shades <strong>of</strong> white, green,<br />
pink, red and black. The Mines and Geosciences Bureau has estimated that <strong>Romblon</strong> is endowed<br />
with about 150 million metric tons <strong>of</strong> marble. At current rates <strong>of</strong> extraction, the supply may last for<br />
three more centuries. Tablas Island is also believed to have vast reserves <strong>of</strong> marble.<br />
Marble quarrying and processing are major activities in <strong>Romblon</strong>. Among the most common<br />
marble products are categorized into the following: novelty items (gifts, ashtray, table bars), furniture<br />
(dining tables, baptismal fonts) and construction materials (tiles, balusters, marble chips).<br />
Other mineral resources with considerable quantity include nickel ore and gold mostly to be<br />
found in Sibuyan Island. Gold panning and small scale mining is a lucrative undertaking in the<br />
municipality <strong>of</strong> Magdiwang.<br />
Tourism<br />
<strong>Romblon</strong>’s exotic blend <strong>of</strong> sun, sea and forest, together with its peaceful and friendly people<br />
make it an enchanting destination for nature and adventure travelers. Both local and international<br />
tourists can have their pick <strong>of</strong> diverse and interesting places and activities they can find in our 20<br />
islands and islets. The province has white sand beaches, secret coves and serene islets, waterfalls,<br />
historic sites, old churches and caves believed to be ancient burial sites. Mt. Guiting-Guiting Natural<br />
Park in Sibuyan Island is a famous site for mountain climbing. Moreover, it is a center for plant<br />
diversity and home to many native, endangered and rare and vulnerable birds, mammals and reptiles.<br />
V. Infrastructure/Utilities/Facilities<br />
Road Network<br />
The coastal roads traversing the major islands <strong>of</strong> <strong>Romblon</strong>, Sibuyan and Tablas Island form<br />
the backbone <strong>of</strong> the road network <strong>of</strong> the province. Roughly 70 percent <strong>of</strong> these road networks are<br />
located in Tablas Island. By road category, majority are national roads with total length <strong>of</strong> 311.046<br />
kilometers, followed by provincial roads with 239.005 kilometers. There is no available data for<br />
municipal and barangays roads. By surface type, most <strong>of</strong> the roads were paved by gravel/earth but<br />
portions <strong>of</strong> circumferential roads are paved with concrete and most roads in Poblacion are concrete.<br />
The primary modes <strong>of</strong> land transportation in the province are jeepneys, motorcycles, mini<br />
buses and tricycles that serve inter-municipal movements and linkages. Motorized bancas provide<br />
transport means from island to island. At present, there is an available domestic flight in Tablas Island<br />
for and from Manila three times a week. Roro ships facilitate movement outside the province via the<br />
port <strong>of</strong> Batangas.<br />
Page 19 <strong>of</strong> 22<br />
22
<strong>Provincial</strong> Pr<strong>of</strong>ile<br />
PROVINCE PROVINCE OF OF ROMBLON ROMBLON<br />
CY - 2012<br />
Water Supply<br />
Out <strong>of</strong> seventeen municipalities, fourteen have level three water supply systems serving about<br />
32.57% <strong>of</strong> the total provincial households. Level three has a reservoir with house-to-house<br />
connections. Majority <strong>of</strong> households in the province were serviced by levels II and I water system.<br />
Level l category is a common facility where the community members get their water supply from<br />
shallow wells and deep wells while level 2 has a reservoir with communal faucet. Based on the 2007<br />
CBMS report, the proportion <strong>of</strong> population with access to safe drinking water is 76.28 percent.<br />
Power Supply<br />
Table 8: No. <strong>of</strong> Customers and Level <strong>of</strong> Electrification, 2006-2016 – ROMELCO Franchise Area<br />
Customers 2006 2007 2008 2009 2010 2011 2012 2013 2014 2015 2016<br />
Residential 7,916 8,419 8,814 9,346 9,970 11,095 11,961 12,785 13,624 14,522 15,482<br />
Commercial 706 696 688 693 714 755 778 790 797 812 827<br />
Industrial 6 5 6 6 4 4 5 6 6 7 8<br />
Others 900 928 960 889 836 869 877 879 881 881 883<br />
Public Bldgs. 297 323 340 369 376 405 412 414 416 411 413<br />
Street Lights 603 605 620 520 460 465 465 465 465 470 470<br />
Total Customers Connection 9,528 10,048 10,468 10,934 11,524 12,723 13,621 14,459 15,308 16,221 17,200<br />
Level <strong>of</strong> Electrification<br />
Barangay Level (%) 100% 100% 100% 100% 100% 100% 100% 100% 100% 100% 100%<br />
No. <strong>of</strong> Barangay Energized (On-Grid) 63 63 63 63 63 63 63 63 63 63 63<br />
No. <strong>of</strong> Barangay Energized (Off-Grid) 3 3 3 3 3 3 3 3 3 3 3<br />
Total 66 66 66 66 66 66 66 66 66 66 66<br />
Household Level (%)<br />
No. <strong>of</strong> HH Energized (On-Grid) 7,916 8,419 8,814 9,346 9,970 10,568 11,202 11,986 12,825 13,723 14683<br />
No. <strong>of</strong> HH Energized (Off-Grid & NRE) 75.00 n.a n.a n.a n.a n.a n.a n.a n.a n.a n.a<br />
Source: ROMELCO, 2011<br />
Table 9: No. <strong>of</strong> Customers and Level <strong>of</strong> Electrification, 2006-2016 – TIELCO Franchise Area<br />
Customers 2006 2007 2008 2009 2010 2011 2012 2013 2014 2015 2016<br />
Residential 18,054 18,574 20,042 21,117 22,393 23,676 24,842 26,049 27,100 28,070 29,000<br />
Commercial 807 811 841 879 922 1,002 1,036 1,069 1,102 1,129 1,156<br />
Industrial 90 89 92 87 121 131 134 136 139 141 142<br />
Others 1,701 1,471 1,647 1,701 1,731 1,806 1,761 1,761 1,762 1,762 1,763<br />
Public Bldgs. 551 553 563 528 597 649 603 604 604 604 604<br />
Street Lights 1,150 918 1,084 1,119 1,134 1,157 1,157 1,158 1,158 1,159 1,159<br />
Total Customers Connection 20,652 20,945 22,622 23,784 25,167 26,615 27,772 29,016 30,102 31,102 32,061<br />
Level <strong>of</strong> Electrification<br />
Barangay Level (%) 100% 100% 100% 100% 100% 100% 100% 100% 100% 100% 100%<br />
No. <strong>of</strong> Barangay Energized (On-Grid) 112 112 112 112 112 112 112 112 112 112 112<br />
No. <strong>of</strong> Barangay Energized (Off-Grid) 0 0 0 0 0 0<br />
Total 112 112 112 112 112 112 112 112 112 112 112<br />
Household Level (%)<br />
No. <strong>of</strong> HH Energized (On-Grid) 18054 18574 20042 21117 22393 23362 24390 25414 26431 27356 28286<br />
No. <strong>of</strong> HH Energized (Off-Grid & NRE) n.a n.a n.a n.a n.a n.a n.a n.a n.a n.a<br />
Source: TIELCO, 2011<br />
Page 20 20 <strong>of</strong> 22
<strong>Provincial</strong> Pr<strong>of</strong>ile<br />
PROVINCE PROVINCE OF OF ROMBLON ROMBLON<br />
CY - 2012<br />
Telecommunications<br />
The province has several operating telecommunication exchanges, namely: Kayumanggi,<br />
<strong>Romblon</strong>tel, Odiongan Telephone Corporation (OTELCO), the Telecommunication Office (TELOF),<br />
Telegram System, Liberty Phone, Public Calling Stations under the DOTC and the <strong>Provincial</strong><br />
Communication System (PCS) radio transceivers and receivers. SMART and GLOBE<br />
telecommunications have relay stations in the three urban centers <strong>of</strong> <strong>Romblon</strong>, Odiongan and<br />
Cajidiocan. Most areas province wide is already connected through cell phones except on some<br />
places were the signal is weak or non-existent because <strong>of</strong> towering maintains that block the signal.<br />
The triple peak in Sta. Maria has a relay station for GMA, PLDT and Liberty Phones.<br />
VI. Local Institutional Capability<br />
<strong>Romblon</strong> has been reclassified as a third class province as <strong>of</strong> CY 2002. A lone congressional district,<br />
it is made up <strong>of</strong> 17 municipalities and 219 barangays. Hereunder are the municipalities, the number <strong>of</strong><br />
barangays and income classification.<br />
1. <strong>Romblon</strong> – 3 rd class, the capital town comprising 31 barangays<br />
2. Alcantara – 5 th class municipality with 12 barangays<br />
3. Banton – 5th class municipality with 17 barangays<br />
4. Cajidiocan – 4 th class municipality with 14 barangays<br />
5. Calatrava – 5 th class municipality with 7 barangays<br />
6. Concepcion – 6 th class municipality with 9 barangays<br />
7. Corcuera – 5 th class municipality with 15 barangays<br />
8. Ferrol – 6 th class municipality with 6 barangays<br />
9. Looc – 4 th class municipality with 12 barangays<br />
10. Magdiwang – 5 th class municipality with 9 barangays<br />
11. Odiongan – 2 nd class municipality with 25 barangays<br />
12. San Agustin – 4 th class municipality with 15 barangays<br />
13. San Andres – 5 th class municipality with 13 barangays<br />
14. San Fernando – 4 th class municipality with 12 barangays<br />
15. San Jose – 6 th class municipality with 5 barangays<br />
16. Santa Fe – 5 th class municipality with 11 barangays<br />
17. Santa Maria – 5 th class municipality with 6 barangays<br />
There are several banking facilities in the municipalities <strong>of</strong> Odiongan and <strong>Romblon</strong>. Rural banks<br />
facilitate loans and savings account in the other municipalities without commercial banks such as in the<br />
municipalities <strong>of</strong> San Agustin, Looc, Alcantara, Santa Fe, Cajidiocan and San Fernando.<br />
Based on the latest report from the <strong>Romblon</strong> Police Office, the province is considered one <strong>of</strong> the most<br />
peaceful in the country with a minimal volume <strong>of</strong> crimes. It has maintained the peace and tranquility <strong>of</strong> the<br />
place and never contributed to the destabilization <strong>of</strong> the country. The local communist movement is hardly felt<br />
in any part <strong>of</strong> the province with no atrocity committed against government personnel or establishment.<br />
Syndicated crime groups and criminal gangs continue to be non-existent ant crime incidents are more <strong>of</strong>ten<br />
non-index crimes.<br />
Page 21 <strong>of</strong> 22<br />
22
<strong>Provincial</strong> Pr<strong>of</strong>ile<br />
PROVINCE PROVINCE OF OF ROMBLON ROMBLON<br />
CY - 2012<br />
Legend:<br />
– 1 st District<br />
– 2 nd District<br />
Map <strong>of</strong> <strong>Romblon</strong> Province<br />
Page 22 <strong>of</strong> 22<br />
22