Wind Energy Resource Atlas of the Philippines - NREL
Wind Energy Resource Atlas of the Philippines - NREL
Wind Energy Resource Atlas of the Philippines - NREL

You also want an ePaper? Increase the reach of your titles
YUMPU automatically turns print PDFs into web optimized ePapers that Google loves.
February 2001 • <strong>NREL</strong>/TP-500-26129<br />
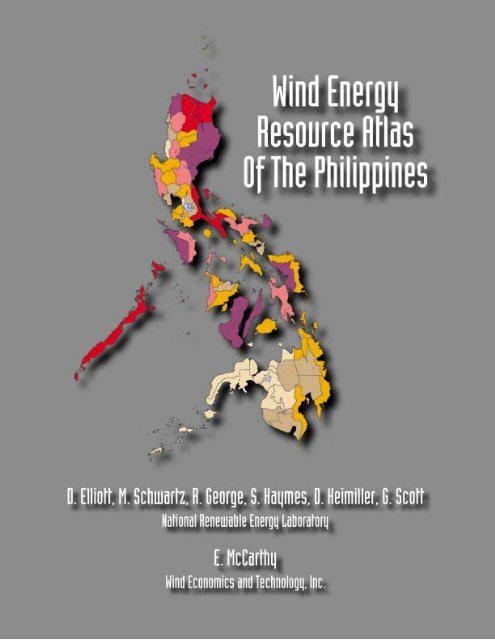
<strong>Wind</strong> <strong>Energy</strong> <strong>Resource</strong> <strong>Atlas</strong> <strong>of</strong> <strong>the</strong><br />
<strong>Philippines</strong><br />
D. Elliott, M. Schwartz, R. George, S. Haymes,<br />
D. Heimiller, G. Scott<br />
National Renewable <strong>Energy</strong> Laboratory<br />
617 Cole Boulevard<br />
Golden, Colorado 80401-3393<br />
<strong>NREL</strong> is a U.S. Department <strong>of</strong> <strong>Energy</strong> Laboratory<br />
Operated by Midwest Research Institute • Battelle • Bechtel<br />
Contract No. DE-AC36-99-GO10337
NOTICE<br />
This report was prepared as an account <strong>of</strong> work sponsored by an agency <strong>of</strong> <strong>the</strong> United States<br />
government. Nei<strong>the</strong>r <strong>the</strong> United States government nor any agency <strong>the</strong>re<strong>of</strong>, nor any <strong>of</strong> <strong>the</strong>ir employees,<br />
makes any warranty, express or implied, or assumes any legal liability or responsibility for <strong>the</strong> accuracy,<br />
completeness, or usefulness <strong>of</strong> any information, apparatus, product, or process disclosed, or represents<br />
that its use would not infringe privately owned rights. Reference herein to any specific commercial<br />
product, process, or service by trade name, trademark, manufacturer, or o<strong>the</strong>rwise does not necessarily<br />
constitute or imply its endorsement, recommendation, or favoring by <strong>the</strong> United States government or any<br />
agency <strong>the</strong>re<strong>of</strong>. The views and opinions <strong>of</strong> authors expressed herein do not necessarily state or reflect<br />
those <strong>of</strong> <strong>the</strong> United States government or any agency <strong>the</strong>re<strong>of</strong>.<br />
Available electronically at http://www.doe.gov/bridge<br />
Available for a processing fee to U.S. Department <strong>of</strong> <strong>Energy</strong><br />
and its contractors, in paper, from:<br />
U.S. Department <strong>of</strong> <strong>Energy</strong><br />
Office <strong>of</strong> Scientific and Technical Information<br />
P.O. Box 62<br />
Oak Ridge, TN 37831-0062<br />
phone: 865.576.8401<br />
fax: 865.576.5728<br />
email: reports@adonis.osti.gov<br />
Available for sale to <strong>the</strong> public, in paper, from:<br />
U.S. Department <strong>of</strong> Commerce<br />
National Technical Information Service<br />
5285 Port Royal Road<br />
Springfield, VA 22161<br />
phone: 800.553.6847<br />
fax: 703.605.6900<br />
email: orders@ntis.fedworld.gov<br />
online ordering: http://www.ntis.gov/ordering.htm<br />
Printed on paper containing at least 50% wastepaper, including 20% postconsumer waste
Table <strong>of</strong> Contents<br />
LIST OF TABLES ………………………………………………………………………………………. IV<br />
LIST OF FIGURES ………………………………………………………………………………………. V<br />
EXECUTIVE SUMMARY ……………………………………………………………………………. VIII<br />
1.0 INTRODUCTION …………………………………………………………………………………….. 1<br />
2.0 GEOGRAPHY AND CLIMATE OF THE PHILIPPINES ………………………………………… 2<br />
2.1 GEOGRAPHY ......................................................................................................................................... 2<br />
2.2 CLIMATE............................................................................................................................................... 2<br />
3.0 WIND RESOURCE INFORMATION ………………………………………………………………. 5<br />
3.1 INTRODUCTION ..................................................................................................................................... 5<br />
3.2 SURFACE DATA..................................................................................................................................... 5<br />
3.2.1 PAGASA ....................................................................................................................................... 5<br />
3.2.2 National Power Corporation........................................................................................................ 5<br />
3.2.3 DATSAV2 ..................................................................................................................................... 7<br />
3.2.4 Marine Climatic <strong>Atlas</strong> <strong>of</strong> <strong>the</strong> World ............................................................................................. 7<br />
3.2.5 Special Sensor Microwave Imager (SSMI)................................................................................... 7<br />
3.3 UPPER-AIR DATA.................................................................................................................................. 7<br />
3.3.1 Automated Data Processing Reports (ADP) ................................................................................ 8<br />
3.3.2 Global Gridded Upper-Air Statistics............................................................................................ 8<br />
3.4 DATA SCREENING ................................................................................................................................. 8<br />
3.5 WEIBULL DISTRIBUTION FUNCTION...................................................................................................... 9<br />
3.6 WIND POWER DENSITY......................................................................................................................... 9<br />
3.7 WIND SHEAR AND THE POWER LAW................................................................................................... 10<br />
4.0 WIND RESOURCE ASSESSMENT AND MAPPING METHODOLOGY …………………….. 12<br />
4.1 INTRODUCTION ................................................................................................................................... 12<br />
4.2 DESCRIPTION OF MAPPING SYSTEM.................................................................................................... 12<br />
4.2.1 Input Data .................................................................................................................................. 12<br />
4.2.2 <strong>Wind</strong> Power Calculations........................................................................................................... 13<br />
4.2.3 Mapping Products ...................................................................................................................... 13<br />
4.3 LIMITATIONS OF MAPPING TECHNIQUE .............................................................................................. 14<br />
5.0 WIND RESOURCE CHARACTERISTICS OF THE PHILIPPINES …………………………... 15<br />
5.1 INTRODUCTION ................................................................................................................................... 15<br />
5.2 SURFACE DATA................................................................................................................................... 15<br />
5.2.1 PAGASA ..................................................................................................................................... 15<br />
5.2.2 National Power Corporation...................................................................................................... 20<br />
5.2.3 DATSAV2 ................................................................................................................................... 24<br />
5.3 UPPER-AIR DATA................................................................................................................................25<br />
5.4 SATELLITE OCEAN WIND DATA.......................................................................................................... 26<br />
5.5 WIND RESOURCE DISTRIBUTION AND CHARACTERISTICS................................................................... 35<br />
5.5.1 Annual <strong>Wind</strong> <strong>Resource</strong> Distribution........................................................................................... 35<br />
5.5.2 Seasonal <strong>Wind</strong> <strong>Resource</strong> Distribution........................................................................................ 35<br />
5.5.3 Diurnal <strong>Wind</strong> Speed Distribution............................................................................................... 36<br />
5.5.4 <strong>Wind</strong> Direction Frequency Distribution.....................................................................................37<br />
6.0 WIND MAPPING AND IDENTIFICATION OF RESOURCE AREAS……………………….... 38<br />
6.1 INTRODUCTION ................................................................................................................................... 38<br />
6.2 WIND POWER CLASSIFICATIONS......................................................................................................... 38<br />
ii
6.3 APPROACH.......................................................................................................................................... 38<br />
6.4 MAPPING REGIONS ............................................................................................................................. 39<br />
6.5 MAPPING RESULTS ............................................................................................................................. 39<br />
6.5.1 Batanes and Babuyan................................................................................................................. 39<br />
6.5.2 Nor<strong>the</strong>rn Luzon .......................................................................................................................... 40<br />
6.5.3 Central Luzon............................................................................................................................. 40<br />
6.5.4 Mindoro, Sou<strong>the</strong>rn Luzon, Romblon, and Marinduque.............................................................. 41<br />
6.5.5 Sou<strong>the</strong>astern Luzon, Catanduanes and Masbate........................................................................ 42<br />
6.5.6 Samar and Leyte......................................................................................................................... 43<br />
6.5.7 Panay, Negros, Cebu, and Siquijor............................................................................................ 43<br />
6.5.8 Nor<strong>the</strong>rn Mindanao and Bohol .................................................................................................. 44<br />
6.5.9 Sou<strong>the</strong>rn Mindanao .................................................................................................................... 45<br />
6.5.10 Western Mindanao and Basilan ............................................................................................... 45<br />
6.5.11 Nor<strong>the</strong>rn Palawan .................................................................................................................... 45<br />
6.5.12 Sou<strong>the</strong>rn Palawan .................................................................................................................... 46<br />
6.5.13 Sulu, Basilan, and Tawi-Tawi .................................................................................................. 46<br />
7.0 WIND ELECTRIC POTENTIAL…………………………………………………………………... 87<br />
7.1 INTRODUCTION ................................................................................................................................... 87<br />
7.2 WIND ELECTRIC POTENTIAL ESTIMATES ............................................................................................ 87<br />
REFERENCES …………………………………………………………………………………………... 91<br />
APPENDIX A DATA SUMMARIES—NATIONAL POWER CORPORATION SITES<br />
APPENDIX B ANALYSIS SUMMARIES—SELECTED SITES FROM DATSAV2 DATA<br />
FILES<br />
APPENDIX C ANALYSIS SUMMARIES—UPPER-AIR STATIONS<br />
APPENDIX D WIND SPEED AND WIND POWER DENSITY COMPUTED FROM<br />
SATELLITE OCEAN WIND DATA<br />
iii
List <strong>of</strong> Tables<br />
TABLE S-1 WIND POWER CLASSIFICATION.......................................................................................IX<br />
TABLE 4-1 WIND POWER CLASSIFICATION...................................................................................... 14<br />
TABLE 5-1 LIST OF SYNOPTIC STATIONS PROVIDED BY PAGASA................................................. 16<br />
TABLE 5-2 WIND MONITORING SITES FOR NATIONAL POWER CORPORATION ............................. 22<br />
TABLE 5-3 AVERAGE WIND SPEED (M/S) AND POWER (W/M2) ....................................................... 22<br />
TABLE 5-4 PHILIPPINES’ STATIONS FROM DATSAV2 FILES.......................................................... 27<br />
TABLE 6-1 WIND POWER CLASSIFICATION...................................................................................... 38<br />
TABLE 7-1 PHILIPPINES - WIND ELECTRIC POTENTIAL.................................................... 88<br />
iv
List <strong>of</strong> Figures<br />
FIGURE 2.1 PHILIPPINES—POLITICAL BASE MAP.................................................................................. 3<br />
FIGURE 2.2 ELEVATION MAP................................................................................................................. 4<br />
FIGURE 3.1 PHILIPPINES—GTS METEOROLOGICAL STATIONS WITH SURFACE WIND DATA................ 6<br />
FIGURE 5.1 PHILIPPINES—PAGASA METEOROLOGICAL STATIONS WITH SURFACE WIND DATA ..... 17<br />
FIGURE 5.2 SURFACE AIR FLOW (JANUARY) IN THE PHILIPPINES ........................................................ 18<br />
FIGURE 5.3 SURFACE AIR FLOW (JULY) IN THE PHILIPPINES ............................................................... 19<br />
FIGURE 5.4 GENERAL LOCATION OF THE NATIONAL POWER CORPORATION MONITORING SITES IN<br />
THE PHILIPPINES................................................................................................................ 21<br />
FIGURE 5.5 MONTHLY WIND SPEED AND POWER—PAGALI................................................................ 23<br />
FIGURE 5.6 MONTHLY WIND SPEED AND POWER—SAGADA .............................................................. 24<br />
FIGURE 5.7 MONTHLY WIND SPEED AND POWER—GUIMARAS ISLAND.............................................. 24<br />
FIGURE 5.8 PHILIPPINES—GTS METEOROLOGICAL STATIONS WITH UPPER-AIR WIND DATA............ 29<br />
FIGURE 5.9 PHILIPPINES—ANNUAL WIND SPEED (1988-94) COMPUTED FROM SATELLITE OCEAN<br />
WIND DATA. ..................................................................................................................... 30<br />
FIGURE 5.10 PHILIPPINES—ANNUAL WIND POWER DENSITY (1988-94) COMPUTED FROM SATELLITE<br />
OCEAN WIND DATA.......................................................................................................... 31<br />
FIGURE 5.11 PHILIPPINES—ANNUAL WEIBULL K-VALUE COMPUTED FROM SATELLITE OCEAN WIND<br />
DATA. ...............................................................................................................................32<br />
FIGURE 5.12 PHILIPPINES—SATELLITE OCEAN WIND DATA PLOTS OF MONTHLY WIND SPEED (M/S).. 33<br />
FIGURE 5.13 PHILIPPINES—SATELLITE OCEAN WIND DATA PLOTS OF MONTHLY WIND POWER (W/M2).<br />
.......................................................................................................................................... 34<br />
FIGURE 6.1 KEY TO THE REGION MAPS ............................................................................................... 47<br />
FIGURE 6.2 BATANES AND BABUYAN—POLITICAL BASE MAP ........................................................... 48<br />
FIGURE 6.3 BATANES AND BABUYAN—ELEVATION MAP................................................................... 49<br />
FIGURE 6.4 BATANES AND BABUYAN – MAP OF FAVORABLE WIND RESOURCE AREAS ..................... 50<br />
FIGURE 6.5 NORTHERN LUZON – POLITICAL BASE MAP ..................................................................... 51<br />
FIGURE 6.6 NORTHERN LUZON – ELEVATION MAP ............................................................................. 52<br />
FIGURE 6.7 NORTHERN LUZON – MAP OF FAVORABLE WIND RESOURCE AREAS ............................... 53<br />
FIGURE 6.8 CENTRAL LUZON – POLITICAL BASE MAP ........................................................................ 54<br />
v
FIGURE 6.9 CENTRAL LUZON – ELEVATION MAP................................................................................ 55<br />
FIGURE 6.10 CENTRAL LUZON – MAP OF FAVORABLE WIND RESOURCE AREAS .................................. 56<br />
FIGURE 6.11 MINDORO, SOUTHERN LUZON, ROMBLON, AND MARINDUQUE –<br />
POLITICAL BASE MA......................................................................................................... 57<br />
FIGURE 6.12 MINDORO, SOUTHERN LUZON, ROMBLON, AND MARINDUQUE – ELEVATION MAP ......... 58<br />
FIGURE 6.13 MINDORO, SOUTHERN LUZON, ROMBLON, AND MARINDUQUE – MAP OF FAVORABLE<br />
WIND RESOURCE AREAS................................................................................................... 59<br />
FIGURE 6.14 SOUTHEASTERN LUZON, CATANDUANES, MASBATE – POLITICAL BASE MAP.................. 60<br />
FIGURE 6.15 SOUTHEASTERN LUZON, CATANDUANES, MASBATE – ELEVATION MAP.......................... 61<br />
FIGURE 6.16 SOUTHEASTERN LUZON, CATANDUANES, MASBATE – MAP OF FAVORABLE WIND<br />
RESOURCE AREAS............................................................................................................. 62<br />
FIGURE 6.17 SAMAR AND LEYTE – POLITICAL BASE MAP..................................................................... 63<br />
FIGURE 6.18 SAMAR AND LEYTE – ELEVATION MAP ............................................................................ 64<br />
FIGURE 6.19 SAMAR AND LEYTE – MAP OF FAVORABLE WIND RESOURCE AREAS............................... 65<br />
FIGURE 6.20 PANAY, NEGROS, CEBU, AND SIQUIJOR – POLITICAL BASE MAP ..................................... 66<br />
FIGURE 6.21 PANAY, NEGROS, CEBU, AND SIQUIJOR – ELEVATION MAP ............................................. 67<br />
FIGURE 6.22 PANAY, NEGROS, CEBU, AND SIQUIJOR – MAP OF FAVORABLE WIND RESOURCE AREAS 68<br />
FIGURE 6.23 NORTHERN MINDANAO AND BOHOL – POLITICAL BASE MAP .......................................... 69<br />
FIGURE 6.24 NORTHERN MINDANAO AND BOHOL – ELEVATION MAP .................................................. 70<br />
FIGURE 6.25 NORTHERN MINDANAO AND BOHOL – MAP OF FAVORABLE WIND RESOURCE AREAS .... 71<br />
FIGURE 6.26 SOUTHERN MINDANAO – POLITICAL BASE MAP............................................................... 72<br />
FIGURE 6.27 SOUTHERN MINDANAO – ELEVATION MAP....................................................................... 73<br />
FIGURE 6.28 SOUTHERN MINDANAO – MAP OF FAVORABLE WIND RESOURCE AREAS......................... 74<br />
FIGURE 6.29 WESTERN MINDANAO AND BASILAN – POLITICAL BASE MAP.......................................... 75<br />
FIGURE 6.30 WESTERN MINDANAO AND BASILAN – ELEVATION MAP ................................................. 76<br />
FIGURE 6.31 WESTERN MINDANAO AND BASILAN – MAP OF FAVORABLE WIND RESOURCE AREAS.... 77<br />
FIGURE 6.32 NORTH PALAWAN – POLITICAL BASE MAP....................................................................... 78<br />
FIGURE 6.33 NORTH PALAWAN – ELEVATION MAP .............................................................................. 79<br />
FIGURE 6.34 NORTH PALAWAN – MAP OF FAVORABLE WIND RESOURCE AREAS................................. 80<br />
vi
FIGURE 6.35 SOUTH PALAWAN – POLITICAL BASE MAP ....................................................................... 81<br />
FIGURE 6.36 SOUTH PALAWAN – ELEVATION MAP............................................................................... 82<br />
FIGURE 6.37 SOUTH PALAWAN – MAP OF FAVORABLE WIND RESOURCE AREAS ................................. 83<br />
FIGURE 6.38 SULU, BASILAN, AND TAWI-TAWI – POLITICAL BASE MAP.............................................. 84<br />
FIGURE 6.39 SULU, BASILAN, AND TAWI-TAWI – ELEVATION MAP...................................................... 85<br />
FIGURE 6.40 SULU, BASILAN, AND TAWI-TAWI – MAP OF FAVORABLE WIND RESOURCE AREAS........ 86<br />
FIGURE 7.1 PHILIPPINES – WIND ELECTRIC POTENTIAL - GOOD TO EXCELLENT WIND RESOURCE<br />
(UTILITY SCALE APPLICATIONS)....................................................................................... 89<br />
FIGURE 7.2 PHILIPPINES – WIND ELECTRIC POTENTIAL – MODERATE TO EXCELLENT WIND<br />
RESOURCE (UTILITY SCALE APPLICATION)....................................................................... 90<br />
vii
Executive Summary<br />
We conducted a wind resource analysis and mapping study for <strong>the</strong> Philippine archipelago to<br />
identify potential wind resource areas and to quantify <strong>the</strong> value <strong>of</strong> that resource within those<br />
areas. This is a major study and <strong>the</strong> first <strong>of</strong> its kind undertaken for <strong>the</strong> <strong>Philippines</strong>. The key to<br />
<strong>the</strong> successful completion <strong>of</strong> <strong>the</strong> study is an automated wind resource mapping program recently<br />
developed at <strong>the</strong> National Renewable <strong>Energy</strong> Laboratory (<strong>NREL</strong>).<br />
The wind resource mapping program uses an advanced computerized mapping system known as<br />
<strong>the</strong> Geographic Information System (GIS). The two primary inputs to <strong>the</strong> mapping system are<br />
gridded 1-square kilometer (km 2 ) terrain data and meteorological data. The meteorological data<br />
sources include surface (land and open-ocean) and upper-air data sets. These data are screened to<br />
select representative stations and data periods for use in <strong>the</strong> mapping system. The final<br />
meteorological inputs to <strong>the</strong> mapping system are vertical wind pr<strong>of</strong>ile(s), wind power rose(s) (<strong>the</strong><br />
percentage <strong>of</strong> total potential power from <strong>the</strong> wind by direction sector), and <strong>the</strong> open-ocean wind<br />
power density, where appropriate. The GIS determines any required adjustments to <strong>the</strong>se<br />
composite distributions for each 1-km 2 grid cell. The factors that have <strong>the</strong> greatest influence on<br />
<strong>the</strong> adjustment for a particular grid cell are <strong>the</strong> topography in <strong>the</strong> vicinity and a combination <strong>of</strong><br />
<strong>the</strong> absolute and relative elevation <strong>of</strong> <strong>the</strong> grid cell. The primary output <strong>of</strong> <strong>the</strong> mapping system is a<br />
color-coded map containing <strong>the</strong> estimated wind power, and equivalent wind speed, for each<br />
individual grid cell.<br />
To portray <strong>the</strong> mapping results, <strong>the</strong> Philippine archipelago was divided into 13 regions. Each<br />
region is approximately 300 km by 300 km. The regional divisions were determined principally<br />
on <strong>the</strong> geography <strong>of</strong> <strong>the</strong> archipelago and <strong>the</strong> desire to maintain <strong>the</strong> same map scale for each<br />
region. Surface, satellite, and upper-air data were assembled, processed, and analyzed. These<br />
data sets included information provided by <strong>the</strong> Philippine Atmospheric, Geophysical, and<br />
Astronomical Services Administration (PAGASA), <strong>the</strong> Philippine National Power Corporation<br />
(NPC), data sets from <strong>the</strong> United States National Climatic Data Center (NCDC), and o<strong>the</strong>r U.S.<br />
data. The satellite data sets <strong>of</strong> calculated wind speed at 10-meter (m) heights over ocean areas<br />
were extremely useful in this analysis because <strong>of</strong> <strong>the</strong> large expanse <strong>of</strong> ocean surrounding <strong>the</strong><br />
archipelago and <strong>the</strong> limited number and value <strong>of</strong> land-based observations. The mapping system<br />
was applied to each <strong>of</strong> <strong>the</strong>se 13 regions, and <strong>the</strong> wind resource maps for each region were<br />
generated.<br />
A combination <strong>of</strong> wind characteristics helps determine <strong>the</strong> wind energy resource in a particular<br />
area. Factors such as <strong>the</strong> annual and monthly average wind speeds and <strong>the</strong> seasonal and diurnal<br />
wind patterns affect <strong>the</strong> suitability <strong>of</strong> an area. In general, locations with an annual average wind<br />
speed <strong>of</strong> 6.5 to 7.0 meters per second (m/s) or greater at turbine hub height, are <strong>the</strong> most suitable<br />
for utility grid-connected wind energy systems. Rural power applications are typically viable at<br />
lower wind speeds (5.5 to 6.0 m/s), and, in some cases, at wind speeds as low as 4.5 m/s.<br />
The average wind speed is not <strong>the</strong> best indicator <strong>of</strong> <strong>the</strong> resource. Instead, <strong>the</strong> level <strong>of</strong> <strong>the</strong> wind<br />
resource is <strong>of</strong>ten defined in terms <strong>of</strong> <strong>the</strong> wind-power-density value, expressed in watts per square<br />
meter (W/m 2 ). This value incorporates <strong>the</strong> combined effects <strong>of</strong> <strong>the</strong> wind speed frequency<br />
distribution, <strong>the</strong> dependence <strong>of</strong> <strong>the</strong> wind power on air density, and <strong>the</strong> cube <strong>of</strong> <strong>the</strong> wind speed.<br />
Thus, six wind power classifications, based on ranges <strong>of</strong> wind-power-density values, were<br />
established in each <strong>of</strong> two categories: one for utility-scale applications (ranging from marginal to<br />
viii
excellent) and one for rural power applications (ranging from moderate to excellent). This<br />
classification scheme is presented in Table S-1.<br />
Class <strong>Resource</strong> Potential<br />
Utility Rural<br />
Table S-1. <strong>Wind</strong> Power Classification<br />
<strong>Wind</strong> Power<br />
Density (W/m 2 )<br />
@ 30 m<br />
ix<br />
<strong>Wind</strong> Speed (a)<br />
(m/s) @ 30 m<br />
1 Marginal Moderate 100 – 200 4.4 – 5.6<br />
2 Moderate Good 200 – 300 5.6 – 6.4<br />
3 Good Excellent 300 – 400 6.4 – 7.0<br />
4 Excellent Excellent 400 – 600 7.0 – 8.0<br />
5 Excellent Excellent 600 – 800 8.0 – 8.8<br />
6 Excellent Excellent 800 – 1200 8.8 – 10.1<br />
(a) Mean wind speed is estimated assuming a Weibull distribution <strong>of</strong> wind speeds with a shape factor (k) <strong>of</strong> 2.0 and<br />
standard sea-level air density. The actual mean wind speed may differ from <strong>the</strong>se estimated values by as much as<br />
20 percent, depending on <strong>the</strong> actual wind speed distribution (or Weibull k value) and <strong>the</strong> elevation above sea level.<br />
The wind resource in <strong>the</strong> <strong>Philippines</strong> is strongly dependent on latitude, elevation, and proximity<br />
to <strong>the</strong> coastline. In general, <strong>the</strong> best wind resource is in <strong>the</strong> north and nor<strong>the</strong>ast, and <strong>the</strong> worst<br />
resource is in <strong>the</strong> south and southwest <strong>of</strong> <strong>the</strong> archipelago.<br />
The wind mapping results show many areas <strong>of</strong> good-to-excellent wind resource for utility-scale<br />
applications or excellent wind resource for village power applications, particularly in <strong>the</strong> nor<strong>the</strong>rn<br />
and central regions <strong>of</strong> <strong>the</strong> <strong>Philippines</strong>. The best wind resources are found in six regions: (1) <strong>the</strong><br />
Batanes and Babuyan islands north <strong>of</strong> Luzon; (2) <strong>the</strong> northwest tip <strong>of</strong> Luzon (Ilocos Norte); (3)<br />
<strong>the</strong> higher interior terrain <strong>of</strong> Luzon, Mindoro, Samar, Leyte, Panay, Negros, Cebu, Palawan,<br />
eastern Mindanao, and adjacent islands; (4) well-exposed east-facing coastal locations from<br />
nor<strong>the</strong>rn Luzon southward to Samar; (5) <strong>the</strong> wind corridors between Luzon and Mindoro<br />
(including Lubang Island); and (6) between Mindoro and Panay (including <strong>the</strong> Semirara Islands<br />
and extending to <strong>the</strong> Cuyo Islands).<br />
More than 10,000 km 2 <strong>of</strong> windy land areas are estimated to exist with good-to-excellent wind<br />
resource potential. Using conservative assumptions <strong>of</strong> about 7 MW per km 2 , this windy land<br />
could support more than 70,000 MW <strong>of</strong> potential installed capacity. Considering only <strong>the</strong> areas<br />
<strong>of</strong> good-to-excellent wind resource, <strong>the</strong>re are 47 provinces out <strong>of</strong> 73 with at least 500 MW <strong>of</strong><br />
wind potential and 25 provinces with at least 1,000 MW <strong>of</strong> wind potential. However, to<br />
accurately assess <strong>the</strong> wind electric potential will require additional studies, considering such<br />
factors as <strong>the</strong> existing transmission grid and accessibility.<br />
The wind mapping results also show numerous additional areas <strong>of</strong> moderate wind resource for<br />
utility-scale applications or good wind resource for village power applications. If <strong>the</strong>se additional<br />
areas are considered, <strong>the</strong> estimated total land area increases to more than 25,000 km 2 . Using<br />
conservative assumptions <strong>of</strong> about 7 MW per km 2 , this land could support more than 170,000<br />
MW <strong>of</strong> potential installed capacity. On a provincial basis, <strong>the</strong>re are 51 provinces out <strong>of</strong> 73 with<br />
at least 1,000 MW <strong>of</strong> wind potential and 64 provinces with at least 500 MW <strong>of</strong> wind potential.<br />
The seasons have a pronounced effect on <strong>the</strong> wind resource. The best resource is in <strong>the</strong> winter<br />
during <strong>the</strong> nor<strong>the</strong>ast monsoon, and <strong>the</strong> poorest resource is in <strong>the</strong> summer during <strong>the</strong> southwest<br />
monsoon. Throughout most <strong>of</strong> <strong>the</strong> <strong>Philippines</strong>, <strong>the</strong> highest wind resource occurs from November
through February, and <strong>the</strong> lowest from April to September. However, <strong>the</strong>re are some regional<br />
differences in <strong>the</strong> seasonal variability. For example, in <strong>the</strong> nor<strong>the</strong>rn <strong>Philippines</strong>, <strong>the</strong> months with<br />
<strong>the</strong> highest wind resource are October through February; and in much <strong>of</strong> <strong>the</strong> central and sou<strong>the</strong>rn<br />
<strong>Philippines</strong>, November through March are <strong>the</strong> months with <strong>the</strong> highest wind resource. Two areas<br />
<strong>of</strong> <strong>the</strong> <strong>Philippines</strong> (<strong>the</strong> sou<strong>the</strong>astern Mindanao coast and <strong>the</strong> western coast <strong>of</strong> Palawan) have a<br />
relatively high wind resource from June through September during <strong>the</strong> southwest monsoon.<br />
The wind resource maps and o<strong>the</strong>r wind resource characteristic information will be useful in<br />
identifying prospective areas for wind-energy applications. However, very limited data <strong>of</strong><br />
sufficient quality were available to validate <strong>the</strong> wind resource estimates. Therefore, we strongly<br />
recommend that wind measurement programs be conducted to validate <strong>the</strong> resource estimates and<br />
to refine <strong>the</strong> wind maps and assessment methods where necessary.<br />
x
1.0 Introduction<br />
1<br />
<strong>Wind</strong> <strong>Energy</strong> <strong>Resource</strong><br />
<strong>Atlas</strong> <strong>of</strong> <strong>the</strong> <strong>Philippines</strong><br />
Upon learning <strong>of</strong> <strong>the</strong> National Renewable <strong>Energy</strong> Laboratory’s (<strong>NREL</strong>) capability in regional- or<br />
national-scale wind energy resource assessment, <strong>the</strong> Winrock International <strong>Philippines</strong><br />
Renewable <strong>Energy</strong> Project Support Office (REPSO) and Preferred <strong>Energy</strong>, Inc. (PEI), worked<br />
with o<strong>the</strong>r interested parties in <strong>the</strong> <strong>Philippines</strong> to propose and fund <strong>the</strong> development <strong>of</strong> a nationallevel<br />
<strong>Wind</strong> <strong>Energy</strong> <strong>Resource</strong> <strong>Atlas</strong>. The Philippine Council for Industry and <strong>Energy</strong> Research<br />
and Development (PCIERD), <strong>of</strong> <strong>the</strong> Department <strong>of</strong> Science and Technology (DOST), and <strong>the</strong><br />
<strong>Philippines</strong> National Oil Company (PNOC) each provided funding for <strong>the</strong> study through Winrock<br />
International. The U.S. Department <strong>of</strong> <strong>Energy</strong> (DOE) provided significant funding for <strong>the</strong><br />
development <strong>of</strong> <strong>the</strong> <strong>Wind</strong> <strong>Energy</strong> <strong>Resource</strong> <strong>Atlas</strong>, and <strong>the</strong> U.S. Agency for International<br />
Development (USAID) supported <strong>the</strong> overall coordination and data ga<strong>the</strong>ring for <strong>the</strong> <strong>Wind</strong> <strong>Atlas</strong><br />
development effort. The project was intended to facilitate and accelerate <strong>the</strong> use <strong>of</strong> wind energy<br />
technologies—both for utility-scale generation and <strong>of</strong>f-grid wind energy applications—in <strong>the</strong><br />
<strong>Philippines</strong>, by providing <strong>the</strong> best possible estimates <strong>of</strong> wind energy resources over <strong>the</strong> entire<br />
national territory. The <strong>Philippines</strong> National Power Corporation (NPC) supported <strong>the</strong> project by<br />
contributing wind-monitoring data collected at 14 prospective wind energy sites and by providing<br />
o<strong>the</strong>r technical assistance.<br />
Winrock International and REPSO had <strong>the</strong> lead responsibility in administering this project and in<br />
collaborating with <strong>the</strong> Philippine organizations and <strong>NREL</strong> on project activities. <strong>NREL</strong> had <strong>the</strong><br />
technical lead for <strong>the</strong> wind resource analysis and mapping activities. The primary goal was to<br />
develop detailed wind resource maps for all regions <strong>of</strong> <strong>the</strong> <strong>Philippines</strong> and to produce a<br />
comprehensive wind-resource atlas documenting <strong>the</strong> mapping results.<br />
This document, <strong>the</strong> “<strong>Wind</strong> <strong>Energy</strong> <strong>Resource</strong> <strong>Atlas</strong> <strong>of</strong> <strong>the</strong> <strong>Philippines</strong>,” presents <strong>the</strong> wind-resource<br />
analysis and mapping results for <strong>the</strong> <strong>Philippines</strong>. The maps identifying <strong>the</strong> wind resource were<br />
created using a Geographic Information System- (GIS) based program developed at <strong>NREL</strong>. The<br />
mapping program, which combines high-resolution terrain data and formatted meteorological<br />
data, is designed to highlight areas possessing a favorable wind resource where specific wind<br />
energy projects, both for utility-grid applications and rural power applications, are likely to be<br />
feasible. The entire <strong>Philippines</strong> archipelago was mapped as part <strong>of</strong> this study. This is <strong>the</strong> first<br />
detailed national-scale wind energy resource atlas for a developing country, and one <strong>of</strong> <strong>the</strong> very<br />
first in <strong>the</strong> world. In addition to <strong>the</strong> <strong>Philippines</strong>, <strong>NREL</strong> has applied its new wind mapping system<br />
to produce wind resource assessments <strong>of</strong> <strong>the</strong> Dominican Republic (Elliott, 1999) and Mongolia<br />
(Elliott et al., 1998), and specific regions <strong>of</strong> Chile, China, Indonesia, Mexico, and <strong>the</strong> United<br />
States (Schwartz, 1999; Elliott et al., 1999).<br />
The report is divided into six sections. An overview <strong>of</strong> <strong>the</strong> geography and climate <strong>of</strong> <strong>the</strong><br />
<strong>Philippines</strong> is presented in Section 2.0. The wind resource information used to create <strong>the</strong><br />
meteorological input files is highlighted in Section 3.0. A description <strong>of</strong> <strong>the</strong> mapping system is<br />
presented in Section 4.0. The wind resource characteristics <strong>of</strong> <strong>the</strong> <strong>Philippines</strong> and <strong>the</strong> wind<br />
mapping results are presented in Sections 5.0 and 6.0, respectively.<br />
Appendices are included that highlight <strong>the</strong> analysis results from <strong>the</strong> NPC monitoring sites and<br />
selected surface-based sites from <strong>the</strong> DATSAV2 database, summarize data for three <strong>of</strong> <strong>the</strong> upperair<br />
stations, and show maps and monthly summaries <strong>of</strong> wind speed and wind power from <strong>the</strong><br />
satellite ocean wind data.
2.0 Geography and Climate <strong>of</strong> <strong>the</strong> <strong>Philippines</strong><br />
2.1 Geography<br />
2<br />
<strong>Wind</strong> <strong>Energy</strong> <strong>Resource</strong><br />
<strong>Atlas</strong> <strong>of</strong> <strong>the</strong> <strong>Philippines</strong><br />
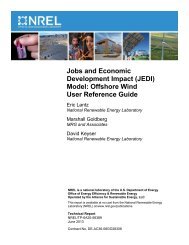
The <strong>Philippines</strong> is an archipelago consisting <strong>of</strong> 7,107 islands in <strong>the</strong> western Pacific. Figure 2-1 is<br />
a political base map <strong>of</strong> <strong>the</strong> <strong>Philippines</strong> and includes <strong>the</strong> names <strong>of</strong> major islands and cities.<br />
Boundaries <strong>of</strong> <strong>the</strong> 73 provinces are also shown in <strong>the</strong> figure. The population <strong>of</strong> <strong>the</strong> <strong>Philippines</strong> is<br />
76,103,564 (July 1997 est.). The land area is approximately 299,000 square kilometers (km)<br />
(116,610 square miles), and <strong>the</strong>re is approximately 36,289 km <strong>of</strong> coastline. The <strong>Philippines</strong><br />
archipelago is centered at approximately 13 degrees north latitude and 122 degrees east longitude.<br />
Taiwan is north <strong>of</strong> <strong>the</strong> archipelago, Indonesia is south, and Eastern Malaysia and Brunei are<br />
southwest. Of all <strong>the</strong> islands in <strong>the</strong> archipelago, only 2,000 are inhabited. Luzon and Mindanao<br />
are <strong>the</strong> largest islands and comprise 66% <strong>of</strong> <strong>the</strong> total area <strong>of</strong> <strong>the</strong> country.<br />
The terrain, shown in Figure 2-2, is largely mountainous with narrow coastal plains and interior<br />
plains and valleys. The principal valleys are in Central Luzon and include <strong>the</strong> nor<strong>the</strong>astern<br />
Cagayan Valley and <strong>the</strong> Agusan Basin in <strong>the</strong> far south. There are numerous dormant and active<br />
volcanoes, such as Mt. Pinatubo on Luzon. The highest point in <strong>the</strong> archipelago is Mt. Apo on<br />
Mindanao at 2,954 meters (9,689 feet).<br />
2.2 Climate<br />
The <strong>Philippines</strong> has a tropical marine climate dominated by a wet season and a dry season.<br />
Prevailing winds govern <strong>the</strong> seasons. The southwest monsoon brings heavy rains to <strong>the</strong><br />
archipelago from May to October, while <strong>the</strong> nor<strong>the</strong>ast monsoon brings cooler and drier air from<br />
December to February. The easterly trade winds induce hot, dry wea<strong>the</strong>r in March and April.<br />
However, <strong>the</strong> climate varies somewhat by region.<br />
The nor<strong>the</strong>ast monsoon affects <strong>the</strong> nor<strong>the</strong>rn part <strong>of</strong> <strong>the</strong> <strong>Philippines</strong> in October and reaches <strong>the</strong><br />
sou<strong>the</strong>rn portion <strong>of</strong> <strong>the</strong> archipelago by November. This wind flow attains its maximum strength<br />
in December throughout much <strong>of</strong> <strong>the</strong> <strong>Philippines</strong> and generally weakens by late March. The<br />
southwest wind first affects <strong>the</strong> nor<strong>the</strong>rn part <strong>of</strong> <strong>the</strong> archipelago by early May and reaches <strong>the</strong><br />
sou<strong>the</strong>rn portion by June, attaining maximum intensity in August and gradually disappearing in<br />
October.<br />
Mean annual sea-level temperatures rarely fall below 27 degrees Centigrade (°C). Annual rainfall<br />
is quite heavy in <strong>the</strong> mountains, but is much less in some sheltered valley areas. Typhoons, or<br />
eastern Pacific hurricanes, frequently hit <strong>the</strong> <strong>Philippines</strong> during <strong>the</strong> hurricane season, which<br />
extends from July through October, especially in nor<strong>the</strong>rn and eastern Luzon, Bicol, and <strong>the</strong><br />
eastern Visayas.
PALAWAN<br />
MINDORO<br />
PANAY<br />
SULU<br />
NEGROS<br />
BATANES<br />
LUZON<br />
SAMAR<br />
LEYTE<br />
MINDANAO
3.0 <strong>Wind</strong> <strong>Resource</strong> Information<br />
3.1 Introduction<br />
5<br />
<strong>Wind</strong> <strong>Energy</strong> <strong>Resource</strong><br />
<strong>Atlas</strong> <strong>of</strong> <strong>the</strong> <strong>Philippines</strong><br />
An accurate wind resource assessment is highly dependent on <strong>the</strong> quantity and quality <strong>of</strong> <strong>the</strong><br />
input data. <strong>NREL</strong> reviews numerous sources <strong>of</strong> wind speed data and previous wind energy<br />
assessments as part <strong>of</strong> its overall evaluation. We used several global wind data sets that have<br />
recently become available in this assessment. These data sets included land surface observations,<br />
marine data, and upper-air data. Multiple data sets are used because <strong>the</strong> quality <strong>of</strong> data in any<br />
particular data set can vary, and because high-quality data can be quite sparse in many regions <strong>of</strong><br />
<strong>the</strong> world. Each data set plays an integral role in <strong>the</strong> overall assessment. This chapter<br />
summarizes <strong>the</strong> data sets analyzed in <strong>the</strong> wind resource mapping effort for <strong>the</strong> <strong>Philippines</strong>.<br />
3.2 Surface Data<br />
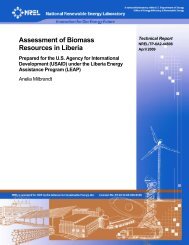
High-quality surface wind data from well-exposed locations can provide <strong>the</strong> best indication <strong>of</strong> <strong>the</strong><br />
magnitude and distribution <strong>of</strong> <strong>the</strong> wind resource in <strong>the</strong> analysis region. The locations <strong>of</strong><br />
meteorological stations in <strong>the</strong> <strong>Philippines</strong> where surface wind speed data were available are<br />
presented in Figure 3-1. The following sections present a summary <strong>of</strong> <strong>the</strong> surface data sets used<br />
in <strong>the</strong> assessment.<br />
3.2.1 PAGASA<br />
The National Institute <strong>of</strong> Climatology, Philippine Atmospheric, Geophysical, and Astronomical<br />
Services Administration (PAGASA) provided summarized data and several reports for this study.<br />
The summarized data included average wind speed and prevailing direction, by month, for 44<br />
stations covering <strong>the</strong> period from 1961 to 1992. The two reports provided for this study included<br />
Climatological Normal <strong>of</strong> Surface <strong>Wind</strong>s in <strong>the</strong> <strong>Philippines</strong>, prepared by <strong>the</strong> National Institute <strong>of</strong><br />
Climatology, PAGASA, in January 1988, and Solar Radiation and <strong>Wind</strong> Mapping <strong>of</strong> <strong>the</strong><br />
<strong>Philippines</strong>, also prepared by <strong>the</strong> National Institute <strong>of</strong> Climatology, PAGASA, in October 1986.<br />
3.2.2 National Power Corporation<br />
The NPC provided data from several wind-resource monitoring programs operated by NPC from<br />
1994 to 1997, including hourly average wind speed and prevailing direction from nine sites, using<br />
30-m-tall towers and state-<strong>of</strong>-<strong>the</strong>-art data acquisition equipment. The period <strong>of</strong> record at <strong>the</strong>se<br />
nine sites varied from 9 months to 20 months. Monthly average wind speeds from five additional<br />
sites employing shorter towers were also provided.
PALAWAN<br />
MINDORO<br />
PANAY<br />
SULU<br />
NEGROS<br />
BATANES<br />
LUZON<br />
SAMAR<br />
LEYTE<br />
MINDANAO
3.2.3 DATSAV2<br />
7<br />
<strong>Wind</strong> <strong>Energy</strong> <strong>Resource</strong><br />
<strong>Atlas</strong> <strong>of</strong> <strong>the</strong> <strong>Philippines</strong><br />
This global climatic database, obtained from <strong>the</strong> U.S. National Climatic Data Center (NCDC),<br />
contains <strong>the</strong> hourly surface wea<strong>the</strong>r observations from first-order meteorological stations<br />
throughout <strong>the</strong> world. This data set is <strong>the</strong> primary source <strong>of</strong> surface wind information used in <strong>the</strong><br />
analysis. <strong>NREL</strong> currently has 24 years <strong>of</strong> DATSAV2 data in its archive, spanning <strong>the</strong> period<br />
1973 to 1996. Additional years <strong>of</strong> data, in some cases back to <strong>the</strong> 1940s, were available in<br />
DATSAV2 for many stations in <strong>the</strong> <strong>Philippines</strong>. Meteorological parameters such as wind speed,<br />
wind direction, temperature, pressure, and altimeter setting are extracted from <strong>the</strong> hourly<br />
observations and used to create statistical summaries <strong>of</strong> wind characteristics. Most <strong>of</strong> <strong>the</strong> stations<br />
in <strong>the</strong> <strong>Philippines</strong> transmitted synoptic observations every 3 hours; many stations did not transmit<br />
during late-night hours. At many stations, <strong>the</strong> transmission frequency changed over <strong>the</strong> years.<br />
Some stations transmitted more frequently (hourly) or less frequently (such as every 6 hours)<br />
during some time periods. Each station in <strong>the</strong> DATSAV2 data set is identified by a unique sixdigit<br />
number based on <strong>the</strong> World Meteorological Organization (WMO) numbering system for <strong>the</strong><br />
stations in <strong>the</strong> <strong>Philippines</strong>.<br />
3.2.4 Marine Climatic <strong>Atlas</strong> <strong>of</strong> <strong>the</strong> World<br />
This is one <strong>of</strong> two global marine wind data sets used by <strong>NREL</strong> to provide estimates <strong>of</strong> <strong>the</strong> wind<br />
resource for <strong>of</strong>fshore areas as well as coastal and inland sites that are well-exposed to <strong>the</strong> ocean<br />
winds. This data set, compiled from historical ship observations, presents summarized wind<br />
statistics for a 1-degree-latitude by 1-degree-longitude grid. Measurements are concentrated<br />
along <strong>the</strong> major shipping routes. Included are summaries <strong>of</strong> <strong>the</strong> monthly means and standard<br />
deviations <strong>of</strong> wind speed, pressure, temperature, and wind direction frequency and speed.<br />
3.2.5 Special Sensor Microwave Imager (SSMI)<br />
The SSMI, which is part <strong>of</strong> <strong>the</strong> Defense Meteorological Satellite Program, provides 10-m ocean<br />
wind speed measurements. This data set provides much more uniform and detailed coverage <strong>of</strong><br />
oceanic wind speeds than <strong>the</strong> Marine Climatic <strong>Atlas</strong> <strong>of</strong> <strong>the</strong> World. Comparisons <strong>of</strong> satellitederived<br />
winds with ship observations along major shipping routes indicate consistent results.<br />
<strong>NREL</strong> currently has 9 years <strong>of</strong> SSMI data covering <strong>the</strong> period 1988 to 1996.<br />
3.3 Upper-Air Data<br />
Upper-air data can provide an estimate <strong>of</strong> <strong>the</strong> wind resource at low levels in <strong>the</strong> atmosphere and<br />
contribute to <strong>the</strong> understanding <strong>of</strong> <strong>the</strong> vertical distribution <strong>of</strong> <strong>the</strong> wind resource. This is useful in<br />
estimating <strong>the</strong> winds on elevated terrain features and for estimating <strong>the</strong> wind resource at exposed<br />
locations in areas without reliable surface wind observations. The following two upper-air data<br />
sets were employed in <strong>the</strong> assessment.
3.3.1 Automated Data Processing Reports (ADP)<br />
8<br />
<strong>Wind</strong> <strong>Energy</strong> <strong>Resource</strong><br />
<strong>Atlas</strong> <strong>of</strong> <strong>the</strong> <strong>Philippines</strong><br />
This data set contains upper-air observations from rawinsonde instruments and pilot balloons for<br />
approximately 1,800 stations worldwide. Observation times include 00, 06, 12, and 18<br />
Greenwich Mean Time (GMT). <strong>Wind</strong> information is available from <strong>the</strong> surface, from mandatory<br />
pressure levels (1,000 mb, 850 mb, 700 mb, and 500 mb), from significant pressure levels (as<br />
determined by <strong>the</strong> vertical pr<strong>of</strong>iles <strong>of</strong> temperature and moisture), and from specified geopotential<br />
heights above <strong>the</strong> surface. The significant pressure levels and geopotential heights are different<br />
for each upper-air observation. The data set housed at <strong>NREL</strong> has approximately 25 years <strong>of</strong><br />
observations, beginning in 1973.<br />
3.3.2 Global Gridded Upper-Air Statistics<br />
This data set contains monthly means and standard deviations <strong>of</strong> climatic elements for 15<br />
atmospheric levels on a 2.5-degree global grid. We obtained <strong>the</strong> data, which covers <strong>the</strong> period<br />
1980 to 1991, from <strong>the</strong> NCDC. This data set is used to supplement <strong>the</strong> ADP information in areas<br />
where upper-air data are scarce.<br />
3.4 Data Screening<br />
The reliability <strong>of</strong> <strong>the</strong> meteorological input data is <strong>the</strong> most important factor in creating an<br />
accurate wind resource map. A recent <strong>NREL</strong> paper (Schwartz and Elliott, 1997) describes <strong>the</strong><br />
integration, analysis, and evaluation <strong>of</strong> different meteorological data sets for use in wind resource<br />
assessment. Known problems associated with observations taken at many meteorological stations<br />
around <strong>the</strong> world include a lack <strong>of</strong> information on anemometer height, exposure, hardware,<br />
maintenance history, and observational procedures. In addition, many areas <strong>of</strong> <strong>the</strong> world with <strong>the</strong><br />
potential to have good or excellent wind resource sites have very little or no meteorological<br />
stations to provide guidance on assessing <strong>the</strong> wind magnitude and characteristics.<br />
An analysis <strong>of</strong> <strong>the</strong> meteorological data is performed using techniques developed by <strong>NREL</strong><br />
specifically for wind resource analysis. We used a comprehensive data-processing package to<br />
convert <strong>the</strong> surface and upper-air data to statistical summaries <strong>of</strong> <strong>the</strong> wind characteristics. The<br />
summaries, presented as a series <strong>of</strong> graphs and tables in <strong>the</strong> appendices, were used to highlight<br />
<strong>the</strong> regional wind characteristics. The DATSAV2 summaries include <strong>the</strong> interannual variability<br />
<strong>of</strong> <strong>the</strong> wind speed and wind power, <strong>the</strong> average wind speed and power on a monthly basis, <strong>the</strong><br />
diurnal distribution <strong>of</strong> <strong>the</strong> wind resource, and <strong>the</strong> mean wind speed and frequency by direction<br />
sector. The wind power density is also computed and analyzed because it provides a truer<br />
indication <strong>of</strong> <strong>the</strong> wind resource potential than wind speed. We generated similar types <strong>of</strong><br />
summaries for <strong>the</strong> upper-air data at specific geopotential heights or pressure levels <strong>of</strong> interest.<br />
We also generated monthly and annual average vertical pr<strong>of</strong>iles <strong>of</strong> wind speed by geopotential<br />
height or pressure level from <strong>the</strong> upper-air data.<br />
Site-specific products are screened for consistency and reasonableness. For example, <strong>the</strong><br />
interannual wind speeds are evaluated to identify obvious trends in <strong>the</strong> data, or periods <strong>of</strong><br />
questionable data. Only representative data periods are selected from <strong>the</strong> entire record for <strong>the</strong><br />
assessment. The summarized products are also cross-referenced against each o<strong>the</strong>r to select sites<br />
that apparently have <strong>the</strong> best exposure and to develop an understanding <strong>of</strong> <strong>the</strong> wind<br />
characteristics <strong>of</strong> <strong>the</strong> study region. This is important because <strong>of</strong> <strong>the</strong> variable quality <strong>of</strong> <strong>the</strong> data
9<br />
<strong>Wind</strong> <strong>Energy</strong> <strong>Resource</strong><br />
<strong>Atlas</strong> <strong>of</strong> <strong>the</strong> <strong>Philippines</strong><br />
and, in most cases, <strong>the</strong> lack <strong>of</strong> documentation <strong>of</strong> <strong>the</strong> anemometer height and exposure. For<br />
assessment purposes, <strong>NREL</strong> assumes an anemometer height <strong>of</strong> 10 m (<strong>the</strong> WMO standard height)<br />
unless specific height information is provided. When <strong>the</strong>re is a conflict among <strong>the</strong> information as<br />
to certain wind characteristics in <strong>the</strong> analysis region, <strong>the</strong> preponderance <strong>of</strong> meteorological<br />
evidence from <strong>the</strong> region serves as <strong>the</strong> basis <strong>of</strong> <strong>the</strong> input. The goal <strong>of</strong> <strong>the</strong> data analysis and<br />
screening process is to develop a conceptual model <strong>of</strong> <strong>the</strong> physical mechanisms, both regional<br />
and local in scale, that influence <strong>the</strong> wind flow.<br />
3.5 Weibull Distribution Function<br />
The Weibull Distribution Function is a generally accepted methodology used to estimate <strong>the</strong> wind<br />
speed frequency distribution. The Weibull Function is defined as follows:<br />
where f(V) is <strong>the</strong> Weibull probability density function where <strong>the</strong> probability <strong>of</strong> encountering a<br />
wind speed <strong>of</strong> V m/s is f(V); c, expressed in m/s, is <strong>the</strong> Weibull scale factor, which is typically<br />
related to <strong>the</strong> average wind speed through <strong>the</strong> shape factor; and k is <strong>the</strong> Weibull shape factor,<br />
which describes <strong>the</strong> distribution <strong>of</strong> <strong>the</strong> wind speeds. Detailed explanations <strong>of</strong> <strong>the</strong> Weibull<br />
Distribution Function and its application are available in many texts, such as that by Rohatgi and<br />
Nelson (1994).<br />
3.6 <strong>Wind</strong> Power Density<br />
The wind resource at a site can be described by <strong>the</strong> mean wind speed, but <strong>the</strong> wind power density<br />
(WPD) provides a truer indication <strong>of</strong> a site’s wind energy potential. The power density is<br />
proportional to <strong>the</strong> sum <strong>of</strong> <strong>the</strong> cube <strong>of</strong> <strong>the</strong> instantaneous or short-term average wind speed and <strong>the</strong><br />
air density. The wind power density, in units <strong>of</strong> W/m 2 , is computed by <strong>the</strong> following equation:<br />
where<br />
( )( ) ( ) k<br />
k −1<br />
k / c V / c exp −V<br />
c<br />
f ( V ) =<br />
/<br />
n<br />
1<br />
3 2<br />
WPD = ∑ ρ × v i ( W/m )<br />
2n<br />
n = <strong>the</strong> number <strong>of</strong> records in <strong>the</strong> averaging interval;<br />
ρ = <strong>the</strong> air density (kg/m 3 ) at a particular observation time; and<br />
vi 3 = <strong>the</strong> cube <strong>of</strong> <strong>the</strong> wind speed (m/s) at <strong>the</strong> same observation time.<br />
i= 1<br />
This equation should only be used for instantaneous (n = 1) or multiple average wind speed<br />
values (n>1) and not for a single long-term average, such as a yearly value.<br />
The air density term is dependent on temperature and pressure and can vary by 10% to 15%<br />
seasonally. If <strong>the</strong> site pressure is known, <strong>the</strong> hourly air-density values, with respect to air<br />
temperature, can be calculated using <strong>the</strong> following equation:<br />
ρ =<br />
P<br />
3<br />
(kg / m )<br />
R× T
where<br />
P = <strong>the</strong> air pressure (Pa or N/m 2 );<br />
R = <strong>the</strong> specific gas constant for air (287 J/kg⋅K); and<br />
T = <strong>the</strong> air temperature in degrees Kelvin (°C+273).<br />
10<br />
<strong>Wind</strong> <strong>Energy</strong> <strong>Resource</strong><br />
<strong>Atlas</strong> <strong>of</strong> <strong>the</strong> <strong>Philippines</strong><br />
If site pressure is not available, air density can be estimated as a function <strong>of</strong> site elevation (z) and<br />
temperature (T) as follows:<br />
where<br />
⎛<br />
⎛ P ⎞ ⎜<br />
0 ⎝<br />
ρ = ⎜ ⎟ε<br />
⎝ R⋅T⎠ −gz ⋅ ⎞<br />
⎟<br />
RT ⋅ ⎠<br />
3<br />
(kg / m )<br />
P0 = <strong>the</strong> standard sea level atmospheric pressure (101,325 Pa), or <strong>the</strong> actual sealevel<br />
adjusted pressure reading from a local airport;<br />
g = <strong>the</strong> gravitational constant (9.8 m/s 2 ); and<br />
z = <strong>the</strong> site elevation above sea level (m).<br />
Substituting in <strong>the</strong> numerical values for P0, R, and g, <strong>the</strong> resulting equation is:<br />
ρ = ε<br />
⎛ ⎞<br />
⎜ ⎟<br />
⎝ ⎠<br />
− 353.05<br />
T<br />
⎛ z ⎞<br />
0. 034⎜<br />
⎟<br />
⎝ t ⎠<br />
3<br />
(kg / m )<br />
This air density equation can be substituted into <strong>the</strong> WPD equation for <strong>the</strong> determination <strong>of</strong> each<br />
instantaneous or multiple average value.<br />
3.7 <strong>Wind</strong> Shear and <strong>the</strong> Power Law<br />
The wind shear is a description <strong>of</strong> <strong>the</strong> change in horizontal wind speed with height. The<br />
magnitude <strong>of</strong> <strong>the</strong> wind shear is site-specific and dependent on wind direction, wind speed, and<br />
atmospheric stability. By determining <strong>the</strong> wind shear, one can extrapolate existing wind speed or<br />
wind-power-density data to o<strong>the</strong>r heights. The following form <strong>of</strong> <strong>the</strong> power law equation is used<br />
to make <strong>the</strong>se adjustments:<br />
U = U0 (z/z0) α [<strong>Wind</strong> Speed]<br />
P = P0 (z/z0) 3α<br />
[<strong>Wind</strong> Power Density]
where<br />
U = <strong>the</strong> unknown wind speed at height z above ground;<br />
U0 = <strong>the</strong> known speed at a reference height z0;<br />
P = <strong>the</strong> unknown wind power density at height z above ground;<br />
P0 = <strong>the</strong> known wind power density at a reference height z0;<br />
α = <strong>the</strong> power law exponent.<br />
11<br />
<strong>Wind</strong> <strong>Energy</strong> <strong>Resource</strong><br />
<strong>Atlas</strong> <strong>of</strong> <strong>the</strong> <strong>Philippines</strong><br />
An exponent <strong>of</strong> 1/7 (or 0.143), which is representative <strong>of</strong> well-exposed areas with low surface<br />
roughness, is <strong>of</strong>ten used to extrapolate data to higher heights.
12<br />
<strong>Wind</strong> <strong>Energy</strong> <strong>Resource</strong><br />
<strong>Atlas</strong> <strong>of</strong> <strong>the</strong> <strong>Philippines</strong><br />
4.0 <strong>Wind</strong> <strong>Resource</strong> Assessment and Mapping Methodology<br />
4.1 Introduction<br />
<strong>NREL</strong> has been developing its GIS-based wind resource mapping technique since 1996. This<br />
technique replaces <strong>the</strong> manual analysis techniques employed in previous mapping efforts, such as<br />
<strong>the</strong> <strong>Wind</strong> <strong>Energy</strong> <strong>Resource</strong> <strong>Atlas</strong> <strong>of</strong> <strong>the</strong> United States (Elliott et al., 1987) and <strong>the</strong> “Mexico <strong>Wind</strong><br />
<strong>Resource</strong> Assessment Project” (Schwartz and Elliott, 1995). <strong>NREL</strong> developed <strong>the</strong> system with<br />
<strong>the</strong> following two primary goals in mind:<br />
1) To produce a more consistent and detailed analysis <strong>of</strong> <strong>the</strong> wind resource, particularly in areas<br />
<strong>of</strong> complex terrain; and,<br />
2) To generate user-friendly high-quality map products.<br />
4.2 Description <strong>of</strong> Mapping System<br />
The mapping procedure uses GIS advanced computerized mapping system. The main GIS<br />
s<strong>of</strong>tware is ARC/INFO, a powerful and complex package featuring a large number <strong>of</strong> routines for<br />
scientific analysis. None <strong>of</strong> <strong>the</strong> ARC/INFO analysis routines is specifically designed for wind<br />
resource assessment work, so <strong>NREL</strong>’s mapping technique requires extensive programming in<br />
ARC/INFO to create combinations <strong>of</strong> scientific routines that mimic direct wind-resource<br />
assessment methods. The mapping system is divided into three main components: input data,<br />
wind power calculations, and <strong>the</strong> output section that produces <strong>the</strong> final wind resource map. These<br />
components are described below.<br />
4.2.1 Input Data<br />
The two primary model inputs are digital terrain data and formatted meteorological data. The<br />
elevation information consists <strong>of</strong> Digital Elevation Model (DEM) terrain data that are used to<br />
divide <strong>the</strong> analysis region into individual grid cells, each having its own unique elevation value.<br />
The United States Geological Survey (USGS) and <strong>the</strong> Earth <strong>Resource</strong> Observing Satellite Data<br />
Center (EROS) recently produced updated DEMs for most <strong>of</strong> <strong>the</strong> world from previously<br />
classified Department <strong>of</strong> Defense data and o<strong>the</strong>r sources. The new data sets have a resolution <strong>of</strong><br />
1 km 2 and are available for large parts <strong>of</strong> <strong>the</strong> world. This represents a significant improvement in<br />
elevation data used by <strong>the</strong> mapping system. It previously relied on 1:1,000,000 scale maps and<br />
305-m (1,000 ft) elevation contours. Most <strong>of</strong> <strong>the</strong> final wind resource maps are gridded to 1 km 2 .<br />
The final meteorological inputs to <strong>the</strong> mapping system, following <strong>the</strong> data screening process, are<br />
vertical wind pr<strong>of</strong>ile(s), wind power rose(s) (<strong>the</strong> percentage <strong>of</strong> total potential power from <strong>the</strong><br />
wind by direction sector), and <strong>the</strong> open-ocean wind-power density, where appropriate. The data<br />
are brought in as ARC/INFO-compatible files and used in <strong>the</strong> power calculation algorithms. The<br />
vertical pr<strong>of</strong>iles are broken down into 100-m intervals centered every 100 m above sea level (asl),<br />
except for <strong>the</strong> lowest layer, which is at 50 m asl. The wind power rose is used to determine <strong>the</strong><br />
degree <strong>of</strong> exposure <strong>of</strong> a particular grid cell to <strong>the</strong> power-producing winds. The open-ocean wind<br />
power density is derived from <strong>the</strong> SSMI and ship wind speed observations, converted to wind<br />
power density, and extrapolated to 30 m for use by <strong>the</strong> model.
4.2.2 <strong>Wind</strong> Power Calculations<br />
13<br />
<strong>Wind</strong> <strong>Energy</strong> <strong>Resource</strong><br />
<strong>Atlas</strong> <strong>of</strong> <strong>the</strong> <strong>Philippines</strong><br />
The wind-power-calculation methodology is presented in Section 3.6. The factors that ei<strong>the</strong>r<br />
decrease or increase <strong>the</strong> base wind power value for a particular grid cell are terrain<br />
considerations, relative and absolute elevation, aspect (<strong>the</strong> slope <strong>of</strong> <strong>the</strong> terrain relative to <strong>the</strong><br />
prevailing wind direction), distance from ocean or lake shorelines, and influence <strong>of</strong> small-scale<br />
wind flow patterns. The factors that have <strong>the</strong> greatest influence on <strong>the</strong> adjustment <strong>of</strong> <strong>the</strong> base<br />
wind power for a particular grid cell are <strong>the</strong> topography <strong>of</strong> <strong>the</strong> area in <strong>the</strong> vicinity and a<br />
combination <strong>of</strong> <strong>the</strong> absolute and relative elevation. The wind-power-calculation modules use <strong>the</strong><br />
wind power rose and vertical wind pr<strong>of</strong>ile <strong>of</strong> a region to account for <strong>the</strong> effects <strong>of</strong> short-range<br />
(less than 10 km), medium-range (10-50 km), and long-range (greater than 50 km) blocking <strong>of</strong><br />
<strong>the</strong> ambient wind flow by <strong>the</strong> terrain; <strong>the</strong> slope and aspect <strong>of</strong> <strong>the</strong> terrain surrounding a particular<br />
grid cell; and <strong>the</strong> relative elevation <strong>of</strong> a grid cell compared to its surroundings.<br />
The wind power calculations are performed in three modules, depending upon <strong>the</strong> existence or<br />
proximity <strong>of</strong> oceans or large lakes to <strong>the</strong> mapping region. These include “land,” “ocean,” and<br />
“lake” modules. The land module is run for <strong>the</strong> entire area only if <strong>the</strong>re is no ocean present in <strong>the</strong><br />
mapping region. Likewise, <strong>the</strong> ocean module is run for <strong>the</strong> entire area in instances where <strong>the</strong>re is<br />
an ocean shoreline present in <strong>the</strong> mapping region. The lake module is run only if <strong>the</strong>re are lakes,<br />
estuaries, or fjords with an area <strong>of</strong> 50 km 2 or greater. This module only calculates <strong>the</strong> wind<br />
power for <strong>the</strong> area within 5 km <strong>of</strong> any non-ocean body <strong>of</strong> water in <strong>the</strong> mapped region. If more<br />
than one module is run for a particular region, <strong>the</strong> results are combined to produce <strong>the</strong> final wind<br />
map. Each <strong>of</strong> <strong>the</strong> three modules contains identical routines that use a general topographical<br />
description to adjust <strong>the</strong> base wind power density. The topographical description can be<br />
classified as ei<strong>the</strong>r complex terrain (hills and ridges), complex terrain with large flat areas<br />
present, or areas that are designated as flat. The adjustment to <strong>the</strong> base wind-power density<br />
depends on which terrain routine is activated during <strong>the</strong> mapping run.<br />
4.2.3 Mapping Products<br />
The primary output <strong>of</strong> <strong>the</strong> mapping system is a color-coded wind power map in units <strong>of</strong> W/m 2<br />
and <strong>the</strong> equivalent mean wind speed for each individual grid cell. The wind power classification<br />
scheme for <strong>the</strong> <strong>Philippines</strong> maps is presented in Table 4-1. We used <strong>the</strong> one-seventh-power law<br />
(see Section 3.7) to adjust <strong>the</strong> power densities to a height <strong>of</strong> 30 m above ground, used as <strong>the</strong><br />
reference height in <strong>the</strong> classification. The 30-m height was chosen as a compromise hub height<br />
between large utility-scale wind turbines (which may range between 30 m to 60 m) and small<br />
wind turbines (which may range between 15 m and 30 m) for rural power applications.<br />
<strong>Wind</strong> power is calculated only for those grid cells that meet certain exposure and slope<br />
requirements. As a result, only <strong>the</strong> most favorable wind resource areas are highlighted. For<br />
example, a grid cell is excluded if <strong>the</strong>re is major blocking <strong>of</strong> <strong>the</strong> ambient wind flow by local<br />
terrain features. The exposure must be at least 70% to be included. A grid cell can also be<br />
excluded if <strong>the</strong> slope <strong>of</strong> <strong>the</strong> terrain is too steep. To be included, <strong>the</strong> slope must not exceed 20%.<br />
The wind resource values presented are estimates for low surface roughness (e.g., grassland with<br />
no major obstructions, such as trees or buildings).
Class <strong>Resource</strong> Potential<br />
Utility Rural<br />
Table 4-1. <strong>Wind</strong> Power Classification<br />
<strong>Wind</strong> Power<br />
Density (W/m 2 )<br />
@ 30 m<br />
14<br />
<strong>Wind</strong> <strong>Energy</strong> <strong>Resource</strong><br />
<strong>Atlas</strong> <strong>of</strong> <strong>the</strong> <strong>Philippines</strong><br />
<strong>Wind</strong> Speed (a)<br />
(m/s) @ 30 m<br />
1 Marginal Moderate 100 - 200 4.4 - 5.6<br />
2 Moderate Good 200 - 300 5.6 - 6.4<br />
3 Good Excellent 300 - 400 6.4 - 7.0<br />
4 Excellent Excellent 400 - 600 7.0 - 8.0<br />
5 Excellent Excellent 600 - 800 8.0 - 8.8<br />
6 Excellent Excellent 800 -1200 8.8 -10.1<br />
(a) Mean wind speed is estimated assuming a Weibull distribution <strong>of</strong> wind speeds with a shape factor (k) <strong>of</strong> 2.0 and<br />
standard sea-level air density. The actual mean wind speed may differ from <strong>the</strong>se estimated values by as much as<br />
20 percent, depending on <strong>the</strong> actual wind-speed distribution (or Weibull k value) and elevation above sea level.<br />
The output portion <strong>of</strong> <strong>the</strong> mapping system also includes s<strong>of</strong>tware to produce <strong>the</strong> proper map<br />
projection for <strong>the</strong> region. It labels <strong>the</strong> map with useful information, such as a legend, latitude and<br />
longitude lines, locations <strong>of</strong> meteorological stations, prevailing wind direction(s), important<br />
cities, and a distance scale. The DEM data can also be used to create a color-coded elevation<br />
map, a hill-shaded relief map, and a map <strong>of</strong> <strong>the</strong> elevation contours. When combined with <strong>the</strong><br />
wind power maps, <strong>the</strong>se products enable <strong>the</strong> user to obtain a feel for <strong>the</strong> three-dimensional<br />
distribution <strong>of</strong> <strong>the</strong> wind power in <strong>the</strong> analysis region.<br />
4.3 Limitations <strong>of</strong> Mapping Technique<br />
There are several limitations to <strong>the</strong> mapping technique, <strong>the</strong> first being <strong>the</strong> resolution <strong>of</strong> <strong>the</strong> DEM<br />
data. Significant terrain variations can occur within <strong>the</strong> DEM’s 1 km 2 area; thus, <strong>the</strong> wind<br />
resource estimate for a particular grid cell may not apply to all areas within <strong>the</strong> cell. A second<br />
potential problem is <strong>the</strong> development <strong>of</strong> <strong>the</strong> conceptual model <strong>of</strong> <strong>the</strong> wind flow and its<br />
extrapolation to <strong>the</strong> analysis region. There are many complexities in <strong>the</strong> wind flow that make this<br />
an inexact methodology, including <strong>the</strong> structure <strong>of</strong> low-level jets and <strong>the</strong>ir interaction with <strong>the</strong><br />
boundary layer, and localized circulations, such as land-sea breezes, mountain-valley flows, and<br />
channeling effects in steeply sloped areas. Finally, <strong>the</strong> power estimates are valid for areas with<br />
low surface roughness. Estimates for areas with a higher surface roughness need to be adjusted<br />
accordingly.
15<br />
<strong>Wind</strong> <strong>Energy</strong> <strong>Resource</strong><br />
<strong>Atlas</strong> <strong>of</strong> <strong>the</strong> <strong>Philippines</strong><br />
5.0 <strong>Wind</strong> <strong>Resource</strong> Characteristics <strong>of</strong> <strong>the</strong> <strong>Philippines</strong><br />
5.1 Introduction<br />
This section presents and discusses both surface and upper-air data, collected for this study.<br />
These data sources include those data archives available at <strong>NREL</strong> and <strong>the</strong> data provided by local<br />
agencies in <strong>the</strong> <strong>Philippines</strong>.<br />
5.2 Surface Data<br />
5.2.1 PAGASA<br />
PAGASA provided <strong>NREL</strong> a summary <strong>of</strong> <strong>the</strong> average wind speed and prevailing direction for 44<br />
surface-based stations and two reports: Climatological Normal <strong>of</strong> Surface <strong>Wind</strong>s in <strong>the</strong><br />
<strong>Philippines</strong> (January 1988) and Solar Radiation and <strong>Wind</strong> Mapping <strong>of</strong> <strong>the</strong> <strong>Philippines</strong> (October<br />
1986).<br />
The Climate Data Section, <strong>the</strong> Climatology and Agrometeorology Branch <strong>of</strong> PAGASA, prepared<br />
a summary <strong>of</strong> monthly average wind speeds and prevailing directions for 44 stations in <strong>the</strong><br />
<strong>Philippines</strong>. These are principally <strong>the</strong> synoptic reporting stations managed by PAGASA, listed in<br />
Table 5-1 and shown in Figure 5-1. <strong>Wind</strong> speed and direction is collected nominally at 10 m (33<br />
feet) above ground level. The annual average wind speeds at <strong>the</strong>se stations are quite low, ranging<br />
from 1.0 to 5.0 m/s.<br />
The PAGASA Report Climatological Normal <strong>of</strong> Surface <strong>Wind</strong>s In <strong>the</strong> <strong>Philippines</strong> presents a<br />
series <strong>of</strong> maps with average wind speed and prevailing wind direction, by month, for <strong>the</strong><br />
archipelago. Samples <strong>of</strong> <strong>the</strong> maps are included as Figures 5-2 and 5-3. These maps are based on<br />
a variety <strong>of</strong> data sources, including stations where winds are estimated using <strong>the</strong> Beaufort Scale<br />
<strong>of</strong> <strong>Wind</strong>. This report included a table <strong>of</strong> <strong>the</strong> highest wind speeds recorded in <strong>the</strong> <strong>Philippines</strong>, by<br />
month. The highest wind gust recorded in <strong>the</strong> country was 77 m/s at Virac Synop on October 13,<br />
1970, associated with <strong>the</strong> landfall <strong>of</strong> Typhoon “Sening”.<br />
The PAGASA Report Solar Radiation and <strong>Wind</strong> Mapping <strong>of</strong> <strong>the</strong> <strong>Philippines</strong> presents wind flow<br />
maps, but also includes, by month, an analysis <strong>of</strong> <strong>the</strong> shape and scale parameters (both related to<br />
<strong>the</strong> Weibull distribution), <strong>the</strong> mean wind speed, and <strong>the</strong> mean wind-power density. The<br />
conclusions are based on two data sets. The first set consists <strong>of</strong> 30 years (1951–1980) <strong>of</strong> surface<br />
wind data at 10 m for 23 synoptic stations. These data were observed using a 3–5-minute<br />
averaging period from a wind instrument indicator or <strong>the</strong> Beaufort Scale <strong>Wind</strong> Force method<br />
taken every 3 hours. The second set <strong>of</strong> surface wind data is based on data extracted from chart<br />
recorders. The period <strong>of</strong> record covers mid-1981 to mid-1984 (approximately 3 years).<br />
These data were <strong>the</strong>n plotted and analyzed. The highest annual average wind speeds and<br />
corresponding high wind-power density occurred along <strong>the</strong> north coast <strong>of</strong> Luzon and <strong>the</strong> nor<strong>the</strong>rn<br />
islands, <strong>the</strong> east and west central parts <strong>of</strong> <strong>the</strong> archipelago, and on a ridgeline overlooking <strong>the</strong> Taal<br />
Volcano. Mean monthly wind speeds are highest in <strong>the</strong> winter during <strong>the</strong> nor<strong>the</strong>ast monsoon and<br />
lower during <strong>the</strong> summer. The diurnal variation <strong>of</strong> <strong>the</strong> wind speeds showed significant<br />
variability. For example, some sites showed <strong>the</strong> highest wind speeds were during midday, o<strong>the</strong>r<br />
sites showed a peak at midnight.
Table 5-1<br />
List <strong>of</strong> Synoptic Stations Provided By PAGASA<br />
Station Name Latitude Longitude Elevation<br />
(m)<br />
16<br />
Period <strong>of</strong><br />
Record<br />
<strong>Wind</strong> <strong>Energy</strong> <strong>Resource</strong><br />
<strong>Atlas</strong> <strong>of</strong> <strong>the</strong> <strong>Philippines</strong><br />
Annual Average<br />
<strong>Wind</strong> Speed<br />
(m/s)<br />
Alabat, Quezon 14 01 122 01 5.0 1961-92 3.0<br />
Ambulong, Batangas 14 05 121 03 10.0 1961-92 2.0<br />
Aparri, Cagayan 18 22 121 38 3.0 1961-92 3.0<br />
Baguio City, Benguet 16 25 120 36 1,500.0 1961-92 2.0<br />
Baler, Quezon 15 46 121 34 6.0 1961-92 2.0<br />
Basco, Batanes 20 27 121 58 11.0 1961-92 5.0<br />
Butuan City, Agusan Del Norte 08 56 125 31 18.0 1981-92 1.0<br />
Cabanatuan, Nueva Ecija 15 29 120 58 32.0 1961-92 2.0<br />
Cagayan De Oro, Misamis Oriental 08 29 124 38 6.0 1961-92 1.0<br />
Calapan, Oriental Mindoro 13 25 121 11 40.5 1961-92 2.0<br />
Casiguran, Quezon 16 17 122 07 4.0 1961-92 2.0<br />
Catarman, Nor<strong>the</strong>rn Samar 12 29 124 38 50.0 1961-92 2.0<br />
Catbalogan, Western Samar 11 47 124 53 5.0 1961-92 2.0<br />
Coron, Palawan 12 00 120 12 14.0 1961-92 2.0<br />
Cuyo, Palawan 10 51 121 02 4.0 1961-92 5.0<br />
Dagupan City, Pangasinan 16 03 120 20 2.0 1961-92 3.0<br />
Davao City, Davao Del Sur 07 07 125 39 18.0 1961-92 2.0<br />
Dipolog, Zamboanga Del Norte 08 36 123 21 4.0 1961-92 2.0<br />
Dumaguete City, Negros Oriental 09 18 123 18 8.0 1961-92 2.0<br />
General Santos, South Cotabato 06 07 125 11 15.0 1961-92 2.0<br />
Iba, Zambales 15 20 119 58 4.7 1961-92 3.0<br />
Iloilo City, Iloilo 10 42 122 34 8.0 1961-92 4.0<br />
Infanta, Quezon 14 45 121 39 7.0 1961-92 2.0<br />
Laoag City, Ilocos Norte 18 11 120 32 5.0 1961-92 3.0<br />
Legaspi City, Albay 13 08 123 44 17.0 1961-92 3.0<br />
Maasin, Sou<strong>the</strong>rn Leyte 10 08 124 50 71.8 1971-92 2.0<br />
Mactan, Cebu 10 18 123 58 12.8 1972-92 3.0<br />
Malaybalay, Bukidnon 08 09 125 05 627.0 1961-92 1.0<br />
Masbate, Masbate 12 22 123 37 6.0 1961-92 2.0<br />
Naia, Pasay City 14 31 121 01 21.0 1961-92 3.0<br />
Port Area, Manila 14 35 120 59 16.0 1961-92 3.0<br />
Puerto Princesa, Palawan 09 45 118 44 16.0 1961-92 2.0<br />
Romblon, Romblon 12 35 122 16 47.0 1961-92 3.0<br />
Roxas City, Aklan 11 35 122 45 4.0 1961-92 3.0<br />
San Francisco, Quezon 13 22 122 31 45.0 1961-92 3.0<br />
San Jose, Occidental Mindoro 12 21 121 02 0.3 1981-92 3.0<br />
Surigao, Surigao De Norte 09 48 125 30 39.0 1961-92 3.0<br />
Tacloban City, Leyte 11 14 125 02 3.0 1961-92 2.0<br />
Tagbilaran City, Bohol 09 36 123 52 6.0 1961-92 2.0<br />
Tayabas, Quezon 14 02 121 35 157.7 1971-92 2.0<br />
Tuguegarao, Cagayan 17 37 121 44 61.8 1961-92 2.0<br />
Vigan, Ilocos Sur 17 34 120 23 33.0 1961-92 3.0<br />
Virac Synop, Catanduanes 13 35 124 14 40.0 1961-92 3.0<br />
Zamboanga City, Zamboanga Del<br />
Sur<br />
06 54 122 04 6.0 1961-92 2.0
PALAWAN<br />
MINDORO<br />
PANAY<br />
SULU<br />
NEGROS<br />
BATANES<br />
LUZON<br />
SAMAR<br />
LEYTE<br />
MINDANAO
Figure 5.2 Surface Air Flow (January) in <strong>the</strong> <strong>Philippines</strong><br />
18<br />
<strong>Wind</strong> <strong>Energy</strong> <strong>Resource</strong><br />
<strong>Atlas</strong> <strong>of</strong> <strong>the</strong> <strong>Philippines</strong>
Figure 5.3 Surface Air Flow (July) in <strong>the</strong> <strong>Philippines</strong><br />
19<br />
<strong>Wind</strong> <strong>Energy</strong> <strong>Resource</strong><br />
<strong>Atlas</strong> <strong>of</strong> <strong>the</strong> <strong>Philippines</strong>
<strong>Wind</strong> <strong>Energy</strong> <strong>Resource</strong><br />
<strong>Atlas</strong> <strong>of</strong> <strong>the</strong> <strong>Philippines</strong><br />
These reports represent a good starting point in understanding <strong>the</strong> wind resource in <strong>the</strong><br />
<strong>Philippines</strong>; however, <strong>the</strong> studies do have some significant limitations:<br />
• The conclusions are based on <strong>the</strong> data from only 35 stations.<br />
• There is no information on <strong>the</strong> exposure <strong>of</strong> <strong>the</strong> instruments at <strong>the</strong>se 35 stations. This type <strong>of</strong><br />
knowledge is extremely useful in judging <strong>the</strong> quality <strong>of</strong> <strong>the</strong> data used in <strong>the</strong> study.<br />
• There is no information regarding <strong>the</strong> quality <strong>of</strong> <strong>the</strong> measurements at each <strong>of</strong> <strong>the</strong> sites.<br />
Failure to properly maintain <strong>the</strong> anemometer, location changes, urbanization, and vegetation<br />
changes surrounding <strong>the</strong> anemometer site affect <strong>the</strong> measurements.<br />
• The analysis did not take into account <strong>the</strong> topography <strong>of</strong> <strong>the</strong> archipelago or o<strong>the</strong>r factors that<br />
may accelerate or retard <strong>the</strong> wind.<br />
5.2.2 National Power Corporation<br />
NPC conducted a wind-resource-measurement program by placing towers with wind-speedmeasurement<br />
equipment at various sites in Luzon, Batanes, Catanduanes, Romblon Island, Cuyo<br />
Island, and Guimaras Island. These were <strong>the</strong> general locations <strong>of</strong> <strong>the</strong> better wind resource areas<br />
from <strong>the</strong> previous PAGASA studies. At nine <strong>of</strong> <strong>the</strong> sites, <strong>the</strong> wind-resource-measurement<br />
equipment consisted <strong>of</strong> NRG Systems 30-m-tall towers, NRG Systems 9200 data loggers,<br />
Maximum #40 wind speed sensors, and #200P wind direction sensors. The general location <strong>of</strong><br />
<strong>the</strong> monitoring sites is presented in Figure 5-4. Two levels <strong>of</strong> wind speed and two levels <strong>of</strong> wind<br />
direction (20 m and 30 m) were installed on each tall tower. The sampling rate was every 2<br />
seconds, and <strong>the</strong> data were averaged into hourly values. For <strong>the</strong> o<strong>the</strong>r five sites, we used a shorter<br />
tower, ei<strong>the</strong>r 12-m or 15.5-m, and <strong>the</strong> data acquisition equipment is not identified. The<br />
monitoring sites are installed in eight specific areas: Ilocos Norte (7 sites), Mountain Province (1<br />
site), Guimaras Island (1 site), Romblon Island (1 site), Catanduanes (1 site), Cuyo Island (1 site),<br />
and Batanes (1 site). A description <strong>of</strong> each site is presented in Table 5-2.<br />
Seven <strong>of</strong> <strong>the</strong> sites are in <strong>the</strong> northwestern portion <strong>of</strong> Luzon, along <strong>the</strong> coast and in <strong>the</strong> coastal<br />
hills. The hourly wind speed and wind direction data were available for Bayog, Pagali, Saoit,<br />
Agaga, Bangui, Caparispisan, Subec, Sagada, and Guimaras. <strong>NREL</strong> processed <strong>the</strong>se data to<br />
produce estimates <strong>of</strong> monthly average power and monthly average wind speed, as well as average<br />
speed and power by hour <strong>of</strong> <strong>the</strong> day, and joint frequencies <strong>of</strong> wind speed and wind direction (see<br />
Appendix A). The annual average wind speed and power for <strong>the</strong> 30-m sites are presented in<br />
Table 5-3. The monthly average wind speed and wind power for three sites—Pagali, Sagada, and<br />
Guimaras Island—are presented in Figures 5-5 to 5-7. Due to <strong>the</strong> short collection period at all<br />
NPC sites, some months are underrepresented relative to o<strong>the</strong>rs (see plots <strong>of</strong> ‘Observations by<br />
Month’ in Appendix A). Averaging all records can bias <strong>the</strong> average towards those months with<br />
more records. To eliminate this bias, all annual averages reported here were computed by<br />
averaging <strong>the</strong> 12 monthly values. Some <strong>of</strong> <strong>the</strong>se monthly values may have been derived from<br />
data from 2 years, while o<strong>the</strong>rs represent only a single year.<br />
The sites at Bayog, Pagali, and Saoit are located on <strong>the</strong> northwest coast <strong>of</strong> Luzon near <strong>the</strong> town <strong>of</strong><br />
Burgos. The site maps provided by NPC indicate that Bayog and Pagali are along <strong>the</strong> coast,<br />
while Saoit is located on <strong>the</strong> inland hills. Annual wind speeds at 30 m above ground level were<br />
5.6 m/s at Saoit, 6.9 m/s at Bayog, and 7.2 m/s at Pagali. There are significant differences in <strong>the</strong><br />
magnitude <strong>of</strong> <strong>the</strong> wind speed between <strong>the</strong> months with <strong>the</strong> highest and lowest average wind<br />
speeds. For example, at Bayog <strong>the</strong> highest monthly average wind speed is 12.4 m/s (December),<br />
while <strong>the</strong> lowest value is 4.0 m/s (June). At Saoit, <strong>the</strong> highest value is 9.0 m/s (December), and<br />
20
21<br />
<strong>Wind</strong> <strong>Energy</strong> <strong>Resource</strong><br />
<strong>Atlas</strong> <strong>of</strong> <strong>the</strong> <strong>Philippines</strong><br />
<strong>the</strong> lowest is 3.7 m/s (June). At Pagali, <strong>the</strong> highest value is 11.9 m/s (December), and <strong>the</strong> lowest<br />
is 3.6 m/s (June). For Bayog, Pagali, and Saoit, <strong>the</strong> annual average wind powers are 510 W/m 2 ,<br />
569 W/m 2 , and 266 W/m 2 , respectively, with <strong>the</strong> highest values occurring in December and <strong>the</strong><br />
lowest values in June.<br />
The sites at Agaga, Caparispisan, and Subec are also located in northwestern Luzon, north <strong>of</strong> <strong>the</strong><br />
town <strong>of</strong> Laoag. The Agaga and Subec sites are located on interior hills, while Caparispisan is on<br />
Figure 5.4 General location <strong>of</strong> <strong>the</strong> National Power Corporation monitoring sites in <strong>the</strong><br />
<strong>Philippines</strong>
Table 5-2. <strong>Wind</strong> Monitoring Sites for National Power Corporation<br />
Region Site Tower<br />
Height<br />
(m)<br />
Latitude Longitude Elevation<br />
(m)<br />
22<br />
<strong>Wind</strong> <strong>Energy</strong> <strong>Resource</strong><br />
<strong>Atlas</strong> <strong>of</strong> <strong>the</strong> <strong>Philippines</strong><br />
Period Of<br />
Record<br />
<strong>Wind</strong><br />
Speed<br />
(m/s)<br />
Ilocos North Bayog 30 18 30 120 35 5 05/95-10/96 6.9<br />
Pagali 30 18 32 120 37 1 07/95-04/97 7.2<br />
Saoit 30 18 31 120 37 80 06/95-03/97 5.6<br />
Agaga 30 18 27 120 39 280 07/95-03/97 6.2<br />
Bangui 20 18 31 120 43 175 07/95-04/96 6.6<br />
Caparispisan 30 18 36 120 47 140 05/95-02/97 7.6<br />
Subec 30 18 36 120 49 80 06/95-03/97 7.7<br />
Mt. Province Sagada 30 17 06 120 52 1871 06/95-12/96 6.7<br />
Guimaras Is. Guimaras 30 10 32 122 39 160 06/95-05/97 5.0<br />
Romblon Is. Romblon 12 N/A N/A N/A 10/91-07/93 4.6<br />
Catanduanes Catanduanes 12 N/A N/A N/A 11/93-04/95 5.2<br />
Cuyo Is. Cuyo 12 N/A N/A N/A 11/93-03/95 4.7<br />
Guimaras Is. Guimaras 15.5 N/A N/A N/A 03/94-06/95 4.9<br />
Batanes Basco 12 N/A N/A N/A 04/94-08/94 6.3<br />
Table 5-3. Average <strong>Wind</strong> Speed (m/s) and Power (W/m 2 )<br />
Site Average <strong>Wind</strong><br />
Speed (m/s)<br />
Average <strong>Wind</strong><br />
Power (W/m 2 )<br />
Highest Monthly<br />
Average <strong>Wind</strong><br />
Power (W/m 2 )<br />
Lowest Monthly<br />
Average <strong>Wind</strong><br />
Power (W/m 2 )<br />
Bayog 6.9 510 1474 (Dec) 98 (Jun)<br />
Pagali 7.2 569 1378 (Dec) 79 (Jun)<br />
Saoit 5.6 266 623 (Dec) 83 (Jun)<br />
Agaga 6.2 393 1006 (Dec) 72 (Jun)<br />
Bangui* 6.6 425 1139 (Dec) 51 (Aug)<br />
Caparispisan 7.6 516 1001 (Dec) 179 (Jun)<br />
Subec 7.7 669 1813 (Dec) 110 (Jun)<br />
Sagada 6.7 356 977 (Dec) 67 (Apr)<br />
Guimaras 5.0 143 437 (Feb) 38 (Jun)<br />
* Bangui had insufficient data at <strong>the</strong> 30-m tower height. Values are based on 9 months <strong>of</strong> data at 20-m tower height.<br />
<strong>the</strong> coastal bluffs overlooking <strong>the</strong> ocean. Annual wind speeds at 30 m above ground level were<br />
7.7 m/s at Subec, 7.6 m/s at Caparispisan, and 6.2 m/s at Agaga. Again, <strong>the</strong>re are significant<br />
differences in magnitude between <strong>the</strong> months with <strong>the</strong> highest and lowest average wind speeds.<br />
For example, at Subec, <strong>the</strong> highest monthly average wind speed is 13.2 m/s (December), while<br />
<strong>the</strong> lowest value is 3.8 m/s (June). At Caparispisan, <strong>the</strong> highest value is 11.3 m/s (December),<br />
and <strong>the</strong> lowest is 4.7 m/s (June). At Agaga, <strong>the</strong> highest value is 9.8 m/s (December), and <strong>the</strong><br />
lowest is 3.6 m/s (June). For Subec, Caparispisan, and Agaga, <strong>the</strong> annual average wind powers<br />
are 669 W/m 2 , 518 W/m 2 , and 393 W/m 2 , respectively, with <strong>the</strong> highest values occurring in<br />
December and <strong>the</strong> lowest values in June.<br />
The frequency <strong>of</strong> occurrence <strong>of</strong> wind speed and direction for <strong>the</strong>se six sites shows <strong>the</strong><br />
predominant nor<strong>the</strong>ast flow in <strong>the</strong> late fall through early spring months (October to April) and <strong>the</strong><br />
increased variability <strong>of</strong> wind directions in <strong>the</strong> summer months. The diurnal trend at <strong>the</strong>se six sites<br />
shows a daytime maximum and nighttime minimum.
23<br />
<strong>Wind</strong> <strong>Energy</strong> <strong>Resource</strong><br />
<strong>Atlas</strong> <strong>of</strong> <strong>the</strong> <strong>Philippines</strong><br />
The site at Sagada is also in nor<strong>the</strong>rn Luzon; however, as a high-elevation, interior site, it has a<br />
very different exposure than <strong>the</strong> o<strong>the</strong>r sites. The site is northwest <strong>of</strong> <strong>the</strong> town <strong>of</strong> Sagada at an<br />
elevation <strong>of</strong> 1,871 m, and is on a north–south-oriented mountain range. The annual wind speed at<br />
30 m above ground level is 6.7 m/s, and <strong>the</strong> annual wind power is 356 W/m 2 . The monthly wind<br />
power ranges from 977 W/m 2 in December to 67 W/m 2 in April. The wind direction is<br />
predominantly from <strong>the</strong> nor<strong>the</strong>ast during <strong>the</strong> winter. However, during <strong>the</strong> summer, except for<br />
September, <strong>the</strong> wind direction is split evenly between east-nor<strong>the</strong>ast and west-southwest. The<br />
diurnal wind speed pattern is typical for a mountain site with, on average, little change from hour<br />
to hour. There is a slight increase in wind speeds during <strong>the</strong> nighttime hours during stable<br />
conditions and a decrease during <strong>the</strong> daytime, most likely due to instability and increased mixing.<br />
A 30-m tower was installed on Guimaras Island. The island is in <strong>the</strong> Guimaras Strait, sou<strong>the</strong>ast<br />
<strong>of</strong> Panay. The tower was installed on a small hill on <strong>the</strong> sou<strong>the</strong>ast quarter <strong>of</strong> <strong>the</strong> island, well<br />
away from <strong>the</strong> coast. The annual average wind speed and annual average wind power are<br />
marginal (5.0 m/s and 143 W/m 2 , respectively) for utility-scale power. However, <strong>the</strong> resource at<br />
this site may be sufficient for rural power applications. The frequency distribution <strong>of</strong> wind<br />
directions shows <strong>the</strong> typical predominance <strong>of</strong> nor<strong>the</strong>ast winds during <strong>the</strong> winter and <strong>the</strong><br />
variability in wind directions during <strong>the</strong> summer. This particular site does show a pronounced<br />
peak in southwesterly wind directions during <strong>the</strong> late summer and early fall.<br />
NPC also provided monthly average wind speeds for five o<strong>the</strong>r sites. These data were measured<br />
on ei<strong>the</strong>r 12-m- or 15.5-m-tall towers. The sites: Romblon Island in <strong>the</strong> Sibuyan Sea in <strong>the</strong><br />
central part <strong>of</strong> <strong>the</strong> archipelago, Catanduanes on <strong>the</strong> eastern side <strong>of</strong> <strong>the</strong> archipelago, Cuyo Island in<br />
<strong>the</strong> Cuyo East Pass, and Basco on Batan Island north <strong>of</strong> Luzon, appear to have good wind<br />
resources. However, <strong>the</strong> relatively low measurement heights, poor data recovery, and missing<br />
months <strong>of</strong> data undermine <strong>the</strong> usefulness <strong>of</strong> <strong>the</strong> information.<br />
The NPC data has significant value for this study. The results <strong>of</strong> <strong>the</strong> 30-m-tower program<br />
indicate that <strong>the</strong>re is good wind resource in <strong>the</strong> coastal region and higher interior mountains <strong>of</strong><br />
nor<strong>the</strong>rn Luzon. These data also yield valuable information on <strong>the</strong> diurnal trends in <strong>the</strong> wind<br />
speed and, consequently, <strong>the</strong> wind power.<br />
<strong>Wind</strong> Power (W/m 2 )<br />
1500<br />
1000<br />
500<br />
0<br />
Jan<br />
Mar<br />
May<br />
Jul<br />
Month<br />
Sep<br />
Nov<br />
<strong>Wind</strong> Power <strong>Wind</strong> Speed<br />
12<br />
10<br />
8<br />
6<br />
4<br />
2<br />
0<br />
Figure 5.5 Monthly wind speed and power—Pagali<br />
<strong>Wind</strong> Speed (m/s)
<strong>Wind</strong> Power (W/m 2 )<br />
5.2.3 DATSAV2<br />
1400<br />
1200<br />
1000<br />
800<br />
600<br />
400<br />
200<br />
0<br />
Jan<br />
Feb<br />
Mar<br />
Apr<br />
May<br />
Jun<br />
Figure 5.6 Monthly wind speed and power—Sagada<br />
<strong>Wind</strong> Power (W/m 2 )<br />
1400<br />
1200<br />
1000<br />
800<br />
600<br />
400<br />
200<br />
0<br />
Jan<br />
Feb<br />
Figure 5.7 Monthly wind speed and power – Guimaras Island<br />
24<br />
<strong>Wind</strong> <strong>Energy</strong> <strong>Resource</strong><br />
<strong>Atlas</strong> <strong>of</strong> <strong>the</strong> <strong>Philippines</strong><br />
There are data for 67 stations in <strong>the</strong> Philippine archipelago available from <strong>the</strong> climatic data set<br />
known as DATSAV2. We obtained <strong>the</strong> data set from <strong>the</strong> NCDC; it consists <strong>of</strong> hourly surface<br />
observations <strong>of</strong> meteorological variables. These observations were transmitted, for <strong>the</strong> most part,<br />
via <strong>the</strong> Global Telecommunications System (GTS). A map <strong>of</strong> <strong>the</strong> station locations, and <strong>the</strong> total<br />
number <strong>of</strong> observations for each station, was previously shown in Figure 3-1.<br />
The number <strong>of</strong> hourly observations within each year and from year to year for <strong>the</strong> individual sites<br />
is highly variable. Some stations, such as Clark Air Force Base (AFB), Olongapo, and Mactan<br />
International Airport, have approximately 8,760 hourly observations in each year. O<strong>the</strong>r sites,<br />
Jul<br />
Month<br />
Aug<br />
Sep<br />
Oct<br />
Nov<br />
<strong>Wind</strong> Power <strong>Wind</strong> Speed<br />
Mar<br />
Apr<br />
May<br />
Jun<br />
Jul<br />
Month<br />
Aug<br />
Sep<br />
Oct<br />
Nov<br />
<strong>Wind</strong> Power <strong>Wind</strong> Speed<br />
Dec<br />
Dec<br />
12<br />
10<br />
8<br />
6<br />
4<br />
2<br />
0<br />
12<br />
10<br />
8<br />
6<br />
4<br />
2<br />
0<br />
<strong>Wind</strong> Speed (m/s)<br />
<strong>Wind</strong> Speed (m/s)
25<br />
<strong>Wind</strong> <strong>Energy</strong> <strong>Resource</strong><br />
<strong>Atlas</strong> <strong>of</strong> <strong>the</strong> <strong>Philippines</strong><br />
such as Maasin on Leyte Island, have no more than 2,000 observations in any year and sometimes<br />
less than 500 observations.<br />
The data records for each <strong>of</strong> <strong>the</strong>se stations were processed to produce monthly and annual<br />
averages <strong>of</strong> wind speed and power. The summarized data are presented in Table 5-4, and copies<br />
<strong>of</strong> <strong>the</strong> processed files are presented in Appendix B for selected stations. These data are useful for<br />
evaluating <strong>the</strong> inter-annual, monthly, and diurnal variability <strong>of</strong> wind speed and power, and <strong>the</strong><br />
joint frequency <strong>of</strong> wind speed and wind direction.<br />
Visual inspection <strong>of</strong> <strong>the</strong> plots <strong>of</strong> <strong>the</strong> various wind characteristics data for each station sometimes<br />
revealed trends and peculiarities, particularly in <strong>the</strong> inter-annual variability. For example, <strong>the</strong><br />
long-term average wind speed and power density at Cuyo Island from 1973 to 1996 was 3.5 m/s<br />
and 123 W/m 2 , respectively. However, an inspection <strong>of</strong> <strong>the</strong> yearly wind speeds and power<br />
densities from 1973 to 1996 reveals that <strong>the</strong> average wind speeds were about 5 m/s in <strong>the</strong> 1970s<br />
and had decreased to about 2 m/s by <strong>the</strong> mid-1990s. The wind power was in <strong>the</strong> range <strong>of</strong> 200 to<br />
300 W/m 2 in <strong>the</strong> 1970s and decreased to less than 20 W/m 2 by <strong>the</strong> mid-1990s. A long-term<br />
downward trend in wind speed and power at a station frequently indicates that ei<strong>the</strong>r <strong>the</strong> site is<br />
becoming less exposed to <strong>the</strong> prevailing wind because <strong>of</strong> an increase in obstructions around <strong>the</strong><br />
site or <strong>the</strong>re is a degradation <strong>of</strong> <strong>the</strong> anemometer. Similar types <strong>of</strong> trends and peculiarities were<br />
found at many o<strong>the</strong>r stations in <strong>the</strong> <strong>Philippines</strong>.<br />
Although <strong>the</strong> average wind speeds and power densities are presented in Table 5-4 for each<br />
station, <strong>the</strong>se data may not be a reliable indicator <strong>of</strong> <strong>the</strong> area’s wind resource because <strong>of</strong> problems<br />
with <strong>the</strong> data. Unfortunately, information on exposure <strong>of</strong> <strong>the</strong> wind measurement equipment and<br />
maintenance <strong>of</strong> <strong>the</strong> equipment is not available for meteorological stations in <strong>the</strong> <strong>Philippines</strong>, (nor<br />
most countries <strong>of</strong> <strong>the</strong> world, for that matter). With <strong>the</strong> various inherent problems in <strong>the</strong> reliability<br />
<strong>of</strong> <strong>the</strong> surface data from meteorological stations, using <strong>the</strong> appropriate upper-air data and ocean<br />
satellite data to characterize <strong>the</strong> ambient wind-flow characteristics and to develop <strong>the</strong><br />
meteorological inputs for <strong>the</strong> wind mapping system becomes even more important. Never<strong>the</strong>less,<br />
screening <strong>the</strong> available surface data helps identify <strong>the</strong> most reliable data for evaluating <strong>the</strong> wind<br />
characteristics and helps validate <strong>the</strong> resource estimates generated by <strong>the</strong> mapping system.<br />
5.3 Upper-Air Data<br />
The upper-air data, consisting <strong>of</strong> wind speed and direction pr<strong>of</strong>iles, are an important component<br />
in <strong>the</strong> development <strong>of</strong> <strong>the</strong> wind resource projections. These data are available in ei<strong>the</strong>r <strong>the</strong> ADP<br />
database or <strong>the</strong> Global Upper Air Climatic <strong>Atlas</strong> (GUACA).<br />
The upper-air database consists <strong>of</strong> information obtained from surface-launched meteorological<br />
instrument packages. These packages are usually launched once or twice daily, at 0000 GMT and<br />
1200 GMT, via balloon, and are managed under WMO guidance and procedures. There are 11<br />
locations in <strong>the</strong> Philippine archipelago where upper-air wind data are available from <strong>the</strong> ADP<br />
Database: Basco, Laoag, Baguio, Crow Valley, Clark AFB, Olongapo, Legaspi, Cebu, Puerto<br />
Princesa, Davao, and Zamboanga. These locations are shown in Figure 5-8.<br />
The GUACA data consist <strong>of</strong> monthly means and standard deviations <strong>of</strong> upper-air parameters for<br />
<strong>the</strong> mandatory pressure levels on a 2.5-degree global grid. The mandatory levels <strong>of</strong> interest<br />
include surface, 850 millibar (mb), 700 mb, and 500 mb.
26<br />
<strong>Wind</strong> <strong>Energy</strong> <strong>Resource</strong><br />
<strong>Atlas</strong> <strong>of</strong> <strong>the</strong> <strong>Philippines</strong><br />
Vertical pr<strong>of</strong>iles <strong>of</strong> wind speed and direction are an important meteorological input parameter for<br />
<strong>the</strong> wind mapping. Therefore, <strong>the</strong> vertical pr<strong>of</strong>iles must reflect ambient regional atmospheric<br />
flow and not be subject to major blocking effects from terrain features. Unfortunately, <strong>of</strong> <strong>the</strong>se<br />
11 stations, only <strong>the</strong> data from one (Legaspi) meet this particular requirement and could be used.<br />
Most <strong>of</strong> <strong>the</strong> stations could not be used because <strong>the</strong> local mountain ranges blocked <strong>the</strong> ambient<br />
flow. Some stations, such as Batanes, had insufficient data. Upper-air data from two stations<br />
near <strong>the</strong> <strong>Philippines</strong> were useful in estimating regional ambient vertical pr<strong>of</strong>iles. These stations<br />
were Pratas Island, located about 500 km west <strong>of</strong> Batanes, and Palau Island, located about 800<br />
km east <strong>of</strong> Mindanao. Summaries <strong>of</strong> <strong>the</strong> upper-air data for <strong>the</strong> three stations—Legaspi, Palau<br />
Island, and Pratas Island—are presented in Appendix C.<br />
The ADP data yielded pr<strong>of</strong>iles <strong>of</strong> monthly and annual average wind speed and frequency<br />
distributions <strong>of</strong> wind speed and direction for a number <strong>of</strong> pressure levels and height levels from<br />
<strong>the</strong> surface through 700 mb, or approximately 3,000 m. The ADP data was supplemented by <strong>the</strong><br />
GUACA data, which expanded <strong>the</strong> analysis to cover <strong>the</strong> entire archipelago.<br />
5.4 Satellite Ocean <strong>Wind</strong> Data<br />
Because <strong>the</strong> <strong>Philippines</strong> is an archipelago, <strong>the</strong>re is a large amount <strong>of</strong> water surface surrounding<br />
<strong>the</strong> country. The SSMI data set contains estimates <strong>of</strong> 10-m ocean wind speed measurements.<br />
These data also provide an excellent overview <strong>of</strong> <strong>the</strong> ambient wind conditions around <strong>the</strong> islands.<br />
The annual wind speeds for <strong>the</strong> 7-year period from 1988 to 1994, based on satellite data, are<br />
presented in Figure 5-9. The best wind speeds are along <strong>the</strong> nor<strong>the</strong>rn Luzon coast, <strong>the</strong> Batanes<br />
and Babuyan Islands, <strong>the</strong> nor<strong>the</strong>ast coastal areas, and <strong>the</strong> sou<strong>the</strong>ast coast <strong>of</strong> Mindanao. The<br />
lowest annual average wind speeds occur in <strong>the</strong> Celebes Sea, west <strong>of</strong> Mindoro, and <strong>the</strong> westsouthwest<br />
coast <strong>of</strong> Luzon. The annual data imply <strong>the</strong> presence <strong>of</strong> wind corridors in <strong>the</strong> straits<br />
between Luzon and Mindoro, Mindoro and Panay, and Panay and Negros.<br />
The wind power density map (Figure 5-10) parallels <strong>the</strong> annual wind speeds with <strong>the</strong> highest<br />
density <strong>of</strong>f <strong>the</strong> northwest coast <strong>of</strong> Luzon and <strong>the</strong> lowest density in <strong>the</strong> Celebes Sea. The SSMI<br />
data was also used to determine <strong>the</strong> Weibull k (shape) factor for <strong>the</strong> ocean areas. The k-value,<br />
shown in Figure 5-11, has a magnitude <strong>of</strong> 2.4–2.7 in <strong>the</strong> Batanes and Babuyan islands <strong>of</strong>f <strong>the</strong><br />
north coast <strong>of</strong> Luzon, a magnitude <strong>of</strong> 1.8–2.2 along <strong>the</strong> nor<strong>the</strong>ast coast, and a magnitude <strong>of</strong><br />
1.8-2.2 <strong>of</strong>f <strong>the</strong> north and east coasts <strong>of</strong> much <strong>of</strong> <strong>the</strong> <strong>Philippines</strong> from nor<strong>the</strong>rn Luzon southward to<br />
nor<strong>the</strong>rn Mindanao.<br />
The seasonal variation in wind speed and power density is dramatically illustrated for some areas<br />
in Figures 5-12 and 5-13. Plots for all <strong>of</strong> <strong>the</strong> areas are included in Appendix D. In December,<br />
monthly average wind speeds <strong>of</strong>f <strong>the</strong> nor<strong>the</strong>rn coast <strong>of</strong> Luzon exceed 11.0 m/s, and wind speeds<br />
are in <strong>the</strong> range <strong>of</strong> 8.0 to 10.0 m/s <strong>of</strong>f <strong>the</strong> east and nor<strong>the</strong>ast coast <strong>of</strong> <strong>the</strong> archipelago. The wind<br />
corridors between <strong>the</strong> islands <strong>of</strong> Luzon and Mindoro, Mindoro and Panay, and Panay and Negros<br />
appear to have December monthly wind speeds in excess <strong>of</strong> 8.0 m/s. Also, <strong>the</strong> sou<strong>the</strong>ast corner<br />
<strong>of</strong> Mindanao Island appears to have December monthly average wind speed <strong>of</strong> 7.5 m/s.
Station<br />
WMO No.<br />
Table 5-4. <strong>Philippines</strong>’ Stations from DATSAV2 Files<br />
Station<br />
Name<br />
Latitude<br />
dd mm<br />
Longitude<br />
dd mm<br />
27<br />
Period <strong>of</strong><br />
Record<br />
<strong>Wind</strong> <strong>Energy</strong> <strong>Resource</strong><br />
<strong>Atlas</strong> <strong>of</strong> <strong>the</strong> <strong>Philippines</strong><br />
Average<br />
WS<br />
(m/s)<br />
Average<br />
<strong>Wind</strong> Power<br />
(W/m 2 )<br />
984350 Alabat Is. 14 05 122 01 1973-96 2.9 49<br />
984320 Ambulong/Luzon 14 05 121 03 1973-96 1.6 14<br />
982320 Aparri/Luzon 18 22 121 38 1973-96 3.6 86<br />
983280 Baguio/Luzon 16 25 120 36 1973-96 2.0 24<br />
983330 Baler/Luzon 15 46 121 34 1973-96 2.1 36<br />
983260 Basa 14 59 120 29 1973-85 2.6 24<br />
981350 Basco/Batan Is. 20 27 121 58 1973-96 4.1 125<br />
985530 Borongan/Samar Is. 11 37 125 26 1973-87 2.2 26<br />
987520 Butuan/Mindanao is. 8 56 125 31 1981-96 1.2 12<br />
983300 Cabananatuan/Luzon 15 29 120 58 1990-96 1.7 17<br />
987480 Cagayan de Oro 8 29 124 38 1973-96 1.1 7<br />
984310 Calapan/Mindoro Is. 12 21 121 02 1973-96 2.1 26<br />
981330 Calayan Is. 19 16 121 28 1973-96 3.0 54<br />
983360 Casiguran /Luzon 16 17 122 07 1973-96 1.7 30<br />
984470 Cataduanes Radar 13 59 124 19 1973-96 3.7 71<br />
985460 Catarman/Samar 12 29 124 38 1973-96 2.1 36<br />
985480 Catbalogan/Samar Is. 11 47 124 53 1973-96 1.1 11<br />
983270 Clark 15 11 120 33 1973-91 1.9 16<br />
985260 Coron/Calamin 12 00 120 12 1973-96 1.6 13<br />
987460 Cotabato 7 10 124 13 1986-96 2.2 24<br />
983220 Crow Valley 15 19 120 23 1975-90 2.2 17<br />
986300 Cuyo Is. 10 51 121 02 1973-96 3.5 123<br />
984390 Daet 14 07 122 57 1973-93 2.0 18<br />
984400 Daet 14 08 122 59 1974-96 3.4 80<br />
983250 Dagupan/Luzon 16 03 120 20 1973-96 2.6 45<br />
987540 Davao 7 04 125 36 1973-75 2.2 31<br />
987530 Davao 7 07 125 39 1974-96 1.5 12<br />
987410 Dipolog/Mindanao 8 36 123 21 1973-96 1.6 14<br />
986420 Dumaguette.Negros Is. 9 18 123 18 1973-96 1.6 18<br />
988510 General Santos 6 07 125 11 1973-96 1.4 12<br />
985580 Guiuan/Samar Is. 11 02 125 44 1974-96 3.7 102<br />
987550 Hinatuan/Mindanao 8 22 126 20 1973-96 2.1 23<br />
983240 Iba/Luzon 15 20 119 58 1973-96 3.0 52<br />
986370 Iloilo/Panay Is. 10 42 122 34 1973-96 3.1 49<br />
984340 Infanta/Luzon 14 45 121 39 1973-96 1.8 23<br />
981320 Itbayat Is. 20 48 121 51 1973-96 3.6 70<br />
988300 Jolo Is. 6 03 121 00 1973-90 1.1 11<br />
982230 Laoag 18 11 120 32 1973-96 2.6 37<br />
984440 Legaspi/Luzon Is. 13 08 123 44 1973-96 2.8 42<br />
987470 Lumbia Airport 8 26 124 17 1977-96 2.1 17<br />
986480 Maasin/Leyte Is. 10 08 124 50 1973-96 2.3 22<br />
985430 Macatan/Masbate 12 22 123 37 1973-96 2.3 27<br />
986460 Mactan 10 18 123 58 1973-96 2.5 30
Station<br />
WMO No.<br />
Table 5-4 <strong>Philippines</strong>’ Stations from DATSAV2 Files (continued)<br />
Station<br />
Name<br />
Latitude<br />
dd mm<br />
Longitude<br />
dd mm<br />
28<br />
Period <strong>of</strong><br />
Record<br />
<strong>Wind</strong> <strong>Energy</strong> <strong>Resource</strong><br />
<strong>Atlas</strong> <strong>of</strong> <strong>the</strong> <strong>Philippines</strong><br />
Average<br />
WS<br />
(m/s)<br />
Average<br />
<strong>Wind</strong> Power<br />
(W/m 2 )<br />
987510 Malaybalay Is./Mindanao 8 09 125 05 1973-96 0.9 5<br />
984250 Manila 14 35 120 59 1978-96 2.7 49<br />
984375 Marinduque Is. 13 22 121 50 1984-91 6.3 242<br />
983290 Munoz/Luzon 15 43 120 54 1973-96 2.2 29<br />
986020 Nanshan Is. 10 43 115 49 1983-89 4.4 131<br />
984295 Nichols 14 31 121 01 1973-85 3.2 48<br />
984290 Ninoy Aquino 14 31 121 00 1973-96 3.6 165<br />
984260 Olongapo 14 48 120 16 1973-96 3.2 52<br />
985010 Pagasa Is. 11 01 114 10 1979-81 4.3 114<br />
986180 Puerto Princesa 9 45 118 44 1973-96 1.8 22<br />
984300 Quezon City 14 38 121 01 1973-96 1.4 18<br />
985360 Romblon/Tablas Is. 12 35 122 16 1973-96 2.8 47<br />
985380 Roxas/Panay Is. 11 35 122 45 1973-96 3.3 51<br />
984370 San Francisco 13 22 122 31 1985-96 2.7 45<br />
984310 San Jose/Mindoro Is. 12 21 121 02 1981-96 3.0 58<br />
984280 Sangley Point 14 30 120 55 1974-96 2.7 41<br />
986530 Surigao/Mindanao 9 48 125 30 1973-96 2.4 26<br />
985500 Tacloban/Leyte Is. 11 15 125 00 1973-96 1.8 23<br />
986440 Tagbilaran 9 36 123 51 1973-96 1.4 13<br />
984270 Tayabas 14 02 121 35 1973-96 1.6 19<br />
982330 Tuguegardo/Luzon 17 37 121 44 1973-96 1.9 42<br />
982220 Vigan/Luzon 17 34 120 23 1973-96 2.6 44<br />
984460 Virac/Catanduanes Is. 13 35 124 14 1973-96 3.1 60<br />
988360 Zamboanga 6 54 122 04 1973-96 1.7 18<br />
The wind power density in December exceeds 1200 W/m 2 <strong>of</strong>f <strong>the</strong> northwest tip <strong>of</strong> Luzon. The<br />
wind power density in December is also quite good along <strong>the</strong> nor<strong>the</strong>astern and eastern coast <strong>of</strong><br />
<strong>the</strong> archipelago and along <strong>the</strong> wind corridors between <strong>the</strong> islands.<br />
In August, under <strong>the</strong> southwest monsoon conditions, <strong>the</strong> wind resource is substantially less across<br />
<strong>the</strong> archipelago. The northwest coast <strong>of</strong> Luzon continues to have a good wind resource with wind<br />
speeds <strong>of</strong> 6.5–7.0 m/s. There are also good areas <strong>of</strong> wind resource in August <strong>of</strong>f <strong>the</strong> sou<strong>the</strong>ast<br />
Mindanao coast, with wind speeds <strong>of</strong> 7.0–8.0 m/s. The wind resource along <strong>the</strong> nor<strong>the</strong>ast Luzon<br />
coast is substantially less in August, because <strong>the</strong> terrain blocks <strong>the</strong> prevailing southwest monsoon<br />
flow. The analysis <strong>of</strong> <strong>the</strong> satellite wind-speed data indicates <strong>the</strong> highest wind power density in<br />
August is <strong>of</strong>f <strong>the</strong> sou<strong>the</strong>ast coast <strong>of</strong> Mindanao and <strong>the</strong> nor<strong>the</strong>rn portion <strong>of</strong> <strong>the</strong> Sibuyan Sea.
PALAWAN<br />
MINDORO<br />
PANAY<br />
SULU<br />
NEGROS<br />
BATANES<br />
LUZON<br />
SAMAR<br />
LEYTE<br />
MINDANAO
5.5 <strong>Wind</strong> <strong>Resource</strong> Distribution and Characteristics<br />
5.5.1 Annual <strong>Wind</strong> <strong>Resource</strong> Distribution<br />
<strong>Wind</strong> <strong>Energy</strong> <strong>Resource</strong><br />
<strong>Atlas</strong> <strong>of</strong> <strong>the</strong> <strong>Philippines</strong><br />
The wind resource over <strong>the</strong> <strong>Philippines</strong> varies considerably and is strongly dependent on three<br />
main factors: latitude, topography or elevation, and proximity to <strong>the</strong> coastline.<br />
According to <strong>the</strong> wind speed and power density computed from <strong>the</strong> satellite ocean wind data, <strong>the</strong><br />
best annual wind resource is in <strong>the</strong> islands <strong>of</strong> Batanes Province north <strong>of</strong> Luzon; <strong>the</strong> north and<br />
northwest coast <strong>of</strong> Luzon; <strong>the</strong> nor<strong>the</strong>ast- and east-facing coasts <strong>of</strong> Luzon and Samar; <strong>the</strong> sou<strong>the</strong>ast<br />
coast <strong>of</strong> Mindanao; and <strong>the</strong> straits between Mindoro and Luzon, Mindoro and Panay, and Panay<br />
and Negros. The satellite wind data and wind power density shows, in general, a strong<br />
relationship between latitude and <strong>the</strong> resource (Figure 5-9). <strong>Wind</strong> power density ranges from<br />
500–600 W/m 2 along <strong>the</strong> northwest Luzon coast (Figure 5-10) to 250-350 W/m 2 between<br />
Mindoro and Panay, 250–300 W/m 2 along <strong>the</strong> eastern coast <strong>of</strong> Luzon and <strong>the</strong> nor<strong>the</strong>rn coast <strong>of</strong><br />
Samar, and less than 100 W/m 2 <strong>of</strong>f <strong>the</strong> southwest coast <strong>of</strong> Mindanao.<br />
The NPC wind data, presented in Tables 5-2 and 5-3, show that hilly areas along <strong>the</strong> immediate<br />
coast <strong>of</strong> nor<strong>the</strong>rn Luzon in Ilocos Norte, and at one interior ridge top in Mountain Province, have<br />
a good annual wind resource. At <strong>the</strong> seven monitoring sites in Ilocos Norte, <strong>the</strong> annual average<br />
wind speed over <strong>the</strong> period <strong>of</strong> record ranges from 5.7 m/s (Saoit) to 7.7 m/s (Subec). The average<br />
annual wind power density ranges from 267 W/m 2 to 669 W/m 2 . At <strong>the</strong> ridge top site (Sagada),<br />
with an elevation <strong>of</strong> 1,871 m, <strong>the</strong> annual average wind speed at 30 m above ground level was 7.1<br />
m/s, and <strong>the</strong> power density was 393 W/m 2 .<br />
5.5.2 Seasonal <strong>Wind</strong> <strong>Resource</strong> Distribution<br />
The satellite ocean wind data were processed to compare <strong>the</strong> seasonal distribution <strong>of</strong> <strong>the</strong> wind<br />
resource among <strong>the</strong> different regions <strong>of</strong> <strong>the</strong> <strong>Philippines</strong>. Plots <strong>of</strong> <strong>the</strong> monthly average wind<br />
speeds and power densities are shown for some areas in Figures 5-12 and 5-13 and for all areas in<br />
Appendix D. Through an examination <strong>of</strong> <strong>the</strong>se plots, some conclusions can be made regarding<br />
patterns for <strong>the</strong> seasonal wind resource in <strong>the</strong> coastal regions and <strong>of</strong>fshore islands <strong>of</strong> <strong>the</strong><br />
<strong>Philippines</strong>.<br />
Throughout most <strong>of</strong> <strong>the</strong> <strong>Philippines</strong>, <strong>the</strong> highest wind resource occurs from November through<br />
February and <strong>the</strong> lowest from April through September. However, <strong>the</strong>re are some significant<br />
regional differences in <strong>the</strong> seasonal variability. For example, <strong>the</strong> months with <strong>the</strong> highest wind<br />
resource are October through February in <strong>the</strong> nor<strong>the</strong>rn <strong>Philippines</strong>, and November through March<br />
in much <strong>of</strong> <strong>the</strong> central and sou<strong>the</strong>rn <strong>Philippines</strong>. Two regions <strong>of</strong> <strong>the</strong> <strong>Philippines</strong>—<strong>the</strong><br />
sou<strong>the</strong>astern Mindanao coast and <strong>the</strong> western coast <strong>of</strong> Palawan—have a relatively high wind<br />
resource during <strong>the</strong> southwest monsoon, about as high as that <strong>of</strong> <strong>the</strong> nor<strong>the</strong>ast monsoon. In all<br />
o<strong>the</strong>r regions with significant wind resource potential, <strong>the</strong> wind resource during <strong>the</strong> nor<strong>the</strong>ast<br />
monsoon is considerably greater than that during <strong>the</strong> southwest monsoon.<br />
The analysis <strong>of</strong> surface wind-resource data from meteorological stations may or may not provide<br />
reliable indications <strong>of</strong> <strong>the</strong> seasonal variation at exposed sites in <strong>the</strong> area. For example, long-term<br />
wind data (1973–1996) from <strong>the</strong> meteorological station at Basco in Batanes Province indicate that<br />
<strong>the</strong> month with <strong>the</strong> highest wind resource is August, during <strong>the</strong> peak <strong>of</strong> <strong>the</strong> southwest monsoon.<br />
However, <strong>the</strong> seasonal pattern <strong>of</strong> wind resource at <strong>the</strong> meteorological station is substantially<br />
35
36<br />
<strong>Wind</strong> <strong>Energy</strong> <strong>Resource</strong><br />
<strong>Atlas</strong> <strong>of</strong> <strong>the</strong> <strong>Philippines</strong><br />
different from that <strong>of</strong> <strong>the</strong> ocean satellite wind data for <strong>the</strong> Batanes region. The satellite data<br />
indicate that <strong>the</strong> wind-power density during <strong>the</strong> nor<strong>the</strong>ast monsoon (October through February) is<br />
in <strong>the</strong> range <strong>of</strong> 400–600 W/m 2 , whereas, during <strong>the</strong> southwest monsoon (July and August), <strong>the</strong><br />
wind power density is in <strong>the</strong> range <strong>of</strong> 200–300 W/m 2 . The wind power measured at <strong>the</strong> Basco<br />
meteorological station is almost as great as that indicated by <strong>the</strong> satellite data during <strong>the</strong><br />
southwest monsoon. However, during <strong>the</strong> nor<strong>the</strong>ast monsoon, <strong>the</strong> wind power at <strong>the</strong><br />
meteorological station averages only about one-fourth that <strong>of</strong> <strong>the</strong> satellite data. From an<br />
inspection <strong>of</strong> topographic maps, it appears that <strong>the</strong> meteorological station is blocked from <strong>the</strong><br />
nor<strong>the</strong>ast monsoon flow by a mountain upwind. This probably explains <strong>the</strong> peculiar seasonal<br />
pattern observed at <strong>the</strong> meteorological station and <strong>the</strong> severely reduced wind power during <strong>the</strong><br />
nor<strong>the</strong>ast monsoon season.<br />
The pronounced seasonal variation in <strong>the</strong> wind resource is also seen in Figures 5-5 to 5-7<br />
(previously presented). These data, from <strong>the</strong> NPC sites at Pagali (coastal) and Sagada (inland,<br />
elevated) clearly show that both wind speed and power reach <strong>the</strong>ir minimums in <strong>the</strong> late spring to<br />
late summer, with June having <strong>the</strong> lowest values. The wind resource increases beginning in<br />
October, reaches a peak in December, and gradually decreases through <strong>the</strong> spring. For Guimaras<br />
Island, <strong>the</strong> peak wind speeds occur in February, later than <strong>the</strong>y do in nor<strong>the</strong>rn Luzon.<br />
5.5.3 Diurnal <strong>Wind</strong> Speed Distribution<br />
The diurnal wind speed distribution, or wind speed versus time <strong>of</strong> day, is influenced by site<br />
elevation and proximity to <strong>the</strong> Pacific Ocean. The distribution at low-elevation, inland sites in<br />
simple terrain typically reveals a maximum wind speed during <strong>the</strong> afternoon and a minimum near<br />
sunrise. The primary forcing mechanism for this pattern is <strong>the</strong> daytime heating, which<br />
destabilizes <strong>the</strong> lower levels <strong>of</strong> <strong>the</strong> atmosphere, resulting in a downward transfer <strong>of</strong> momentum to<br />
<strong>the</strong> surface. The near-surface winds tend to peak in <strong>the</strong> early afternoon, which corresponds to <strong>the</strong><br />
time <strong>of</strong> maximum heating. In <strong>the</strong> late afternoon and evening, <strong>the</strong> declining supply <strong>of</strong> sunshine<br />
leads to surface cooling and a decoupling <strong>of</strong> <strong>the</strong> <strong>the</strong>rmally forced momentum exchange. Surface<br />
winds begin to decelerate, while winds al<strong>of</strong>t, previously restrained by friction, are free to<br />
accelerate. The minimum in surface wind speed near sunrise corresponds to <strong>the</strong> time <strong>of</strong><br />
maximum atmospheric stability. The chart <strong>of</strong> speed and power by hour in Appendix A for <strong>the</strong><br />
NPC sites in Ilocos Norte shows this phenomenon. From an early morning minimum, wind<br />
speeds increase rapidly following sunrise, reaching a peak during <strong>the</strong> mid-afternoon. <strong>Wind</strong>s<br />
decrease until after sunset and <strong>the</strong>n remain steady during <strong>the</strong> late night and early morning hours.<br />
Mountaintop diurnal distributions differ from those <strong>of</strong> low-elevation sites. The strongest winds at<br />
mountain locations occur at night, while <strong>the</strong> lowest wind speeds are observed during <strong>the</strong> midday<br />
hours. The chart for Sagada, showing speed and power by <strong>the</strong> hour, is included in Appendix A.<br />
The chart shows a well-defined maximum late at night and a minimum during <strong>the</strong> mid-afternoon.<br />
Over <strong>the</strong> ocean, <strong>the</strong> diurnal variation <strong>of</strong> <strong>the</strong> atmospheric instability is typically reversed, resulting<br />
in a wind speed maximum at night and a minimum in <strong>the</strong> afternoon. However, diurnal wind<br />
speed changes are more complicated on <strong>the</strong> islands. The curves <strong>of</strong> average diurnal wind speed<br />
for island sites are <strong>of</strong>ten flatter than those observed over land. The plots <strong>of</strong> wind speed and power<br />
by hour for Guimaras and Cuyo Islands show a general peak during <strong>the</strong> early afternoon and a<br />
relative minimum during <strong>the</strong> night. The distribution is relatively flat for Cuyo Island, varying by<br />
less than 3 m/s, but is much more pronounced for Guimaras Island.
37<br />
<strong>Wind</strong> <strong>Energy</strong> <strong>Resource</strong><br />
<strong>Atlas</strong> <strong>of</strong> <strong>the</strong> <strong>Philippines</strong><br />
The magnitude <strong>of</strong> <strong>the</strong> diurnal variation is a function <strong>of</strong> <strong>the</strong> season, elevation, and influence <strong>of</strong> <strong>the</strong><br />
ocean. From <strong>the</strong> NPC data, <strong>the</strong> seven stations in Ilocos Norte show a more pronounced diurnal<br />
variation in <strong>the</strong> winter and slightly less in <strong>the</strong> summer. For <strong>the</strong> high elevation site, <strong>the</strong> diurnal<br />
variation is also more pronounced during <strong>the</strong> winter and less so in <strong>the</strong> summer. For <strong>the</strong> island<br />
sites, Cuyo and Guimaras, <strong>the</strong> diurnal variations are greater during <strong>the</strong> winter than <strong>the</strong> summer.<br />
5.5.4 <strong>Wind</strong> Direction Frequency Distribution<br />
The wind speed frequency distribution at a site in <strong>the</strong> <strong>Philippines</strong> is influenced principally by <strong>the</strong><br />
nor<strong>the</strong>ast and southwest monsoons and secondarily by latitude and elevation.<br />
Appendix B contains data from <strong>the</strong> DATSAV2 database, including <strong>the</strong> hourly wind speed and<br />
wind direction data for Daet on Luzon, Guiuan on Samar Island, and Cuyo Island. On an annual<br />
basis, <strong>the</strong> wind is from <strong>the</strong> nor<strong>the</strong>ast nearly 25% <strong>of</strong> <strong>the</strong> time at Daet, 28% <strong>of</strong> <strong>the</strong> time at Guiuan,<br />
and more than 40% at Cuyo Island. The wind direction is southwest approximately 20% <strong>of</strong> <strong>the</strong><br />
time at Cuyo Island; however, <strong>the</strong> southwest wind direction is not as pronounced at Daet or<br />
Guiuan. On a monthly basis, <strong>the</strong> predominance <strong>of</strong> <strong>the</strong> monsoon flow can clearly be seen. For<br />
Daet on Luzon, <strong>the</strong> wind direction is ei<strong>the</strong>r nor<strong>the</strong>ast or east from December to April and south or<br />
southwest in August. The o<strong>the</strong>r months are transitional months with a mix <strong>of</strong> wind directions as<br />
<strong>the</strong> different monsoon flows become established. The pattern is slightly different at Guiuan, with<br />
a predominant nor<strong>the</strong>ast or east wind direction extending from November to May and southwest<br />
or west winds from July through September. For Cuyo Island, <strong>the</strong> wind direction is exclusively<br />
nor<strong>the</strong>ast from November to March and principally southwest from June through September.<br />
The NPC data (Appendix A) from <strong>the</strong> stations in Ilocos Norte show a slightly different<br />
distribution <strong>of</strong> wind directions. On an annual basis, four stations—Bayog, Caparispisan, Pagali,<br />
and Saoit—show that nearly 30% <strong>of</strong> <strong>the</strong> time <strong>the</strong> wind is from <strong>the</strong> nor<strong>the</strong>ast or east. On a<br />
monthly basis, <strong>the</strong>se four sites show that nor<strong>the</strong>ast wind directions predominate from October<br />
through April and <strong>the</strong>n become much more variable from May through September. The nor<strong>the</strong>ast<br />
wind direction is associated with <strong>the</strong> best wind resource; that is, <strong>the</strong> highest monthly wind speeds<br />
and highest wind power density, for Ilocos Norte. For two o<strong>the</strong>r stations, Agaga and Subec, a<br />
predominately north component is indicated. This could be due to a local effect or, more likely,<br />
to faulty wind direction data in <strong>the</strong> data set. At Sagada, <strong>the</strong> interior mountain site in Mountain<br />
Province, on an annual basis, <strong>the</strong> wind directions are from <strong>the</strong> north 20% <strong>of</strong> <strong>the</strong> time, nor<strong>the</strong>ast<br />
25% <strong>of</strong> <strong>the</strong> time, and west 7.5% <strong>of</strong> <strong>the</strong> time. On a monthly basis, <strong>the</strong> wind direction is<br />
predominately east-nor<strong>the</strong>ast from January to March with a secondary peak from <strong>the</strong> west. From<br />
April to August, <strong>the</strong> wind directions are evenly distributed, ei<strong>the</strong>r east-nor<strong>the</strong>ast or west 35% to<br />
40 % <strong>of</strong> <strong>the</strong> time, with <strong>the</strong> remainder spread over <strong>the</strong> o<strong>the</strong>r directions. This site also indicated a<br />
significant nor<strong>the</strong>rly component to <strong>the</strong> wind direction distribution from September to December.<br />
Again, this could be due to a local effect, or more likely, to faulty wind direction data in <strong>the</strong> data<br />
set.
38<br />
<strong>Wind</strong> <strong>Energy</strong> <strong>Resource</strong><br />
<strong>Atlas</strong> <strong>of</strong> <strong>the</strong> <strong>Philippines</strong><br />
6.0 <strong>Wind</strong> Mapping and Identification <strong>of</strong> <strong>Resource</strong> Areas<br />
6.1 Introduction<br />
This section presents an overview <strong>of</strong> <strong>the</strong> input data files, <strong>the</strong> results <strong>of</strong> <strong>the</strong> wind mapping, and<br />
wind-power density estimates for <strong>the</strong> <strong>Philippines</strong>. Two classification schemes for wind power<br />
density are used: one for wind power technology in rural areas and one for utility-scale<br />
applications. A description <strong>of</strong> <strong>the</strong> detailed meteorological data files is also presented. We used<br />
22 different wind pr<strong>of</strong>iles in <strong>the</strong> modeling study, because <strong>of</strong> <strong>the</strong> large variability <strong>of</strong> <strong>the</strong><br />
meteorological attributes across <strong>the</strong> archipelago.<br />
To portray <strong>the</strong> mapping results, <strong>the</strong> Philippine archipelago was divided into 13 regions. Each<br />
region covered an area approximately 300 km by 300 km. The regional divisions were<br />
determined principally on <strong>the</strong> geography <strong>of</strong> <strong>the</strong> archipelago and <strong>the</strong> desire to maintain <strong>the</strong> same<br />
map scale for each region.<br />
6.2 <strong>Wind</strong> Power Classifications<br />
The wind power classifications for <strong>the</strong> <strong>Philippines</strong> are presented in Table 6-1. Two different<br />
classifications are used in <strong>the</strong> analysis: one for utility-scale applications and one for rural power<br />
applications. For utility-scale applications, areas with a Class 2 and higher resource potential are<br />
considered suitable for wind power development. For rural applications, areas with a Class 1 or<br />
higher are considered suitable for wind power development. In reviewing <strong>the</strong> mapping results, it<br />
is important to keep <strong>the</strong>se classifications separate, because an area considered marginal from a<br />
utility-scale-application point <strong>of</strong> view is considered moderate from a rural power application<br />
point <strong>of</strong> view.<br />
Class <strong>Resource</strong> Potential<br />
Utility Rural<br />
Table 6-1. <strong>Wind</strong> Power Classification<br />
<strong>Wind</strong> Power<br />
Density (W/m 2 )<br />
@ 30 m<br />
<strong>Wind</strong> Speed (a)<br />
(m/s) @ 30 m<br />
1 Marginal Moderate 100 - 200 4.4 - 5.6<br />
2 Moderate Good 200 - 300 5.6 - 6.4<br />
3 Good Excellent 300 - 400 6.4 - 7.0<br />
4 Excellent Excellent 400 - 600 7.0 - 8.0<br />
5 Excellent Excellent 600 - 800 8.0 - 8.8<br />
6 Excellent Excellent 800 -1200 8.8 -10.1<br />
(a) Mean wind speed is estimated assuming a Weibull distribution <strong>of</strong> wind speeds with a shape factor (k) <strong>of</strong> 2.0 and<br />
standard sea-level air density. The actual mean wind speed may differ from <strong>the</strong>se estimated values by as much as<br />
20%, depending on <strong>the</strong> actual wind speed distribution (or Weibull k value) and elevation above sea level.<br />
6.3 Approach<br />
We previously presented <strong>the</strong> description <strong>of</strong> <strong>the</strong> mapping methodology in Section 4.0. <strong>NREL</strong><br />
prepared <strong>the</strong> digital terrain data set from <strong>the</strong> DEM information for <strong>the</strong> <strong>Philippines</strong>. <strong>NREL</strong> also<br />
prepared <strong>the</strong> meteorological data files necessary for <strong>the</strong> modeling analysis. These meteorological
39<br />
<strong>Wind</strong> <strong>Energy</strong> <strong>Resource</strong><br />
<strong>Atlas</strong> <strong>of</strong> <strong>the</strong> <strong>Philippines</strong><br />
data files included vertical wind pr<strong>of</strong>iles, wind power roses that express <strong>the</strong> percentage <strong>of</strong> total<br />
wind-power density by direction sector, and open-ocean wind power density. The vertical<br />
pr<strong>of</strong>iles are broken down into 100-m intervals and centered every 100 m above sea level, except<br />
for <strong>the</strong> lowest layer, which is at 50 meters.<br />
The vertical pr<strong>of</strong>iles were carefully determined, based primarily on <strong>the</strong> upper-air data, and <strong>the</strong>n<br />
subjectively modified to derive <strong>the</strong> final pr<strong>of</strong>iles for 22 specific geographic zones. <strong>Wind</strong> roses<br />
were developed to account for <strong>the</strong> effects <strong>of</strong> short-range (less than 10 km), medium-range (10–50<br />
km), and long-range (>50 km) blocking <strong>of</strong> <strong>the</strong> ambient wind flow by terrain. For this analysis,<br />
we incorporated <strong>the</strong> medium- and short-range blocking into one wind rose and <strong>the</strong> long-range<br />
blocking into a second wind rose.<br />
6.4 Mapping Regions<br />
The Philippine archipelago is divided into 13 regions. These regions are presented in Figure 6-1.<br />
The regions are:<br />
1) Batanes and Babuyan<br />
2) Nor<strong>the</strong>rn Luzon<br />
3) Central Luzon<br />
4) Mindoro, Sou<strong>the</strong>rn Luzon, Romblon, and Marinduque<br />
5) Sou<strong>the</strong>astern Luzon, Catanduanes, and Masbate<br />
6) Samar and Leyte<br />
7) Panay, Negros, Cebu, and Siquijor<br />
8) Nor<strong>the</strong>rn Mindanao and Bohol<br />
9) Sou<strong>the</strong>rn Mindanao<br />
10) Western Mindanao and Basilan<br />
11) Nor<strong>the</strong>rn Palawan<br />
12) Sou<strong>the</strong>rn Palawan<br />
13) Sulu, Basilan, and Tawi-Tawi<br />
6.5 Mapping Results<br />
6.5.1 Batanes and Babuyan<br />
This region is <strong>the</strong> nor<strong>the</strong>rnmost land area in <strong>the</strong> <strong>Philippines</strong> and consists <strong>of</strong> eight large islands—<br />
Itbayat, Batan, Sabtang, Babuyan, Calayan, Dalupiri, Fuga, and Camiguin—and numerous<br />
smaller islands. There are areas with good-to-excellent wind resource on each <strong>of</strong> <strong>the</strong>se islands for<br />
both rural and utility-scale applications. Figures 6-2, 6-3, and 6-4 illustrate <strong>the</strong> significant<br />
political features, topography, and potential wind resource <strong>of</strong> this region.<br />
On Itbayat Island, <strong>the</strong> wind resource is rated excellent (500–700 W/m 2 ) at <strong>the</strong> nor<strong>the</strong>ast tip <strong>of</strong> <strong>the</strong><br />
island and good elsewhere. On Batan Island, <strong>the</strong>re is an area <strong>of</strong> excellent resource at Rocavato<br />
Point and <strong>the</strong> higher terrain on <strong>the</strong> south end <strong>of</strong> <strong>the</strong> island. Coastal areas along <strong>the</strong> sou<strong>the</strong>ast and<br />
south end <strong>of</strong> <strong>the</strong> island are considered to have a good wind resource. The inland area at <strong>the</strong> north<br />
end <strong>of</strong> <strong>the</strong> island, north and east <strong>of</strong> <strong>the</strong> town <strong>of</strong> Basco, is considered to have a poor wind resource.
40<br />
<strong>Wind</strong> <strong>Energy</strong> <strong>Resource</strong><br />
<strong>Atlas</strong> <strong>of</strong> <strong>the</strong> <strong>Philippines</strong><br />
In a similar fashion, <strong>the</strong> higher terrain in <strong>the</strong> north-central part <strong>of</strong> Sabtang Island has an excellent<br />
resource, and <strong>the</strong> north-, east-, and south-facing coastal areas have a good wind resource. The<br />
only area considered to have a poor wind resource is <strong>the</strong> central-west side <strong>of</strong> <strong>the</strong> island, which is<br />
sheltered from <strong>the</strong> prevailing easterly flow. For Babuyan Island, an excellent wind resource<br />
exists in <strong>the</strong> higher, central portion <strong>of</strong> <strong>the</strong> island, while a good-to-excellent wind resource exists<br />
on <strong>the</strong> coastal portions <strong>of</strong> <strong>the</strong> nor<strong>the</strong>ast cape, <strong>the</strong> sou<strong>the</strong>rn tip, and <strong>the</strong> western cape.<br />
For Camiguin Island, an excellent wind resource exists on <strong>the</strong> interior high terrain and at <strong>the</strong><br />
sou<strong>the</strong>rn tip (Genlous Point). A moderate-to-good wind resource exists along all coastal sections<br />
with better resources at Machibat Point and Nagayaman Point. For Calayan Island, <strong>the</strong> interior<br />
hills and ridges have an excellent wind resource with good-to-excellent resources along <strong>the</strong><br />
nor<strong>the</strong>rn and eastern coastline including Priddan Point, Batang Point, and Tumulod Point. The<br />
wind resource on Dalupiri Island and Fuga Island is rated excellent on <strong>the</strong> interior elevations and<br />
good to excellent across <strong>the</strong> coastal and interior areas <strong>of</strong> each island.<br />
6.5.2 Nor<strong>the</strong>rn Luzon<br />
The significant political features, topography, and potential wind resource <strong>of</strong> nor<strong>the</strong>rn Luzon are<br />
illustrated in Figures 6-5, 6-6, and 6-7. The wind resource in nor<strong>the</strong>rn Luzon is confined to <strong>the</strong><br />
eastern, nor<strong>the</strong>rn, and northwestern coastal sections; coastal hills; and interior high-elevation<br />
areas. The flat coastal sections, from <strong>the</strong> coastline to several kilometers inland, are classified as<br />
having a marginal wind resource for utility-scale applications and a good resource for rural power<br />
applications. The area inland (south) from Aparri along <strong>the</strong> Cagayan River is also classified as<br />
moderate for rural wind power applications.<br />
For <strong>the</strong> coastal sections, areas with a better wind resource include <strong>the</strong> capes at Bangui Bay and<br />
Pasaleng Bay, Palaui Island, <strong>the</strong> coastline between Escarpada Point and Matador Point, Palanan<br />
Bay, and <strong>the</strong> peninsula on <strong>the</strong> east coast near Casiguran.<br />
Good-to-excellent wind resources exist in Ilocos Norte in <strong>the</strong> coastal hills extending from Agaga<br />
to Dumalneg. This resource is generally confirmed by <strong>the</strong> NPC sites installed in this area. The<br />
wind-power-density measurements ranged from 267 W/m 2 at Saoit to 669 W/m 2 at Subec. Goodto-excellent<br />
wind resources are found in <strong>the</strong> Sierra Madre Mountains extending north to south<br />
along <strong>the</strong> eastern coast <strong>of</strong> nor<strong>the</strong>rn Luzon and <strong>the</strong> Cordillera Central Mountains in <strong>the</strong> interior <strong>of</strong><br />
Luzon. An area <strong>of</strong> moderate-to-good wind resource potential is found in <strong>the</strong> lake region<br />
northwest <strong>of</strong> Cabarroquis. The interior plains along <strong>the</strong> Cagayan River and from Lingayen Gulf<br />
past Tarlac have a poor wind resource, even for rural power applications.<br />
O<strong>the</strong>r areas with a moderate wind resource for rural power applications are <strong>the</strong> western and<br />
nor<strong>the</strong>rn coastal plains <strong>of</strong> <strong>the</strong> Province <strong>of</strong> Pangasinan in <strong>the</strong> southwest part <strong>of</strong> nor<strong>the</strong>rn Luzon.<br />
The hills and mountains extending south-sou<strong>the</strong>ast from Burgos to Mt. Iba are classified as<br />
having a good-to-excellent resource.<br />
6.5.3 Central Luzon<br />
The significant political features, topography, and wind mapping results for Central Luzon are<br />
illustrated in Figures 6-8, 6-9, and 6-10. The Central Luzon region encompasses <strong>the</strong> area from<br />
16.5 degrees to 13.5 degrees north latitude and includes metropolitan areas surrounding Manila.<br />
The wind resource in <strong>the</strong> flat interior and coastal sections <strong>of</strong> this area is generally moderate to<br />
good for rural power applications and marginal to moderate for utility-scale applications. The
41<br />
<strong>Wind</strong> <strong>Energy</strong> <strong>Resource</strong><br />
<strong>Atlas</strong> <strong>of</strong> <strong>the</strong> <strong>Philippines</strong><br />
area surrounding Manila Bay and extending north to Cabanatuan fits this description. Good-toexcellent<br />
wind resources are evident in <strong>the</strong> mountain chain running north–south into Bataan, <strong>the</strong><br />
high terrain north and sou<strong>the</strong>ast <strong>of</strong> Lake Taal, and <strong>the</strong> higher terrain sou<strong>the</strong>ast <strong>of</strong> Batangas.<br />
Good-to-excellent wind resources are evident in <strong>the</strong> mountains in <strong>the</strong> provinces <strong>of</strong> Bulacan, Rizal,<br />
and Quezon. The east-to-west-oriented ridgelines near Lamon Bay are also classified as having a<br />
good-to-excellent resource. Both Polillo Island, to <strong>the</strong> east <strong>of</strong> Central Luzon, and Lubang Island,<br />
to <strong>the</strong> southwest, have extensive areas <strong>of</strong> moderate-to-good wind resource. The majority <strong>of</strong> <strong>the</strong><br />
coastal and interior areas <strong>of</strong> <strong>the</strong> isthmus and peninsula between Tayabas Bay and Ragay Gulf, as<br />
well as Alabat Island, have a marginal-to-moderate wind resource (utility scale) and a moderateto-good<br />
resource (rural power scale). A good-to-excellent wind resource exists in <strong>the</strong> higher<br />
terrain at <strong>the</strong> sou<strong>the</strong>rn end <strong>of</strong> <strong>the</strong> peninsula east <strong>of</strong> San Francisco, at Dapdap Point, and <strong>the</strong> higher<br />
terrain surrounding Mt. Cadig.<br />
6.5.4 Mindoro, Sou<strong>the</strong>rn Luzon, Romblon, and Marinduque<br />
The significant political features, topography, and wind mapping results for this region are<br />
illustrated in Figures 6-11, 6-12, and 6-13. Mindoro, a large island in <strong>the</strong> <strong>Philippines</strong> archipelago,<br />
centered at 13 degrees north and 121 degrees east, is divided into two provinces, Occidental<br />
Mindoro and Oriental Mindoro. The topography consists <strong>of</strong> a coastal plain and a high mountain<br />
interior. Except in certain specific locations, <strong>the</strong> island has a limited developable wind resource.<br />
However, good-to-moderate wind resources for rural power applications can be found in several<br />
areas <strong>of</strong> <strong>the</strong> region: <strong>the</strong> nor<strong>the</strong>ast portion near Balingawan Point and Dumali Point, <strong>the</strong> northwest<br />
corner <strong>of</strong> <strong>the</strong> island at Calisurigan Point, along <strong>the</strong> sou<strong>the</strong>ast coastal sections from Soguicay Bay<br />
to Buruncan Point, and around Ilin Island on <strong>the</strong> south-southwest. Good-to-excellent wind<br />
resources are evident along <strong>the</strong> central mountain range from Tandrac Peak in <strong>the</strong> north to just<br />
north <strong>of</strong> Bulalakao in <strong>the</strong> south. Ano<strong>the</strong>r area <strong>of</strong> good-to-excellent wind resource is evident in <strong>the</strong><br />
high terrain north <strong>of</strong> Mamburao in <strong>the</strong> northwest and near Tusk Peak in <strong>the</strong> southwest. The<br />
Semirara Islands south <strong>of</strong> Mindoro have a uniformly good-to-excellent wind resource across all<br />
three islands.<br />
A similar wind resource pattern is evident in <strong>the</strong> Romblon Island group—Sibuyan, Tablas,<br />
Carabao and Romblon. On Sibuyan Island, a good-to-excellent wind resource is evident on <strong>the</strong><br />
high terrain in <strong>the</strong> eastern and central part <strong>of</strong> <strong>the</strong> island. A limited area <strong>of</strong> moderate-to-good wind<br />
resource for rural power applications exists on <strong>the</strong> immediate north coast. On Romblon Island<br />
itself, a moderate-to-good wind resource extends from north to south along <strong>the</strong> central part <strong>of</strong> <strong>the</strong><br />
island. On Tablas Island, a moderate-to-good wind resource exists on <strong>the</strong> southwest and sou<strong>the</strong>rn<br />
plains extending from Odiongan to Cabalian Point. A good-to-excellent wind resource occurs in<br />
<strong>the</strong> high mountains along <strong>the</strong> eastern side <strong>of</strong> <strong>the</strong> island. On Carabao Island, <strong>the</strong> wind resource<br />
across <strong>the</strong> entire island is classified as excellent for rural power applications.<br />
The northwest, north, and east coastal sections <strong>of</strong> Marinduque have a moderate-to-good wind<br />
resource for rural power applications and marginal to moderate for utility-scale power<br />
applications. Good-to-excellent wind resources are evident from Mogpog in <strong>the</strong> north to Suban<br />
Point in <strong>the</strong> south, along <strong>the</strong> interior mountain ranges on <strong>the</strong> eastern and southwestern sides <strong>of</strong> <strong>the</strong><br />
island.<br />
The wind resource in <strong>the</strong> portion <strong>of</strong> Luzon presented in Figure 6-13 was previously discussed in<br />
Section 6.5.4.
6.5.5 Sou<strong>the</strong>astern Luzon, Catanduanes and Masbate<br />
42<br />
<strong>Wind</strong> <strong>Energy</strong> <strong>Resource</strong><br />
<strong>Atlas</strong> <strong>of</strong> <strong>the</strong> <strong>Philippines</strong><br />
The significant political features, topography, and wind mapping results for Sou<strong>the</strong>astern Luzon,<br />
Catanduanes, and Masbate are illustrated in Figures 6-14, 6-15, and 6-16. Sou<strong>the</strong>astern Luzon<br />
includes <strong>the</strong> provinces <strong>of</strong> Camarines Norte, Camarines Sur, Albay, and portions <strong>of</strong> Sorsogon.<br />
The coastal areas, including several kilometers inland, as well as <strong>the</strong> plains south <strong>of</strong> San Miguel<br />
Bay and <strong>the</strong> plains west and south <strong>of</strong> Legaspi, have a marginal-to-moderate resource for utilityscale<br />
power applications and a moderate-to-good resource for rural power applications. O<strong>the</strong>r<br />
areas in Sorsogon having a similar resource include <strong>the</strong> coastal area and interior plains from<br />
Prieto Diaz to Barcellona, westward to Casiguran.<br />
The best wind resource in <strong>the</strong> coastal areas is found at Gumaus Point in Camarines Norte, near<br />
Daet; on Camarines Sur, at Quinabucasan Point sou<strong>the</strong>ast to Maslog; at <strong>the</strong> far eastern end <strong>of</strong> <strong>the</strong><br />
province at Rungus Point; and at Prieto Diaz and San Jose in Sorsogon. Good-to-excellent wind<br />
resources exist in <strong>the</strong> high interior areas <strong>of</strong> <strong>the</strong> provinces near Mt. Cadig, Mt Labo, <strong>the</strong> mountains<br />
west <strong>of</strong> San Miguel Bay, Mt Isarog, <strong>the</strong> east–west-oriented mountain chain from Buludan to<br />
Bitaogan in Camarines Sur, and <strong>the</strong> mountains in Albay and Sorsogon.<br />
The wind resource on San Miguel Island, Gagrary Island, Batan Island, and Rapu Rapu Island are<br />
also rated moderate to good for rural power applications and marginal to moderate for utilityscale<br />
power applications. The best resources are found on <strong>the</strong> higher terrain <strong>of</strong> Batan Island and<br />
Rapu Rapu Island.<br />
The Province <strong>of</strong> Catanduanes is located directly east <strong>of</strong> Camarines Sur. A moderate-to-good<br />
wind resource for rural power applications and marginal-to-moderate for utility-scale power<br />
applications exists along <strong>the</strong> north, east, and south coastal sections <strong>of</strong> <strong>the</strong> province. The best<br />
coastal resources appear to be at Binorong Point and Nagumbuaya Point, in <strong>the</strong> sou<strong>the</strong>ast part <strong>of</strong><br />
<strong>the</strong> island, and at Virac Point in <strong>the</strong> south. A good-to-excellent wind resource exists on <strong>the</strong> higher<br />
terrain in <strong>the</strong> north-central part <strong>of</strong> <strong>the</strong> island, on <strong>the</strong> eastern side <strong>of</strong> <strong>the</strong> island west <strong>of</strong> Gigmoto, at<br />
<strong>the</strong> sou<strong>the</strong>rn end in <strong>the</strong> higher terrain north <strong>of</strong> Virac, and in <strong>the</strong> terrain east <strong>of</strong> Codon in <strong>the</strong><br />
southwest part <strong>of</strong> <strong>the</strong> island.<br />
Masbate includes three separate islands—Burias, Ticao, and Masbate. The distribution <strong>of</strong> wind<br />
resource is very similar to o<strong>the</strong>r areas <strong>of</strong> <strong>the</strong> <strong>Philippines</strong>: <strong>the</strong> best resource is on <strong>the</strong> highest<br />
terrain. For Burias Island, <strong>the</strong> north-, east- and south-facing coastal sections have, in general, a<br />
moderate-to-good wind resource for rural power applications and a marginal-to-moderate<br />
resource for utility-scale power applications. The coastal and interior plains at <strong>the</strong> north end <strong>of</strong><br />
<strong>the</strong> island and in <strong>the</strong> center have a similar resource. A good-to-excellent resource for rural power<br />
applications (moderate to good for utility-scale applications) is indicated at <strong>the</strong> far north end <strong>of</strong><br />
<strong>the</strong> island and in <strong>the</strong> northwest. The best wind resource is associated with <strong>the</strong> higher terrain in <strong>the</strong><br />
central part <strong>of</strong> <strong>the</strong> island near Dancalan and in <strong>the</strong> south around Mt. Enganoso and Maputing<br />
Baybay.<br />
Ticao Island has a similar distribution <strong>of</strong> resources with a moderate-to-good wind resource for<br />
rural power applications and a marginal-to-moderate resource for utility-scale power applications<br />
along east-facing coastal sections. However, <strong>the</strong> best wind resource is on <strong>the</strong> highest terrain in<br />
<strong>the</strong> northwest part <strong>of</strong> <strong>the</strong> island, but this only ranks as good for utility-scale applications.<br />
Masbate also has large areas classified as moderate to good for rural power applications and<br />
marginal to moderate for utility-scale power applications. This includes all coastal sections and
43<br />
<strong>Wind</strong> <strong>Energy</strong> <strong>Resource</strong><br />
<strong>Atlas</strong> <strong>of</strong> <strong>the</strong> <strong>Philippines</strong><br />
<strong>the</strong> plains in <strong>the</strong> southwestern and northwestern parts <strong>of</strong> <strong>the</strong> island. A moderate-to-good resource<br />
exists at Cadurnan Point at <strong>the</strong> sou<strong>the</strong>rn tip <strong>of</strong> <strong>the</strong> island, <strong>the</strong> high terrain northwest <strong>of</strong> Cataingan,<br />
and <strong>the</strong> high terrain directly south <strong>of</strong> <strong>the</strong> town <strong>of</strong> Masbate. The best resource on <strong>the</strong> island is <strong>the</strong><br />
high terrain directly west <strong>of</strong> Masbate and north <strong>of</strong> Milagros.<br />
6.5.6 Samar and Leyte<br />
The significant political features, topography, and wind mapping results for Samar and Leyte are<br />
illustrated in Figures 6-17, 6-18, and 6-19. As in Sou<strong>the</strong>astern Luzon, <strong>the</strong>re is a good distribution<br />
<strong>of</strong> wind resources across <strong>the</strong> island. The coastal sections, including inland areas across <strong>the</strong><br />
interior plains and <strong>the</strong> islands on <strong>the</strong> western side <strong>of</strong> Samar in <strong>the</strong> Samar Sea, have a moderate-togood<br />
wind resource for rural power applications and a marginal-to-moderate resource for utilityscale<br />
power applications. In <strong>the</strong> coastal sections, <strong>the</strong> best wind resource, classified as good for<br />
utility-scale applications and excellent for village power applications, is on <strong>the</strong> northwest tip <strong>of</strong><br />
<strong>the</strong> island, near and including Biri Island, and <strong>the</strong> nor<strong>the</strong>rn tip <strong>of</strong> <strong>the</strong> island, including Batag<br />
Island. Good resources at coastal locations are also found at Bunga Point on <strong>the</strong> eastern side <strong>of</strong><br />
<strong>the</strong> island, Tugnug Point on <strong>the</strong> sou<strong>the</strong>astern part <strong>of</strong> <strong>the</strong> island, and near <strong>the</strong> Town <strong>of</strong> Mercedes<br />
and Calicon Island in <strong>the</strong> south. The best wind resources on Samar, good to excellent from <strong>the</strong><br />
utility-scale classification, are found in <strong>the</strong> northwest on <strong>the</strong> high terrain southwest <strong>of</strong> Catarman<br />
and <strong>the</strong> mountains in <strong>the</strong> central interior (Mt. Bingo, Mt. Canyaba, and Mt. Cabalantina). A good<br />
wind resource is also found on <strong>the</strong> interior high terrain in <strong>the</strong> sou<strong>the</strong>rn part <strong>of</strong> <strong>the</strong> island.<br />
Compared to Samar, <strong>the</strong> coastal sections <strong>of</strong> Leyte generally have less wind resource, as can be<br />
seen in Figure 6-19. A moderate-to-good wind resource for rural power applications and a<br />
marginal-to-moderate resource for utility-scale power applications exists in <strong>the</strong> plains at <strong>the</strong> north<br />
end <strong>of</strong> Leyte, <strong>the</strong> north coast around Capoocan, <strong>the</strong> nor<strong>the</strong>ast corner near Rizal, and <strong>the</strong> sou<strong>the</strong>rn<br />
end <strong>of</strong> Leyte, near Himayanan and Liloan. The best wind resource, much like on Samar, exists in<br />
<strong>the</strong> interior high terrain extending through <strong>the</strong> center <strong>of</strong> <strong>the</strong> island from <strong>the</strong> area north <strong>of</strong> Mt. Lobi<br />
to <strong>the</strong> high terrain west <strong>of</strong> Sogod Bay at <strong>the</strong> south end.<br />
6.5.7 Panay, Negros, Cebu, and Siquijor<br />
The significant political features, topography, and wind mapping results for Panay, Negros, Cebu,<br />
and Siquijor are illustrated in Figures 6-20, 6-21, and 6-22. A moderate-to-good wind resource<br />
for rural power applications and a marginal-to-moderate resource for utility-scale power<br />
applications exists along <strong>the</strong> north coastline along Jintotolo Channel and sou<strong>the</strong>ast coastlines <strong>of</strong><br />
<strong>the</strong> island along Guimaras Strait, including Guimaras Island. A better wind resource in <strong>the</strong><br />
coastal areas includes Potol Point in <strong>the</strong> far northwest, <strong>the</strong> areas east and south <strong>of</strong> Roxas, <strong>the</strong><br />
nor<strong>the</strong>ast point near Balasam, sou<strong>the</strong>ast near Concepcion, north <strong>of</strong> Iloilo City, and in <strong>the</strong> far south<br />
at Naso Point. A good wind resource is found in <strong>the</strong> mountains (Mt. Agudo and Mt. Lantuan) in<br />
<strong>the</strong> nor<strong>the</strong>ast and <strong>the</strong> east (Mt. Caniapasan). The best wind resource on Panay is in <strong>the</strong> northsouth-oriented<br />
mountain range along <strong>the</strong> western side <strong>of</strong> <strong>the</strong> island.<br />
On Negros, a moderate-to-good wind resource for rural power applications and a marginal-tomoderate<br />
resource for utility-scale power applications exists along <strong>the</strong> northwest coastline <strong>of</strong><br />
Guimaras Strait, including <strong>the</strong> area around Bacolod; <strong>the</strong> nor<strong>the</strong>ast area near Sagay Point; <strong>the</strong> eastwest<br />
coastline in <strong>the</strong> Panay Gulf from Sojoton Point to Diut Point; and <strong>the</strong> west-facing coastline<br />
from Binigsian Point to Matatindoe Point. Moderate-to-good wind resources occur in <strong>the</strong> hilly<br />
terrain in <strong>the</strong> southwest part <strong>of</strong> <strong>the</strong> island; however, <strong>the</strong> best wind resources occur in <strong>the</strong> high<br />
terrain in <strong>the</strong> north end <strong>of</strong> <strong>the</strong> island and along <strong>the</strong> eastern interior. This includes <strong>the</strong> areas around
44<br />
<strong>Wind</strong> <strong>Energy</strong> <strong>Resource</strong><br />
<strong>Atlas</strong> <strong>of</strong> <strong>the</strong> <strong>Philippines</strong><br />
Mt. Silay, Mt. Mandalagan, and Canlaon Volcan in <strong>the</strong> north; from Razor Back Mountain along<br />
<strong>the</strong> eastern side <strong>of</strong> <strong>the</strong> island to just southwest <strong>of</strong> Bais; and in <strong>the</strong> sou<strong>the</strong>rn part <strong>of</strong> <strong>the</strong> island<br />
around Cuemos de Negros and Dome Peak.<br />
For Cebu, a moderate-to-good wind resource for rural power applications and a marginal-tomoderate<br />
resource for utility-scale power applications exists across <strong>the</strong> north end <strong>of</strong> <strong>the</strong> island<br />
from Bulalquit Point south to <strong>the</strong> beginning <strong>of</strong> <strong>the</strong> higher terrain near Sogod; east <strong>of</strong> Cebu City,<br />
including Mactan Island; and in selected areas on <strong>the</strong> west coast along <strong>the</strong> Tanon Strait, especially<br />
around Alcantara. A good-to-excellent wind resource exists in <strong>the</strong> hills and mountains, including<br />
Mt. Lanibga, Mt. Cabalasan, and Mt. Uling, which run north to south along <strong>the</strong> length <strong>of</strong> <strong>the</strong><br />
island.<br />
Siquijor Island sits at <strong>the</strong> confluence <strong>of</strong> <strong>the</strong> Bohol Strait, <strong>the</strong> Cebu Strait, and <strong>the</strong> Tanon Strait.<br />
The indicated wind resource on <strong>the</strong> island is very similar to <strong>the</strong> nearby islands except that it does<br />
not have <strong>the</strong> higher terrain needed to accelerate <strong>the</strong> wind power density from <strong>the</strong> marginal-tomoderate<br />
classification into a higher category. A moderate-to-good wind resource for rural<br />
power applications and a marginal-to-moderate resource for utility-scale power applications<br />
exists at Tongo Point to <strong>the</strong> west, Sandagan Point in <strong>the</strong> north, Daquit Point in <strong>the</strong> east, and east<br />
<strong>of</strong> Minalulan. The best wind resource, classified as good for utility-scale applications, occurs on<br />
<strong>the</strong> hills that run generally west to east across <strong>the</strong> island.<br />
6.5.8 Nor<strong>the</strong>rn Mindanao and Bohol<br />
The significant political features, topography, and wind mapping results for Nor<strong>the</strong>rn Mindanao<br />
and Bohol are illustrated in Figures 6-23, 6-24, and 6-25. For Bohol, a good-to-excellent wind<br />
resource is present on <strong>the</strong> high terrain in <strong>the</strong> sou<strong>the</strong>ast part <strong>of</strong> <strong>the</strong> island. Good wind resources<br />
occur in <strong>the</strong> high terrain at <strong>the</strong> eastern end <strong>of</strong> <strong>the</strong> island, near Talisay, and in <strong>the</strong> southwestern part<br />
<strong>of</strong> <strong>the</strong> island, east <strong>of</strong> Cruz Point. A moderate-to-good wind resource for rural power applications<br />
and marginal-to-moderate for utility-scale power applications exists in <strong>the</strong> nor<strong>the</strong>rn third <strong>of</strong><br />
Bohol, from Mahanay Island in <strong>the</strong> west to Lapining Island in <strong>the</strong> east, and south to Dagohoy in<br />
<strong>the</strong> central interior. A similar resource exists across most <strong>of</strong> <strong>the</strong> sou<strong>the</strong>rn interior plains extending<br />
southwestward to Panglao Island.<br />
Nor<strong>the</strong>rn Mindanao lacks a consistent, widespread wind resource, principally due to <strong>the</strong> latitude<br />
and <strong>the</strong> resultant lower wind speeds over <strong>the</strong> ocean. However, because <strong>of</strong> <strong>the</strong> accelerating effects<br />
<strong>of</strong> <strong>the</strong> terrain, <strong>the</strong>re are a limited number <strong>of</strong> areas with a usable wind resource. A good-toexcellent<br />
wind resource occurs at <strong>the</strong> crest <strong>of</strong> a long, narrow mountain range that extends from<br />
Macopa in Surigao del Norte to west <strong>of</strong> Lake Mainit in Agusan del Norte. A good wind resource<br />
also exists in <strong>the</strong> higher terrain east <strong>of</strong> Lake Mainit in Surigao del Norte, Surigao del Sur, Agusan<br />
del Norte, and Agusan del Sur.<br />
The high terrain extends from Mt Legaspi in <strong>the</strong> north to Mt. Divata in <strong>the</strong> south and eastnor<strong>the</strong>ast<br />
to Canit Point. O<strong>the</strong>r good wind resource areas are scattered in <strong>the</strong> higher terrain on <strong>the</strong><br />
eastern side <strong>of</strong> nor<strong>the</strong>rn Mindanao. The resource is considered marginal (utility-scale) to<br />
moderate (rural power), on <strong>the</strong> successive ridgelines progressing from east to west. Siargao<br />
Island, Dinagat Island, <strong>the</strong> area around Surigao, <strong>the</strong> east coast from Tandag to Jobo Point and<br />
from Bakulin Point to Lamon Point, and Taglo Point, nor<strong>the</strong>ast <strong>of</strong> Dipolog, all exhibit a marginalto-moderate<br />
wind resource. For o<strong>the</strong>r areas in nor<strong>the</strong>rn Mindanao, <strong>the</strong> wind resource is classified<br />
as poor.
6.5.9 Sou<strong>the</strong>rn Mindanao<br />
45<br />
<strong>Wind</strong> <strong>Energy</strong> <strong>Resource</strong><br />
<strong>Atlas</strong> <strong>of</strong> <strong>the</strong> <strong>Philippines</strong><br />
The significant political features, topography, and wind mapping results for Sou<strong>the</strong>rn Mindanao<br />
are illustrated in Figures 6-26, 6-27, and 6-28. This region, defined as Sou<strong>the</strong>rn Mindanao,<br />
extends from Lanao del Sur on <strong>the</strong> west to Davao Oriental on <strong>the</strong> east, and from nor<strong>the</strong>rn<br />
Cotabato in <strong>the</strong> north to Davao del Sur in <strong>the</strong> south. A marginal (utility-scale) wind resource<br />
exists in some east-facing coastal sections in Davao Oriental from Pusan Point to Tugubun Point<br />
near Mayo Bay and Cape San Augustin. The best wind resource areas, principally good (utilityscale)<br />
to excellent (rural scale), in Sou<strong>the</strong>rn Mindanao are <strong>the</strong> higher terrain areas east <strong>of</strong> Davao<br />
Gulf, along <strong>the</strong> mountains that separate Davao del Sur from sou<strong>the</strong>rn Cotabato, west <strong>of</strong> Sarangani<br />
Bay, and west <strong>of</strong> Isulan. Two locations, Sharp Peak and Saddle Peak, in Davao del Sur, are<br />
classified as having an excellent wind resource. The large interior valley, extending from<br />
Cotabato City, Maguindanao, in <strong>the</strong> northwest to Koronadal, sou<strong>the</strong>rn Cotabato, in <strong>the</strong> sou<strong>the</strong>ast,<br />
is considered to have a poor wind resource for ei<strong>the</strong>r rural or utility applications.<br />
6.5.10 Western Mindanao and Basilan<br />
The significant political features, topography, and wind mapping results for Western Mindanao<br />
and Basilan are illustrated in Figures 6-29, 6-30, and 6-31. The wind resource is classified as<br />
moderate for rural power applications and marginal for utility-scale applications. The areas with<br />
this limited resource include <strong>the</strong> coastal areas immediately nor<strong>the</strong>ast <strong>of</strong> Dipolog, <strong>the</strong> coastal areas<br />
near Patauag, and <strong>the</strong> higher terrain in <strong>the</strong> interior <strong>of</strong> Mindanao. A similar, limited wind resource<br />
exists on <strong>the</strong> higher terrain on Basilan.<br />
6.5.11 Nor<strong>the</strong>rn Palawan<br />
We divided <strong>the</strong> province <strong>of</strong> Palawan into two regions—Nor<strong>the</strong>rn Palawan and Sou<strong>the</strong>rn Palawan.<br />
The significant political features, topography, and wind mapping results for Nor<strong>the</strong>rn Palawan are<br />
illustrated in Figures 6-32, 6-33, and 6-34. This region includes <strong>the</strong> nor<strong>the</strong>rn part <strong>of</strong> Palawan<br />
Island and <strong>the</strong> islands at <strong>the</strong> nor<strong>the</strong>rn end <strong>of</strong> Palawan, including Lincapan Island and Dumaran<br />
Island. The wind resource on <strong>the</strong> nor<strong>the</strong>rn part <strong>of</strong> Palawan Island is generally classified as<br />
moderate to good for rural power applications and marginal for utility-scale applications. There<br />
are a very limited number <strong>of</strong> areas with a good-to-excellent resource in <strong>the</strong> higher terrain areas<br />
southwest <strong>of</strong> Roxas.<br />
The wind power on Lincapan and Dumaran islands is classified as moderate to good for rural<br />
power applications and marginal to moderate for utility-scale applications. The immediate<br />
coastline and high terrain in <strong>the</strong> far nor<strong>the</strong>rn portion <strong>of</strong> Palawan is classified as having a good-toexcellent<br />
resource for rural power applications and a moderate-to-good resource for utility-scale<br />
applications. There are two small areas with <strong>the</strong> best resource (good to excellent). These are <strong>the</strong><br />
high terrains east <strong>of</strong> El Nido and <strong>the</strong> high terrain northwest <strong>of</strong> San Vincente. O<strong>the</strong>r areas with a<br />
good-to-excellent wind resource include <strong>the</strong> high terrain west <strong>of</strong> Caramay and southwest <strong>of</strong><br />
Roxas. The wind resource in <strong>the</strong> immediate vicinity <strong>of</strong> Puerto Princesa is marginal for utilityscale<br />
applications, but moderate for rural power applications. However, <strong>the</strong> higher terrain west <strong>of</strong><br />
Puerto Princesa is characterized as having a good to excellent resource.
6.5.12 Sou<strong>the</strong>rn Palawan<br />
46<br />
<strong>Wind</strong> <strong>Energy</strong> <strong>Resource</strong><br />
<strong>Atlas</strong> <strong>of</strong> <strong>the</strong> <strong>Philippines</strong><br />
The significant political features, topography, and wind mapping results for Nor<strong>the</strong>rn Palawan are<br />
illustrated in Figures 6-35, 6-36, and 6-37. A moderate-to-good resource for rural power<br />
applications is evident in <strong>the</strong> coastal areas at <strong>the</strong> far sou<strong>the</strong>rn end <strong>of</strong> Palawan, including Bugsuk<br />
Island, Balabac Island, and areas along <strong>the</strong> eastern coast near Bivouac Point. A limited area,<br />
characterized by a good-to-excellent wind resource, extends along <strong>the</strong> higher terrain in <strong>the</strong> center<br />
<strong>of</strong> Palawan. These areas are principally west <strong>of</strong> Aborian, Panacan, and Tacbolubu, and north <strong>of</strong><br />
Rio Tuba.<br />
6.5.13 Sulu, Basilan, and Tawi-Tawi<br />
The significant political features, topography, and wind mapping results for <strong>the</strong> Sulu Archipelago,<br />
including Basilan and Tawi-Tawi, are illustrated in Figures 6-38, 6-39, and 6-40. The Sulu<br />
Archipelago extends from <strong>the</strong> western tip <strong>of</strong> Mindanao southwest toward Malaysia. This group<br />
<strong>of</strong> islands is bracketed by <strong>the</strong> Sulu Sea to <strong>the</strong> northwest and <strong>the</strong> Celebes Sea to <strong>the</strong> sou<strong>the</strong>ast.<br />
Based on <strong>the</strong> satellite-computed wind speed information presented previously, <strong>the</strong> wind resource<br />
in this area is quite low. There is a small area <strong>of</strong> moderate wind resource associated with <strong>the</strong><br />
higher terrain in <strong>the</strong> south-central part <strong>of</strong> Basilan, on <strong>the</strong> eastern tip and north central part (east <strong>of</strong><br />
Jolo) <strong>of</strong> Sulu, and on <strong>the</strong> islands <strong>of</strong> <strong>the</strong> Jolo and Tapul groups.
PHILIPPINES<br />
Area<br />
ILOCOS<br />
NORTE<br />
BATANES<br />
CAGAYAN
PHILIPPINES<br />
Area
PHILIPPINES<br />
Area
PHILIPPINES<br />
Area<br />
LA UNION<br />
PANGASINAN<br />
ILOCOS<br />
SUR<br />
ILOCOS<br />
NORTE<br />
ABRA<br />
BENGUET<br />
KALINGA-<br />
APAYAO<br />
MOUNTAIN PROV.<br />
IFUGAO<br />
NUEVA<br />
VIZCAYA<br />
NUEVA<br />
ECIJA<br />
QUIRINO<br />
CAGAYAN<br />
AURORA<br />
ISABELA
PHILIPPINES<br />
Area
PHILIPPINES<br />
Area
PHILIPPINES<br />
LA UNION<br />
PANGASINAN<br />
ZAMBALES<br />
Area<br />
BATAAN<br />
BENGUET<br />
TARLAC<br />
PAMPANGA<br />
CAVITE<br />
NUEVA<br />
VIZCAYA<br />
NUEVA<br />
ECIJA<br />
BULUCAN<br />
RIZAL<br />
BATANGAS<br />
QUIRINO<br />
LAGUNA<br />
AURORA<br />
QUEZON<br />
ISABELA
PHILIPPINES<br />
Area
PHILIPPINES<br />
Area
PHILIPPINES<br />
BATAAN<br />
Area<br />
PAMPANGA<br />
CAVITE<br />
BULACAN<br />
BATANGAS<br />
ORIENTAL<br />
MINDORO<br />
OCCIDENTAL<br />
MINDORO<br />
RIZAL<br />
LAGUNA<br />
QUEZON<br />
MARINDUQUE<br />
ROMBLON<br />
CAMARINES<br />
NORTE
PHILIPPINES<br />
Area
CAMARINES<br />
NORTE<br />
QUEZON<br />
ROMBLON<br />
AKLAN<br />
MASBATE<br />
CAMARINES<br />
SUR CATANDUANES<br />
ALBAY<br />
SORSOGON<br />
NORTHERN SAMAR<br />
SAMAR<br />
PHILIPPINES<br />
Area
PHILIPPINES<br />
Area
PHILIPPINES<br />
Area
MASBATE<br />
NEGROS<br />
OCCIDENTAL<br />
CEBU<br />
BOHOL<br />
NORTHERN SAMAR<br />
SAMAR<br />
LEYTE<br />
SOUTHERN<br />
LEYTE<br />
PHILIPPINES<br />
EASTERN<br />
SAMAR<br />
SURIGAO<br />
DEL<br />
NORTE<br />
Area
PHILIPPINES<br />
Area
PHILIPPINES<br />
Area
PHILIPPINES<br />
Area<br />
ANTIQUE<br />
ALKAN<br />
CAPIZ<br />
NEGROS<br />
OCCIDENTAL<br />
NEGROS<br />
ORIENTAL<br />
ILOILO<br />
MASBATE<br />
CEBU<br />
SIQUIJOR<br />
BOHOL
PHILIPPINES<br />
Area
PHILIPPINES<br />
Area
CEBU<br />
SIQUIJOR<br />
MISAMIS<br />
OCCIDENTAL<br />
LANAO<br />
DEL NORTE<br />
BOHOL<br />
CAMIGUIN<br />
MISAMIS<br />
ORIENTAL<br />
LANAO<br />
DEL SUR<br />
NORTH<br />
COTABATO<br />
SOUTHERN<br />
LEYTE<br />
BUKIDNON<br />
AGUSAN<br />
DEL NORTE<br />
SURIGAO<br />
DEL NORTE<br />
AGUSAN<br />
DEL SUR<br />
DAVAO<br />
DEL NORTE<br />
PHILIPPINES<br />
SURIGAO<br />
DEL SUR<br />
Area<br />
DAVAO<br />
ORIENTAL
PHILIPPINES<br />
Area
PHILIPPINES<br />
Area<br />
LANAO<br />
DEL NORTE<br />
LANAO<br />
DEL SUR<br />
MAGUINDANAO<br />
SULTAN<br />
KUDARAT<br />
NORTH<br />
COTABATO<br />
SOUTH<br />
COTABATO<br />
BUKIDNON<br />
AGUSAN<br />
DEL SUR<br />
DAVAO<br />
DEL NORTE<br />
DAVAO<br />
DEL<br />
SUR<br />
DAVAO<br />
ORIENTAL
PHILIPPINES<br />
Area
PHILIPPINES<br />
Area
PHILIPPINES<br />
Area<br />
SULU<br />
BASILAN<br />
ZAMBOANGA<br />
DEL NORTE<br />
ZAMBOANGA<br />
DEL SUR<br />
MISAMIS<br />
OCCIDENTAL
PHILIPPINES<br />
Area
PHILIPPINES<br />
Area
Area<br />
PHILIPPINES<br />
PALAWAN<br />
OCCIDENTAL<br />
MINDORO
Area<br />
PHILIPPINES
Area<br />
PHILIPPINES
PHILIPPINES<br />
Area<br />
PALAWAN
PHILIPPINES<br />
Area
PHILIPPINES<br />
Area
PHILIPPINES<br />
Area<br />
TAWI-TAWI<br />
ZAMBOANGA<br />
DEL NORTE<br />
SULU<br />
ZAMBOANGA<br />
DEL SUR<br />
BASILAN
PHILIPPINES<br />
Area
PHILIPPINES<br />
Area
7.0 <strong>Wind</strong> Electric Potential<br />
7.1 Introduction<br />
87<br />
<strong>Wind</strong> <strong>Energy</strong> <strong>Resource</strong><br />
<strong>Atlas</strong> <strong>of</strong> <strong>the</strong> <strong>Philippines</strong><br />
The assumptions and methods for converting <strong>the</strong> wind resource to wind energy potential are<br />
based on those in <strong>the</strong> report “Renewable <strong>Energy</strong> Technology Characterizations” (DeMeo and<br />
Galdo, 1997) and are listed at <strong>the</strong> bottom <strong>of</strong> Table 7-1. Each square kilometer on <strong>the</strong> map has an<br />
annual average wind power density, in W/m 2 , at a 30-m height. We developed an equation to<br />
compute <strong>the</strong> total net annual energy delivery for each square kilometer <strong>of</strong> grid cells with an<br />
annual average wind power density <strong>of</strong> 200 W/m 2 or greater. If <strong>the</strong> wind power density was less<br />
than 200 W/m 2 , <strong>the</strong> net energy potential was set equal to zero, because <strong>the</strong>se grid cells have<br />
insufficient wind potential for <strong>the</strong> economic development <strong>of</strong> utility-scale wind energy. Although<br />
<strong>the</strong> areas with lower wind resource (100-200 W/m 2 ) are not economic for utility-scale wind and<br />
thus have been discounted, <strong>the</strong>se areas have <strong>the</strong> potential for isolated use <strong>of</strong> small wind for rural<br />
electrification projects. Under ano<strong>the</strong>r scenario (good-to-excellent resource levels) only grid cells<br />
with an annual average wind power <strong>of</strong> 300 W/m 2 or greater were included.<br />
The wind resource levels in Table 7-1 are consistent with those on <strong>the</strong> wind resource maps for <strong>the</strong><br />
<strong>Philippines</strong>. The numbers in <strong>the</strong> table represent total net wind-energy potential, and <strong>the</strong>y have not<br />
been reduced by factors such as land-use exclusions. The net energy is already reduced by about<br />
15%–20% because <strong>of</strong> expected losses from downtime, wake-effects, etc. When <strong>the</strong> wind energy<br />
potential is computed, <strong>the</strong> wind power density to <strong>the</strong> turbine-hub-height level is adjusted so <strong>the</strong><br />
total wind energy potential is not dependent on <strong>the</strong> height used in our wind resource<br />
classification.<br />
7.2 <strong>Wind</strong> Electric Potential Estimates<br />
More than 10,000 km 2 <strong>of</strong> windy land area is estimated to exist with a good-to-excellent wind<br />
resource potential. The proportion <strong>of</strong> windy land and potential wind capacity in each wind power<br />
category is listed in Table 7-1. These windy land areas represent less than 4% <strong>of</strong> <strong>the</strong> total land<br />
area (299,000 km 2 ) in <strong>the</strong> <strong>Philippines</strong>. Using conservative assumptions <strong>of</strong> about 7 MW per km 2 ,<br />
<strong>the</strong>se windy areas could support more than 70,000 MW <strong>of</strong> potential installed capacity, delivering<br />
more than 195 billion kWh per year. Considering only <strong>the</strong>se areas <strong>of</strong> good-to-excellent wind<br />
resource, Figure 7-1 shows <strong>the</strong>re are 47 provinces out <strong>of</strong> 73 in <strong>the</strong> <strong>Philippines</strong> with at least 500<br />
MW <strong>of</strong> wind potential and 25 provinces with at least 1,000 MW <strong>of</strong> wind potential. However, to<br />
assess <strong>the</strong> wind electric potential more accurately, additional studies, considering factors such as<br />
<strong>the</strong> existing transmission grid and accessibility, are required.<br />
If we consider additional areas that have a moderate wind resource potential or that have a good<br />
wind resource for rural power applications, <strong>the</strong> estimated total land area increases to more than<br />
25,000 km 2 (slightly more than 8% <strong>of</strong> <strong>the</strong> total land area <strong>of</strong> <strong>the</strong> <strong>Philippines</strong>, as shown in Table 7-<br />
1). This land could support over 170,000 MW <strong>of</strong> potential installed capacity, delivering<br />
361 billion kWh per year. Figure 7-2 shows 51 provinces out <strong>of</strong> 73 with at least 1,000 MW <strong>of</strong><br />
wind potential and 64 provinces with at least 500 MW <strong>of</strong> wind potential.
<strong>Wind</strong> <strong>Resource</strong><br />
Utility Scale<br />
Table 7-1<br />
<strong>Philippines</strong> - <strong>Wind</strong> Electric Potential<br />
Good-to-Excellent <strong>Wind</strong> <strong>Resource</strong> at 30 m (Utility Scale)<br />
<strong>Wind</strong> Power<br />
W/m 2<br />
<strong>Wind</strong> Speed<br />
m/s *<br />
88<br />
Total<br />
Area km 2<br />
<strong>Wind</strong> <strong>Energy</strong> <strong>Resource</strong><br />
<strong>Atlas</strong> <strong>of</strong> <strong>the</strong> <strong>Philippines</strong><br />
Total Cap<br />
Installed MW<br />
Total Power<br />
GWh/yr<br />
Good 300 – 400 6.4 – 7.0 5,541 38,400 85,400<br />
Excellent 400 – 500 7.0 – 8.0 2,841 19,700 52,200<br />
Excellent 500 – 700 8.0 – 8.8 2,258 15,600 47,900<br />
Excellent 700 – 1250 8.8 – 10.1 415 2,900 9,700<br />
Total 11,055 76,600 195,200<br />
<strong>Wind</strong> <strong>Resource</strong><br />
Utility Scale<br />
Moderate-to-Excellent <strong>Wind</strong> <strong>Resource</strong> at 30 m (Utility Scale)<br />
<strong>Wind</strong> Power<br />
W/m 2<br />
<strong>Wind</strong> Speed<br />
m/s *<br />
Total<br />
Area km 2<br />
Total Capacity<br />
Installed MW<br />
Total Power<br />
GWh/yr<br />
Moderate 200 – 300 5.6 – 6.4 14,002 97,000 165,800<br />
Good 300 – 400 6.4 – 7.0 5,541 38,400 85,400<br />
Excellent 400 – 500 7.0 – 8.0 2,841 19,700 52,200<br />
Excellent 500 – 700 8.0 – 8.8 2,258 15,600 47,900<br />
Excellent 700 – 1250 8.8 – 10.1 415 2,900 9,700<br />
Total 25,057 173,600 361,000<br />
* <strong>Wind</strong> speeds are based on a Weibull k value <strong>of</strong> 2.0<br />
Assumptions<br />
Turbine Size – 500 kW<br />
Hub Height – 40 m<br />
Rotor Diameter – 38 m<br />
Turbine Spacing – 10D by 5D<br />
Capacity/km 2 – 6.9 MW
PALAWAN<br />
MINDORO<br />
PANAY<br />
SULU<br />
NEGROS<br />
BATANES<br />
LUZON<br />
SAMAR<br />
LEYTE<br />
MINDANAO
PALAWAN<br />
MINDORO<br />
PANAY<br />
SULU<br />
NEGROS<br />
BATANES<br />
LUZON<br />
SAMAR<br />
LEYTE<br />
MINDANAO
References<br />
91<br />
<strong>Wind</strong> <strong>Energy</strong> <strong>Resource</strong><br />
<strong>Atlas</strong> <strong>of</strong> <strong>the</strong> <strong>Philippines</strong><br />
Solar Radiation and <strong>Wind</strong> Mapping <strong>of</strong> <strong>the</strong> <strong>Philippines</strong>, USAID GOP Project No. 492-0294,<br />
National Institute <strong>of</strong> Climatology, October 1986.<br />
Climatological Normal <strong>of</strong> Surface <strong>Wind</strong>s in <strong>the</strong> <strong>Philippines</strong>, National Institute <strong>of</strong> Climatology,<br />
PAGASA, January 1988.<br />
Average <strong>Wind</strong> Speed and Direction 1961–1992, Climate Data Section, Climatology and<br />
Agrometeorology Branch, PAGASA, January 1995.<br />
DeMeo, E.A.; Galdo, J.F. Renewable <strong>Energy</strong> Technology Characterizations, Office <strong>of</strong> Utility<br />
Technologies, <strong>Energy</strong> Efficiency and Renewable <strong>Energy</strong>, U.S. Department <strong>of</strong> <strong>Energy</strong>,<br />
Washington D.C., 1997.<br />
Elliott, D.L. “Dominican Republic <strong>Wind</strong> <strong>Energy</strong> <strong>Resource</strong> <strong>Atlas</strong> Development”, <strong>NREL</strong>/CP-500-<br />
27032, National Renewable <strong>Energy</strong> Laboratory, Golden, Colorado, 1999.<br />
Elliott, D.L.; Chadraa, B.; Natsagdorj, L. “Mongolia <strong>Wind</strong> <strong>Resource</strong> Assessment Project”,<br />
<strong>NREL</strong>/CP-500-25148, National Renewable <strong>Energy</strong> Laboratory, Golden, Colorado 1998.<br />
Elliott, D.L.; Holladay, C.G.; Barchet, W.R.; Foote, H.P.; Sandusky, W.F. <strong>Wind</strong> <strong>Energy</strong> <strong>Resource</strong><br />
<strong>Atlas</strong> <strong>of</strong> <strong>the</strong> United States, Solar <strong>Energy</strong> Research Institute, Golden, Colorado, 1987.<br />
Elliott, D.; Schwartz, M.; Nierenberg, R. “<strong>Wind</strong> <strong>Resource</strong> Mapping <strong>of</strong> <strong>the</strong> State <strong>of</strong> Vermont”,<br />
<strong>NREL</strong>/CP-500-27507, National Renewable <strong>Energy</strong> Laboratory, Golden, Colorado, 1999.<br />
Rohatgi, J.S.; Nelson, V. <strong>Wind</strong> Characteristics: An Analysis For The Generation <strong>of</strong> <strong>Wind</strong> Power,<br />
Alternative <strong>Energy</strong> Institute, West Texas A&M University, Canyon, Texas, 1994, 239 pp.<br />
Schwartz, M.N. “<strong>Wind</strong> <strong>Resource</strong> Estimation and Mapping at <strong>the</strong> National Renewable <strong>Energy</strong><br />
Laboratory”, <strong>NREL</strong>/CP-500-26245, National Renewable <strong>Energy</strong> Laboratory, Golden, Colorado,<br />
1999.<br />
Schwartz, M.N.; Elliott, D.L. “Mexico <strong>Wind</strong> <strong>Resource</strong> Assessment Project”, <strong>NREL</strong>/TP-441-<br />
7809, National Renewable <strong>Energy</strong> Laboratory, Golden, Colorado, 1995.<br />
Schwartz, M.N.; Elliott, D.L. “The Integration <strong>of</strong> Climatic Data Sets for <strong>Wind</strong> <strong>Resource</strong><br />
Assessment”, Preprints, 10 th Conference on Applied Climatology, Reno, Nevada, pp. 368-372.<br />
1997.
Appendix A<br />
Data Summaries<br />
National Power Corporation Sites<br />
Agaga<br />
Bangui<br />
Bayog<br />
Caparispisan<br />
Guimaras<br />
Pagali<br />
Sagada<br />
Saoit<br />
Subec
A-1
A-2
A-3
A-4
A-5
A-6
A-7
A-8
A-9
A-10
A-11
A-12
A-13
A-14
A-15
A-16
A-17
A-18
A-19
A-20
A-21
A-22
A-23
A-24
A-25
A-26
A-27
A-28
A-29
A-30
A-31
A-32
A-33
A-34
A-35
A-36
Appendix B<br />
Analysis Summaries—Selected Sites from<br />
DATSAV2 Data Files<br />
Cuyo<br />
Daet<br />
Guiuan
B-1
B-2
B-3
B-4
B-5
B-6
B-7
B-8
B-9
B-10
B-11
B-12
B-13
B-14
B-15
B-16
B-17
B-18
B-19
B-20
B-21
B-22
B-23
Appendix C<br />
Analysis Summaries—Upper-Air Stations<br />
Legaspi<br />
Palau Island<br />
Pratas Island
C-1
C-2
C-3
C-4
C-5
C-6
C-7
C-8
C-9
C-10
C-11
C-12
C-13
C-14
C-15
C-16
C-17
C-18
C-19
Appendix D<br />
<strong>Wind</strong> Speed and <strong>Wind</strong> Power Density Computed from<br />
Satellite Ocean <strong>Wind</strong> Data<br />
August and December<br />
<strong>Wind</strong> Speed and <strong>Wind</strong> Power Density Maps<br />
Computed from Satellite Ocean <strong>Wind</strong> Data<br />
Region Location Map for <strong>the</strong> Satellite Ocean <strong>Wind</strong> Data<br />
Satellite Ocean <strong>Wind</strong> Speeds at 10 m<br />
Extreme North, East Coast, North Mindanao, East Mindanao,<br />
Palawan-East Coast, Palawan-West Coast, and<br />
West Coast <strong>Wind</strong> Corridors<br />
Satellite Ocean <strong>Wind</strong> Power Densities at 10 m<br />
Extreme North, East Coast, North Mindanao, East Mindanao,<br />
Palawan–East Coast, Palawan–West Coast, and<br />
West Coast <strong>Wind</strong> Corridors
€2E2‚2v—2w—<br />
p2ƒ—2y—2‡2h——<br />
†—22IH22r<br />
IIV<br />
IPH<br />
PH<br />
I<br />
PH<br />
R<br />
P<br />
Q<br />
IV IV<br />
IT IT<br />
P<br />
IR<br />
Q<br />
IR<br />
I<br />
R<br />
IP<br />
P<br />
IP<br />
IH<br />
V Q<br />
P<br />
Q<br />
I<br />
P<br />
I<br />
Q<br />
Q<br />
P<br />
I<br />
I<br />
IH<br />
V<br />
v<br />
‚2q T<br />
Q<br />
T<br />
i2x2E2<br />
f——22x2v<br />
i—2g—2E2<br />
v22ƒ—— IIV<br />
‡2g—2‡2g2E<br />
w22x<br />
x2w——<br />
IPH IPP IPR IPT<br />
i—2w——<br />
€———2E2‡2g—<br />
€———2E2i—2g—<br />
x‚iv2g—X<br />
h2i2@QHQA2QVRETWQS<br />
w—2ƒ—2@QHQA2QVRETWQT<br />
2<br />
2<br />
IPP<br />
I<br />
IPR<br />
IPT<br />
P<br />
IHH H IHH PHH QHH RHH SHH u<br />
x<br />
…ƒ2hF22i2E2x——<br />
‚—˜2i2v—˜—<br />
hw2r2IWEhigEPHHH2IFI
<strong>Wind</strong> Speed (m/s)<br />
12<br />
10<br />
8<br />
6<br />
4<br />
2<br />
0<br />
<strong>Philippines</strong> - Extreme North - Batanes to North Luzon<br />
Satellite-based Ocean <strong>Wind</strong> Speeds<br />
Jan Feb Mar Apr May Jun Jul Aug Sep Oct Nov Dec<br />
D-6<br />
Region Annual Speed<br />
1 7.3<br />
2 7.0<br />
3 7.0<br />
4 7.7<br />
Period: 1988-1994
<strong>Wind</strong> Speed (m/s)<br />
12<br />
10<br />
8<br />
6<br />
4<br />
2<br />
0<br />
<strong>Philippines</strong> - East Coast - Luzon to Samar<br />
Satellite-based Ocean <strong>Wind</strong> Speeds<br />
Jan Feb Mar Apr May Jun Jul Aug Sep Oct Nov Dec<br />
D-7<br />
Region Annual Speed<br />
1 6.2<br />
2 6.1<br />
3 6.3<br />
4 6.3<br />
Period: 1988-1994
<strong>Wind</strong> Speed (m/s)<br />
12<br />
10<br />
8<br />
6<br />
4<br />
2<br />
0<br />
<strong>Philippines</strong> - North Mindanao<br />
Satellite-based Ocean <strong>Wind</strong> Speeds<br />
Jan Feb Mar Apr May Jun Jul Aug Sep Oct Nov Dec<br />
D-8<br />
Region Annual Speed<br />
1 5.8<br />
2 5.5<br />
3 5.2<br />
Period: 1988-1994
<strong>Wind</strong> Speed (m/s)<br />
12<br />
10<br />
8<br />
6<br />
4<br />
2<br />
0<br />
<strong>Philippines</strong> - East Mindanao<br />
Satellite-based Ocean <strong>Wind</strong> Speeds<br />
Jan Feb Mar Apr May Jun Jul Aug Sep Oct Nov Dec<br />
D-9<br />
Region Annual Speed<br />
1 5.3<br />
2 6.0<br />
3 6.3<br />
Period: 1988-1994
<strong>Wind</strong> Speed (m/s)<br />
12<br />
10<br />
8<br />
6<br />
4<br />
2<br />
0<br />
<strong>Philippines</strong> - Palawan - East Coast<br />
Satellite-based Ocean <strong>Wind</strong> Speeds<br />
Jan Feb Mar Apr May Jun Jul Aug Sep Oct Nov Dec<br />
D-10<br />
Region Annual Speed<br />
1 6.0<br />
2 5.1<br />
3 5.3<br />
Period: 1988-1994
<strong>Wind</strong> Speed (m/s)<br />
12<br />
10<br />
8<br />
6<br />
4<br />
2<br />
0<br />
<strong>Philippines</strong> - Palawan - West Coast<br />
Satellite-based Ocean <strong>Wind</strong> Speeds<br />
Jan Feb Mar Apr May Jun Jul Aug Sep Oct Nov Dec<br />
D-11<br />
Region Annual Speed<br />
1 5.3<br />
2 5.3<br />
3 5.6<br />
Period: 1988-1994
<strong>Wind</strong> Speed (m/s)<br />
<strong>Philippines</strong> - West Coast <strong>Wind</strong> Corridors - Mindoro to Negros<br />
Satellite-based Ocean <strong>Wind</strong> Speeds<br />
12<br />
10<br />
8<br />
6<br />
4<br />
2<br />
0<br />
Jan Feb Mar Apr May Jun Jul Aug Sep Oct Nov Dec<br />
D-12<br />
Region Annual Speed<br />
1 6.4<br />
2 6.7<br />
3 5.8<br />
Period: 1988-1994
<strong>Wind</strong> Power (W/m 2 )<br />
1200<br />
1000<br />
800<br />
600<br />
400<br />
200<br />
0<br />
<strong>Philippines</strong> - Extreme North - Batanes to North Luzon<br />
Satellite-based Ocean <strong>Wind</strong> Power Densities<br />
Jan Feb Mar Apr May Jun Jul Aug Sep Oct Nov Dec<br />
D-13<br />
Region Annual Power<br />
1 371<br />
2 332<br />
3 341<br />
4 549<br />
Period: 1988-1994
<strong>Wind</strong> Power (W/m 2 )<br />
1200<br />
1000<br />
800<br />
600<br />
400<br />
200<br />
0<br />
<strong>Philippines</strong> - East Coast - Luzon to Samar<br />
Satellite-based Ocean <strong>Wind</strong> Power Densities<br />
Jan Feb Mar Apr May Jun Jul Aug Sep Oct Nov Dec<br />
D-14<br />
Region Annual Power<br />
1 298<br />
2 307<br />
3 296<br />
4 272<br />
Period: 1988-1994
<strong>Wind</strong> Power (W/m 2 )<br />
800<br />
600<br />
400<br />
200<br />
0<br />
<strong>Philippines</strong> - North Mindanao<br />
Satellite-based Ocean <strong>Wind</strong> Power Densities<br />
Jan Feb Mar Apr May Jun Jul Aug Sep Oct Nov Dec<br />
D-15<br />
Region Annual Power<br />
1 205<br />
2 193<br />
3 169<br />
Period: 1988-1994
<strong>Wind</strong> Power (W/m 2 )<br />
800<br />
600<br />
400<br />
200<br />
0<br />
<strong>Philippines</strong> - East Mindanao<br />
Satellite-based Ocean <strong>Wind</strong> Power Densities<br />
Jan Feb Mar Apr May Jun Jul Aug Sep Oct Nov Dec<br />
D-16<br />
Region Annual Power<br />
1 180<br />
2 241<br />
3 238<br />
Period: 1988-1994
<strong>Wind</strong> Power (W/m 2 )<br />
800<br />
600<br />
400<br />
200<br />
0<br />
<strong>Philippines</strong> - Palawan - East Coast<br />
Satellite-based Ocean <strong>Wind</strong> Power Densities<br />
Jan Feb Mar Apr May Jun Jul Aug Sep Oct Nov Dec<br />
D-17<br />
Region Annual Power<br />
1 243<br />
2 171<br />
3 177<br />
Period: 1988-1994
<strong>Wind</strong> Power (W/m 2 )<br />
800<br />
600<br />
400<br />
200<br />
0<br />
<strong>Philippines</strong> - Palawan - West Coast<br />
Satellite-based Ocean <strong>Wind</strong> Power Densities<br />
Jan Feb Mar Apr May Jun Jul Aug Sep Oct Nov Dec<br />
D-18<br />
Region Annual Power<br />
1 174<br />
2 186<br />
3 184<br />
Period: 1988-1994
<strong>Wind</strong> Power (W/m 2 )<br />
<strong>Philippines</strong> - West Coast <strong>Wind</strong> Corridors - Mindoro to Negros<br />
Satellite-based Ocean <strong>Wind</strong> Power Densities<br />
800<br />
600<br />
400<br />
200<br />
0<br />
Jan Feb Mar Apr May Jun Jul Aug Sep Oct Nov Dec<br />
D-19<br />
Region Annual Power<br />
1 286<br />
2 320<br />
3 246<br />
Period: 1988-1994
REPORT DOCUMENTATION PAGE<br />
Form Approved<br />
OMB NO. 0704-0188<br />
Public reporting burden for this collection <strong>of</strong> information is estimated to average 1 hour per response, including <strong>the</strong> time for reviewing instructions, searching existing data sources,<br />
ga<strong>the</strong>ring and maintaining <strong>the</strong> data needed, and completing and reviewing <strong>the</strong> collection <strong>of</strong> information. Send comments regarding this burden estimate or any o<strong>the</strong>r aspect <strong>of</strong> this<br />
collection <strong>of</strong> information, including suggestions for reducing this burden, to Washington Headquarters Services, Directorate for Information Operations and Reports, 1215 Jefferson<br />
Davis Highway, Suite 1204, Arlington, VA 22202-4302, and to <strong>the</strong> Office <strong>of</strong> Management and Budget, Paperwork Reduction Project (0704-0188), Washington, DC 20503.<br />
1. AGENCY USE ONLY (Leave blank) 2. REPORT DATE<br />
February 2001<br />
4. TITLE AND SUBTITLE<br />
<strong>Wind</strong> <strong>Energy</strong> <strong>Resource</strong> <strong>Atlas</strong> <strong>of</strong> <strong>the</strong> <strong>Philippines</strong><br />
6. AUTHOR(S)<br />
D. Elliott, M. Schwartz, R. George, S. Haymes, D. Heimiller, G. Scott<br />
7. PERFORMING ORGANIZATION NAME(S) AND ADDRESS(ES)<br />
National Renewable <strong>Energy</strong> Laboratory<br />
1617 Cole Blvd.<br />
Golden, CO 80401-3393<br />
3. REPORT TYPE AND DATES COVERED<br />
Technical Report<br />
5. FUNDING NUMBERS<br />
WER11050<br />
DO059999<br />
8. PERFORMING ORGANIZATION<br />
REPORT NUMBER<br />
<strong>NREL</strong>/TP-500-26129<br />
9. SPONSORING/MONITORING AGENCY NAME(S) AND ADDRESS(ES) 10. SPONSORING/MONITORING<br />
AGENCY REPORT NUMBER<br />
11. SUPPLEMENTARY NOTES<br />
12a. DISTRIBUTION/AVAILABILITY STATEMENT<br />
National Technical Information Service<br />
U.S. Department <strong>of</strong> Commerce<br />
5285 Port Royal Road<br />
Springfield, VA 22161<br />
12b. DISTRIBUTION CODE<br />
13. ABSTRACT (Maximum 200 words)<br />
This report contains <strong>the</strong> results <strong>of</strong> a wind resource analysis and mapping study for <strong>the</strong> Philippine archipelago. The study's<br />
objective was to identify potential wind resource areas and quantify <strong>the</strong> value <strong>of</strong> those resources within those areas. The wind<br />
resource maps and o<strong>the</strong>r wind resource characteristic information will be used to identify prospective areas for wind-energy<br />
applications.<br />
14. SUBJECT TERMS<br />
<strong>Philippines</strong>; wind resource; maps; Geographic Information System<br />
17. SECURITY CLASSIFICATION<br />
OF REPORT<br />
Unclassified<br />
18. SECURITY CLASSIFICATION<br />
OF THIS PAGE<br />
Unclassified<br />
19. SECURITY CLASSIFICATION<br />
OF ABSTRACT<br />
Unclassified<br />
15. NUMBER OF PAGES<br />
16. PRICE CODE<br />
20. LIMITATION OF ABSTRACT<br />
NSN 7540-01-280-5500 Standard Form 298 (Rev. 2-89)<br />
Prescribed by ANSI Std. Z39-18<br />
298-102<br />
UL