Winsford Over and Verdin Ward Profile - West Cheshire Together
Winsford Over and Verdin Ward Profile - West Cheshire Together
Winsford Over and Verdin Ward Profile - West Cheshire Together

You also want an ePaper? Increase the reach of your titles
YUMPU automatically turns print PDFs into web optimized ePapers that Google loves.
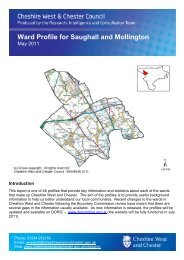
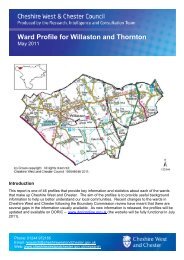
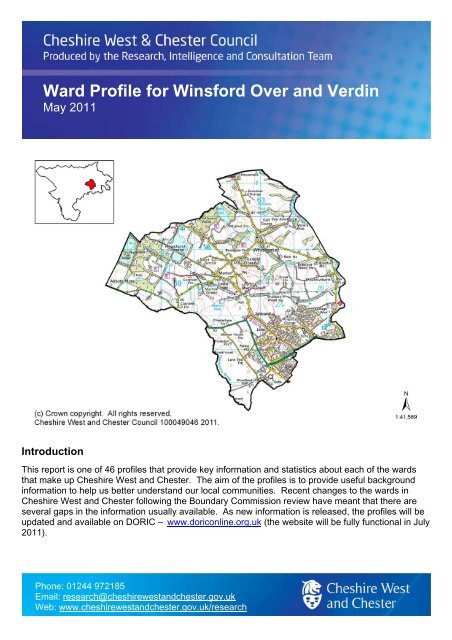
<strong>Ward</strong> <strong>Profile</strong> for <strong>Winsford</strong> <strong>Over</strong> <strong>and</strong> <strong>Verdin</strong><br />
May 2011<br />
Introduction<br />
This report is one of 46 profiles that provide key information <strong>and</strong> statistics about each of the wards<br />
that make up <strong>Cheshire</strong> <strong>West</strong> <strong>and</strong> Chester. The aim of the profiles is to provide useful background<br />
information to help us better underst<strong>and</strong> our local communities. Recent changes to the wards in<br />
<strong>Cheshire</strong> <strong>West</strong> <strong>and</strong> Chester following the Boundary Commission review have meant that there are<br />
several gaps in the information usually available. As new information is released, the profiles will be<br />
updated <strong>and</strong> available on DORIC – 294Hwww.doriconline.org.uk (the website will be fully functional in July<br />
2011).<br />
Phone: 01244 972185<br />
Email: research@cheshirewest<strong>and</strong>chester.gov.uk<br />
Web: www.cheshirewest<strong>and</strong>chester.gov.uk/research
General Information<br />
In 2009, there were 13,860 people living in <strong>Winsford</strong> <strong>Over</strong> <strong>and</strong> <strong>Verdin</strong>. This ward covers an area of<br />
2,663 hectares, with 5,810 residential dwellings. The population density is 5.20 people per hectare,<br />
compared to 3.47 people per hectare for <strong>Cheshire</strong> <strong>West</strong> <strong>and</strong> Chester.<br />
Population<br />
Table 1: Population by age group, 2009<br />
Total number of people<br />
Age <strong>Winsford</strong> <strong>Cheshire</strong> <strong>West</strong><br />
group <strong>Over</strong> <strong>and</strong> <strong>and</strong> Chester<br />
Percentage of population<br />
<strong>Winsford</strong> <strong>Over</strong><br />
<strong>and</strong> <strong>Verdin</strong><br />
<strong>Cheshire</strong> <strong>West</strong><br />
<strong>and</strong> Chester<br />
<strong>Verdin</strong><br />
0-4 1,010 18,400 7% 6%<br />
5-15 2,080 40,900 15% 13%<br />
16-17 450 8,600 3% 3%<br />
18-24 1,240 28,600 9% 9%<br />
25-64 7,320 170,900 53% 52%<br />
65-74 1,080 31,500 8% 10%<br />
75+ 670 27,600 5% 8%<br />
Total 13,860 326,600 100% 100%<br />
<strong>Ward</strong> population source: <strong>Cheshire</strong> <strong>West</strong> <strong>and</strong> Chester Council, Research, Intelligence <strong>and</strong> Consultation Team's Population Estimates. All figures have<br />
been rounded independently <strong>and</strong> may not sum to totals. All estimates are constrained to the Registrar General's Annual Estimates of Population for<br />
2009. ONS Crown Copyright 2011.<br />
<strong>Cheshire</strong> <strong>West</strong> <strong>and</strong> Chester population source: Office for National Statistics population estimates 2009. ONS Crown Copyright 2011.<br />
Dwellings source: <strong>Cheshire</strong> <strong>West</strong> <strong>and</strong> Chester Council, Research, Intelligence <strong>and</strong> Consultation Team’s Dwelling Estimates. These estimates have<br />
been calculated by counting the number of domestic properties in each area, from the LLPG (as at mid year 2009). This included communal<br />
establishment buildings but excluded industrial <strong>and</strong> commercial properties. Hotels <strong>and</strong> pubs are included. The estimates have been rounded to the<br />
nearest 10. These are only dwelling estimates <strong>and</strong> not actual counts. They are used to inform the small area population estimates.<br />
Community Safety<br />
Table 2: Local crime statistics, 2010 (January to December)<br />
Number of crimes Crime rate (per 1,000)<br />
<strong>Winsford</strong><br />
<strong>Over</strong> <strong>and</strong><br />
<strong>Verdin</strong><br />
<strong>Cheshire</strong><br />
<strong>West</strong> <strong>and</strong><br />
Chester<br />
<strong>Winsford</strong><br />
<strong>Over</strong> <strong>and</strong><br />
<strong>Verdin</strong><br />
<strong>Cheshire</strong><br />
<strong>West</strong> <strong>and</strong><br />
Chester<br />
Burglary 54 2,620 9.3 17.7<br />
Robbery 5 18 0.4 0.1<br />
Violent crime 198 3,989 14.3 12.2<br />
Vehicle crime 30 1,600 2.2 4.9<br />
Anti-social behaviour 883 16,305 63.7 49.9<br />
Other crime 441 10,635 31.8 32.6<br />
Source: <strong>Cheshire</strong> Constabulary March 2011. Note that figures relate to electoral wards <strong>and</strong> not police wards. Crime rates are calculated per 1,000<br />
population or per 1,000 dwellings in the case of burglary.
Children <strong>and</strong> Young People<br />
Free school meals<br />
Table 3: Free school meals, 2011<br />
Percentage of pupils eligible for free<br />
school meals<br />
<strong>Winsford</strong> <strong>Over</strong><br />
<strong>and</strong> <strong>Verdin</strong><br />
<strong>Cheshire</strong> <strong>West</strong><br />
<strong>and</strong> Chester<br />
21% 13%<br />
Source: Pupil Level Annual School Census (PLASC), <strong>Cheshire</strong> <strong>West</strong> <strong>and</strong> Chester Council 2011<br />
Special Educational Needs<br />
Table 4: Special Educational Needs, 2011<br />
Percentage of pupils with Special<br />
Educational Needs<br />
<strong>Winsford</strong> <strong>Over</strong><br />
<strong>and</strong> <strong>Verdin</strong><br />
<strong>Cheshire</strong> <strong>West</strong><br />
<strong>and</strong> Chester<br />
25% 18%<br />
Source: Pupil Level Annual School Census (PLASC), <strong>Cheshire</strong> <strong>West</strong> <strong>and</strong> Chester Council 2011<br />
Education attainment<br />
Table 5: Education attainment at Key Stage 4, 2010<br />
Percentage of pupils achieving 5+ A*-C including<br />
English <strong>and</strong> Maths (by pupil residence)<br />
Percentage of pupils achieving 5+ A*-C (by pupil<br />
residence)<br />
Percentage of pupils achieving 5+ A*-G (by pupil<br />
residence)<br />
<strong>Winsford</strong> <strong>Over</strong><br />
<strong>and</strong> <strong>Verdin</strong><br />
<strong>Cheshire</strong> <strong>West</strong><br />
<strong>and</strong> Chester<br />
44% 57%<br />
69% 75%<br />
95% 95%<br />
Source: Department for Education, adapted for wards by <strong>Cheshire</strong> <strong>West</strong> <strong>and</strong> Chester Council’s Children <strong>and</strong> Young People<br />
Performance Team <strong>and</strong> Research, Intelligence <strong>and</strong> Consultation Team 2011.<br />
The Local Economy<br />
Number of business properties<br />
Table 6: Number of business properties by type, 2011<br />
<strong>Winsford</strong> <strong>Over</strong><br />
<strong>and</strong> <strong>Verdin</strong><br />
<strong>Cheshire</strong> <strong>West</strong><br />
<strong>and</strong> Chester<br />
Commercial <strong>and</strong> retail 93 5,054<br />
Hospitality 17 761<br />
Offices 17 2,128<br />
Industrial 43 1,361<br />
Other 40 1,296<br />
Total 210 10,600<br />
Source: Non-Domestic Rateable Properties, Revenues <strong>and</strong> Benefits Team, <strong>Cheshire</strong> <strong>West</strong> <strong>and</strong><br />
Chester Council 2011
Deprivation<br />
Map of <strong>Winsford</strong> <strong>Over</strong> <strong>and</strong> <strong>Verdin</strong> <strong>and</strong> surrounding areas showing the Index of Multiple<br />
Deprivation 2007<br />
Source: Indices of Deprivation 2007: Index of Multiple Deprivation Domain – Department for Communities <strong>and</strong> Local Government.<br />
Note: Small area boundaries (Lower Layer Super Output Areas) have been removed to make the maps clearer. The surrounding area approximates to <br />
Area Partnership Board boundaries. <br />
The Index of Multiple Deprivation 2007 shows that this ward consists of small areas with different<br />
levels of deprivation. There are two small areas ranked in the top 10% most deprived areas<br />
nationally <strong>and</strong> a third small area in the top 20% most deprived.<br />
Benefit claimants<br />
Table 7: Council Tax <strong>and</strong> Housing Benefit Claimants, 2011<br />
Number of claimants<br />
<strong>Winsford</strong> <strong>Cheshire</strong><br />
<strong>Over</strong> <strong>and</strong> <strong>West</strong> <strong>and</strong><br />
<strong>Verdin</strong> Chester<br />
<strong>Winsford</strong><br />
<strong>Over</strong> <strong>and</strong><br />
<strong>Verdin</strong><br />
Claimant rate<br />
<strong>Cheshire</strong><br />
<strong>West</strong> <strong>and</strong><br />
Chester<br />
Council Tax Benefit 1,693 26,669 15.7% 10.0%<br />
Housing Benefit 1,432 21,019 13.3% 7.9%<br />
Source: Revenues <strong>and</strong> Benefits Team, <strong>Cheshire</strong> <strong>West</strong> <strong>and</strong> Chester Council 2011. Claimant rates are calculated as a percentage of<br />
the population aged 16 <strong>and</strong> over.
Health Inequalities<br />
In the 40% most deprived areas in <strong>Cheshire</strong> <strong>West</strong> <strong>and</strong> Chester, life expectancy is significantly lower<br />
<strong>and</strong> death rates are significantly higher than the national average for both men <strong>and</strong> women.<br />
Although life expectancy has been improving <strong>and</strong> death rates have reduced in the 40% most<br />
deprived areas, the rate of improvement has not been as fast as in the rest of <strong>Cheshire</strong> <strong>West</strong> <strong>and</strong><br />
Chester, leading to widening health inequalities. In men, the gap between the most deprived areas<br />
<strong>and</strong> the rest of the population in <strong>Cheshire</strong> <strong>West</strong> <strong>and</strong> Chester is accounted for by coronary heart<br />
disease, lung cancer <strong>and</strong> digestive diseases. In women, the gap is accounted for by chronic<br />
obstructive pulmonary disease (295Hchronic bronchitis <strong>and</strong> 296Hemphysema), coronary heart disease <strong>and</strong><br />
lung cancer. Primary prevention measures to reduce smoking <strong>and</strong> heavy drinking of alcohol,<br />
improve diet <strong>and</strong> healthy weight <strong>and</strong> reduce the number of people with undetected raised blood<br />
pressure will have a big impact.<br />
In comparison to the rest of Engl<strong>and</strong> <strong>and</strong> Wales, <strong>Winsford</strong> <strong>Over</strong> <strong>and</strong> <strong>Verdin</strong> has an average<br />
occurance of childhood obesity at reception year <strong>and</strong> some pockets of low childhood obesity at year<br />
6. In relation to under 18 teenage conceptions, there some pockets of high conception rates <strong>and</strong><br />
other pockets of low conception rates compared to the rest of Engl<strong>and</strong> <strong>and</strong> Wales. For those under<br />
75, this ward has some pockets of high circulatory disease mortality <strong>and</strong> cancer mortality rates<br />
compared to the rest of Engl<strong>and</strong> <strong>and</strong> Wales.<br />
Sources: <br />
Inequalities in all-age, all cause death rates in <strong>Cheshire</strong> <strong>West</strong> <strong>and</strong> Chester, NHS <strong>West</strong>ern <strong>Cheshire</strong>, April 2011 <br />
Childhood Obesity Prevalence (Reception Year) 2007/08-2009/10, Joint Strategic Needs Assessment, April 2011. <br />
Childhood Obesity Prevalence (Year 6) 2007/08-2009/10, Joint Strategic Needs Assessment, April 2011. <br />
Under 18 Teenage Conceptions 2006-2008, Joint Strategic Needs Assessment, April 2011. <br />
Under 75 Cancer Mortality 2006-2008, Joint Strategic Needs Assessment, April 2011 <br />
Under 75 Circulatory Disease Mortality 2006-2008, Joint Strategic Needs Assessment, April 2011 <br />
Other sources of useful information<br />
Research, Intelligence <strong>and</strong> Consultation Team webpage, where you can view our publications <strong>and</strong><br />
access local data <strong>and</strong> statistics<br />
297Hwww.cheshirewest<strong>and</strong>chester.gov.uk/research<br />
DORIC, a Data Observatory <strong>and</strong> Research & Intelligence Collaborative for <strong>Cheshire</strong>, Halton <strong>and</strong><br />
Warrington that contains reports <strong>and</strong> statistics from a wide range of local <strong>and</strong> national organisations<br />
(fully functional in July 2011)<br />
298Hwww.doriconline.org.uk<br />
Neighbourhood Statistics, an easy to use tool that allows you to find statistics <strong>and</strong> information about<br />
your local area<br />
299Hwww.neighbourhood.statistics.gov.uk<br />
Office for National Statistics (ONS)<br />
300Hwww.statistics.gov.uk