Download - RAISG - Instituto Socioambiental
Download - RAISG - Instituto Socioambiental
Download - RAISG - Instituto Socioambiental

Create successful ePaper yourself
Turn your PDF publications into a flip-book with our unique Google optimized e-Paper software.
Balneário de Cauamé and road linking Brasil and Venezuela. Boa Vista, Roraima, Brasil.© Tiago Orihuela, 2006Urban district on the outskirts of Manaus encroaching on the forest. Manaus, Brasil.© Alberto César de Souza Araújo/ISA, 2007City of Altamira on the shores of the Xingu where the Belo Monte Hydroelectric Dam(UHE) is being built. Pará, Brasil. © Marcelo Salazar/ISA, 2011Carajás, the world’s largest open pit iron mine. Pará, Brasil.© Paulo Santos, 1999Amazonas river during one of the worst droughts registered in Amazonia. Barreirinha,Amazonas, Brasil. © Daniel Beltra/Greenpeace, 2005Alunorte, the world’s largest aluminum refinery. Barcarena, Pará, Brasil.© Paulo Santos, 2006Waste disposal from the Alunorte refinery. Barcarena, Pará, Brasil.© Paulo Santos, 2008Tucuruí Hydroelectric Plant, on the Tocantins river. Pará, Brasil.© Paulo Santos, 2002Aluminum ingot storage zone owned by Albras. Barcarena, Pará, Brasil.© Paulo Santos, 1996Bogotá (Colombia); Caracas (Venezuela); Lima (Perú); Paramaribo (Suriname); Quito (Ecuador);Santa Cruz de La Sierra (Bolivia); Belém and São Paulo (Brasil)2012Mechanized soya harvesting. Campo Verde, Mato Grosso, Brasil.© Paulo Fridman/Pulsar Imagens, 2008Cattle ranch previously forestland, between Querência and São José do Xingu.Mato Grosso, Brasil. © Federico Bellone, 2010Yard of one of the 140 logging companies established in Tailândia, in 2008. Pará, Brasil.© Paulo Santos, 2008
Work meetings and public presentations of <strong>RAISG</strong> between 2007–2012PREFACEAmazonia under Pressure is the result of a joint project involvingcivil society and research organizations from the Amazonian Network ofGeoreferenced Socio-Environmental Information (<strong>RAISG</strong>).The first attempt to structure this collaborative space was sponsored byISA in 1996, based on its experience of working in Brasil, accumulated since the1970s.From the outset the proposal was to build a fertile environment fordeveloping a long-term accumulative and decentralized process that wouldenable the compilation, generation and publication of information and analysesof the contemporary dynamics of (Pan) Amazonia.After a low-profile period, from 2007 onwards, as part of the new‘Amazonian wave’ linked to the global debate on climate change, we were ableto mobilize a group of institutions that together combine the minimal conditionsneeded to elaborate a joint work plan:• have a socio-environmental agenda;• make strategic use of geographic information systems; and• able to exchange and combine databases at (Pan) Amazonian scale.Since then considerable effort has been invested in creating andimplementing technical and political protocols, as well as investments inequipment, computing tools and staff capacity building, with support fromthe Rainforest Foundation Norway, the Ford Foundation, Avina and the SkollFoundation.The composition of the network has remained basically stable throughoutthe process with only a few changes. It is currently composed of 11 institutions(see page 4).The work required a series of face-to-face meetings in São Paulo, Lima,Belém, Bogotá and Quito in order to adapt methods, define technical criteria,verify information, combine data, prioritize themes, strengthen capacitiesand exchange experiences and knowledge (the previous page shows aphotographic mosaic of <strong>RAISG</strong> meetings and events held between 2007 and2012).Both consultations and virtual meetings with other technical specialistswere also held in each of the different countries.The first output of <strong>RAISG</strong>’s work was the map Amazonia 2009Protected Areas and Indigenous Territories, printed in Spanish, Portugueseand English. It was made available for downloading in digital format (www.raisg.socioambiental.org).Following this, each institution set up routines to update regularly thethematic databases on Amazonia in each country, adhering to formats andprotocols that ensure that this information can be integrated at various scales.In mid 2012 an updated version of the 2009 map was published and nowthis atlas, Amazonia under Pressure, which includes data and analyses onroads, oil and gas, mining, hydroelectric plants, fires and deforestation.Work on deforestation was assisted by Imazon’s software and experiencein interpreting satellite images of the Brazilian Amazonia, which helped <strong>RAISG</strong>to define a methodology suited to the diversity of Andean-Amazonian andGuianese landscapes. The assessment of deforestation carried out using thismethodology allowed us to obtain preliminary results for the years 2000, 2005and 2010, as presented in this atlas and the enclosed map.The present publication, one of the results of the <strong>RAISG</strong> initiative, isa contribution from civil society to the democratic debate on pressures inAmazonia and particularly on deforestation, an issue that is presently beingassessed by various national governments, as well as at the intergovernmentallevel of ACTO (Amazon Cooperation Treaty Organization).<strong>RAISG</strong> is currently in the process of formulating a 2013-2015 work plan,which will include:• maintaining basic routines for updating, enhancing, analyzing anddisseminating data on the themes of pressures and threats;• incorporating new work themes;• establishing cooperation agreements with other networks with the aim ofgenerating joint products; and• forming regional sub-networks.<strong>RAISG</strong> is a collaborative space open to all those interested in promotinga sustainable future and strengthening the socio-environmental diversity ofAmazonia. The present Atlas is intended to contribute to consolidating a widerangingregional view in which Amazonia is seen to extend beyond Brasil toinclude the Andean and Guianese countries.Beto RicardoNovember, 2012Amazonia under Pressure 7 <strong>RAISG</strong>
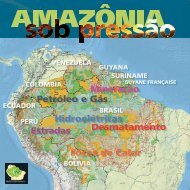
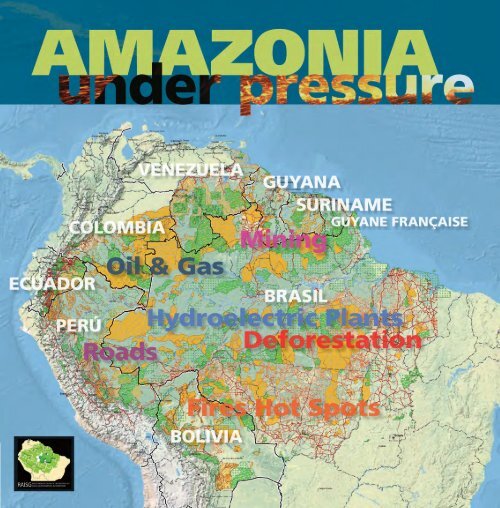
Map 1. Amazonia: cumulative pressure (<strong>RAISG</strong>, 2012)IntroduCTIONMap 2. Amazonia: cumulative threats (<strong>RAISG</strong>, 2012)The Amazonia presented in this publication is a territory with a huge socioenvironmentaldiversity now undergoing a process of rapid change. It covers anarea of 7.8 million km 2 , including 12 macro-basins and 158 sub-basins, shared by1,497 municipalities, 68 departments/states/provinces in eight countries: Bolivia(6.2%), Brasil (64.3%), Colombia (6.2%), Ecuador (1.5%), Guyana (2.8%), Perú(10.1%), Suriname (2.1%) and Venezuela (5.8%), as well as Guyane Française(1.1%). 1 Around 33 million people live in Amazonia, including 385 indigenouspeoples, as well as some living in ‘isolation.’ There are 610 PNAs and 2,344 ITsthat occupy 45% of the Amazonian surface area, without counting the small,medium and large rural landowners, various types of companies, research andsupport institutions, religious organizations and civil society organizations.This area results from boundaries agreed upon by <strong>RAISG</strong> members bycombining socio-environmental and juridical-administrative criteria, as explainedbelow, in order to define a spatial expression of the information and analyses.The geographical information system developed by <strong>RAISG</strong> has the flexibilityto allow products to be generated using other boundaries, such as thosedefined by hydrographic or biogeographic criteria, for example.Although countries like Bolivia, Brasil, Colombia, Ecuador and Perú definejuridical-administrative boundaries for their portions of Amazonia, publicpolicies do not reflect Amazonian socio-environmental particularities and are farfrom adopting the necessary (Pan-) Amazonian view and improving cooperationmechanisms.In all cases, there persists a view of Amazonia as a remote frontier providing‘infinite’ natural resources, with a demographic vacuum open to new forms offarming and extractivist colonization.This view has become more complex over the last 50 years with the newforms in which the region has been integrated into national and internationaleconomies. Amazonia is also now considered at national level as a territory capableof ensuring energy sovereignty and as a source of income based on theproduction and commercialization of raw materials. At the global level, the regionis seen as the most important source of fresh water and biodiversity, as a regulatorof the planet’s climate and as a carbon sink for large quantities of greenhousegases.Like the other products generated through the work of <strong>RAISG</strong>, the mainobjective of this publication is to overcome our fragmented views of Amazoniaand offer an ample panorama of the pressures and threats across the entireregion and other sub-units of analysis. The opposite page shows two mapsproviding a spatial illustration of the combined sum of pressures (map 1) andthreats (map 2).Pressures refers to the human actions currently taking place in Amazoniathat put at risk the integrity of the ecosystems and the collective and diffuse rightsof its inhabitants, whether traditional or otherwise.The threats are the human plans, projects or initiatives marked for the nearfuture, which may turn into pressures once implemented.In both cases <strong>RAISG</strong>’s members organized information under a set of prioritythemes mentioned in the preface, compiling and generating high qualityinformation that could be represented cartographically for the entire Amazonianregion.The present Atlas contains information on the following six themes, representingthe pressures and threats faced by Amazonia over the last decade– roads, oil and gas, hydroelectric plants, mining, fires and deforestation – analyzedin relation to Amazonia as a whole as well as to five different territorialunits: Amazonia in each country, Hydrographic Basins, Protected Natural Areas(PNAs), and Indigenous Territories (ITs). These analyses are supported by 55maps, 61 tables, 23 graphs, 16 boxes and 73 photographs. All this information isorganized in thematic chapters running to a total of 68 pages.It should be pointed out that it was not possible to include specific chapterson logging and farming – themes of great importance for a more complete evaluationof the pressures and threats on Amazonia – since no basic information onthem exists that covers the region as a whole. These themes will be discussed intwo boxes included in the present introduction.1 The <strong>RAISG</strong> workgroups decided to maintain the country names as written in their original languagesin all publications.<strong>RAISG</strong> 8Amazonia under PressureAmazoniaunder Pressure 9 <strong>RAISG</strong>
The geographical boundary of AmazoniaThe boundaries of Amazonia as a region can be defined using different methodologies as wellas a variety of data sources for mapping them. The boundaries most frequently used are the biophysicalborders – related to hydrography, relief and vegetation – and the administrative boundaries recognizedby the different nations for the application of protection and/or development policies, which takeinto account the region’s unique features. Economic and social criteria can also be used in defining theregion’s boundaries. Hence no consensus exists on exactly what Amazonia is: to the contrary, we knowthat there are various Amazonias related to the different universes of the actors and interests involved.In 2004 a study undertaken by ACTO on the boundaries of Amazonia, focusing on different biophysicalparameters, identified a number of important overlaps that highlight the difficulties involved inselecting the criteria for defining the region’s borders:“- defining the area hydrologically is unsatisfactory given the diversity of Amazonia’s biogeography;- since the biota of the tropical forests of the Amazonian lowlands is similar in various importantaspects with that of the Guianas region, the latter should also be considered in the definition ofthe area;MIN1. Amazonia boundaries and land coverage- generally speaking, the biota of the Andean highlands are not directly related to the flora andfauna of the Amazonian lowlands, though they are interconnected ecologically and hydrologically;- similarly, the slopes of the Brazilian mountains, which drain into the Amazon Basin, despitepresenting different geographic and biotic characteristics, are ecologically and hydrologicallyconnected to Amazonia;- in terms of climate, the Amazonian region cannot be considered in isolation from the rest of thecontinent or indeed the world.”For <strong>RAISG</strong>, the objective is not to establish an unequivocal Amazonian boundary, administrativelyor scientifically based, but to delimit an area of analysis in a way that the information is useful toa variety of actors. The products will have different formats and publics, whether they are published onthe network’s web site (www.raisg.socioambiental.org) or in printed format.In these analyses, given the different definitions of the Amazonian borders used by each country,<strong>RAISG</strong> used a boundary that corresponds to a region for which we have updated and systemizeddata, backed by accumulated knowledge and a working experience. This enables <strong>RAISG</strong> to carry outdiagnoses and projections regarding both the threats and the attempts to protect the area, as wellas efforts to monitor their evolution over time. This boundary, which encompasses 7.8 million km 2 , isprimarily composed of the biogeographical boundary with the exception of Ecuador andBrasil where legal-administrative criteria are used. This is the area to which the statisticsand other general references to Amazonia in this publication apply. Table TIN1 presentsthe definition of Amazonian areas used by each country.To assist the reader, the boundaries of both Amazonia as a basin and the biogeographicalAmazonia are shown in the map Amazonia 2012 – based on the consolidatedinformation – as well as the “boundary used by <strong>RAISG</strong>.”On <strong>RAISG</strong>’s web page the information will be organized in a form that enables usersto make searches taking this boundary or basins and sub-basins as parameters whenanalyzing hydrographic aspects, for example. Similarly, biogeographical parameters canbe used when planning for conservation projects, while administrative boundaries canbe employed when the user’s interest relates to development, taking into account socioenvironmentalinformation.A survey of the different definitions of Amazonia in each of the countries fromthe biogeographical, hydrographic and legal-administrative viewpoints is summarized inTIN2, where the boundary employed by <strong>RAISG</strong> for its calculations and analyses is highlightedin green.The MIN1 map shows the main classes of plant cover with the existing vegetationand the zones of human intervention (agriculture, livestock farming and so on). The overlappingof the three aforementioned Amazonian boundaries allows the reader to observethe approximate degree of human impact within each of them.TIN1. Amazon definitions, by countryBIOGEOGRAPHIC HYDROGRAPHIC BASIN “LEGAL/ADMINISTRATIVE”BOLIVIAapprox. 475,278 km 2 . It comprises about half of the area of Bolivia (475,278 km 2 ). It consists of a approx. 714,493 km 2 . The watershed is comprised of the Rio Madera watershed and a small approx. 156,267 km 2 . Article 390 of Bolivia’s new Political Constitution of the Statemosaic of extensive upland and seasonally flooded (várzea and igapó) Amazonian forests, flooded portion of the upper Amazonas basin on the border with Brazil.(CPE) defines the Bolivian Amazon as a strategic area, specially protected for thesavannas, semi-humid transition forests in the direction of the Cerrado, and sub-Andean and Yungascomprehensive development of the country given its environmental sensitivity, existingforests (the latter being characterized by high biodiversity).biodiversity, water resources, and eco-regions. It is understood to encompass the entiredepartment of Pando, the province of Iturralde in the department of La Paz, and theBallivián and Vaca Diez provinces in the department of Beni.BRASILapprox. 4,213.463 km 2 . Wide variety of physiognomies, with dominance of flat-topped interfluves approx. 4,692.488 km². Basins of the rivers Amazonas, Negro, Madera and Tocantins, and approx. 5,217.423 km². Region of planning and incentive to occupation called “Amazoniacovered by evergreen tropical forests and submontane forests associated to infrequent elevations. It the Guyana/Macapá and Atlantico basins.Legal”, defined by Federal Law 1806 from January 6th 1953 with the political aim ofincludes a transitional zone between rainforest and savanna like areas (locally called “cerrado”), andintegrating the region to the national territory and foster its development. It consists oflarge extensions of sandy soils with structural and floristic patterns of forest and sandy savannasthe Brazilian north region states (Acre, Amazonas, Amapá, Pará, Roraima, Rondônia andhighly and locally adapted, called “campinaranas” and “campinas”, respectively. Periodically floodedTocantins), Mato Grosso and a portion of Maranhão (west from meridian 44º).wetlands have vegetation types that vary from wet fields to Palm Swamps (locally called veredas) andriparian forests.ECUADORapprox. 91,045.74 Km 2 . Starts in the Andean-Amazonian transitional forests, at 1,300 meters above approx. 131,950.45 km 2 . It includes portions of the basins of the rivers Putumayo, Napo, approx. 116,605.87 km 2 . According to the Article 250 of the new Constitution of Ecuadorsea level along the foothills of the Andes, and moves toward the Amazon floodplain to about 300 m Tigre, Pastaza, Morona Santiago and Mayo. All are binational or transnational basins.of 2008, referred to the Ecuadorian Amazon as the territory of the Amazon provincesaltitude it is dominated by several types of lowland evergreen forests including: flooded forests of whiteand states that it is part of an ecosystem necessary for the environmental balance ofand black water, palm forest) with a significant presence of lacustrine grasslands and other non forestethe planet. This territory will be a special land for which there will be a comprehensiveecosystems (Sierra, 1999)planning law including social, economic, environmental and cultural issues, with a landuse planning to ensure the conservation and protection of ecosystems and the principleof “Sumak Kawsay” (Good living). The Ecuadorian Amazon region comprises the provincesof Sucumbios, Napo, Orellana, Pastaza, Morona Santiago and Zamora.COLOMBIAapprox. 483,164 km 2 . The Amazon region incorporates hydrographic as well as biogeographic politicaladministrativeapprox. 342,372.9 km 2 . Putumayo River Basin, Negro River basin, Caquetá River basin and approx. 483,164 km 2 . The political-administrative division covers the southern part ofboundaries: i) the basin boundary in the western sector is defined by the drainage divide a small portion of the Napo River basin.the department of Vichada; the southeastern of the Meta Department; the entire territoryin the upper part of the eastern mountains of the Colombian Andes; ii) the northern sector reachesof the departments of Guainia, Guaviare, Vaupes, Amazonas, Putumayo and Caqueta;up to where the forest cover limits with the natural savannahs in the Orinoquia; iii) the southern and“la Bota Caucana”, in the department of Cauca and the Amazonian watershed of Nariñoeastern boundaries limit the international borders of Colombia with Ecuador, Peru, Brazil and Venezuela(the highest part of the Guamuez, Sucio, San Miguel and Aguarico rivers). The basin’s(http://siatac.siac.net.co/web/guest/region, Murcia Garcia, 2009); and iv) the ecosystems includeadministrative districts or municipalities are in total 78. 58 correspond to municipalitiesthe Eastern Mountain “Paramos”, birth of important rivers which cross the Amazon basin, to areas(41 fully included in the region and 17 partially included) and 20 departmental administrativeof the tropical rain forest. These ecosystems range from Andean, flood plains, mainland to xeric anddistricts , all included in the region (Murcia Garcia et al, 2009).savannahs.GUIANA The entire country approx. 12,300 km 2 . Tributary of the Branco River. Without informationGUYANE FRANÇAISE The entire country Is not tributary of the Amazonas River. Without informationPERÚapprox. 782,813 km 2 . There are several different classifications of ecosystems in the Peruvian Amazon.approx. 966,170 km 2 . The Peruvian Amazon is drained by many rivers of varying sizes and Sin información de área In terms of political units, the Peruvian Amazon includes theMost of them divide this region into two large landscapes: The Amazonian lowland, located below volumes; the largest of these include the Amazonas, Marañón, Napo, Ucayali and Madre de entirety of the Departments of Loreto, Ucayali and Madre de Dios and a part of thethe 500 to 800 msnm and the high jungle or montaña above the Plain and up to 3600 msnm. However, Dios Rivers. Source: ANA 2010.Unidades Hidrográficas del Perú, 1/100 000.Departments of Amazonas, Cajamarca, Huancavelica, La Libertad, Pasco, Piura, Puno,this classification simplifies the eco-systemic diversity in contrast with that postulated by EncarnaciónAyacucho, Junín, Cusco, Huánuco and San Martín. Source: MINAM 2009. Mapa de(1993) who identifies 16 types of vegetation in the Amazon lowland defined by the predominant plantDeforestación de la Amazonía Peruana – 2000. Memoria Descriptiva, Lima, p14.species or by the type of waters that flood the forests. Source: Encarnación, F. 1993. El bosque y lasformaciones vegetales en la llanura amazónica del Perú. Alma Mater Rev. UNMSM. 6: 94-114.SURINAMEHistorically known region of the Amazon lowland rainforest biome in northern South America (taken or Is not tributary of the Amazonas River.Without informationinferred from TREES map 1999; S and E borders delimited according to Soares, 1953).VENEZUELAapprox. 453,915 km 2 . It is equivalent to the Venezuelan Guiana Shield region (Huber 1995, Gorzula and approx. 53,280 km 2 . From a strict hydrographic point of view, the Amazon basin only includesapprox. 53,280 km 2 . Officially includes only the hydrographic boundaries of the water-Señaris 1998, Pérez-Hernández and Lew 2001, Eva and Huber 2005), which occupies, in its widestthe area south of the Casiquiare river, which communicates the Orinoco with the Negro shed.interpretation, the states of Amazonas, Bolívar and Delta Amacuro.River (Eva and Huber 2005).TIN2. Amazon surfaces per countryCountry Amazon area (km 2 ) % of Amazonia % of countryBolivia 479,264 6.2 43.6Brasil 5,006.316 64.3 58.8Colombia 483,164 6.2 42.3Ecuador 116,284 1.5 46.7Guyana 214,969 2.8 100.0Guyane Française 86,504 1.1 100.0Perú 782,820 10.1 60.9Suriname 163,820 2.1 100.0Venezuela 453,915 5.8 49.5Total 7,787.056Protected Natural Areas and Indigenous TerritoriesProtection of Amazonia’s socio-environmental diversity is being consolidated through the recognitionof the territorial rights of indigenous peoples and the creation and implementation of a diverseset of protected areas. These conservation strategies have expanded over recent years and todaycover a surface area of 3,502,750 km 2 (2,144,412 km 2 in Indigenous Territories and 1,696,529 km 2 inProtected Natural Areas with 336,365 km2 overlapping between the two) corresponding to 45% of theregion (TIN3).A portion of the Protected Natural Areas (PNAs) and Indigenous Territories (ITs) in Amazoniahave effectively turned into islands of forest following the expansion of the export economy in basicproducts of low aggregated value.There is a large shortfall in official recognition of the lands of many of the 385 indigenous peoplesliving in Amazonia. These remain to be identified and quantified. Currently they cover a surface area of1,641,117 km 2 and 28,127 km 2 , represented by territorial reserves and intangible zones respectively,which combined correspond to 21.5% of the region. The proposals for territorial reserves and the ITsnow in the process of official recognition add up to 475,168 km 2 , equivalent to 6.1% of the total regionTIN3. PNA and IT in AmazoniaArea (km 2 )% of AmazoniaProtected Natural Areas (PNAs) 1,696.529 21.8%Indigenous Territories (ITs) 2,144.412 27.5%Overlapping area between PNAs and ITs 336,365 4.3%PNAs and ITs without overlapping 3,502.750 45.0%TIN4. Cartographic sources of PNAs and ITs usedCountrySource/date (year)<strong>RAISG</strong>memberITBolivia Viceministerio de Tierras. Mapa de TCOs y sus áreas tituladas en Bolivia (no publicado). Versión 2009 FANBrasil <strong>Instituto</strong> <strong>Socioambiental</strong>, 2012 ISAColombia <strong>Instituto</strong> Geografico Agustin Codazzi, 2007; INCODER, 2009 FGAEcuadorEcoCiencia, 2009; ECORAE ,2002; ECOLEX, 2011; Gobierno Autónomo Descentralizado de Sucumbíos,EcoCiencia2011; Subsecretaría de Tierras, 2011; Fundación Arcoiris, 2010; MAE, 2011Guiane Française Direction Régionale de l’Environnement de Guyane, 2009 DEALGuyana Indigenous Affair/Governo da Guyana, 2009 ISAPerú SICNA: incluye ACPC, AIDESEP-CIPTA, CEDIA, IBC, PETT-Loreto, GEF PNUD, GOREL y PFS. 2011 IBCSuriname ACTVenezuela Ministerio del Poder Popular para la Salud (mapa), 2007 ProvitaNATIONAL PNABolivia SERNAP 2005 FANBrasil <strong>Instituto</strong> <strong>Socioambiental</strong>, 2012 ISAColombia Unidad Administrativa Especial Sistema Parques Nacionales - Dirección Terrriotial Amazonía, 2010 FGAEcuador MAE, 2010 EcoCienciaGuiana Francesa Direction Régionale de l’Environnement de Guyane DEALGuyana Digital Chart of World, 1993Perú MINAM, 2012 IBCVenezuela Rodriguez et al., 2011 (datos no oficiales) ProvitaDEPARTMENTAL PNABoliviaGobierno Municipal de La Paz, 2010; Ministerio de Medio Ambiente y Agua, 2009; PMOT Ixiamas, FAN2009; Prefectura del Beni, 2008Brasil <strong>Instituto</strong> <strong>Socioambiental</strong>, 2012 ISAFORESTEcuador MAE, 2010 EcoCiencia<strong>RAISG</strong> 10Amazonia under PressureAmazoniaunder Pressure 11 <strong>RAISG</strong>
(TIN5). The area of potential newly recognized ITs is unknown. Based on the data compiled for the differentcountries, the ITs were classified in terms of their level of official recognition and the categoriesused by each country. This resulted in three classes: i) officially recognized lands of traditional use andoccupation; ii) traditionally used and occupied lands without official recognition now in the process ofbeing recognized (or lacking information on the official recognition process); and iii) territorial reservesor intangible zones (reserved for isolated indigenous peoples).The boundaries of PNAs and ITs used in this Atlas were complied and/or produced by the institutionsbelonging to <strong>RAISG</strong> based on a variety of different official and non-official sources (TIN4).PNAs in Amazonia cover a significant total surface area of 1,696,529 km 2 , corresponding to21.8% of Amazonia – excluding the overlaps of different categories of environmental protection andincluding the overlaps with Indigenous Territories, which equals 336,365 km 2 (TIN6). Systems of protectedareas are now being consolidated at national, regional and local level in various countries in theregion. Based on data compiled for each country, the PNAs were classified in terms of their administrativelevel (national or departmental/state) and the type of use of the areas, resulting in four classes: i)indirect use: protection of biodiversity, geological and scenic landscape (aesthetic quality) compatiblewith tourism, education and research; ii) direct use: protection of resources compatible with controlleduse following utilization plans; iii) direct/indirect use: mixed areas where use is defined through zoning;and iv) transitory categories: reserved areas of forest that may or may not be converted into protectedareas or concessions, in accordance with the result of research.Watersheds within the Amazon BasinThe watersheds utilized in the analyses were obtained through relief data from the Shuttle RadarTopography Mission (SRTM), available with a resolution of 15 arc-seconds (approximately 450 meters)and originally processed by the HydroSHEDS Project.This data was then used to generate the flow direction and accumulation models semiautomatically,along with the 2,862 hierarchized and structured river drainage systems, corresponding to1,453 basins covering more than 150,000 hectares and their 1,409 intermediary areas, affluents of theOrinoco and Amazon rivers, as well as the Guianas, the areas surrounding the Tocantins river and thewestern part of the Brazilian ‘NE Atlantic.’Using a specially developed algorithm, a unique system was established and applied to codifythe segments hierarchically in accordance with the six generated Strahler levels, common to the hydrographicnetwork and their respective basins.Based on the names contained in the digital cartography of rivers, compiled by the institutionsbelonging to <strong>RAISG</strong> in the different countries, and the consultation of different maps, the drainage sectionswere assigned with the name of the respective river in complete form up to Strahler level 3 and inpartial form to levels 2 and 1 (TIN7).TIN5. Extension of Indigenous Territories in Amazonia (km 2 )Indigenous Territories officially recognized 1,641.117Indigenous Territories not officially recognized (or without information) 435,406Territorial Reservation 28,127Proposed Territorial Reservation 39,762Total 2,144.412TIN6. Extension of Protected Natural Areas in Amazonia (km 2 )Type of useNationalAdministrative levelDepartmentalIndirect use 768,261 132,078 900,338Direct use 403,016 354,942 757,958Transitory use (Perú) 34,079 0 34,079Direct/Indirect use 4,154 0 4,154Total 1,209.509 487,020 1,696.529TotalAfter generating the drainage sections as described above, all the respective basins or relatedareas were generated, structured, codified and named: nine level 6 basins, 29 level 5 basins, 63 level 4basins and 192 level 3 basins. Levels 1 and 2 are still awaiting codification and toponyms. Level 3 wasestablished as the basis for presenting results on deforestation and other pressures, recognizing thatin many cases this level approximates the scale of municipalities and other correlated administrativeunits, which may be of interest to local governments.In this Atlas, macro-basins are those described here as level 5, and sub-basins as those at level3 (MIN2).General MethodologyThe information providing the foundation for this atlas Amazonia Under Pressure was assembledin June 2009 and updated in May 2011. This information was compiled in each country based onofficial sources, which show differences in time, scale, projection, availability and update period. Thecartographic sources used are cited where appropriate in the thematic chapters.The methodology is grounded on six sequential stages:1) Identification and compilation of cartographic information, which was revised and standardized,selecting only the data located within the area of study and available for all countries.2) Compilation of secondary information on the themes.3) Systematization and organization of cartographic information, presented in a layered themeformat. In order to ensure that the representation was cartographically and numerically equivalentacross the different countries, the specifications of each were taken into account in order toobtain a common set of captions. For example, the international borders were adjusted accordingto a single baseline in order to avoid gaps and overlaps in information. For all the themes,information was classified on the basis of a shared attribute of a caption defined during the initialstage. Protected Natural Areas were classified by type of use, while Indigenous Territories wereclassified in relation to the degree of official recognition. The aim was to classify the pressurethemes by activity phase or their time scale.4) Processing and cross-checking of data by thematic subgroups. The themes were crosscheckedwith the borders of the countries, basins, PNAs and ITs previously grouped and systemizedinto a single layer of information;5) Analysis of results by theme with the elaboration of tables and analytic maps that, combinedwith the compiled secondary information, served as a basis for producing technical notes oneach theme.6) Elaboration of technical notes on each theme.For the development of these stages, work sessions and technical meetings were held at differentmoments, both face-to-face and virtual, with the exchange of experiences, knowledge and capacitybuilding between the teams.The ArcGis GIS tool was used, along with Access for the database resulting from the analyses.In all chapters the results of the cross-checks and analyses are presented in the following order:Amazonia as a whole, Amazonia within each country, macro-basins and sub-basins, Protected NaturalAreas and Indigenous Territories.It is important to stress that the thematic cartographic analyses took into account only the directoverlapping of the themes with the units of analysis: in other words, “areas of influence or impact” relatingto the themes were not considered.MIN2. Hydrographic basins in AmazoniaTIN7, Length and number of drainage segments per Strahler levelsStrahler Length (km) Number of segments1 107,410 1,4532 59,137 7263 27,666 3484 16,044 2255 5,456 896 1,330 21Total 217,044 2,862<strong>RAISG</strong> 12Amazonia under PressureAmazoniaunder Pressure 13 <strong>RAISG</strong>
BIN1. Cattle ranching and agriculture in the expansion of Amazonian frontiersBIN2. LoggingSoy cultivation advancing into the forest. Mato Grosso, Brasil. © Ton Koene, 2009In Pan-Amazonia, the farming sector has historically been more an instrument for expansion of the agricultural frontierthan a consolidated activity with an economic objective. At the regional level we can identify six common characteristicsof this sector:√ The development of activities that make occupation of the land possible, without any direct connections with productionchains and focused mainly on production rather than transformation or adding value to the crop.√ A high degree of activities requiring large open spaces and/or low relative productivity, based on a variety of differenttechnological or social models.√ Little knowledge – or recognition – of the diversity of soil types in the region, some of them unique and particular (forexample, those used for seasonal floodland crops).√ Pastures end up occupying more than 90% of the areas initially used for annual, perennial or agroforestry crops.√ A high rate of disease infestation in both the primary production and the processing sectors.√ An almost total absence of technical assistance and rural extension work.At the regional level, four farming systems were identified:√ The traditional integrated system is based on the knowledge and adaptation of indigenous, extractivist or riverdwellingcommunities. It is characterized by a common property regime, high diversification, management of naturalresources, low environmental impact and low income generation with priority given to subsistence use.√ The small-scale colonization system is based on official land distribution programs or on opportunistic migrationsassociated with a road or other infrastructure project. This system is developed in independent areas, does not adapt tolocal conditions and has a high turnover.√ The medium and large-scale individual family system is very often based on the appropriation of public lands. Theseare most often focused on cattle ranching with low investment in technology and infrastructure, while priority is givento the property (cattle herd and pastureland) rather than to economic accumulation per se. This farming system hasshown difficulty integrating itself into external production chains.√ The large-scale agribusiness system is the most recent to appear in the Amazon and is much less frequent than theothers. It has arisen in zones with better infrastructure. This system prioritizes large-scale and mechanized monocropping(soya, for example), intensive use of chemical inputs and a small workforce. In contrast to the other forms, it isdirectly connected to more substantial production chains.Rice, cacao, coffee, manioc and fruit trees are the more common crops found in Pan-Amazonia, in addition to pastureland. At the local level, coca is grown in Bolivia, Colombia and Peru; maize primarily in Peru, Ecuador and Bolivia; palm foroil in Bolivia, Brazil, Colombia, Peru and Venezuela; soy beans in Bolivia and Brazil; and forest plantations in Bolivia, Braziland Venezuela.In the case of the Brazilian Amazonia the entire area used for agriculture, around 3.4 million hectares, represents lessthan 7% of the total farming area, (45.1 million hectares). The remaining 93% is covered by various kinds of pasture witha productivity ranging from 0.4 to 5 animals per hectare with an average of roughly 0.9. The 3.4 million hectares used foragricultural includes large-scale commercial crops (specially soy beans and oil palm), variable scale commercial crops,planted in the small- to medium-range farms (manioc, fruits, cacao, pepper, rice, jute, mallow, assai palm, cupuaçu fruit,peach palm, sugar cane, corn, etc.), small-scale agroforestry systems (fruits, timber, fibers) and finally subsistence crops(rice, beans, manioc, etc.). (Roberto Smeraldi/Amigos da Terra-Brazilian Amazonia)In the Bolivian Amazonia agriculture and cattle ranching are the primary activities responsible for deforestation. Thesetwo activities resulted from a variety of economic and social forces that led, on one hand, to a disorderly establishmentof pastures and, on the other, to the arrival of rural migrants from the highlands who practice subsistence farming (rice,maize, fruit trees and so on) with little or no planning in their occupation of forest lands. The southern portion of the BolivianAmazonia is also threatened by the expansion of mechanized farming (soy beans, sunflowers, sugar cane and rice), whichis more developed in the central part of the Santa Cruz department, especially from the 1980s onwards. Hence deforestationresults from the recent expansion in mechanized farming in the southern part along with small-scale cattle ranchingand agriculture in the southern part, but also in the western and northnorthern parts of the Bolivian Amazonia. Between2000 and 2010 around 765,000 ha were deforested, representing 1.6% of the Bolivian Amazonia. (Daniel Larrea/FAN)In the Ecuadorian Amazonia the main income generating activities include agriculture (56.5%), cattle ranching (10%)and mixed farming (30%). These activities are carried out through systems that use natural resources and labor intensivelybut with very low levels of productivity and profitability. Forestry and agroforestry activities, which exploit the resources ofstanding forests, account for just 1.4% of economic production. (Víctor López/EcoCiencia)In the Colombian Amazonia agricultural and cattle ranching activities are the biggest cause of deforestation and havedeveloped principally in the departments of Caquetá, Guaviare, Meta and Putumayo, located in the northwestern zone thatincludes much of the Andean-Amazonian piedmont. These activities began in the early 1960s when the national governmentpromoted organized colonization programs in the Amazonia with the idea of distributing land to rural populationsdislocated by the violence in the Andean zone and bring under commercial production the vast “unused” lands in easternColombia. At the end of the 1980s the coca bonanza began in Colombia and it was in the Amazonian colonization zonesthat subsistence crops, cattle and forest were replaced by coca grown for illegal use. In 2011 around 100,000 hectareshad either permanent or intermittent coca plots in these four departments. During the past decade the Colombian governmentbegan to eliminate coca cultivation through programs combining aerial fumigation and manual eradication, and bystimulating the reconversion of these lands to cattle ranching (Caquetá and Meta), family production units (Guaviare) andbean growing (Putumayo). (Natalia Hernández)Logging in Amazonia is an important factor in the degradation of its forest; most of it illegal. There are some examplesof sustainable forest management certified by bodies such as the Forest Stewardship Council (FSC), but these represent asmall percentage of the overall activity.Most often centered on a few, high-priced species of hard woods, logging exerts a strong pressure on PNAs, ITs andother areas, and is frequently associated with illegal appropriation of public lands. Illegal logging also affects legal loggingconcessions and hampers the profitability of approved management plans given the theft of timber and unfair competition inthe marketplace, since the illegal operators do not pay taxes or environmental costs.Logging involves a specialized production chain that connects remote areas far from the national and international markets,using the legal road network and navigable rivers, as well as illegal private roads.Legal logging may turn into a long-term forest management effort or may be only a phase anticipating the implementationof an agricultural project, in which the income from felled timber plays an important role in capitalizing the new agriculturalventures. Thus logging can be a pioneering activity preceding the development of pastures or farm land for grain crops.In Brazil, legal forest management occurs in three situations: in privately owned forest areas, in areas belonging to traditionalcommunities (public or private) and in public forest concessions. Around 75% of the forest in Brazilian Amazonia ispublic land and the legal activities of forest companies are restricted to forest concessions, established by law in 2006. Thereexist around 10 forest concession contracts in operation in Brazil, all stemming from public tenders.For the Brazilian Amazonia, Imazon developed the Logging Monitoring System (Simex) which is being implemented in thestates of Pará and Mato Grosso where the incidence of logging is high. In these regions predatory extraction has penetratedinto PNAs and ITs. According to Simex, the total area logged in Pará – legally and illegally – from August 2009 to July 2010was 1,205 km 2 , most of it (65%) illegal. Most of this illegal logging (84%) occurred in private unoccupied or disputed areas.In Mato Grosso 2,260 km 2 was logged between August 2009 and July 2010, 44% of which was illegal. Most of this total(87.8%) was also logged in private unoccupied or disputed areas.In Peru since the 1960s legislation has attempted to regulate forest logging through the implantation of a system of concessionsor contracts. The last version dates from 2000 when a new Forestry and Wildlife Law (Nº 27308) was issued. Itestablished the creation of Permanent Production Forests (BPPs) intended exclusively for forest management. Each area wasdivided into smaller units, each approximately 50 km 2 in size, which are auctioned off to private bidders in the form of ForestConcessions (FCs). These areas remain under State ownership with usufruct rights given to the concessionaires for up to fortyyears. Individual concessionaires are allowed to accumulate a maximum area of 500 km 2 (10 FCs). In August 2009 therewere 177,639 km 2 of permanent production forests, 7,618 km 2 of which had already been awarded in forest concessions.Despite these advances, an independent investigation revealed that 80% of Peruvian logging is illegal (Urrunaga et al., 2012).Unfortunately the 2000 law has not generate the expected results, in part because the process for delimitation of the PermanentProduction Forests was carried out from distant urban offices, without information regarding or concern for currentoccupation or traditional use of the areas. This produced a series of overlaps with registered native communities and, evenmore seriously, with lands and forests claimed by indigenous populations but not yet registered and/or demarcated.In Bolivia the forest legislation is based on Law 1700, approved in 1992, which in the 1990s stimulated the voluntaryconversion of the former usage contracts into a successful concessions system supervised by what was then the ForestSuperintendent. In 2009 this institution was replaced by the Land and Forest Public Oversight Authority (ABT), responsible forforest resources, land and soils. This change was accompanied by the approval of a new Constitution during the same yearthat does not recognize the system of concessions for exploiting natural resources, including forest resources. This scenariostimulated an increase in the illegal exploitation and marketing of timber. Currently a new law is being drafted with the aim ofregulating forest activities. Recently the Framework Law for Mother Earth and Integral Development for Living Well was approved(October 2012), which sets out the overall vision and legal foundation for integral development with the use of naturalresources in Bolivia. However, the forest issue is dealt with only in a very superficial way in this new law.In Ecuador, the government has been trying to finish the National Forest Inventory since 2010. Nonetheless, there is littlereliable information regarding illegal logging in the Ecuadorian Amazonia. It is estimated that 70% of the timber exported fromEcuador is illegally sourced and may even derive from indigenous lands or zones reserved to isolated indigenous groups, asin the case of the Taromenane and Waorani (CONAIE, 2006 and Sierra et al., 2010). Other sources assert that the provincesof Orellana, Pastaza and Morona Santiago are the most affected by illegal logging.In Colombia it is estimated that 42% of timber sold is illegal, and that between 20 and 40% of the same is extracted inAmazonia. Only 33% of sold timber has forestry certificates. To combat this problem in August 2009 the Inter-Sector Agreementfor Legal Timber was established and renewed in 2011. This instrument looks to ensure that the timber extracted, transported,processed, sold and used in Colombia comes exclusively from legal sources (Legal Timber Agreement in Colombia).(Beto Ricardo, ISA, with the collaboration of Tasso Azevedo)Logging company, one of 140 established in Tailândia. Pará, Brasil. © Paulo Santos, 2008Operation to control illegal logging. Belém, Pará, Brasil. © Paulo Santos, 2010Forest and pasture being burnt for cattle ranching, Pará, Brasil © Daniel Beltra/Greenpeace, 2008 Port run by Cargill for grain exportation. Santarém, Pará, Brasil. © Paulo Santos, 2010Batch of illegal timber confiscated in Belém. Pará, Brasil. © Paulo Santos, 2010Roads – Amazonia under Pressure 15 <strong>RAISG</strong>
MRD1Roadsin AmazoniaROADSOver the last 50 years, roads have been recognized as one of the main factors encouragingnew forms of using and occupying Amazonia. Their presence supports the advance ofcolonization and changes in the ways in which land is used, which, in turn, acts as a catalyzing or determiningfactor in deforestation (Chomitz et al. 1996; Barreto et al., 2006; Pfaff et al., 2007; Southworthet al., 2011). The intensity with which areas are affected in each region depends on the socioeconomiccontext, the development policies in place, and the speed with which changes are occurring in thevegetative cover (Barreto et al., 2006; Duchelle et al., 2010; Almeyda et al., 2010).Trans-Amazonian Highway. Anapú, Pará, Brasil. © Paulo Santos, 2005ContextRoads (highways, roads or trails) can accelerate the use of Amazonia’s resources and the region’stransformation. Their presence is an incentive to expanding human settlements and intensifyingfarming activities, logging, mining and so on.The correlation between paved roads and deforestation is high. It is estimated that in 80%of cases in Brazilian Amazonia, deforestation is found up to a distance of 30 km from paved roads,although many fire-cleared areas can be found at greater distances (Barreto et al., 2006). Roads,whether paved or not, promote new forms of occupying the Amazonian territory.The development of the road infrastructure in all the Amazonian countries is justified by governmentsin various ways: (i) to facilitate transportation of imported goods from sea ports to the differentregions of the countries; (ii) to facilitate the transport and exportation of raw materials, minerals, oil andmanufactured goods from the different regions to the sea ports; and (iii) to strengthen the regionaleconomy through the Initiative for the Integration of the Regional Infrastructure of South America (IIR-SA). Nonetheless the road system does not necessarily or only meet these objectives.In the countries of Andean Amazonia, the road system was constructed following a north-southaxis in order to generate connections, the main cities. Over the last ten years, though, the road systemhas been constructed, expanded and improved from east to west in order to interconnect the populatedcenters of Brazilian Amazonia with the Andean region and these centers, in turn, with the coastalcities where the main sea ports onto the Pacific and Atlantic Oceans are located.It should be emphasized that across a vast extent of Amazonia, river navigation representsthe only form of covering large distances, as well as gain access to communities, cultivated areasand other production zones. Along the Amazon Axis of the IIRSA, the aim was to connect the Pacificand Atlantic Ocean through a series of land and river routes across an area covering 5,657,679 km 2(Cosiplan, 2011). Plans to connect the Atlantic to the Pacific acceleratethe pressures on Amazonian territories There are 96,500 km of roads throughout Amazonia as a whole.Most of these, 64.5%, are unpaved Perú and Bolivia are the two countries withhighways planned through the heart of the Amazonian forest The peripheral pattern of road distribution largely affects theheadwaters of the Upper and Middle Amazon basins PNAs and ITs have a road density 3 to 4 timeslower than the regional averageľMethodologyTo identify and describe the geographic features of the road distribution, georeferenced informationwas compiled on the main paved roads, unpaved roads and projected (or planned) roads existingin Amazonia. The roads in the process of being paved and those for which no information existswere classified as ‘unpaved.’ Due to the differences in the level of information available in each country,the analyses excluded secondary or tertiary roads (tracks), along with the service roads existing withinproduction areas.The road density per unit of analysis was calculated [(total extent of roads (km)/surface areaof unit of analysis (km 2 )*1.000] which will be indicated below as km/km 2 . The multiplication of the finalvalue by 1,000 was designed to facilitate use of the figures and lessen distortions caused by the differencesin the total length of roads according to the units of analysis used (region, country, macro-basinand sub-basin, protected areas and Indigenous Territories).Cartographic sources for the theme Roads: • BOLIVIA: FAN, 2009 • BRASIL: <strong>Instituto</strong> Brasileiro de Geografia e Estatística - IBGE, Malha Municipal 1:1.000.000, 2005 • COLOMBIA: Fundación Puerto Rastrojo (Atlas de la Amazonía Colombiana), 2001; IGAC,2010 • ECUADOR: Ministerio de Transporte y Obras Públicas, 2006 • PERÚ: Ministerio de Transporte y Comunicaciones - MTC, 2008 • SURINAME: Digital Chart of World, 1993 • VENEZUELA: <strong>Instituto</strong> Geográfico de Venezuela Simón Bolívar, 2003. Oceanand relieve: World Physical Map, U.S. National Park Service, in ArcGIS Online Services.¸<strong>RAISG</strong> 16Amazonia under Pressure – RoadsRoadsInter-Oceanic Highway on the Brasil-Perú Amazonian border. © Odair Leal, 2006Ä Due to the construction of roads toexplore oil, Ecuador has the highestdensity of roads in the whole ofAmazonia, 37.5 Km/Km 2 .¾ Local communities object to the constructionof the IIRSA highway linking Pucallpa toCruzeiro do Sul between Brasil andPerú.¸ Construction of the highway that will cut throughTIPNIS in Bolivia, under contract to the Braziliancompany OAS, was paralyzed in 2010 dueto social movements demanding prior consultation.– Amazonia under Pressure 17 <strong>RAISG</strong>
Amazonia as a wholeThe total extent of the roads identified in Amazonia was 96,544 km, including paved roads(31,632 km, 32.8% of the total), unpaved roads (62,271 km, 64.5%), and planned roads (2,635 km,2.7%) (TRD1 and GRD1). The overall density was 12.4 km/km2 including paved roads (4.1 km/km2),unpaved roads (8.0 km/km2) and planned roads (0.3 km/km2) (TRD2). The highest concentration ofroads was detected on the borders of Amazonia, especially in Guyana, in the southeast and south ofBrazilian Amazonia, and in Ecuador (MRD2).MRD2. Roads in Amazonia, by typeBRD1. Roads in the Amazon Integration and Development Axei ProjectsIn the 2011 Projects Portfolio of the Inter-American Infrastructure and Planning Council (COSIPLAN) there areseven groups of projects in the Amazon Integration and Development Axis, which include 64 infrastructural works,15 of which are roads, with a total investment estimated at US$ 3.355 billion.GroupProjectEstimated Investment(US$ million)total group in roadsRoad Corridor Tumaco-Pasto-Mocoa-Puerto Asís (CO) 3731. Access Putumayo WaterwayRehabilitation and paving of the section San Lorenzo-76El Carmen (EC)Subtotal Group 1 466 4492. Access Napo Waterway Subtotal Group 2 124 0Tarapoto-Yurimaguas Road and Yurimaguas Port (PE) 2243. Access Huallaga – MarañónWaterway4. Access Ucayali Waterway5. Access Solimões–AmazonasWaterwayConstruction and improvement of El Reposo-Sarameriza189Road (National Route 4C) (PE)Paita-Tarapoto Road (PE) 274Subtotal Group 3 1,062 687Tingo María-Pucallpa Road and Pucallpa Port (PE) 361Highway Lima-Ricardo Palma (PE) 242Rio Branco-Cruzeiro do Sul road connection (BR) 400IIRSA Central, section 2: Ricardo Palma-La Oroya- Detour100Cerro de Pasco / La Oroya-Huancayo (PE)IIRSA Central, section 3: Detour Cerro de Pasco-Tingo70María (PE)Subtotal Group 4 2,959 1,173Cuiabá-Santarém Road (BR) 700Environmental and territorial management program12(Route Cuiabá-Santarém) (BR)Subtotal Group 5 714 712TRD1. Road lengths in Amazonia, by type and countryCountryRoad length (km)% of length by typePaved Unpaved Projected Total Paved Unpaved Projected TotalBolivia 859 3,675 90 5,425 0.9 3.8 0.9 5.6Brasil 21,993 46,937 68,930 22.8 48.6 0.0 71.4Colombia 477 1,287 1,764 0.5 1.3 0.0 1.8Ecuador 3,017 1,343 4,360 3.1 1.4 0.0 4.5Guyane Française 839 845 0.9 0.0 0.0 0.9Guyana 4,259 4,259 0.0 4.4 0.0 4.4Perú 1,692 2,552 1,744 5,988 1.8 2.6 1.8 6.2Suriname 1,434 1,434 0.0 1.5 0.0 1.5Venezuela 2.756 783 3,539 2.9 0.8 0.0 3.7Total 31,632 62,271 2,635 96,544 32.8 64.5 2.7 100.0TRD2. Road density in Amazonia. by type and countryCountryAmazon area by countryRoad density (km/km 2 )(km 2 )Paved Unpaved Projected TotalEcuador 116,284 25.9 11.5 0.0 37.5Guyana 214,969 0.0 20.1 0.0 20.1Brasil 5,006.316 4.4 9.4 0.0 13.8Bolivia 479,264 1.8 7.7 1.9 11.3Guyane Française 86,504 9.7 0.1 0.0 9.8Suriname 163,820 0.0 8.8 0.0 8.8Venezuela 453,915 6.1 1.7 0.0 7.8Perú 782,820 2.2 3.3 2.2 7.6Colombia 483,164 1.0 2.7 0.0 3.7Total 7,787.056 4.1 8.0 0.3 12.4The extent of ‘paved’ and ‘unpaved’ roads varies between countries. For example, while inGuyane Française all the roads are paved, in Colombia, Brasil and Bolivia, more than 70% of the roadsare unpaved (see GRD2). In the cases of Guyana and Suriname there is no cartographic informationallowing ‘paved’ roads to be distinguished from ‘unpaved’ roads. An estimated 96% of roads are pavedin Suriname. In Bolivia and Perú the construction of new roads is planned for the short and mediumterm. Within the framework of the IIRSA, as well as Bolivia and Perú, the construction of new roads isalso planned in Brasil, Ecuador, Colombia and Venezuela.The highest road densities were detected in Ecuador (37.5 km/km 2 ) and Guyana (20.1 km/km 2 ),countries that account for 1.5% and 2.8% of the surface area of Amazonia respectively. These are followedby Brasil, Bolivia and Guyane Française with densities of 13.8, 11.3 and 9.8 km/km 2 , respectively.The remaining countries show values lower than 9 km/km 2 with a low density especially notable in Colombia(3.6 km/km 2 ). (TRD2 and MRD3)By BasinThe macro-basins with the most roads are Tocantins, Madeira, Middle-Lower Amazonas andUpper Amazonas, with more than 13,000 km of roads in each, as well as the basins of the WesternNortheast Atlantic and Paraná, with more than 8,000 km of roads (MRD4 and TRD3). These six macrobasinsconcentrate 88.4% of the roads in Amazonia, most of them unpaved. In terms of density, themost affected basins are Paraná, Western Northeast Atlantic, Middle Amazonas and Paraíba, all ofwhich have densities ≥ 24,5 km/km 2 .The sub-basins with the highest densities of roads are located in the south and southeast ofBrazilian Amazonia (density rates between 38.4 and 67.3 km/km 2 ), including a sub-basin shared byPerú and Ecuador (Santiago, 41.7 km/km 2 ) (see MRD5 and TRD4). The densities of paved and unpavedroads vary between these sub-basins. In the case of unpaved roads, the density ranges from 17 km/km 2 (Western Northeast Atlantic S) to 59.8 km/km 2 (Paraná B), while in the case of paved roads thedensities recorded vary from zero (Paraná B) to 37 km/km 2 (Western Northeast Atlantic N). It shouldbe emphasized that although Brasil is not the country with the highest road density, it does contain thesub-basins with the highest road density figures.Amazonia in each country71.4% of the total length of roads existing in Amazonia are located in Brasil, most of these being‘unpaved’ roads. Next comes Perú with 6.2% of the region’s total, Bolivia with 5.6%, Ecuador with 4.5%and Guyana with 4.4 % (TRD1).MRD3. Road density by country in Amazonia6. Amazon Waterways Network Subtotal Group 6 316 0Improvement of the route Guayaquil-El Triumph-La140Troncal-Zhud-El Tambo-Cañar-Azogues-Paute-Amaluza-Méndez and improvement and extension of the Méndez-Puerto Morona section (EC)Improvement of the route Puerto Bolívar-Santa1687. Access Morona-Marañón-AmazonasWaterwayRosa-Balsas-Chaguarpamba-Loja Zamora-Yantzaza-ElPangui-Gualaquiza-Gral.Leónidas Plaza-Méndez (EC)Improvement of the route Puerto Bolívar-Pasaje-Santa27Isabel-Girón-Cuenca-Paute-Amaluza-Méndez-PuertoMorona (EC)Subtotal Group 7 458 335Total Investment estimated (US$ million) 6,100 3,355Source: Cosiplan, 2011TRD3. Road length and density in the Amazonian macro-basins, by typeRoad length (km)Total densityMacro-basin Area km² Projected Unpaved Paved Total (km/km 2 )Tocantins 576,164 11,661 6,165 17,825 30.9Madeira 1,124.271 1,529 10,980 3,011 15,520 13.8Middle-Lower Amazonas 1,600.287 12,298 1,791 14,090 8.8Upper Amazonas 2,035.912 1,105 6,771 5,573 13,449 6.6Western Northeast Atlantic 223,385 3,353 4,973 8,327 3.3Paraná 175,114 5,537 2,537 8,074 46.1Guyanas/Amapá 559,969 5,928 1,634 7,562 13.5Negro 715,171 3,009 1,419 4,428 6.2Mouth of the Amazonas/233,626 1,326 1,765 3,091 13.2EstuaryOrinoco 520,740 729 2,100 2,829 5.4Parnaíba 46,813 573 574 1,147 24.5Middle Amazonas 6,217 91 89 180 28.9MRD4. Road density by Amazonian macro-basinGRD2. Road distribution in Amazonia, by type and countryGRD1. Road distribution in Amazonia, by type<strong>RAISG</strong> 18Amazonia under Pressure – RoadsRoads– Amazonia under Pressure 19 <strong>RAISG</strong>
MRD5. Road density by Amazonian sub-basinTRD4. The ten Amazonian sub-basins with the highest road densitySub-basinArea(km²)Road length (km)Road density(km/km²)Unpaved Paved Total Unpaved Paved TotalWestern Northeast Atlantic N(Brasil)19,883 603 736 339 30.3 37.0 67.3Paranã B (Brasil) 1,791 107 107 59.8 0.0 59.8Araguaia (Brasil) 23,587 805 337 142 34.1 14.3 48.4Middle Juruena (Brasil) 5,314 223 223 42,0 0.0 42.0Santiago (Ecuador, Perú) 7,207 345 790 134 12.7 29.0 41.7Western Northeast Atlantic S(Brasil)30,922 2,231 3,164 395 17.0 24.2 41.2Middle-Lower Tocantins 1(Brasil)57,564 1,099 1,260 359 19.1 21.9 41.0Palma (Brasil) 16,580 338 338 676 20.4 20.4 40.7Middle-Lower Tocantins 2(Brasil)71,291 1,693 1,174 868 23.8 16.5 40.2Ji-Paraná (Brasil) 75,042 2,237 643 880 29.8 8.6 38.4TRD7. The ten PNAs (with areas over 100 km²) with the highest road density in AmazoniaCountry Sphere Type of use Categorya NameArea(km 2 )Road density(km/km 2 )Brasil departmental indirect Natural Monument Árvores Fossilizadas do Tocantins 326 117.8Brasil departmental indirect State Park Morro dos Seis Lagos 375 109.4Brasil departmental direct Environmental Protection Area Igarapé São Francisco 297 81.9Brasil departmental direct Environmental Protection Area Curiaú 226 79.1Brasil departmental indirect State Park Águas do Cuiabá 106 73.3Brasil departmental direct Environmental Protection Area Lago de Palmas 601 61.2Brasil national direct Extractive Reserve Quilombo Frechal 176 60.5Bolivia departmental direct Watershed Protection Area Cumbre de Apacheta 155 60.0Brasil national direct Environmental Protection Area Igarapé Gelado 203 42.8Brasil national direct Extractive Reserve Mata Grande 133 42.2TRD8. Length and density of road types in Amazonian ITs, by territory typeRoad length (km) Road density (km/km 2 )TRD6). The highest densities are found in direct/indirect use national PNAs (19.5 km/km 2 ), followedby direct use departmental PNAs (7.2 km/km 2 ) and by the direct use national PNAs (3.0 km/km 2 ). ThePNAs of other administrative levels and types of use have densities ≤ 2.3 km/km 2 (TRD6 and MRD6).The PNAs with the highest road densities are located in Brasil (density figures between 42.2 and117.8 km/km 2 ), seven of them in direct or indirect departmental PNAs and three in direct use nationalPNAs (TRD7 and MRD6).By Indigenous TerritoriesThe total length of the roads identified in Indigenous Territories (ITs) was 9,530 km, distributedbetween paved roads (2,391 km, 25.1% of the total), unpaved roads (6,424 km, 67.4%) and plannedroads (715 km, 7.5%). The greatest lengths are found in officially recognized ITs (5,471 km, 57.4% ofthe total), followed by the areas of traditional occupation without official recognition (3,968 km, 41.6%)and by the territorial reserves or intangible zones (91 km, 1%) (TRD8 and MRD7).MRD7. Road density by IT in AmazoniaGRD3. Road distribution in PNA in Amazonia, by administrative sphere and type of useType of ITTotal area(km²)ProjectedUnpavedPavedTotalProjectedUnpavedPavedTotalIT officially recognized 1,603.652 500 4,472 499 5,471 0.3 2.8 0.3 3.4IT not officially recognized 491,673 124 1,952 1,892 3,968 0.3 4 3.8 8.1Territorial Reservation or Intangible29,336 91 - - 91 3.1 0 0 3.1zonesTotal 2,124.661 715 6,424 2,391 9,530 0.3 3.0 1.1 4.5By Protected AreasBRD2. IIRSA road between Pucallpa and Cruzeiro do Sul: a project in questionThe total length of roads identified inside Protected Natural Areas (PNAs) was 7,202 km, distributedbetween paved roads (2,160 km, 30% of the total), unpaved (4,416 km, 61.3%) and planned(626 km, 8.7%). The largest lengths are found in direct use departmental PNAs (3,583 km, 49.7% of thetotal), followed by indirect use national PNAs (1,754 km, 24%) and by direct use national PNAs (1,280km, 17.7%). The PNAs of other administrative levels and types of use have road lengths ≤ 292 km(TRD5 and GRD3).The total density of roads identified inside PNAs was 3.3 km/km 2 , distributed between pavedroads (1.0 km/km 2 ), unpaved roads (2.0 km/km 2 ) and planned roads (0.3 km/km 2 ). This figure is lowerthan all the national figures [min-max: 3.7 km/km 2 (Colombia) – 37.5 km/km 2 (Ecuador)] (TRD2 andMRD6. Road density by PNA in AmazoniaTRD5. Length of road types in PNA in Amazonia, by administrative sphere and type of useAdministrative sphereAreaRoad Length (km)Road Densityand type of use(km²) Projected Unpaved Paved Total (km/km 2 )Direct use departmental 497,202 10 2,175 1,399 3,583 7.2Indirect use departmental 129,730 258 34 292 2.3Direct use national 426,566 178 817 285 1,280 3.0Direct/Indirect use national 4,165 76 5 81 19.5Indirect use national 774,180 396 951 406 1,754 2.3Transitory use national 327,326 42 139 30 211 0.6General total 2,159.169 626 4,416 2,160 7,202 3.3The Pucallpa–Cruzeiro do Sul road project, connecting the port of Callao on the Pacific Ocean of Peru with Cruzeiro doSul, Brazil, passing through Pucallpa, is part of the Initiative for the Integration of Regional Infrastructure in South America(IIRSA). IIRSA has a portfolio of more than 350 projects for road, energy and communications infrastructures, organizedalong geographical axes. This road project, which would establish IIRSA’s Central Axis in Peru, is the least advanced of thethree axes impacting this country (North, Center and South).This integration has been an objective pursued by national and regional authorities since 2006 when the presidents ofPeru and Brazil agreed to work towards completing the northern and central bi-national projects to connect their countries.At the end of 2009, Presidents Alán García and Lula da Silva signed 16 bilateral cooperation agreements, includinga commitment to conclude the Central Axis. According to those promoting this project, the road will be the solution to theproblems of isolation and lack of economic development Identified in this central cross-border region.Although the IIRSA plan for construction of the road appears to be underway, a number of conflicting views existconcerning the type of interconnection that should be made between Pucallpa and Cruzeiro do Sul. On the Peruvian side,the Executive apparently decided in favor of the road, since the Ministry of Transport and Communications (MTC) andthe Special Infrastructure Project for National Transport – PROVÍAS NACIONAL have carried out a pre-viability study thatindicates the route of the future road. However during the previous government administration, Congress declared in thenational interest the construction of the ‘Brazil-Peru’ Atlantic-Pacific Transcontinental Railway along the same route. Theregional government of Ucayali also supports the railway option because of its lower impact on the environment. On theBrazilian side, the scant news available on the subject suggests that the interconnection option favored is also the railway.According to the Brazilian Ambassador to Peru, Carlos Alfredo Lazary Teixeira, “aconsensus exists among the authorities in Brazil that the connection between thecities of Pucallpa in Peru and Cruzeiro do Sul should be via railway rather than roadin order to safeguard and care for the environment.”On the Peruvian side several studies indicate that the route proposed by the PeruvianMTC could have very negative impacts for the Sierra del Divisor PNA and forthe Reserve established to protect the Isconahua indigenous people living in isolation,both on the Peruvian side. On the Brazilian side, it would directly affect the Serra doDivisor National Park and the indigenous territories bordering on the park.The Regional Group for Monitoring Mega-Protects in the Ucayali Region, createdin July 2008 by representatives of indigenous communities, the regional governmentand civil society, expressed considerable concern over the lack of officialtransparency in the handling of information and decisions relating to the Pucallpa-Cruzeiro do Sul interconnection, as well as the absence of dialogue with the localactors involved.According to the public declaration made by the Regional Group, they questionedthe convocation for the pre-viability study since it was made “without elaboratinga development strategy for the frontier between Ucayali and Acre, nor indeed along-term environmental strategy, that clearly includes the procedures of prior andinformed consultation before, during and after the project.” (Pedro Tipula/IBC)TRD6. Density of road types in PNA in Amazonia, by administrative sphere and type of useAdministrative sphereAreaRoad Density (km/km²)and type of use(km²) Projected Unpaved Paved TotalRoad Length(km)Direct/Indirect use national 4,165 18.3 1.2 19.5 81Direct use departmental 497,202 4.4 2.8 7.2 3,583Direct use national 426,566 0.4 1.9 0.7 3.0 1,280Indirect use national 774,180 0.5 1.2 0.5 2.3 1,754Indirect use departmental 129,730 2.0 0.3 2.3 292Transitory use national 327,326 0.1 0.4 0.1 0.6 211General total 2,159.169 0.3 2.0 1.0 3.3 7,202<strong>RAISG</strong> 20Amazonia under Pressure – RoadsRoads– Amazonia under Pressure 21 <strong>RAISG</strong>
The total density of roads identified inside ITs was 4.5 km/km 2 , including paved roads (1.1 km/km 2 ), unpaved roads (3.0 km/km 2 ) and planned roads (0.3 km/km 2 ). The highest densities were foundin areas of traditional occupation without official recognition (8.1 km/km 2 ), followed by officially recognizedITs (3.4 km/km 2 ) and territorial reserves or intangible zones (3.1 km/km 2 ) (TRD8).At national level the two countries with the highest road densities in ITs are Guyana and Ecuador(30.5 and 25.5 km/km 2 , respectively), followed by Bolivia (12.6 km/km 2 in ITs without official recognitionand 4.2 km/km 2 in officially recognized ITs). The remaining countries show figures lower than 10 km/km 2 (TRD9 and GRD4). With the exception of the density rate in officially recognized ITs in Bolivia, theprevious figures exceed the regional density (12.4 km/km 2 ).The density of paved roads within ITs is high in Ecuador (14.4 km/km 2 ), while the density of unpavedroads is significant in officially recognized ITs in Guyana (30.5 km/km 2 ). The density of plannedroads is high in Perú, affecting especially officially recognized ITs (2.9 km/km 2 ) and territorial reserves(3.1 km/km 2 ) (TRD9).The ITs with the highest road densities are in Guyana (Kaburí IT and Shulinab IT with densitiesof 209.9 and 165.2 km/km 2 , respectively), Perú (TI Urakuza and TI Wawik with densities of 153.9 and146.9, respectively), Brasil (Tabalascada IT, with a density of 155.9 km/km 2 ), Ecuador (San Francisco IT,with a density of 116.8 km/km 2 ) and Bolivia (Yaminahua Machineri IT, with a density of 114.6 km/km 2 )(TRD10).ConclusionThe presence of roads in Amazonia encourages and accelerates deforestation. Their constructionis associated with predatory forms of forest resource extraction (such as illegal logging), the substitutionof forest landscapes with agrarian landscapes, and the large-scale infrastructure and urbanizationprojects. Roads are clearly associated with regions with higher levels of deforestation, as inthe notorious case of the so-called ‘arc of deforestation’ in the Brazilian Amazonia, where the Belém-Brasília (BR-153), Cuiabá-Santarém, (BR-163) and Cuiabá-Porto Velho (BR-364) highways are located.Another example is the transoceanic highway between Puerto Maldonado (Perú) – Cobija (Bolivia)– Rio Branco (Brasil), inaugurated in 2011, which aims to improve trade between the three countriesand facilitate the exportation of Brazilian products to China and Peruvian products to Africa andEurope. This highway could quickly double the number of inhabitants of Puerto Maldonado, today numberingmore than 200,000 people. At the same time the region is experiencing an exponential growth inillegal roads associated with forest degradation, especially through illegal logging.Although Brasil has the largest road network, road density occupies third place in the regionafter Ecuador and Guyana. The largely peripheral distribution of the roads affects the headwaters ofAmazonia’s macro-basins, especially those of the Upper and Middle Amazon. In some cases the socioenvironmentalimpacts associated with road construction are only mentioned or remain subordinate tothe political decision to build them (for example, the construction of the section 2 of the road linkingVilla Tunari to San Ignacio in Bolivia). Another example that stands out is the Porto Velho-Manaus-BoaVista-Caracas route, which crosses the central part of Amazonia and which is considered a key routeconnecting the region’s north and south.Generally speaking the PNAs and ITs have road densities between three and four times lowerthan the regional density. This shows their potential as conservation strategies that work to slow downthe intervention processes. Nonetheless, the direct/indirect use national PNAs (Bolivia and Guyana)and the direct use departmental PNAs (Bolivia and Brasil) do not seem to perform this role. Most of theofficially recognized ITs show a lower level of impact. More detailed analyses are needed in Guyana,Ecuador and Bolivia to understand the causes of the observed patterns.A full assessment of circulation and transportation in Amazonia requires the inclusion of waterways(associated with farm production) and railways (associated with mining). Monitoring the constructionof roads planned under the IIRSA agreements– which may modify the territorial dimension ofthe development and especially the conservation of Amazonia – needs to be prioritized in the region’senvironmental agendas.TRD9. Density of road types in IT in Amazonia. by country and territory typeCountry% of ITs bycountryType of ITPavedRoad density (km/km 2 )Bolivia9.6 IT not officially recognized 0.8 9.4 2.4 12.616.8 IT officially recognized 0.0 2.5 1.7 4.2Brasil* 22.2 IT officially recognized 0.4 2.8 0.0 3.2Colombia* 53.4 IT officially recognized 0.0 0.1 0.0 0.1Ecuador* 57.4 IT not officially recognized 14.4 11.2 0.0 25.5Guyana* 14.7 IT officially recognized 0.0 30.5 0.0 30.5Guyane Française* 8.2 IT officially recognized 2.3 0.0 0.0 2.31.7 IT not officially recognized 0.0 0.7 1.0 1.6Perú3.6 Territorial Reservation or Intangible Zones 0.0 0.0 3.1 3.113.6 IT officially recognized 0.2 1.9 2.9 5.0Suriname* 30.3 IT not officially recognized 0.0 5.5 0.0 5.5Venezuela* 67.4 IT not officially recognized 3.2 1.5 0.0 4.7* There is only one type of IT in these countries.TES10. The two ITs (with an area over 100 km²) with highest road density in each country in AmazoniaCountry Name Type of ITArea(km²)UnpavedRoad length(km)ProjectedTotalRoaddensity(km/km 2 )BoliviaYaminahua Machineri IT not officially recognized 308 35 114.6Canichana IT not officially recognized 251 16 62.2BrasilTabalascada IT officially recognized 130 25 155.9Barata/Livramento IT officially recognized 123 12 94.6ColombiaRíos Atabapo e Inírida (Cacahual) IT officially recognized 5,239 111 1.4Predio Putumayo IT officially recognized 58,964 3 0.1EcuadorSan Francisco IT not officially recognized 100 12 116.8Juan Pío Montufar IT not officially recognized 167 32 93.9Guyane Française Galibi (Costa) IT officially recognized 179 15 85.6GuyanaKaburi IT officially recognized 108 23 209.9Shulinab (Macusi) IT officially recognized 384 63 165.2PerúUrakuza IT officially recognized 189 29 153.9Wawik (Nuevo Belén) IT officially recognized 107 16 146.9SurinameMoiwana IT not officially recognized 432 29 67.9Santigron IT not officially recognized 1,441 90 62.1Venezuela Etnia Hiwi IT not officially recognized 2,901 168 57.9Venezuela Etnia Kari'ña IT not officially recognized 5,122 172 33.6BRD3. Development versus conservation: the TIPNIS case in BoliviaThe Isiboro Sécure National Park and Indigenous Territory (TIPNIS) is one of the 22 PNAs of Bolivia and coversaround 1.3 million hectares (~1.2% of Bolivia’s surface). TIPNIS is bounded by the Isiboro River to the south and theSécure River to the north – which lend their name to the area – in the departments of Cochabamba and Beni. It wascreated in 1990 with the aim of conserving the seasonally flooded Amazonian rainforest and the culture and customsof the indigenous peoples living in the region (more than 12,000 inhabitants including the Mojeño, Yaracaré and Chimane).It is estimated that around 86% of its surface is still in a good state of conservation and that its core area (a fullyprotected zone) is without human disturbance.This scenario contrasts with the reality that has developed to the south of the TIPNIS where expanding colonizationand farms dedicated primarily to growing coca threaten the conservation of the area’s socio-environmental diversity. Asa result of political pressure by the colonists and coca growers, part of TIPNIS was annulled as indigenous territory andis now occupied by rural colonists engaged in coca cultivation. This area is known as ‘Polygon 7’ and covers a surfacearea of about 100,000 ha between the communities of Villa Tunari and Isinuta where around 20,000 families live.The proposed construction of a paved road (306 km in length and 9.2 m in width) passing through the TIPNIS toconnect the inhabitants of Villa Tunari (Department of Cochabamba) with those of San Ignacio (Department of Beni)has alarmed conservationists and environmental institutions in Bolivia, leading to debates on the advantages anddisadvantages of its construction. It also stirred up widespread interest in the Bolivian society as a whole (especiallyyoung people) to learn more about the value of protected areas and indigenous territories existing in Bolivia, polarizingthe population between the different viewpoints regarding how Bolivians understand conservation and development.In this case, the major conflict centers on section II of the road, linking the populations of Isinuta with those ofMontegrande da Fe, the latter located in TIPNIS’ fully protected zone. Construction of the road is not a recent initiative:the first plans emerged in 2006 before being conceded to the Brazilian company OAS in 2008. In 2010, after a marchorganized by CIDOB (Confederation of Indigenous Peoples of Eastern Bolivia) the work was stopped in order to carryout prior consultation, a right of indigenous peoples recognized in the Bolivian Constitution (Article 30), and establishedin the ILO Convention 169 (Article 6). The consultation process was scheduled for the second half of 2012 and theresults to be made public at the beginning of 2013. Resolution of the TIPNIS conflict will undoubtedly set a precedent interms of Bolivian society’s perception of what indigenous territories and protected areas should be. (Daniel Larrea/FAN)Isiboro-Secure Indigenous Land and National Park (TIPNIS), Cochabamba Department, Bolivia.© Fernando Soría, 2006GRD4. Road distribution in ITs in Amazonia, by country and territory typeIndigenous people from Bolivian Amazonia on the eighth march to La Paz to protest against the construction of ahighway crossing the Isiboro-Secure Indigenous Land and National Park (TIPNIS). © Fernando Soría, 2011<strong>RAISG</strong> 22Amazonia under Pressure – RoadsRoadsIndigenous march in protest against the highway in the TIPNIS Park reaches La Paz. © Szymon Kochanski, 2011– Amazonia under Pressure 23 <strong>RAISG</strong>
MOG1Oil and Gasin AmazoniaOIL and GASThe growing demand for oil and gas at the global level and the high price of oil have stimulatedprospecting and drilling activities in Amazonia at unprecedented levels (Finer et al.,2008). The Amazonian countries view oil and gas as strategic resources and claim ownership at theconstitutional level. Governments allocate these resources via policies that typically fail to include preventionand mitigation of socio-environmental impacts generated by the extraction of these resourcesnor the investments needed to compensate for them. Among the main impacts related to these extractiveactivities are: alterations in the quality of water and air, soil contamination, habitat destruction,change in soil cover, erosion, changes in the behavior and distribution of species and the introductionof disease vectors (Correa-Viana & Esclasans, 2011).As part of the socio-environmental diversity of Amazonia, the eco-systemic services and thetraditional and scientific bodies of knowledge are also considered strategic resources, especially withinthe framework of climate change. The global economic context poses a dilemma for both the developingand emerging countries: on one hand, the need to eradicate poverty and hunger, and on the otherthe need to conserve Amazonia as a grand ecosystem that contributes to the welfare of its inhabitantsand of the planet. Responding to this challenge presumes the need to maintain socio-environmentaldiversity as a vital part of the development of oil and gas reserves, as well as a search for alternativeenergy sources compatible with the region’s unique features.Neither the industrialized countries nor the developing countries have managed to reach a consensuson progressively and decisively reducing their high dependence on fossil fuels. Countries likePerú, Colombia and Ecuador have sizeable oil reserves in Amazonia from which they expect to obtainthe financing for and the push forward to satisfy their national needs and development projects. As aresult, oil exploration and production in Amazonia has multiplied over the last decade and will continueto grow over the foreseeable future.ContextThe environmental policies and regulations regarding the exploration and extraction of hydrocarbons,as well as those for other extractive industries, are in the process of being consolidated in thedifferent countries of the region. Generally speaking there is a lack of planning instruments that considerand include the conservation and sustainable use of natural resources in the plans, programs andpolicies of this sector. This situation fails to meet the obligations established in Convention 169 of theILO (1991) – ratified by all the Amazonian countries except Guyana, Guyane Française and Suriname– and the Convention on Biological Diversity (CBD), ratified by all the countries. The protection of thesocio-environmental heritage of Amazonia is an urgent issue for the region’s governments. The oppositionof indigenous and environmental movements to hydrocarbon activities is increasingly more common.At the same time, judicial entities at the national and international levels are showing a tendancyto recognize the collective rights of indigenous peoples and the protection of nature.Prospecting and drilling for oil and gas take place within a political and regulatory frameworkwhich consistently fails to recognize or incorporate any real limits or safeguards to protect socio-environmentaldiversity. Sometimes oil and gas companies can operate virtually without any governmentcontrol over these aspects, causing negative impacts and pressures that are exacerbated in particularlyfragile ecosystems such as those of Amazonia (see BOG1: The main oil companies with interestsin Amazonia). The environmental contamination, generated by the inevitable leakage and dumping ofoil and toxic refuse, causes long-term harm to the health of local inhabitants and to the natural habitat.The construction of roads, oil/gas pipelines and other associated infrastructure exacerbates forestdegradation and clearance, along with the advance of colonization, which in turn leads to outbreaksof disease, the weakening of social relationships and forms of control in indigenous communities, andother negative impacts.Oil well in the region of the Yasuní National Park, Napo river, Ecuador. © Pablo Baños/Avina, 2010 Currently 81 oil/gas blocks are under production, but thereare another 246 blocks oil/gas blocks open for bidding,under tender or under exploration The 327 oil/gas blocks that could potentially be brought underproduction occupy 1.08 million km2 or 15% of Amazonia 24 companies work in oil exploration in Amazonia, though justnine of them dominate 78% of the blocks under production Perú has the largest surface area dedicated to oil production,84% of its area of Amazonia, while Colombia hasdemarcated the largest number of blocks (102) In six Amazonian countries the oil blocksoverlap with PNAs and ITsĸ¾Cartographic sources for the theme Oil and Gas: • BOLIVIA: FAN, 2009 • BRASIL: <strong>Instituto</strong> Brasileiro de Geografia e Estatística - IBGE, Malha Municipal 1:1.000.000, 2005 • COLOMBIA: Fundación Puerto Rastrojo (Atlas de la Amazonía Colombiana), 2001;IGAC, 2010 • ECUADOR: Ministerio de Transporte y Obras Públicas, 2006 • PERÚ: Ministerio de Transporte y Comunicaciones - MTC, 2008 • SURINAME: Digital Chart of World, 1993 • VENEZUELA: <strong>Instituto</strong> Geográfico de Venezuela Simón Bolívar, 2003.Ocean and relieve: World Physical Map, U.S. National Park Service, in ArcGIS Online Services.<strong>RAISG</strong> 24Amazonia under Pressure – Oil and GasOilTerminal of Petrobras’s Urucu gas pipeline in Coari. Amazonas, Brasil. © Ricardo Stuckert, 2006Ä Since the 1990s, civil society organizationsin Ecuador have tried to impose a moratoriumon oil production in the Yasuní region,where indigenous peoples live in isolation.¾ The Acre and Madre de Diossedimentary basins are considerednew frontiers for oil and gasexploration in western Amazonia.¸ In Perú, 66.3% of indigenous landsare overlapped by oil/gas blocks.and Gas – Amazonia under Pressure 25 <strong>RAISG</strong>
BOG2. State, oil and indigenous lands in the Ecuadorian AmazoniaMethodologyThe georeferenced information on the concessionary blocks awarded for hydrocarbon activitieswas compiled from different secondary sources located in the different Amazonian countries. Theseblocks were classified into four types according to their current phase: Open for Bidding (concessionaryblocks offered by the government), Under Tender (concessionary blocks with a pending offerawaiting official approval), Under Exploration (concessionary blocks with a company actively prospecting)and Under Production (concessionary blocks producing oil or gas). TOG1 shows which of the sixcountries that offer concessionary hydrocarbon blocks recognize each of these phases.In order to display the results, block polygons were ignored when the area overlapping the unitsof analysis was less than 9 ha.Amazonia as a wholeThere are currently 327 hydrocarbon blocks in Amazonia. They cover a total area of 1,082,704km 2 (14% of Amazonia’s surface). These include those Open for Bidding (6.2%), those Under Tender(1.8%), those Under Exploration (5.6%) and those Under Production (0.5%). The 81 blocks now underproduction occupy 40,717 km 2 , while the blocks in the other three phases occupy a total area of1,041,988 km 2 (TOG2).80% (263) of the blocks are concentrated in the Andean Amazonia (MOG2). It should be emphasizedthat this region contains almost half of the indigenous peoples, including those still living inisolation, half of the water, the largest biodiversity per unit area and the most varied socio-environmentalservices in the entire Amazon region.MOG2. Oil/gas blocks in Amazonia, by activity phaseBOG1. The main oil companies with interests in AmazoniaAt least 71 oil companies are now operating in Amazonia. Among them are 20 public and private companies that,combined, are operating in 60% of the surface area delimited as oil concessions (approximately 648,000 km 2 ).There are 24 companies involved in oil production at the regional level. Nine of them operate in 78% (31,835 km 2 ) ofthe surface of the concessions in this phase. Those with the largest concessions are: Pluspetrol of Argentina with 8,826km 2 in Peru; the Ecuadorian Petroamazonas EP with 4,785 km 2 in Ecuador; the Anglo-French Perenco with 4,616 km 2 inEcuador; and Petroriental of China with 3,197 km 2 in Ecuador.There are 50 companies operating across Amazonia in the exploration phase. Ten of them cover 67% (288,548 km 2 )of the surface area of concessions in the exploration phase. The companies exploring the largest areas are: Petrobraswith 61,487 km 2 ; Talisman Energy of Canada with 30,491 km 2 ; OGX Petróleo e Gás Ltda of Brazil with 28,744 km 2 in thesame call in Brazil; and the US company Burlington with 27,197 km 2 in Peru.Companies with oil/gas blocks over 10,000 km 2#Total areaCompanyCountries(km 2 )1 Agencia Nacional de Hidrocarburos 87,624 Colombia Open for bidding2 Petrobras 72,131 Bolivia, Brasil,Colombia, PerúPhasesOpen for bidding, under exploration, underproduction3 Talisman 54,248 Colombia, Perú Open for bidding, under exploration4 YPFB Petroandina 53,837 Bolivia Open for bidding5 Upland Oil & Gas 37,080 Perú Under tender6 Pluspetrol 36,864 Colombia, Perú Open for bidding, under exploration, underproduction7 Petron Resources 29,441 Perú Under tender8 Burlington 29,197 Ecuador, Perú Under exploration, under production9 OGX Petróleo e Gás Ltda, 28,744 Brasil Under exploration10 Petra Energía S/A 26,719 Brasil Under exploration11 CEPSA 25,748 Perú Under exploration12 REPSOL-YPF 24,582 Bolivia, Ecuador, Perú Under exploration, under production13 Pacific Stratus Energy 24,112 Colombia, Perú Under exploration14 M&S Brasil S,A, 23,184 Brasil Under exploration15 BHP Billiton Petroleum 19,666 Colombia Open for bidding16 Hunt Oil 18,695 Perú Under exploration17 Petrolifera 16,640 Perú Under exploration18 Grantierra Energy 14,671 Colombia, Perú Under exploration, under production19 Ecopetrol S,A, 14,226 Colombia Open for bidding, under exploration, underproduction20 Petrominerales 10,926 Colombia, Perú Under explorationUntil the mid 20 th century light crude oil was extracted off the coast of Ecuador by Anglo, providing relatively few benefits for thecountry. During the dispute over the border between Ecuador and Peru (1941), oil surveying was begun in the south central part ofthe Ecuadorian Amazonia by Shell.Two decades later activities began in the northeastern sub-region (bordering with Colombia) where, in 1967, Texaco-Gulf beganextracting oil at the Lago Agrio 1 well and the state oil company CEPE (subsequently Petroecuador and today Petroamazonas EP)began activities in the Amazonas District, which included wells, fields, stations, oil pipelines, multi-purpose pipelines and roads, aswell as oil towns: Lago, Coca, Shushufindi and Sacha. This meant the forced relocation, ethnocide and acculturation of indigenouspeoples like the Tetete (now extinct) and other Tukano-speaking groups (Siona and Secoya), Barbacoano (Cofán) and Waorani.One can still see the Texaco legacy in this region including pools with waste and toxic water that flows into the rivers or undergroundwater system, degradation and deforestation, tied to cases of leukemia and other cancers. Consequently in 1994 a group of30,000 people affected by this toxic legacy decided to sue in a US court those responsible for these operations at the time, Texacoand today Chevron, which absorbed the former almost a decade ago.Although oil income has financed much of the national revenue since 1972 when exports began, Amazonian oil is not as importanta factor in the country’s energy security as it should be since Ecuador imports oil derivatives (naphta, liquefied gas and bunker) for adomestic market seriously distorted by subsidized prices (U$ 1.5/gal). In the face of this, in the mid 1990s civil and indigenous organizationsrequested a moratorium on the extraction of heavy crude oil in protected areas and intangible zones for indigenous peoplesliving in voluntary isolation, such as in the Yasuní.This was a forerunner of the initiative adopted by the government in 2008 to leave 900 million barrels of oil in the ground in exchangefor compensation from the international community equivalent to 50% of the estimated revenue from oil exports. It was also argued thatthis deal would enable the reduction of emissions in an effective form shared between exporting and consuming countries. Howeverthere has been no concrete response, not so much because of the novelty of the financing mechanism – run by the UNDP – but becauseof the lack of guarantees for the continuity of this ‘post-oil’ policy. From the beginning, President Correa warned that if the initiative isnot consolidated, ‘Plan B’ will be launched within a limited time-frame for the extraction of these proven reserves.Although the supposed start of this plan has been postponed since 2009, the beginning of a new oil round has also been announcedwith the intention of tendering 2 million hectares in the south central part of the Ecuadorian Amazonia where the surveys byShell and Petroecuador proved negative for commercial reserves. This puts increased pressure on a region of high importance dueto its large socio-environmental diversity (headwaters of the Pastaza, Tigre and Morona rivers), because the government and the oilcompanies anticipate extending the oil frontier south from its current center in the northeast, affecting indigenous territories (Achuar,Andoa, Sapara, Shiwiar and Kichwa de Pastaza) in a sub-region that contains few protected or natural heritage areas (PANE). Priorinformed consultation also lacks a consistent legal framework after a presidential decree annulled the specific regulations in 2008.Neither the pre-legislative nor popular consultation established by the Constitution seem viable options for maintaining the protectedareas free of hydrocarbon activities, especially now that the State is set to pay China (US$ 5 billion) with the anticipated sale of oil upuntil 2016. (Víctor López/EcoCiencia)expected reserves of 120 million barrels of oil, were put up for bidding (BOG2: State, oil and indigenousterritories in Equatorial Amazonia). In terms of surface area the largest threat is found in Perú and Colombiawhere the hydrocarbon blocks open for bidding plus those already under exploration occupy82.9% and 24.4% of these two countries’ Amazonian territories (TOG4).By basinThe Amazonian macro-basins containing the largest surface areas of hydrocarbon blocks (inany phase) are the Upper Amazonas (with 855,120 km 2 , equivalent to 42% of the basin’s total surfacearea), Orinoco (138,349 km 2 , 26%) and Madeira (131,522 km 2 , 11%) (MOG3). The ten sub-basins withthe largest surface areas of oil blocks are found in the Upper Amazonas macro-basin (TOG5 andMOG4).MOG3. Proportion of oil/gas blocks per macro-basin in AmazoniaGOG1. Distribution of surface area of oil/gas blocks in Amazonia, by activity phase and countrySource: <strong>RAISG</strong> Databasis (see Cartographic sources in MOG1).TOG1. Oil/gas activity phases in Amazonia, by countryCountry Open for bidding Under tender Under exploration Under productionBolivia X X XBrasil X XColombia X X XEcuadorXPerú X X X XVenezuela X XMOG4. Proportion of oil/gas blocks per sub-basin in AmazoniaTOG4. Surface area of oil/gas blocks in Amazonia, by activity phase and country (km 2 )Country Open for bidding Under tender Under exploration Under production Total Amazon area (km 2 )Perú 253,447 133,336 262,385 10,770 659,937 782,820Colombia 170,003 21,367 2,044 193,414 483,164Brasil 126,843 1,019 127,862 5,006,316Bolivia 53,837 17,879 1,500 73,215 479,264Ecuador 24,957 24,957 116,284Venezuela 2,892 427 3,319 453,915Total 477,286 136,228 428,473 40,717 1,082.704 7,321.763<strong>RAISG</strong> 26Amazonia in each countryThe Amazonian countries with the largest surface areas dedicated to hydrocarbon activities inall phases are: Perú (84%), Colombia (40%) and Ecuador (21%). Ecuador is the country with the largestarea of hydrocarbon blocks under production in Amazonia. Although only 3% of Brazilian Amazoniahas blocks, these occupy 127,862 km2, which represents the third largest surface area after Perú andColombia (TOG3). Colombia is the country that has demarcated the largest number of blocks (102),followed by Perú (92), Bolivia and Brasil (55 each) (GOG1). Venezuela, considered the oil producer parexcellence, has demarcated few blocks in the Amazonian portion of the country since its main reservesare located outside this region (PDVSA, 2012). In Brasil most of the blocks under production are foundoffshore. Similarly in Suriname, Guyana and Guyane Française the majority of concessionary blocksare also located in their territorial waters (Kriege & Chedi-Toelsie, 2006; Way, 2012).In Ecuador the information obtained refers exclusively to blocks under production, but the countryis known to have begun the XI Oil Round, in which 12 blocks in the southeast of the country, withAmazonia under Pressure – Oil and GasOilTOG2. Quantity and surface area of oil/gas blocks in Amazonia. by activity phasePhase Number of blocks Area (km 2 ) % of total blocks % of total AmazoniaOpen for bidding 85 477,286 44.1% 6.2%Under tender 20 136,228 12.6% 1.8%Under exploration 141 428,473 39.6% 5.6%Under production 81 40,717 3.8% 0.5%Total 327 1,082.704 100.0% 14.0%TOG3. Quantity and surface area of oil/gas blocks in Amazonia, by countryCountry Amazon area (km 2 ) Nº of blocksBlocks area % surface of blocks in relation to(km 2 )Amazonia by countryPerú 782,820 92 659,937 84%Colombia 483,164 102 193,414 40%Ecuador 116,284 14 24,957 21%Bolivia 479,264 55 73,215 15%Brasil 5,006.316 55 127,862 3%Venezuela 453,915 9 3,319 1%Guyana 214,969 0 - -Guyane Française 86,504 0 - -Suriname 163,820 0 - -Total 7,787.056 327 1,082.704 15%TOG5. The ten Amazonian sub-basins with the largest overlap of oil/gas blocks (km 2 )Sub-basinSub-basin Area coveredarea (km 2 ) by blocks (km 2 )% PhaseUcayali (middle) 22,046 21,946 100 Under exploration, under tender, open for biddingMarañón (middle) 4,284 4,264 100 Under exploration, under tender, open for biddingMarañón (lower) 2,223 2,213 100 Open for bidding, under explorationMarañón (middle-lower) 36,342 36,159 99 Open for bidding, under exploration, under productionAmazonas Alto (middle) 27,832 26,371 95 Open for bidding, under explorationPachitea 29,026 26,520 91 Under exploration, under tender, open for biddingUcayali (lower) 111,078 101,217 91 Open for bidding, under explorationAmazonas Alto (lower) 32,941 29,825 91 Under exploration, under tender, open for bidding, under productionMarañón 81,498 72,585 89 Under exploration, under tender, open for biddingTambo 32,405 27,892 86 Under exploration, under tender, open for biddingand Gas – Amazonia under Pressure 27 <strong>RAISG</strong>
MMN1Miningin AmazoniaminingSince the beginning of European conquest in Amazonia there has been a continuous searchfor ‘El Dorado,’ promoted by the stories of the enormous mineral wealth contained in theregion. For centuries prospecting and mining was concentrated in the extremely rich gold and silvermines of the Andean region. It was only in the 20th century with the discovery of large mineral deposits,like the Serra dos Carajás in Brazilian Amazonia (in 1967), that mining activities began to spread,today covering much of the region, whether in the form of industrial production plants or concessionaryblocks, as well as illegal mining.During this period the increase in the prices of precious minerals, the growing demand for otherstrategic minerals (aluminum, iron, titanium, vanadium and so on), and the need in the region’s countriesto generate income through the use of Amazonia’s natural resources, has made mining a majorsource for economic growth; more recently, national development policies have included mining asone of the fundamental sectors for generating jobs and fighting poverty.Those policies encouraged exploration and prospecting in Amazonia, which has revealed itsgreat mining potential. However this growth in the mining industry has largely ignored the socio-environmentalimpacts that it produces. As was pointed out in the previous chapter on hydrocarbons, theseparation and lack of coordination between different sector-based policies for extractive industriesenables the development of mining blocks inside protected areas and Indigenous Territories, as thischapter will show.ContextThe Amazonian republics continued the colonial legal and political tradition of attributing theownership of mineral resources to the State, irrespective of the type of land tenure (private, collective orpublic). The range of different types of land rights found in Amazonia does not restrict the possibility ofundertaking sub-surface mining activities. Hence each government reserves the right to grant concessionsto third parties for surveying, extraction and sale of these resources.In 2012 Colombia announced a moratorium on mining activities in the Amazonian region. Thesocio-environmental sector of Colombia’s civil society persuaded the government to use more cautionin responding to the huge volume of applications for mining concessions. The government suspended,for ten years, the approval of any mining concessions until an objective selection processes could beestablished to allocate the 201 mining blocks planned for the region. Meanwhile Brasil is promotingmining exploration on a large scale in Amazonia, while the National Congress is currently discussing aBill to permit mining surveys and extractive activities in Indigenous Territories.An important case that combines the generation of hydroelectricity with mining activities is now takingplace in Brazilian Amazonia, in the region of the Volta Grande (Big Bend) of the Xingu river, where permissionfrom the environmental sector is in the process of being granted for what will be the largest openpit gold mine in the country. The Canadian mining company Belo Sun plans to install its mining operationswithin 16 km of the Belo Monte hydroelectric plant, which will provide cheap energy for the mine beginningin 2015. The ambitious plans for expanding hydroelectric capacity along the rivers of Brazilian Amazonialikely driving the huge expansion in new mining projects in the region.Despite the legislation in force, illegal mining activities have increased across the region overthe last few decades, producing increasingly larger and more uncontrollable impacts, very often placingat risk the health of entire local communities. Contamination of water with heavy metals such asmercury has long-term health impacts on the communities exposed to these waterways, even whenthey are located at large distances downstream from the mines.Alunorte, the world’s largest aluminum refinery, inaugurated in 1995, consumes energy from theTucuruí Hydroelectric Plant (UHE). Barcarena, Pará, Brasil. © Paulo Santos, 2006 Areas covered with mining concessions cover a total of1.6 million km 2 , representing 21% of Amazonia’s surface Most of these areas (50.8%) are still under tender,followed by those under exploration (30.8%) Guiana is the country with the largest proportionof its Amazonian territory covered by mining concessions Areas covered with mining concessions already occupy15% of the PNAs and 19% of the ITs in Amazonia The sharp rise in the price of gold in recent yearshas stimulated illegal mining in Amazonia,generating considerable socio-environmental impactsThe world’s largest open-pit iron mine, owned by Vale, in Carajás. Pará, Brasil.© Pedro Martinelli, 1996Ä In the Madre de Dios region the rateof deforestation related to small-scalegold mining was 292 ha/yearbetween 2006 and 2009.¾ In Guyana the deforestation causedby gold mining tripled between2001-2002 and 2007-2008.¸ Mining poses a threat to indigenous territoriesin Brasil; 79% (407,300 km 2 ) of the total areacovered by mining concessions in ITs in Amazoniaare located in Brasil.<strong>RAISG</strong> 30 Amazonia under Pressure – Mining Mining – Amazonia under Pressure 31 <strong>RAISG</strong>ÄCartographic sources for the theme Mining: • BOLIVIA: FAN, 2009 • BRASIL: <strong>Instituto</strong> Brasileiro de Geografia e Estatística - IBGE, Malha Municipal 1:1.000.000, 2005 • COLOMBIA: Fundación Puerto Rastrojo (Atlas de la Amazonía Colombiana), 2001;IGAC, 2010 • ECUADOR: Ministerio de Transporte y Obras Públicas, 2006 • PERÚ: Ministerio de Transporte y Comunicaciones - MTC, 2008 • SURINAME: Digital Chart of World, 1993 • VENEZUELA: <strong>Instituto</strong> Geográfico de Venezuela Simón Bolívar, 2003.Ocean and relieve: World Physical Map, U.S. National Park Service, in ArcGIS Online Services.¾¸
The Beni river in Bolivia is one of the most critical cases of contamination of water, sedimentsand fish by mercury and other heavy metals, affecting both indigenous and riverside communities.These mining activities have been growing since the 1970s with a greater emphasis over the last 20years (Bourgoin, 2001). A similar case is the illegal gold mining in the Madre de Dios river basin in Perú.Here more than 150,000 ha of alluvial soils, well suited to agriculture, have been completely degradedby the largely illegal mining activities (Dourojeanni, 2009).In addition to the damage caused to entire ecosystems, illegal mining also generates other seriouscollateral effects in areas of indigenous peoples who are uncontacted or only recently contacted,as in the case of the Yanomami in the border region between Venezuela and Brasil (see BMN2: The newgold rush in Amazonia).MethodologyThe analysis of information regarding the concessionary blocks for mining established by thegovernment and the mining activities in Amazonia is based on official data compiled in each country.It has been systemized and classified into five categories according to the procedural phase that bothconcessionary blocks are currently in. These are: Open for Bidding (concessionary blocks offered bythe government), Under Tender (concessionary blocks with a pending offer awaiting official approval),Under Exploration (concessionary blocks with a company actively prospecting), Under Production (concessionaryblocks with on-going extractive activities) and No Information (concessionary blocks withoutcurrent information). In Perú and in some of Ecuador’s mining blocks it was impossible to differentiateblocks under exploration from those under production. In these cases the blocks were analyzed as both.The classification of concessionary blocks by phase in the different countries is shown in table TMN1.As information on illegal mining was not obtainable for all the countries, this data was not includedin the analyses.Due to differences in the information sources, geographic (topological) corrections had to bemade in order for the data to be analyzed and combined. Consequently differences may exist betweenthe results published here and the figures obtained in analyses conducted in the countries. To avoid duplicatingareas and over-estimation of surface areas, the analysis excluded overlapping areas betweenmining blocks that are in the same phase. After excluding these overlaps, only areas over five hectaresin size were selected in all the analyses.The data was analyzed by the following units: Amazonia, countries, macro-basins and subbasins,PNAs and ITs.Amazonia as a wholeFor 2010 there are a total of 52,974 blocks in Amazonia with mining interests covering a totalarea of 1,628,850 km 2 , which corresponds to 21% of the entire region (TMN2). The majority of miningblocks are under tender (50.8%), followed by those under exploration (30.8%) (MMN2 and GMN1).BMN1. The main companies and the largestmining venturesAmong the main mining ventures in Amazonia wecan identify the following: the Madre de Dios mining regionin Peru on the border with Bolivia; the southeast ofEcuador in the provinces of Morona Santiago and ZamoraChinchipe where the Fruta do Norte and Mirador projectsare being carried out; the bauxite mining region operatedby Bosai in Guyana; the Carajás project extracting pig ironin a concession run by Vale; the Pitinga mine, where theTaboca mining company extracts mainly tin; and the Jurutiproject, a concession run by Alcoa for mining bauxite.These last three ventures are located in Brazil.TMN1. Categories of mining blocks in the countries of AmazoniaCountry* No informationOpen forbiddingUnder tenderBolivia X X X XBrasil X X X XColombia X XEcuador X X XGuyana X X XPerú X X XSuriname X X XVenezuela X X* There is no data for Guyane Française.TMN2. Quantity and surface area of mining blocks in Amazonia. by categoryCategory # Mining blocks # by phase (%) Area (km²) % Area by phase Amazon areaOpen for bidding 2,529 4.8 164,999 10.1 2.1Under tender 30,411 57.4 827,142 50.8 10.7Under exploration 9,828 18.6 502,085 30.8 6.5Under exploration/production 4,711 8.9 25,383 1.6 0.3Under production 5,482 10.3 109,202 6.7 1.4No information 13 0.0 40 0.0 0.0Total 52,974 100.0 1,628.850 100.0 21.0* The Amazonia has 20.3% of its area covered by mining blocks when it eliminates overlapping areas between blocks in differentphases of activity.GMN1. Distribution of mining blocks in Amazonia, by activity phaseUnderexplorationUnder exploration/productionUnderproductionGMN2. Distribution of mining blocks in Amazonia, by activity phase and countryTMN4. Surface area of mining blocks in macro-basins in Amazonia, by categoryMacro-basinUnderexplorationUnder exploration/productionGMN3. Distribution of mining blocks in Amazonia, by macro-basinSurface area of mining blocks (km²)UnderproductionOpen forbiddingNoinformationUndertenderMiddle-Lower Amazonas 169,141 5,166 57,969 387,618 619,894Guyanas/Amapá 82,002 5,157 72,293 29,762 22,311 212,524Tocantins 91,804 3,594 39,113 56,098 190,609Madeira 55,161 6,591 5,792 16,507 33 100,248 184,332Negro 8,420 1,579 8,379 150,462 168,839Western NortheastAtlantic31,903 3,548 5,179 29,979 70,609Mouth of the Amazonas/Estuary26,928 4,401 4,087 19,507 54,924Paraná 30,164 912 2,531 15,424 49,031Upper Amazonas 3,964 13,635 390 1,419 8 25,842 45,257Orinoco 631 10,433 15,558 26,622Parnaíba 485 38 39 3,520 4,082Middle Amazonas 1,471 56 13 572 2,111General total 502,084 25,382 109,201 164,999 40 827,138 1,628.844TotalThe total surface area covered by mining blocks under tender represents 10.7% of Amazonia(827,142 km 2 ), while the areas now under exploration cover 6.5% (502,085 km 2 ).Amazonia in each countryTable TMN3 shows the quantity and surface area of concessionary blocks for mining per country.Guyana is the country with the highest percentage of its Amazonia region covered by mining blocksin all categories (67.5%), followed by Brasil with 27% and Suriname with 18.6%. The country with thelowest proportion of its Amazonia covered by mining blocks in Amazonia is Bolivia at 0.8%. In terms ofthe number of concessionary blocks, 80.5% of the total number of blocks are located in Brasil and 11%in Perú. The surface covered by the different categories of mining blocks in each country is shown inmap MMN3. Although large-scale mining has not begun in Ecuador, in the medium term this will be themain threat following hydrocarbon activities.MMN3. Proportion of mining blocks per country in AmazoniaMMN2. Mining activity phases in Amazonia, by countryAccording to the analysis of mining block categories by country, most of the surface area of themining blocks in Guyana and Bolivia is under exploration. In Ecuador and Perú the largest proportioncorresponds to blocks under exploration/production. In Colombia and Brasil the largest proportion correspondsto blocks under tender (GMN2).By basinThe macro-basin within Amazonia with the largest total area covered by mining blocks is theAmazonas Middle-Lower macro-basin in Brasil, with a total area of 619,894 km 2 with designated miningblocks. This macro-basin is followed by the Guyana/Amapá (212,524 km 2 ), Tocantins (190,609 km 2 ),Madeira (184.332 km 2 ) and Negro macro-basins (168,839 km 2 ) (TMN4 and GMN3).In terms of individual phases of concessionary blocks, the largest surface areas covered byblocks in the Open for Bidding and Under Exploration phases are found in the Amazonas (Middle-Lower), Tocantins and Guyana/Amapá macro-basins. The largest surface areas covered by blocks inthe Under Tender phase are found in the Amazonas (Middle-Lower), Negro and Madeira macro-basins(TMN4).Table TMN5 shows the ten sub-basins with the largest surface area covered by mining blocksin the different phases. The sub-basins with the largest areas covered by blocks in all phases are theAmazonas river (Juruá-Paru-Jari) with 99,291 km 2 , followed by the Iriri with 69.503 km 2 , Cuyuní with60,893 km 2 , Lower Tocantins with 59,143 km 2 and Trombetas with 58,400 km 2 . Fourteen sub-basinswere identified with more than 52% of their surface covered by concessionary mining blocks, as can beobserved in map MMN5.In relation to those blocks in the Under Production phase, the Cuyuní sub-basin, covering areasof Guyana and Venezuela, presented the largest area with 33,928 km 2 (21,551 km 2 and 12,377TMN3. Quantity and surface area of mining blocks in Amazonia. by countryCountryQuantity of mining blocks Surface area of mining blocks Participationnumber of blocks % Area (km 2 ) % of Amazonia in the totalBolivia 485 0.9 3,734 0.8 0.0Brasil 42,623 80.5 1,349.207 27.0 17.3Colombia 1,563 3.0 50,192 10.4 0.6Ecuador 791 1.5 4,840 4.2 0.1Guyana 743 1.4 145,069 67.5 1.9Perú 5,812 11.0 22,587 2.9 0.3Suriname 11 0.0 30,419 18.6 0.4Venezuela 946 1.8 22,803 5.0 0.3Total 52,974 100 1,628.850 20.9 20.9* The overlapping areas within the same category were eliminated for not overestimate the total area.TMN5. The ten sub-basins with the largest surface area covered by mining blocks in AmazoniaSub-basinSurface area of mining blocks (km²)Under production Under exploration Under tender Open for bidding TotalAmazonas (Juruá-Paru-Jari) 493 11,032 81,049 6,717 99,291Iriri 449 5,510 61,418 2,126 69,503Cuyuní 33,928 12,014 448 14,503 60,893Tocantins (B) 2,599 23,113 21,851 11,580 59,143Trombetas 1,304 6,154 46,066 4,876 58,400Sucunduri-Abacaxis-Maués 168 11,906 36,374 1,469 49,917Guyana-Esequibo (Costa) 9,276 36,797 3,780 49,853Guaporé 924 8,259 36,075 2,909 48,167Teles Pires (S,Manuel) 175 31,805 10,322 4,676 46,978Araguaia (B) 236 17,367 11,105 10,753 39,460<strong>RAISG</strong> 32 Amazonia under Pressure – Mining Mining – Amazonia under Pressure 33 <strong>RAISG</strong>
km 2 respectively), followed by the Guyana-Essequibo (Costa) with 9,276 km 2 . The largest areas of thecombined Under Exploration/Production phases (Peru and Ecuador) were located in the Madre de Dios(6,591 km 2 ) and Marañón (5,636 km 2 ) sub-basins. The Guyana/Esequibo (Costa) sub-basin had thelargest surface area (36,797 km 2 ) covered by blocks in the Under Exploration phase, followed by theTeles Pires with 31.805 km 2 (TMN5).MMN4. Proportion of mining blocks per macro-basin in AmazoniaTMN6. Surface area of mining blocks in PNAs in Amazonia, by administrative sphere and type of useArea covered by blocks (km²)PNA administrative sphereand type of useOpen forbiddingUndertenderUnderexplorationUnderexploration/productionGMN4. Distribution of mining blocks in PNAs in Amazonia, by administrativesphere and type of useUnderproductionParticipation(%)Departmental - direct use 9,547 64,518 20,719 517 95,300 33.9Departmental - indirect use 591 35,611 6,380 194 42,776 15.2National - direct use 7,632 34,955 23,699 14 3,921 70,222 25.0National - direct/indirect use 18 2 20 0.0National - indirect use 2,290 20,656 6,469 700 921 31,036 11.0National - transitory use 40,992 743 41,735 14.8General total 20,060 196,732 57,284 714 6,298 281,089 100.0TotalBMN2. The new gold rush in the Amazoniause departmental PNAs (42,776 km 2 ), transitory use national PNAs (41,735 km 2 ), and indirect use nationalPNAs (31,036 km 2 ). Mining blocks in direct/indirect use national PNAs cover an area of 20 km 2 .Turning to the different phases of mining activity, those blocks under tender cover 196,732 km 2of the PNAs in Amazonia (70% of the total area of mining blocks in PNAs), followed by those underexploration (57,284 km 2 , 20%), those open for bidding (20,060 km 2 , 7%), those under production (6,298km 2 , 2%) and finally those in the combined Under Exploration/Production phase (714 km 2 ). Most of themining blocks within PNAs are found in Brasil, occupying a total area of 234,461 km 2 (83% of the totalsurface area of mining blocks located in PNAs) (GMN5 and MMN6).The largest area of blocks in the Under Production phase is found in national PNAs intended fordirect use (3,921 km 2 ) and indirect use (921 km 2 ). The PNAs with the highest pressure from these miningproduction are: FN Saracá-Taquera (1,290 km 2 ), FN Carajás (1,107 km 2 ) and FN Jamari (939 km 2 ) inBrasil, the Amazonia Second Law Forest Reserve in Colombia (743 km 2 ), the PN Canaima in Venezuela(550 km 2 ), the APA Tapajós (293 km 2 ) and the RBi Maicuru (117 km 2 ) in Brasil.The PNAs with the largest number of mining blocks in the combined exploration/productionphase, are: REc Cofán Bermejo, RfVS El Zarza, RBi El Quimi and PN Yacuri, all in Ecuador.In the Under Exploration phase, Brasil contains the largest areas in all categories of PNAs:23.554 km 2 overlapping direct use national PNAs, followed by direct use departmental PNAs (20,244km 2 ), indirect use departmental PNAs (6,380 km 2 ) and indirect use national PNAs (5,651 km 2 ). The directuse national PNAs with the largest surface area covered by mining blocks in this phase are: APATapajós (6,287 km 2 ), FN Carajás (1,947 km 2 ), FN Crepori (1,706 km 2 ), FN Amaná (1,606 km 2 ), and RExVerde para Sempre (1,574 km 2 ).Mining blocks in the Open for Bidding phase overlap PNAs by 20,060 km 2 . Most of these are inBrasil: REx Verde para Sempre, APA Tapajós, FN Jamanxim and FN Carajás.A total area of 196,732 km 2 in concessionary blocks is in the Under Tender phase. Direct usedepartmental PNAs are overlapped with 64,518 km 2 , followed by transitory use national PNAs (40,992km 2 ) and indirect use departmental PNAs (35.611 km 2 ). The PNAs most threatened by blocks undertender are APA Tapajós, FN Amazonas, PN Montanhas do Tumucumaque and EE Jari, all in Brasil, andthe Amazonia Forestry Reserve in Colombia.Aerial view of illegal gold mining in the Serra do Divisor mountain range, between Brasil and Perú.© Thomas Müller/SPDA, 2010GMN5. Distribution of mining blocks in PNAs in Amazonia, by country andactivity phaseOver the last 20 years various PNAs and ITs in Amazonia have been under pressure from the increase in small-scale illegal semimechanizedalluvial gold mining. This gold rush was stimulated by the exponential increase in the price of the metal, which has risen500% over the last ten years. The miners working in the production sites in the forest are sustained by a network of middle-men tradersproviding basic supplies: food, fuel, machines and air and/or land transportation.The semi-mechanized prospecting system causes river silting, the loss of biodiversity in the aquatic ecosystems, due to the turbidity,soil removal and forest conversion. It contributes to a third of the total world mercury pollution and causes substantial health andenvironmental impacts. More than an estimated 100 tons of mercury are used each year in illegal gold mining in Amazonia.In Amazonia 37% of the Protected Natural Areas (Parks and Reserves) of seven countries are affected by illegal mining. The situationis particularly acute in Western Amazonia (Madre de Dios, Peru), in the Guianas (Guyana, Suriname and Guyane Française) andin the Yanomami territory (Brazil and Venezuela). In the Madre de Dios region the deforestation rate related to small-scale gold miningis estimated to have increased from 292 ha/year between 2003 and 2006 to 1,915 ha/year between 2006 and 2009. In Guyana, astudy by WWF Guyanas (Marín and May, 2012) showed that the deforestation caused by gold mining tripled between 2001-2002 and2007-2008, destroying 650 km 2 of forests. The pollution associated with small-scale gold mining followed a similar growth pattern,affecting 26,000 km of rivers in 2008.The territory traditionally occupied by the Yanomami people in the forest and mountain region of the border between Brazil andVenezuela was the target of a massive invasion of prospectors coming from Boa Vista (Roraima) in the second half of the 1980s whichresulted in the death of 15% of the Yanomami population in Brazil and many other serious socio-environmental impacts. This pressurewas relieved somewhat after a mega operation to remove miners organized by Brazil’s federal government at the start of the 1990s. Inthe last five years the Yanomami IT has been systematically invaded by Brazilian prospectors who cross the international border, a situationthat demands the coordinated action of the governments in Brazil and Venezuela. There are recent indications of an associationbetween mining interests and drug trafficking. (Beto Ricardo/ISA, in collaboration with Claudio Maretti/WWF)MMN6. Proportion of mining blocks per PNA in AmazoniaMMN5. Proportion of mining blocks per sub-basin in AmazoniaGMN6. Distribution of mining blocks in ITs in Amazonia, by country and activity phaseBy Indigenous TerritoriesBy Protected AreaThe area covered by mining blocks and their distribution are displayed in table TMN6 and graphGMN4. The total combined surface area of mining blocks, in all phases, overlapping Protected NaturalAreas (PNAs) is 281,089 km 2 , which corresponds to 15% of the total surface area of PNAs in Amazonia.In terms of categories of PNAs, the largest area of mining blocks, in all phases, is located indirect use departmental PNAs (95,300 km 2 ), followed by direct use national PNAs (70.222 km 2 ), indirectSemi-mechanized gold mining, on the upper Madre de Dios River, Peruvian Amazonia..© Heinz Plenge, 2008Concessionary blocks for mining overlapping Indigenous Territories (ITs) cover a total surfacearea of 407,320 km 2 , representing 19% of the total surface area of ITs in Amazonia. The largest proportionis found in recognized ITs (381,857 km 2 , 94%) with the remainder in traditionally occupied landswithout official recognition (25,437 km 2 , 6%).Of that total area, mining blocks under tender account for 348,993 km 2 of the region’s ITs. Thoseunder production account for 24,163 km 2 , and those under exploration, 16,933 km 2 . 79% of the totalarea overlapped by mining concessions is located in Brasil (GMN6 and MMN7).<strong>RAISG</strong> 34 Amazonia under Pressure – Mining Mining – Amazonia under Pressure 35 <strong>RAISG</strong>
MHI1Hidroeletrics Plantsin AmazoniaHydroelectricPlantsThe Amazon basin is seen by governments, companies, investors and consumers as a virtuallyinexhaustible source of water resources for energy production. This view is based on twofacts: 1. the current supply of electrical energy from Amazonia to the region’s countries is significant–up to 75% of the national energy supply in Perú, Bolivia and Ecuador – and 2. a potential contribution ofAmazonia to these countries’ electrical energy need is very high. The latter fact is based on the potentialfor high capacity installations in the Andean-Amazonian mountain rainforest region along with thecapacity of the giant Amazon itself where the ‘Brazilian hydroelectric potential,’ estimated at 260,000MW, accounting for more than 50% of the exploitable capacity of the entire Amazon region (Gamboa &Cueto, 2012). Hence the major challenge posed for Amazonian countries in the near future is the needto reconcile the exploitation of Amazonia’s hydroelectric potential with the integrated management ofbasins, including the recuperation and conservation of the ecological, social, economic and culturalcycles of a region that values and essentially depends on its rivers.ContextSpillway of the Tucuruí Hydroelectric Plant (UHE), work begun in 1975 on the Tocantins river and completed 30 yearslater at the cost of approximately US$ 15 billion, ten times more expensive than originally budgeted. Brasil.© Paulo Santos, 2002 There are 171 hydroelectric plants in operation or underconstruction in Amazonia as a whole,and 246 planned or under studyThe great hydroelectric potential of the Amazonian rivers provides the possibility of obtaininglow-cost electricity without resorting to fossil fuels or nuclear reactors, and at the same time, an opportunityto attain high levels of sustainability in national electricity supplies. In Ecuador the governmentpresents the implementation of the Coca Codo Sinclair hydroelectric project as a possibility to make thecountry energy independent, while reversing the current purchase of electricity from Colombia and Perú(up to 10% of the supply) in the dry season and perhaps even selling energy to these same countries.Despite the considerable technical problems (the lack of studies for upgrading to 500 KV transmissionlines) and financial issues (lack of tenders) identified by critics in relation to this project, the governmentplans for the hydroelectric plant to enter into operation from 2016 onwards (López, 2011). Likewise theenergy agreement between Perú and Brasil for the production and exportation of electricity in Perú’sborder zones (the Inambari megaproject and others) is justified by the annual increase in electricitydemand. “Based on the expected level of growth over the next decade, under a permanent planningscheme, Brasil will require national and foreign hydroelectric energy sources. Consequently and veryconsciously, both state planning and that of the state company Eletrobras show a clear interest in buildinghydroelectric plants within and beyond Brazilian Amazonia …” (Gamboa & Cueto, 2012).In 2009 the Peruvian government authorized Brasil to fund, build and operate six large hydroelectricplants in the rainforest-covered eastern side of the Peruvian Andes, with the clear objective ofselling hydroelectric power to supply Brasil’s energy needs (Dourojeanni, 2009). However this decisionis now being analyzed by the Peruvian Congress’s Foreign Affairs Commission. Meanwhile Brasil ispushing forward construction of the Belo Monte hydroelectric plant, the third largest in the world, locatedon the Xingu river, an important tributary of the Amazonas river. This project is one of the dozensof large, medium and small-sized hydroelectric plants planned for the next ten years.The socio-environmental impacts of the construction and operation of the hydroelectric damsand reservoirs – such as alterations in the water regime, reduction of hydrobiological diversity, watercontamination and accelerated deforestation – are undervalued or simply ignored.Measurements of greenhouse gases (GHGs) in the Balbina reservoir in Brasil and the Petit Sautreservoir in Guyane Française have shown that the hydroelectric plants may also be significant sourcesof GHGs (Fearnside & Pueyo, 2012). With the construction of the Belo Monte Dam,Brasil will have the largest hydroelectric plant in Amazonia,with a capacity of 11,233 MW The Upper Amazon macro-basin has the highest number ofhydroelectric plants in operation or under construction The PNAs are primarily affected by small hydroelectric plants The cross-border issues relating to hydroelectric plantsare not being debated publiclyĸ¾ÄMethodology<strong>RAISG</strong> 38A georeferenced database with the location of current hydroelectric plants and projects forbuilding future plants was compiled and systemized, based on both official and non-official sources.They were grouped into two types: projects with the capacity to generate more than 30 megawatts(MW), called Hydroelectric Units (UHEs), and Small Hydroelectric Plants (PCHs), with the capacity toproduce less than 30 MW. In addition, some information was compiled for 17 projected hydroelectricplants with capacities of more than 300 MW in Ecuador and Perú these were not included in the carto-Amazonia under Pressure – Hydroelectric PlantsHydroelectricAerial view of the workers’ shelters for the Belo Monte Hydroelectric Plant (UHE). Altamira, Pará, Brasil.© Marizilda Cruppe/EVE/Greenpeace, 2012Cartographic sources for the theme Hydroelectric Plants: • BOLIVIA: FAN, 2009 • BRASIL: <strong>Instituto</strong> Brasileiro de Geografia e Estatística - IBGE, Malha Municipal 1:1.000.000, 2005 • COLOMBIA: Fundación Puerto Rastrojo (Atlas de la Amazonía Colombiana),2001; IGAC, 2010 • ECUADOR: Ministerio de Transporte y Obras Públicas, 2006 • PERÚ: Ministerio de Transporte y Comunicaciones - MTC, 2008 • SURINAME: Digital Chart of World, 1993 • VENEZUELA: <strong>Instituto</strong> Geográfico de Venezuela SimónBolívar, 2003. Ocean and relieve: World Physical Map, U.S. National Park Service, in ArcGIS Online Services.Ä Perú and Bolivia account for 75% of the AndeanAmazonia, a region where many Amazonian riversarise; this is an extremely important transitionzone in the region’s hydrography.¾ Covering190,000 km 2 and containing11 indigenous territories, the Juruena Riverbasin has a total of 19 PCHs planned, as wellas one gigantic plant functioning.¸ Soon to begin operations, the Santo Antônioand Jirau hydroelectric plants on the MadeiraRiver have not been the object of a cross-bordersocio-environmental assessment.Plants – Amazonia under Pressure 39 <strong>RAISG</strong>
graphic analyses since no information on their geographic locationwas available. The hydroelectric plants may be found in differentphases: Operational, Under Construction, Planned and Under Study(THP1). This analyses groups those under construction and operationalas ‘Actual’ and those projected and under study as ‘Planned.’Amazonia as a wholeAs of 2012, the <strong>RAISG</strong> database contains information regarding417 hydroelectric plants (MHP2). 171 are in operation or underconstruction the great majority of which (120) have a capacity of lessthan 30 MW (PCHs). The remaining 246 plants have been includedin national energy plans, most of which (179) are PCHs, producingless than 30 MW (GHP1). The majority of hydroelectric plants aresituated in the southern part of Amazonia, followed by the easternand western regions. Few hydroelectric projects were recorded inthe central and northern regions.If all the planned hydroelectric units were constructed, therewould be a 144% increase in the number of units currently in operationor under construction. The increase in the number of PCHswould be 149% and the number of UHEs 131%. This data suggeststhat much of the future use of the water resources of Amazonia maybe committed to generating electricity.Twelve hydroelectric plants with a capacity higher than 300 MW were identified (seven in operationand five under construction). The most important hydroelectric plant in operation is the Guri HydroelectricPlant located in Venezuela with a capacity of 10,325 MW (THP2), while Belo Monte, in Brasil, isthe hydroelectric plant under construction has the highest projected capacity (11,233 MW).Twenty-five (37%) of the 67 projected UHEs will have a capacity of more than 300 MW. Half ofthese will be built in Brasil (13). The largest will be located in the Pongo de Manseriche, situated on theMarañon river (Perú) with a projected capacity of 7,550 MW (THP3).MHP2. Hydroelectric plants in Amazonia, by type and activity phaseAmazonia in each countryBrasil has the highest number of hydroelectric plants with 340 recorded (81.5% of the regionaltotal), 109 of which are in operation or under construction and another 231 planned. Next is Perú, with33 hydroelectric plants in operation or under construction and 11 planned, making a total of 44. Boliviahas a total of 14 hydroelectric units (ten in operation and four planned). In the other countries less thanten hydroelectric plants are found with Guyana the only country in which no hydroelectric plant wasrecorded (MHP3 and THP4).BHP1. From the Andes to Amazonia: water in the mountain forestsAndean Amazonia covers a transition area between the Andes and the Eastern Mountain Range (Cordilheira Real Oriental: CRO), defining a series of upland ecosystems,whether montane or high jungle forest (2200 to 600 m above sea level), before expanding across the vast Amazonian plain or low jungle, characterized by areasof flooded forest. Peru and Bolivia account for 75% of the Andean Amazonia where the montane forest is a very important transition zone, though in general little known.The particularity of the CRO is its climate producing high rainfall, amid steep escarpments, permanent cloud cover and forest soils that have been subject to deforestationand changes in use type.However the enormous availability of water resources in these basins is a factor that explains the expansion of the frontiers for hydroelectric generation and for drinkingwater and irrigation in the Andes. Although the enormous hydroelectric potential of upland Amazonia is little exploited even today, pressure is increasing on these basinsfrom medium and large scale (> 100 MW) hydroelectric generation projects, as well as the channeling of water to cities on the Pacific side, as in the Ecuadorian casewhere around 30 hydroelectric projects are registered, along with other multi-use projects for channeling drinking water to cities like Quito (supplying up to 80%) and forirrigating flower farms and agroindustrial zones.We can also observe protected areas that from their outset recognized the importance of the water services of the montane forests of the Amazonian side: here it shouldbe noted that the rivers rising in the Andes deposit their sediment-rich waters in the lowland basins of Brazil, crossing international boundaries on the way, as in the caseof Ecuador whose Amazonian hydrographic systems are shared with Peru and Colombia.One aspect that should be investigated in depth is the public institutional framework available for the administration and management of water resources in the Amazonbasin and in the montane forests in particular, since this area represents a transition zone between the Andes and the Amazonian floodlands, where the water resourcesare now seen as a factor in local development. Here future projects for hydroelectric generation, potable water and irrigation could provide a system of remunerative paymentsfor the integrated management of the watersheds that regulate the hydrological cycles and deal with the excess of sediments produced by these and other largescaleprojects. Finally very specific legislation is needed, such as an institutional framework and public policies that take into account local climate patterns, the fragilityof terrestrial and aquatic ecosystems, and the human safety aspects in a zone with high vulnerability from heavy rainfall and the alteration in climate systems seen overthe last decade. (Víctor López/EcoCiencia)THP1. Phases of hydroelectric plants per country in AmazoniaCountry* Under Study Planned Under Construction OperationalBolivia X XBrasil X X X XColombia XEcuador X XGuyane Française XPerú X XSuriname XVenezuela X* Without information for Guyana.GHP1. Distribution of hydroelectric plants in Amazonia, by type and situation (threat)THP2. Hydroelectric plants with capacity > 300 MW in operation and under construction in AmazoniaCountry Name Capacity (MW) Sub-basinOperationalVenezuela Guri 10,325 CaroníBrasil Tucuruí I e II 8,370 TocantinsVenezuela Tocoma 2,260 CaroníVenezuela Macagua I 2,190 CaroníVenezuela Caruachi 2,160 CaroníBrasil Lajeado (L,E,Magalhães) 902 TocantinsBrasil Peixe Angical 452 TocantinsUnder ConstructionBrasil Belo Monte 11,233 XingúBrasil Santo António 3,150 MadeiraEcuador Coca Codo Sinclair 1,500 NapoBrasil Estreito 1,087 TocantinsEcuador Sopladora 487 PastazaTHP3. Hydroelectric plants with capacity >300 MW projected in AmazoniaCountry Name Capacity (MW) Sub-basinPerú Pongo de Manseriche 7,550 MarañonBrasil Jirau 3,450 MadeiraBolivia Río Madera 3,000 MamoréBrasil Marabá 2,160 TocantinsPerú Inambari 2,000 Madre de DiosPerú Paquitzapango 2,000 TamboBrasil Teles Pires 1,820 Teles PiresBolivia El Bala 1,600 BeniPerú Rentema 1,525 PastazaBrasil Serra Quebrada 1,328 TocantinsBrasil Santa Isabel 1,087 AraguaiaPerú Sumabeni 1,074 MantaroBrasil Araguanã 960 AraguaiaBolivia Cachuela Esperanza 900 BeniPerú Cuquipampa 800 MantaroPerú Vizcatán 750 MantaroBrasil São Manoel 746 Teles PiresBrasil Tupiratins 620 TocantinsPerú Tambo-Pto, Prado 620 TamboBrasil Ipueiras 480 TocantinsBrasil Sinop 461 Teles PiresPerú Chaglla 360 HuallagaBrasil Tabajara 350 Ji-Paraná ou MachadoBrasil Colider 342 Teles PiresBrasil Água Limpa 320 Das MortesTHP4. Quantity of hydroelectric plants per country in Amazonia, by type and phaseCountryPlannedActualPCH UHE total PCH UHE totalTotalBrasil 176 55 231 87 22 109 340Perú 2 9 11 31 2 33 44Bolivia 1 3 4 1 9 10 14Ecuador 10 10 10Venezuela 6 6 6Colombia 1 1 1Guyane Française 1 1 1Suriname 1 1 1General total 179 67 246 120 51 171 417THP5. Quantity of hydroelectric plants per macro-basin in Amazonia, by type and phaseMacro-basinPlannedActualPCH UHE total PCH UHE totalTotalMiddle-Lower Amazonas 63 16 79 30 4 34 113Upper Amazonas 2 13 15 29 12 41 56Western Northeast Atlantic 5 5 5Guyanas/Amapá 13 6 19 3 3 22Madeira 28 6 34 24 14 38 72Negro 1 1 1Orinoco 6 6 6Paraná 54 4 58 20 6 26 84Parnaíba 2 2 2Tocantins 14 20 34 16 6 22 56General total 179 67 246 120 51 171 417THP6. The ten sub-basins with the highest number of hydroelectric plants in Amazonia, by type and phaseSub-basin (country)PlannedActualPCH UHE total PCH UHE totalTotalJuruena (Brasil) 17 2 19 10 10 29Arinos (Brasil) 21 1 22 22Do Sangue (Brasil) 12 4 16 3 3 19Teles Pires (Brasil) 5 6 11 8 8 19Guaporé (Brasil, Bolivia) 4 4 13 1 14 18Ji-Paraná (Brasil) 10 1 11 5 1 6 17Palma (Brasil) 2 3 5 10 10 15Candeias do Jamari (Brasil) 13 13 1 1 14Tambo (Perú) 2 2 9 2 11 13Amapá-Costa (Brasil, Guyane Française) 11 1 12 12General total 95 20 115 58 5 63 178MHP3. Quantity of hydroelectric plants per country in AmazoniaBy BasinThe Amazonas (Middle-Lower) macro-basin has the highest number of hydroelectric plants inoperation, under construction or planned, followed by the macro-basins of the Paraná, Madeira, Tocantinsand Upper Amazonas rivers (MHP4 and THP5).The sub-basins with the largest number of current and planned hydroelectric plants are theJuruena (29), Arinos (22), Do Sangue (19), Teles Pires (19), Guaporé (18) and Ji-Paraná (17) basins,among others. As shown in map MHP5 and table THP6, these plants are situated in the southern partof Amazonia, mainly in Brasil.MHP4. Quantity of hydroelectric plants per macro-basin in Amazonia<strong>RAISG</strong> 40Amazonia under Pressure – Hydroelectric PlantsHydroelectricPlants – Amazonia under Pressure 41 <strong>RAISG</strong>
MHP5. Quantity of hydroelectric plants per sub-basin in AmazoniaTHP7. Quantity of hydroelectric plants in PNAs in Amazonia, by administrative sphere and type of usePNA Planned ActualGeneraltotalAdministrative sphere Type of use PCH UHE total PCH UHE totalDepartmentalDirect 12 5 17 3 3 6 23Indirect 3 1 4 4NationalDirect 1 9 10 10Indirect 4 1 5 2 5 7 12Total 20 16 36 5 8 13 49THP8. Quantity of hydroelectric plants in PNAs in AmazoniaProtected National AreaPlannedActualPCH UHE Total PCH UHE TotalTotalFE do Amapá (Brasil) 9 1 10 10FN Iquiri (Brasil) 4 4 4PN Cayambe Coca (Ecuador) 3 3 3PN Chapada das Mesas (Brasil) 3 3 3APA (D) Chapada dos Guimarães (Brasil) 2 2 1 1 3FN Mulata (Brasil) 1 1 2 2PE do Jalapão (Brasil) 1 1 2 2APA do Jalapão (Brasil) 1 1 1FN Amapá (Brasil) 1 1 1PE Cristalino II (Brasil) 1 1 1PE Dom Osório Stoffel (Brasil) 1 1 1REx Ituxi (Brasil) 1 1 1APA (D) Lago de Peixe Angical (Brasil) 1 1 1APA (D) Lago de Santa Isabel (Brasil) 1 1 1APA (D) Lago de São Salvador (Brasil) 1 1 1SH Machupicchu (Perú) 1 1 1SN Megantoni (Perú) 1 1 1PN Montanhas do Tumucumaque (Brasil) 1 1 1RBi Nascentes da Serra do Cachimbo (Brasil) 1 1 1APA (D) Nascentes do Rio Paraguai (Brasil) 1 1 1FE Paru (Brasil) 1 1 1RBiF Pilón Lajas (Bolivia) 1 1 1RDS Rio Iratapuru (Brasil) 1 1 1APA Rio Madeira (Brasil) 1 1 1FE Rio Preto-Jacundá (Brasil) 1 1 1APA (D) Salto Magessi (Brasil) 1 1 1PN Sangay (Ecuador) 1 1 1APA (D) Serra do Lajeado (Brasil) 1 1 1RN Trinité (Guyane Française) 1 1 1Total 20 16 36 5 8 13 49By Indigenous TerritoriesIn relation to ITs, six (3,5%) of the 171 hydroelectric plants in operation in 2012 are wholly or partiallysituated within ITs (two UHEs and four PCHs), while 10 future hydroelectric plants (4.1% of the 246planned as of 2010) will operate inside ITs (three UHEs and seven PCHs) (MHP7 and THP9).Various ITs are under current pressure or are threatened by future constructions of hydroelectricplants. Currently the ITs facing the pressure from actual plants are found in Brasil (2), Perú (1), Ecuador(2) and Colombia (1), while the ITs directly threatened by projected plants are located in Brasil (7), Perú(2) and Bolivia (1) (THP10).MHP7. Quantity of hydroelectric plants per IT in AmazoniaRenewable traditional fish trap made by the Enawene Nawe indigenous people, on the Juruenariver. Mato Grosso, Brasil. © Vincent Carelli/Vídeo nas Aldeias, 2009BHP2. Small hydroelectric plants in the Juruena basin (Mato Grosso, Brazil)<strong>RAISG</strong> 42By Protected AreasA total of 171 hydroelectric plants were in operation or under construction within Protected NaturalAreas (PNAs) as of 2010. Thirteen (7.6%) of these were wholly or partially located within PNAs (eightUHEs and five PCHs), while 36 future hydroelectric plants (14.6% of the 246 planned as of 2010) willoperate inside PNAs (16 UHEs and 20 PCHs) (MHP6 and THP7).Various PNAs face current pressures or are threatened by future constructions of hydroelectricplants. The PNAs currently experiencing the greatest pressures from actual plants are located in Ecuador(3), Brasil (8), Perú (1) and Guyane Française (1), while the PNAs under threat from projected plantsare found in Brasil (33), Perú (1) and Bolivia (1) (THP8).MHP6. Quantity of hydroelectric plants per PNA in AmazoniaAmazonia under Pressure – Hydroelectric PlantsHydroelectricThe basin of the Juruena river, which flows into the left bank of the Tapajós, is full of PCHs (Small Hydroelectric Plants)– four in operation, six under construction, six awarded and 11 earmarked: a total of 27 – as well as two UHEs (large-scalehydroelectric plants) also already earmarked. With a surface area of 190,000 km2, the basin includes 11 indigenous territoriesand a large mixture of environments.Currently there exist across Amazonia 120 PCHs already installed or under construction and 188 planned, concentratedespecially in the central part of the western region of Brazil and in the Peruvian Amazonia. The installation of the PCHs hasincreased exponentially in the Brazilian Amazonia over the last 20 years.Under Brazilian law, PCHs are defined as plants with a capacity to generate between 1 and 30 MW, with a reservoir equal toor less than 3 km 2 . These criteria were established by the National Electricity Agency (ANEEL) in 1998. The licensing processis simplified and responsibility assigned to the state governments. Systemic analyses of the socio-environmental impacts arenot required and authorization is given case by case, without prior evaluation of the accumulative impacts of various PCHsoperating in the same region.This is the case of the Juruena basin and the neighboring basins of the Aripuanã, Papagaio and Juína rivers, located in thestate of Mato Grosso (MT) where, since 2002, one company alone, Maggi Energia, plans to install nine PCHs and UHEs. Thiscompany forms part of the Andre Maggi Group, the largest producer and processor of soya in the Brazilian Amazonia – led byBlairo Maggi, ex-governor of Mato Grosso state (2003-2010) and currently a senator of the Republic.In 2005, several construction firms formed the Juruena Consortium, with the transfer of Maggi’s licenses to two othercompanies: Juruena Participações and Linear Incorporações, and the works became included in the PAC (Growth AccelerationProgram) formulated by the government of President Lula (2003-2010) and continued by President Dilma Rousseff, withloans from BNDES.These PCHs will affect the Indigenous Territories of the Paresi, Nambiquara Menky, Rikbaktsa and Enawenê-nawê. Therewas no prior, free and informed consultation, as required by the Federal Constitution and Convention 169 of the ILO, of whichBrazil is a signatory. The company negotiated some financial compensation directly with these peoples. However the Enawenênawêre-evaluated this agreement, alarmed by the fact that the start of construction work on a PCH upstream on the Juruenahad already altered the flow of fish, compromising the performance of Yakwã, perhaps the longest ritual cycle of any indigenouspeople in contemporary Amazonia.Each year the Enawenê traditionally begin a ritual complex, seven months in duration, which includes the artisanal constructionof temporary dams to capture fish. Over the last few years, post-PCH, the once abundant fish have not appeared, compromisingthe performance of the ritual cycle. Paradoxically in November 2010, the Yakwã ritual was recognized by the NationalInstitute of Historic and Artistic Heritage (IPHAN) of the Ministry of Culture as part of Brazil’s cultural heritage, inserted in theRecord of Celebrations.In 2008, the Enawenê-nawêset fire to the constructionsite for the Telegráfica PCH,located in the town of Sapezal(430 km from Cuiabá, thecapital of Mato Grosso). Soonafter this episode, the FederalPublic Prosecutor’s Office reiteratedthe request to suspendthe construction work until theaccumulative impacts of all theregion’s PCHs were adequatelyassessed. The work was in factparalyzed for a while but themeasure was overturned by theSTF (Federal Supreme Court)View of the Juruena river where the Enawene Nawe live and where variousafter a visit from the governor of Small Hydroelectric Plants (PCHs) are under construction.Mato Grosso.Mato Grosso, Brasil. © Margi Moss/Projeto Brasil das Águas, 2007THP9. Quantity of hydroelectric plants in ITs in Amazonia, by type of territoryIndigenous TerritoriesPlannedActualPCH UHE Total PCH UHE TotalTotalIT officially recognized 7 3 10 4 4 14IT not officially recognized 2 2 2Total 7 3 10 4 2 6 16THI10. Quantity of hydroelectric plants in ITs in AmazoniaIndigenous TerritoriesPlannedActualPCH UHE Total PCH UHE TotalTotalMayni (Perú) 1 1 1PI Aripuanã (Brasil) 1 1 1Potsoteni (Perú) 1 1 1Puerto Ocopa (Perú) 1 1 1Shuar (Ecuador) 2 2 2Pilon Lajas (Bolivia) 1 1 1Bacurizinho (Brasil) 1 1 1Erikpatsa (Brasil) 1 1 1Irantxe (Brasil) 1 1 1Ponte de Pedra (Brasil) 1 1 1Utiariti (Brasil) 3 3 1 1 4Vaupés Parte Oriental (Colombia) 1 1 1Total 7 3 10 4 2 6 16ConclusionThe hydroelectric plants are concentrated in the south of Amazonia and in a sizeable area of theAndean-Amazonian region (mainly in Perú). The construction of these plants, their current operationand the building of others in the short and medium term, are linked to national development plans regardingthe countries’ projected energy matrix. The socio-environmental impacts of these hydroelectricunits have not been adequately assessed or addressed. The plants form a key element in cross-bordercooperation agendas. Five of the 12 Amazonian macro-basins cross international borders (42% of thetotal) and 32 of the 154 sub-basins (21%). This situation highlights the need for strategic cross-bordersocio-environmental assessments at basin level, which was not undertaken, for example, in the constructionof the Jirau and Santo Antônio hydroelectric plants in the Madeira macro-basin, shared byBrasil and Bolivia. This may also occur in the construction of the Madeira and Cachuela Esperanzahydroelectric plants in Bolivia, located in the same macro-basin. Likewise the plans for the constructionof hydroelectric plants in Perú appear not to take into account of impacts in the lower portions of therivers in the Brazilian and Bolivian regions of Amazonia.Plants – Amazonia under Pressure 43 <strong>RAISG</strong>
MFI1Fires (Hot Spots)in AmazoniaFIRES (HOT SPOTS)Fire forms part of the slash-burn model of agriculture practiced for millennia in Amazonia byindigenous peoples and more recently by other local populations that have settled there. Over thelast 50 years fire has been used on a larger scale, very often associated with deforestation, in order toconvert extensive areas of Amazonian forest into farm landscapes (MFI1). The use of fire as the “mostefficient and cheapest tool” for eliminating forest cover has transformed millions of hectares into newAmazonian ecosystems completely different from their original condition.With climate change generating extreme events in Amazonia, such as the 2005 drought, theconditions have been favorable for large-scale forest fires, such as those reported in Brasil and Bolivia(Marengo et al., 2008). Uncontrolled forest and ground fires may be responsible for a large proportionof greenhouse gas emissions in Amazonia.ContextFires, increasingly common and more intense in the region, are not limited just to the infamous‘arc of deforestation’ of Brasil and Bolivia. New fires have been occurring in more remote areas andwithin Protected Natural Areas (PNAs). Indigenous and traditional communities, including some whoinhabit regions far from the colonization frontiers, have denounced problems in controlling fires and illustratethe need to develop procedures for adapting to the climate changes under way. One exampleof this is the case of the Xingu Indigenous Park (MT, Brasil), an island of forest surrounded by the deforestationproduced over the last 20 years by farming activities, where 16 ethnic groups live in more than50 different communities. In 2009 an experimental process was begun to mobilize twelve communities,belonging to seven ethnic groups, to create new forms of managing and fighting fire (see BFI1: TheXingu Indigenous Park on the fire path).Scientists monitoring and studying the dynamic of deforestation and degradation in Amazoniaagree that a number of interrelated factors exists that increases the forest’s vulnerability to fire (Fearnside,2005). The main factors described include: 1) the advance of farming in Bolivian and BrazilianAmazonia close to areas of cerrado and dry transition forests, which are already naturally more proneto fire propagation (Laurance et al., 2001; Steininger et al., 2001); 2) the degradation of forest areasthrough selective logging, which increases sunlight and wind penetration, lowering the relative humidityof the forest (Nepstad et al., 2004), which explains the particular vulnerability to fire of illegal loggingzones (Veríssimo et al., 1992); 3) the severity and duration of the dry season, worsened by the firesthemselves, which curb cloud formation and delay the onset of the rainy season (Laurance et al., 2002);and 4) the fact that trees in Amazonia are not adapted to fire, which means that after the first fire hasburnt, the volume of material susceptible to burning and aridity increases, significantly augmenting theintensity of subsequent fires (Cochrane, 2003).The immediate and most evident consequences of the increase in fires are the loss of diversityin wildlife and plant life, air pollution and the consequent impact on human health, the increase in greenhousegas emissions and the reduction in local rainfall due to the smoke.Recent estimates indicate that the combination of deforestation and climate change may leadto a 50% increase in the occurrence of fires in Amazonia by 2050 (Silvestrini et al., 2011), intensifyingforest degradation and impoverishment.Burning to convert forest into cattle pasture. São Félix do Xingu, Pará, Brasil.© Daniel Beltra/Greenpeace, 2008 Fire, used in traditional agriculture, is no longer restrictedto marginal areas; it is advancing deep into Amazonia The highest number of forest fires were recordedduring the years 2002, 2004 and 2005 The southeastern portion of Amazonia, known as theArc of Deforestation (Brasil and Bolivia) is the regionwith the highest number of recorded forest fires The 10 indigenous territories most heavily affected by fireduring the period 2000-2010 are located in Bolivia and Brasil The traditional forms of managing fire used byindigenous peoples will have to adapt to climate change¾Ä¸Methodology<strong>RAISG</strong> 44Georeferenced information on ”hot spots” in Amazonia for the 2000-2010 period was obtainedfrom Brasil’s National Space Research Institute (<strong>Instituto</strong> Nacional de Pesquisas Espaciais do Brasil:INPE), taking into account: (i) the recorded date of hotspots, and (ii) the type of sensor used. Only datafrom the NOAA-12 (from 01/01/2000 to 09/08/2007) and NOAA-15 (from 10/08/2007 to 31/12/2010)satellites were used. For these satellites a hotspot appears as a 1 km² area of high temperature, whichmay represent the occurrence of a single small fire, several small fires or a larger fire. These satellitescannot detect fires that occur on the ground under the tree cover. To facilitate analysis, the data wasAmazonia under Pressure – FiresFiresYoung man from the Waurá indigenous peoples training to put out fires inside the Xingu Indigenous Park.Mato Grosso, Brasil. © Rogério Assis, 2011Cartographic sources for the theme Fires (Hot Spots): • <strong>Instituto</strong> Nacional de Pesquisas Espaciais de Brasil (INPE), 2011 (http://www.dpi.inpe.br/proarco/bdqueimadas/). Ocean and relieve: World Physical Map,U.S. National Park Service,in ArcGIS Online Services.Ä In 2010 the number of forest fires in theXingu Indigenous Park reached 884, almostfour times as high as 2007, the previousrecord-high year for fires.¾ Guyane Française was proportionallythe country with the highest number offorest fires in protected areas duringthe period 2000-2010 (44.7%).¸ In the arc of deforestation in Brasil,most of the forest fires are recordedin areas of Cerrado, dry forests ortransition zones.– Amazonia under Pressure 45 <strong>RAISG</strong>
epresented in 10 km 2 boxes and separated into two periods: 2000-2005 and 2006–2010. The informationwas analyzed for the following units: Amazonia, Amazonian countries, macro-basins and subbasins,Protected Natural Areas and Indigenous Territories.GFI1. Fires recorded annually in Amazonia over the period 2000-2010BFI1. Xingu Indigenous Park on the fire pathThe 16 indigenous peoples who live in the Xingu Indigenous Park (PIX) – one of the best known indigenous territories in the BrazilianAmazonia, spanning across 280,000 km 2 – have discovered a growing tendency for fire, which was always used in traditionalactivities, to go out of control: small fires that previously burnt themselves out now very easily become forest fires, while the burningof vegetation used to clear fields now invades the forest, and so on. In 2010, a very dry year, the number of forest fires inside the PIXreached 884, almost four times higher than in 2007, which was the year with the most forest fires in a decade. Fire fighting brigadesalready exist in many villages.Forest fires are, at the same time, cause and effect of the profound changes occurring in the Amazon basin (Davidson et al., 2012).Recent estimates indicate that the combination of deforestation and climate change may increase the occurrence of fires in Amazoniaby almost 50% by 2050, giving rise to a cycle of degradation and loss of biodiversity (Silvestrini et al., 2011). In the Xingu basin,situated in the transition zone between savannah and forest in the Brazilian Amazonia, fire has increasingly become a threat to socioenvironmentalsustainability.Fire, used to clear lands already deforested for agricultural practices or to open new lands for crops, may escape control and affectlarge tracts of forest. Forest fires, including those occurring deep in the forest, without destroying the forest cover immediately, increasethe mortality rate of trees and the opening of the forest canopy, reducing the forest’s humidity, increasing the quantity of dry materialwithin the forest and making it more susceptible to new blazes (Nepstad et al., 2001). Besides affecting the structure and compositionof the forest, the fires kill off wildlife, provoke the emission of greenhouse gases, worsening global warming, and produce smoke,which reduces local rainfall and causes respiratory andother health problems among humans (Cochrane 2003).The transition forests found in the region formed bythe Xingu’s headwaters are naturally more susceptible tofire compared to other types of forest, given that theyare smaller, have less dense plant cover and have lowerhumidity in the driest months (Ray et al., 2005; Alencaret al., 2006). This vulnerability is exacerbated by thehigh rates of deforestation affecting the region. Hencethese forests are considered one of the ecosystemsmost threatened within the Amazon basin. In extremelydry years, the surface affected by forest fires may beup to 14 times greater than in normal years (Alencar etal., 2006). With climate change and the increase in thedesertification of the forest, these events tend to be morefrequent and intense.Fire, used traditionally by indigenous peoples in theirsubsistence activities (for example, to clear fields, gatherhoney and to make small campfires during fishing andhunt trips), has become an ever bigger threat. As theforest has become more inflammable, traditional managementpractices already no longer seem sufficient tocontrol them. This fact shows the need for traditionalpractices to adapt to the climate changes taking placeon the planet. (Adapted from Observing the Xingu basin,ISA 2012)MFI3. Quantity of fires per country in Amazonia (2000-2010)Amazonia as a wholeA total of 1,320,866 fires were recorded for the period 2000-2010. The years with the highestnumber of fires were 2004, 2005 and 2002, in this order (GFI1). There were more fires during the2000-2005 period (approximately 685,000) than the 2006-2010 period (approximately 551,000).The largest number of fires occurred in the months of August, September and October, withthe highest figures recorded for September 2004 (59,698), August 2005 (51,627) and September2005 (59,455).These fires were detected in larger proportion in the southeast of Amazonia (MFI2), a zonecalled the ‘arc of deforestation’ of Brazilian Amazonia (Schor et al., 2008; Vieira et al., 2008) andBolivian Amazonia.MFI2. Fires in Amazonia in the period 2000-2010 (quantity per 10 km 2 squares)GFI2. Fires recorded monthly in Amazonia over the period 2000-2010By BasinGFI3. Annual quantity of fires recorded in Brazilian Amazonia overthe period 2000-2010The Middle-Lower Amazonas macro-basin presented the highest number of fires, followed byTocantins and Madeira. This trend was maintained over the eleven year time span, although more intenselyduring the 2000-2005 period (see TFI1 and MFI4).The sub-basins with the largest number of fires were the Western Northeast Atlantic S, TelesPires, Lower Araguaia, Arinos and Lower Tocantins. In all cases, the largest proportion of fires wasrecorded during the period 2000-2005 (TFI2 and MFI5).MFI4. Quantity of fires per macro-basin in Amazonia (2000-2010)Amazonia in each countryA total of 1,194,060 (90%) fires occurred in Brazilian Amazonia during the 2000-2010 period.The largest numbers occurred in the years 2004 (166,750), 2005 (161,589) and 2002 (157,299), andthe lowest in the years 2009 (39,627) and 2000 (66,175). The months with the largest number of fireswere August, September and October. It should be emphasized that there are large areas of savannahand drier transition forests within the limits of Brazilian Amazonia, which is where 25.7% of the detectedfires occured (GFI2).Bolivia had the second highest number of recorded fires, a total of 97,033, followed by Venezuelawith a total of 19,912. In Perú 4,364 fires were counted, while in Colombia a total of 2,962 wererecorded. In Guyana there were 1,619 fires. Finally the countries with fewer than 500 recorded fires wereSuriname (490), Guyane Française (369) and Ecuador (57). The annual distribution of fires, except forBrasil, is shown in GFI3.The largest proportion of fires in Bolivia, Brasil, Ecuador, Perú and Venezuela were detectedduring the 2000-2005 period, while in Colombia, Guyana, Guyane Française and Suriname the highestnumbers were in the 2006-2010 period. The intensity of fires per country in the period 2000-2010 isrepresented in MFI3.TFI1. Fires recorded in the macro-basins of Amazonia over the period 2000-2010Macro-basin 2000-2005 2006-2010 TotalMiddle-Lower Amazonas 295,971 130,164 426,135Tocantins 174,442 116,067 290,509Madeira 158,919 78,059 236,978Western Northeast Atlantic 102,024 58,356 160,380Mouth of the Amazonas/Estuary 47,356 27,186 74,542Paraná 27,221 16,619 43,840Upper Amazonas 17,655 7,247 24,902Orinoco 13,347 5,839 19,186Negro 12,570 5,478 18,048Parnaíba 10,325 6,588 16,913Guyanas/Amapá 5,570 3,565 9,135Middle Amazonas 156 33 189São Francisco 31 22 53<strong>RAISG</strong> 46Amazonia under Pressure – FiresFires– Amazonia under Pressure 47 <strong>RAISG</strong>
MFI5. Quantity of fires per sub-basin in Amazonia (2000-2010)TFI2. Ten sub-basins of Amazonia with the highest number of fires (2000-2010)Sub-basin 2000-2005 2006-2010 TotalWestern Northeast Atlantic (South) 63,354 37,821 101,175Teles Pires 65,349 16,652 82,001Lower Araguaia 47,085 28,118 75,203Arinos 38,622 12,744 51,366Lower Tocantins 32,926 15,754 48,680Guaporé 26,849 11,546 38,395Middle-Lower Tocantins 2 23,046 13,887 36,933Pindaré 22,848 12,512 35,360Middle Xingu 18,655 16,627 35,282Mamoré 24,681 9,805 34,486GFI4. Annual distribution of fires in Amazonia, by country, except Brasil(2000-2010)TFI5. The ten PNAs of Amazonia with the highest number of fires in the period 2000-2010Category PNA Country Number of fires Area (km 2 )APA (D) Triunfo do Xingu Brasil 10,849 16,833APA (D) Leandro (Ilha do Bananal/Cantão) Brasil 7,304 15,703APA (D) Baixada Ocidental Maranhense Brasil 7,264 17,963APA (D) Reentrâncias Maranhenses Brasil 4,950 26,630FN Jamanxim Brasil 4,065 21,770PDyANMI (D) Iténez Bolivia 3,409 14,308PN Araguaia Brasil 2,924 5,500FE Rio Preto-Jacundá Brasil 2,518 11,668ANMI (D) Santos Reyes Bolivia 2,418 9,042APM Pampas del Río Yacuma Bolivia 2,185 5,985TFI6. Fires recorded in ITs in Amazonia (2000-2010)IT TypeIT officiallyrecognized2000200120022003200420053,373 5,343 7,460 5,931 8,575 7,808 4,468 8,168 5,515 2,118 11,497 70,25620062007200820092010totalBy Indigenous LandThe total number of fires recorded during the years from 2000 to 2010 inside Indigenous Territories(ITs) was 90,307 (7% of the total recorded in Amazonia). The largest proportion of fires wasrecorded in officially recognized ITs (70,256), followed by areas earmarked for the creation of territorialreserves (11,912), traditionally occupied areas without official recognition (8,121) and finally territorialreserves or intangible zones (18) (GFI5 and TFI6).At the national level Brasil registered 59,137 fires within ITs, representing 5% of the total numberof fires recorded in the country and 65.5% of the total recorded in ITs within Amazonia. In Bolivia, for itspart, the number of fires within ITs was 21,993, equivalent to 22.7% of the fires in the country and 24.4%of the total in Amazonia. In Venezuela 7,907 fires were registered in ITs, amounting to 39.7% of fires inthe country and 8.8% of the total recorded in Amazonia. The highest proportion of fires in ITs at nationallevel was recorded in Perú (45.6%) (TFI7 and MCF7). The ten ITs with the highest number of fires arelocated in Brasil and Bolivia (TFI8).MFI7. Quantity of fires per IT in Amazonia (2000-2010)IT not officiallyrecognized393 1,220 661 1,889 858 749 544 951 507 156 193 8,121Proposed TerritorialReservation880 519 1,865 984 2,052 1,597 810 870 1,090 384 861 11,912Territorial Reservation 2 1 1 1 3 6 2 2 18Total 4,648 7,082 9,986 8,804 11,486 10,155 5,823 9,992 7,118 2,660 12,553 90,307GFI5. Distribution of fires in ITs in Amazonia, by type of territory (2000-2010)By Protected AreaThe total number of fires recorded within PNAs was 101,546 (8% of the total recorded in Amazonia).The largest number of fires (58,591) were recorded in departmental direct use PNAs, followedby national direct use PNAs (18,894), national direct use PNAs (16,262) and departmental indirect usePNAs (7,765) (GFI4 and TFI3).At national level Brasil recorded the highest number of fires within PNAs (83,399), which represents82.1% of the total recorded in all PNAs. Fires registered inside PNAs in Brasil represent 7% of thetotal fires recorded in the country. The highest proportions of fires within PNAs compared to the nationaltotal were found in Guyane Française (44.7%) and Ecuador (42.1%) (TFI4 and MFI6). The second highestnumber of fires inside PNAs was recorded in Bolivia with 15,242 fires in total, representing 15.7%of the national total and 15% of the Amazonian total. The ten PNAs with the highest number of fires arelocated in Brasil and Bolivia (TFI5).MFI6. Quantity of fires per PNA in Amazonia (2000-2010)TFI3. Fires recorded in PNAs in Amazonia (2000-2010)PNAadministrativesphere and typeof useNational - DirectUseNational - IndirectUseNational - Direct/Indirect UseNational -Transitory UseDepartmental -Direct UseDepartmental -Indirect Use200020012002200320042005793 1,293 1,613 1,626 2,875 2,184 1,376 1,561 1,295 536 1,110 16,262801 1,678 2,027 2,138 2,473 2,431 1,319 1,990 1,280 608 2,149 18,89420062007200820092010Total4 5 1 1 1112 1 4 3 3 233,414 3,586 7,043 5,311 7,590 8,418 5,595 5,511 5,455 1,931 4,737 58,591410 777 702 736 827 1,152 331 759 552 182 1,337 7,765Total 5,430 7,334 11,386 9,811 13,769 14,188 8,621 9,825 8,590 3,258 9,334 101,546TFI7. Fires in ITs in Amazonia. by country (2000-2010)Country Fires in IT Total fires % of total fires % of total fires in ITBrasil 59,137 1,194.060 5.0 65.5Bolivia 21,993 97,033 22.7 24.4Venezuela 7,907 19,912 39.7 8.8Colombia 350 2,962 9.9 0.5Ecuador 26 57 11.8 0.4Guyana 261 1,619 16.1 0.3Guyane Française 23 369 35.9 0.2Perú 434 4,364 45.6 0.0Suriname 176 490 6.2 0.0Total 90,307 1,320.866 6.8 100.0TFI8. The ten ITs in Amazonia with the highest density of fires in the period 2000-2010ConclusionThe highest concentration of fires coincides with Amazonia’s ‘arc of deforestation,’ a zone distinguishedby the rapid advance of farming. There were proportionally fewer fires within the PNAs andITs, which emphasizes their role as ‘social and natural barriers’ that limit the expansion of fires. Thelow number of fires inside PNAs and ITs may also be explained in large part by the fact that they arenormally located in zones with moderate or low populations. In addition the adequate management offire is linked to the traditional knowledge and practices still used by indigenous and rural peoples livingin these territorial units. On the other hand, the ‘arc of deforestation’ zone coincides with the cerradobiome and drier transition forests that form part of Brazilian Amazonia and where fire is a historical andnatural element of the ecology of their landscapes.TFI4. Fires recorded in PNAs in Amazonia by country (2000-2010)Country Fires in PNA Total fires % of total fires % of total fires in PNABrasil 83,399 1,194.060 7.0 82.1Bolivia 15,242 97,033 15.7 15.0Venezuela 2,098 19,912 10.5 2.1Colombia 278 2,962 9.4 0.3Perú 186 4,364 4.3 0.2Guyane Française 165 369 44.7 0.2Suriname 138 490 28.2 0.1Ecuador 24 57 42.1 0.0Guyana 16 1,619 1.0 0.0Indigenous Territory Country Number of fires Area (km 2 )PI Araguaia Brasil 8,843 13,585TI Maraiwatsede Brasil 3,385 1,652TCO Guarayos Bolivia 3,189 21,030TCO Itonoma Bolivia 2,737 12,635Pemón Venezuela 2,382 s,i,TCO Cayubaba Bolivia 2,229 7,531PI Xingu Brasil 2,188 26,420TI Inãwébohona Brasil 2,088 3,771TCO Cavineño Bolivia 2,044 5,713TCO TIPNIS (Isiboro Sécure) Bolivia 2,030 11,808Total 101,546 1,320.866 7.7 100.0<strong>RAISG</strong> 48Amazonia under Pressure – FiresFires– Amazonia under Pressure 49 <strong>RAISG</strong>
creases are expected over the next few years as a result of the relaxation evident in recently approvedenvironmental legislation and the increase in the international price of grains, particularly soybeansand maize.MethodologyTo evaluate the geographic patterns of the impact of deforestation in Amazonia, two sources ofinformation were used:1. for Andean Amazonia (Colombia, Ecuador, Perú and Bolivia) and the Guianas (Venezuela,Suriname, Guyana and Guyane Française) the analysis used preliminary data produced by<strong>RAISG</strong> for the periods 2000-2005 and 2005-2010, obtained using the Spectral Mixture Analysismethod and a decision tree algorithm (see BDF1: Analysis of deforestation in the Andean-Amazonian region).2. for Brazilian Amazonia, the analysis used data on deforestation produced by Prodes (BrazilianAmazon Rainforest Satellite Monitoring Project), published by INPE (National Institute ForSpace Research) in 2011, which cover the period 2000-2010. For the purposes of comparison,this data was grouped into two periods: 2000-2005 and 2005-2010.In both cases the year 2000 was taken as a baseline (base map). Deforestation was analyzedfor the Amazon region as a whole, for Amazonia in each country, by macro-basin and sub-basin, byProtected Natural Areas (PNAs) and by Indigenous Territories (ITs).Amazonia as a wholeThe area of forest present in Amazonia in 2000 was equivalent to 68.8% of the entire region(5,357,001 km 2 ) (TDF1). On the 2000 base map (used to assess deforestation in the decade from2000 to 2010) we can see large tracts of unforested areas which include large areas that were originallynot forested, as well as those areas deforested prior to 2000 (MDF2).Over the period 2000-2010, this forest cover was reduced by 4.5% (approximately 240,000km 2 ), equivalent to almost half the Colombian Amazonia. This deforestation primarily occurred in thesouthern part of the Brazilian Amazonia, known as the ‘arc of deforestation’ (MDF3). The loss of forestfor the area under evaluation was greater during the 2000-2005 period (163,020 km 2 , 3% of the forestexisting in 2000) in comparison with the 2005-2010 period (76,922 km 2 , 1.4%). This trend matches thefindings published by the FAO (2010), which reported a diminution in forest loss over the 2005-2010period compared to 2000-2005.Cloud cover in the satellite imagery makes it difficult to obtain a more precise panorama ofwhat is happening on the ground. In regional terms cloud cover rose from 2.2 in the first period to3.6% in the second; however, the particular situation varies among the countries. Ecuador is the mostBDF1. Analysis of deforestation in the Andean Amazonia regionInformation on deforestation in the Andean Amazonia is fragmented, out of date, based on different sources, methodologiesand resolutions, both spatial and temporal and not always available.<strong>RAISG</strong> analyzed deforestation in Amazonia in an integrated manner at the regional level, using an appropriate methodologyand spatial/temporal resolutions. The first step was to produce a base map for the year 2000 and then, as a secondstep, to assess deforestation in two periods: 2000-2005 and 2005-2010. The work of interpretation began in 2010, basedon training courses supervised by Imazon, and the adaptation of a single methodology by the <strong>RAISG</strong> team to all the Andeanand Guianese Amazonia countries.The results of this assessment are presented in this publication. These results are preliminary, first of all, because theanalysis of the Brazilian Amazonia is still in progress. For this reason, the maps in this Atlas use the results of a deforestationstudy conducted for Brazil by INPE through Prodes. Secondly, a validation phase, needed for all countries, is currentlyunder way. Even so the information published here provides a good idea of the impact of deforestation on the Amazonianecosystem.Landsat satellite imagery was employed for the analysis of deforestation. This enabled a study of the entire area witha detailed spatial resolution. It should be emphasized that it is the same satellite used by the INPE study in Brazil. EachLandsat image covers an area of 185 km x 185 km denominated a scene. Figure 1 and Table 1 show the scenes that coverAmazonia. <strong>RAISG</strong> was unable to obtain good quality images for three scenes covering Guyana during these three dates.The area mapped, denominated the effective area ofstudy, corresponds to the area for which scenes werefound on the three dates – 2000, 2005 and 2010 – toNumber of analized Landsat Images by countryBolivia 30which the analyses were applied.Brasil 214The 2000 base map (baseline) was establishedColombia 26identifying for each scene: forested areas, non-forestedEcuador 8areas, areas covered by water and areas covered byGuyana 4clouds. At this point the non-forested areas were notGuyane Française 6differentiated in terms of whether they were originallyPerú 41non-forested or whether they had been deforested atSuriname 11some time before the year 2000. For the years 2005Venezuela 29and 2010 the deforested areas were identified in relationto the baseline. The effective area analyzed represented99% of the Amazonian territory where Guyana was the only country with a relatively high proportion unanalyzed(23%) (Figure 1). For the other countries this figure was lower than 2%.The methodology used to identify the forest cover mentioned was based on Spectral Mixture Analysis, combined with atree decision algorithm, developed initially by Imazon and later adapted by <strong>RAISG</strong>’s technical team.The design of a precision assessment methodology based on maps derived from teledetection requires the applicationof protocols that ensure statistical rigor and at the same time an adaptation to the practical realities related to cost limits(Strahler et al., 2006).The validation process involves comparing the information from the generated map with reference information consideredto be highly reliable. Generally it is based on samples from verification spots whose classification was obtained eitherfrom field observations or more detailed analysis of the images than those used to generate the map.The complete and validated data on deforestation, including a methodological description of the entire process, will bepublished in 2013, in a special edition for this extremely important topic.Illustration of the deforestation assessment processThe following figure shows a sequential example of the classification on three different dates of a portion of the Landsat7-66 scene at a point along the Aguaytía River, an affluent of the Ucayali River, in the Peruvian Department of Ucayali. Thefirst shows the construction of the ‘baseline,’ where the originally non-forested areas, like savannahs, were classified as‘non-forest’ along with areas already deforested by this date. This baseline was then used to determine the deforestationduring the periods 2000-2005 and 2005-2010. Given the limitations in the availability of high quality images with lowamounts of cloud cover, the reference year 2000 may have been based on scenes taken within the period between 1998and 2002, the reference year 2005 on scenes taken between 2003 and 2007, and finally the year 2010 on scenes takenbetween 2008 and 2011.MDF2. Base map of soil cover in Amazonia, year 2000MDF3. Deforestation in Amazonia in the periods 2000-2005 and 2005-2010Landsat images coverage for Amazoniaaffected with cloud cover varying between 10 and 13%, followed by Guyana, Guyane Française, Perúand Venezuela. In the case of Brasil, the data shows cloud cover remained constant between 2000and 2010, corresponding to 5.9% of the area under analysis, though mostly located over areas little affectedby deforestation.Amazonia in each countryAerial view of deforestation associated with the Inter-Oceanic Highway, in Perú.© Rhett A. Butler/mongabay.com, 2011In 2000 Amazonia was covered by forests across 68.8% of its surface area (TDF1) with Brasilcontaining 58.1% of these forests. In terms of relative area per country, Guyane Française, Perú, Colombiaand Venezuela have the highest forest cover with values that exceed 80% of the total surface areaof Amazonia in their countries, while Brasil and Bolivia have the lowest percentages (62.1 and 64.1%respectively). This also results from the fact that the latter countries have a wider variety of non-forest<strong>RAISG</strong> 52 Amazonia under Pressure – Deforestation Deforestation – Amazonia under Pressure 53 <strong>RAISG</strong>
ecosystems within the Amazonian area, such as the seasonally flooded savannahs of the Llanos deMoxos in Bolivia, and a large extent of savannah (cerrado) across the entire southeast of the BrazilianAmazonia, as well as large enclaves of savannah, such as the ‘Lavrado’ in Roraima state in the northof Brasil (MDF2).The deforestation evaluated in the 2000-2010 period took place mostly in Brasil, which had a6.2% loss of forest cover, followed by Colombia, Bolivia and Ecuador with rates of 2.8%, 2.5% and 2.4%respectively. The countries with the lowest deforestation levels were Guyane Française and Surinamewith less than 1%. The forest loss in Brasil represented 80.4% of the total forest cut down during theperiod under analysis, followed by Perú with 6.2% and Colombia with 5%. The analyses by five-yearperiod indicate that total forest loss for the 2005-2010 period was generally lower with the exception ofPerú, Colombia and Guyane Française (TDF2 and GDF1). In the latter two cases deforestation rose from1.2 to 1.6% and from 0.3 to 0.4% respectively, while in Perú the rate remained at 1.1% during both periods.During the two five-year periods Brasil was the country with the largest proportion of forest loss,followed during the first half of the decade by Bolivia with 1.4% and Ecuador and Guyana with 1.3% andin the second half by Colombia with 1.6% and Bolivia, Ecuador, Guyana and Perú, the latter countrieswith a loss of 1.1%. Over the two periods Suriname was the country with the largest relative reductionin forest loss (from 0.7% to 0.1%), followed by Brasil (from 4.5% to 1.7%).MDF4. Proportion of deforestation from 2000 to 2010 in Amazonia, by countryTDF1. Relative distribution of Amazonia and Amazonian forest by country in the year 2000Country Amazon surface (km²) % of total % of forest in 2000 % of total forestBolivia 479,264 6.2 64.1 5.7Brasil 5,006.316 64.3 62.1 58.1Colombia 483,164 6.2 88.7 8.0Ecuador 116,284 1.5 76.3 1.7Guyana 214,969 2.8 65.3 2.6Guyane Française 86,504 1.1 92.4 1.5Perú 782,820 10.1 89.5 13.1Suriname 163,820 2.1 79.8 2.4Venezuela 453,915 5.8 81.6 6.9Total 7,787.056 100.0 68.8 100.0TDF2. Deforestation in Amazonia in the periods 2000-20005 and 2005-2010. by countryDeforestation2000-2005* Estimated. See BDF1. Analysis of deforestation in the Andean-Amazonian region.Deforestation2005-2010Deforestation2000-2010CountryForest in 2000% of total(km²) (%) (km²) (%) (km²) (%) (km²) (%) (%)Bolivia 307,123 64.1 4,187 1.4 3,494 1.1 7,682 2.5 3.2Brasil 3,110.668 62.1 138,804 4.5 54,181 1.7 192,985 6.2 80.4Colombia 428,498 88.7 5,170 1.2 6,816 1.6 11,986 2.8 5.0Ecuador 88,361 76.0 1,171 1.3 965 1.1 2,136 2.4 0.9Guyana 140,411 65.3 1,800 1.3 1,488 1.1 3,288 2.3 1.4Guyane Française 79,916 92.4 210 0.3 293 0.4 502 0.6 0.2Perú 700,738 89.5 7,365 1.1 7,674 1.1 14,974 2.1 6.2Suriname 130,719 79.8 938 0.7 191 0.1 1,130 0.9 0.5Venezuela 370,567 81.6 3,375 0.9 1,820 0.5 5,195 1.4 2.2Total 5,357.001 68.8 163,020 3.0 76,922 1.4 239,942 4.5 100.0BDF2. The arm of deforestation in the IT and PNA corridor in the Xingu basinThe Xingu River flows for approximately 2,700 km across the northeast of the states of Mato Grosso and Pará in Brazil, until itreaches the Amazon River. Its basin, covering around 511,000 km 2 , contains one of the largest continuous mosaics of protectedareas in Brazil, forming a corridor of socio-environmental diversity encompassing more than 280,000 km 2 , composed of 20 IndigenousTerritories and 10 Protected Natural Areas.Deforestation in the Xingu basin first appeared in the 1960s, driven by the government colonization projects and private enterprise.As in other regions of Amazonia, deforestation expanded primarily throughout the network of roads that emerged followingthe construction of the main highways.Examining the last decade, deforestation in the Xingu basin increased in the period from 2000 to 2005, when more than 35,000km 2 of native vegetation were lost. From 2005 onwards there was a reduction in deforestation, following the trend in the BrazilianAmazonia in general, probably due to the combination of economic factors, such as the fluctuation in raw material prices, and thealterations in government command and control actions, with emphasis on the Plan for Prevention and Control of Deforestation inLegal Amazonia (Trancoso et al., 2010; Macedo et al., 2012). The creation and divulgation in 2008 by the Ministry of the Environmentof a list of the municipalities with the highest amount of deforestation and the moratorium on soya and meat are also factorscontributing to the reduction in deforestation in the region (Macedo et al., 2012).As of the year 2010, more than 105,000 km 2 were deforested in the Xingu basin, representing 22% of the basin, according tothe monitoring undertaken by INPE (in the forested area) and by ISA (in the cerrado area).Although indigenous territories occupy around 40% of the surface area of the Xingu basin, less than 3% of the total deforestationoccurs in them. Likewise the national conservation units occupy approximately 14% of the basin but contain just 1.4% of totaldeforestation.Most of the deforestation occurs precisely in the headwaters of the Xingu River, causing alterations to the hydrological andbiochemical processes across the basin.One of the main areas of occupation in the basin is found in the region of the municipalities of Tucumã and São Félix de Xingu, inthe East, where cattle ranching is the predominant economic activity. São Félix has the largest deforested surface area in the basin(16,900 km 2 ) – and is also the city with the largest cattle herd in Brazil – while Tucumã has the highest percentage of deforestationwithin a single municipality (90.5%).An important route forIT and PNA corridor in the Xingu basin, Brasilspreading new settlement is theBR-163 highway, which crossesthe western part of the basin.Plans for its paving in 2004increased the dispute over landand encouraged deforestationin the region of the municipalitiesof Novo Progressoand Castelo dos Sonhos. Themost recent impact in the basincan be observed in the areaaround the Baú IT. To the northof the basin, deforestation isproduced by the proliferationof secondary roads spreadingout from the BR-230 (Trans-Amazonian Highway).The headwaters of the Xinguare seen as highly favorable toagribusiness due to their soilcharacteristics, topography andrainfall patterns.In the Mato Grosso portionof the basin, the oldest andpredominant form of colonialoccupation was cattle ranchingand logging in the west. In thesouth, one finds a mixture ofcattle ranching and agriculture.Since the start of the 1990ssoya has advanced in parts ofthe south and east of the basin,replacing areas of pasture andforest, pushing cattle ranchingwestwards and provokingincreased deforestation andincreased activity in the landmarket. (Adapted from Observingthe Xingu basin, ISA/2012)than 1%. The same also occured in Bolivia, on the border with Perú, in the Lower and Middle Benisub-basins (MDF8). Some sub-basins in the south-southeast of Brasil saw a reduction in deforestationduring the second period, possibly the result of government intervention through the Action Plan for thePrevention and Control of Deforestation in Legal Amazonia (PPCDAm), implemented in 2004.MDF5. Proportion of deforestation from 2000 to 2010 in the macro-basins of AmazoniaGDF1. . Distribution of forest loss in Amazonia for the periods 2000-2005and 2005-2010, by countryMDF6. Proportion of deforestation by sub-basins in Amazonia for the period 2000-2005By BasinThe macro-basins most affected by deforestation during the 2000-2010 period were the Mouthof the Amazonas/Estuary and the Western Northeast Atlantic, both in Brasil, which lost 9.7 and 6.2% oftheir forest cover respectively. In third place was the Middle-Lower Amazonas macro-basin with a lossof 5.2% of its forest cover. These three basins are located in Mato Grosso and Pará, the states with thehighest deforestation rates in Brazilian Amazonia over recent years (MDF5).During the 2000-2005 period the sub-basins with losses of forest cover equal to or over 10%were the Middle-Lower Madeira, Arinos, Juruena and Candeias do Jamari (MDF6). Furthermore the 32most heavily deforested sub-basins (with more than 3.8% forest loss) are found in Brasil. Other subbasinswere identified in Perú (Pachitea and Huallaga), Colombia (Caquetá) and Bolivia (Mamoré),which had a deforestation rate of more than 2% of their total forest cover.For the 2005-2010 period two sub-basins in Brasil (Middle-Lower Madeira 2 and Pacajá) had thehighest levels of deforestation (7.2 and 6.6 % respectively) (MDF7).Sub-basins were detected in Colombia, Perú and Bolivia that experienced an increase indeforestation between the periods 2000-2005 and 2005-2010. Rates in the Colombian sub-basinsof the Caquetá and the Yari increased from 2.4 to 3.9% and from 0.6 to 2.2% respectively, indicatingthat deforestation is occurring in new geographic areas in this country. In Perú the Middle Marañon,Urubamba and Lower Ucayali sub-basins also saw an increase in deforestation, but at levels lower<strong>RAISG</strong> 54 Amazonia under Pressure – Deforestation Deforestation – Amazonia under Pressure 55 <strong>RAISG</strong>
MDF7. Proportion of deforestation by sub-basins in Amazonia for the period 2005-2010TDF3. Forest loss in PNAs in Amazonia for the period 2000-2010. by type of use and administrative spherePNA Forest in 2000Deforestation2000-2005 2005-2010 2000-2010Type of use/Administrative sphere (km²) (%) (km²) (%) (km²) (%) (km²) (%)Direct Use 687,569 74.7 8,864 3.0 5,265 0.7 14,130 2.1Departmental 318,632 64.2 6,005 1.9 3,418 1.1 9,423 3.0National 368,937 87.1 2,859 0.8 1,847 0.5 4,706 1.3Indirect Use 735,979 81.8 3,700 0.5 1,781 0.2 5,481 0.7Departmental 92,503 71.6 404 0.4 88 0.1 492 0.5National 643,476 83.5 3,296 0.5 1,692 0.3 4,989 0.8Direct/Indirect Use 3,979 93.5 2 0.1 5 0.1 7 0.2National 3,979 95.5 2 0.1 5 0.1 7 0.2Transitory Use 33,426 98.7 35 0.1 49 0.1 84 0.3National 33,426 98.7 35 0.1 49 0.1 84 0.3Total 1,460.954 78.6 12,602 1.7 7,100 0.5 19,701 2.1* Estimated. See BDF1. Analysis of deforestation in the Andean-Amazonian region.GDF2. Distribution of forest loss in PNAs in Amazonia, by type of use andperiod (2000-2005 and 2005-2010)GDF3. Distribution of forest loss in PNAs in Amazonia for the period 2000-2010,by country and type of useTDF5. PNAs most affected by deforestation in Amazonia in the period 2000-2010. by countryPNACategory Name Type of use SphereArea(km²)2000-2005(km²)Deforestation2005-2010(km²)% TotalThe trend towards higher levels of deforestation in direct use PNAs was identified in all countries.Brazil maintained high levels of alteration (1.3%), with the direct use departmental PNAs presentinga deforestation rate of 3.3% (TDF4 and GDF3). This is explained in part by the fact that in Brazil thedirect use PNAs include Environmental Protection Areas (Áreas de Proteção Ambiental: APA), whichhave a highly permissive use system, including urban and private areas within their borders. The APAsaccounted for 49.5% of all deforestation among this group of PNAs in Brasil.The variation in the percentage of loss across the different countries was highly significant, aswere the variations within the same country (MDF9 and TDF5). Brasil had the PNAs with the highestpercentages of deforestation during the decade, reaching as high as 41.3% in the APA Rio Pardo. Thisrecently created APA (2010) is one of the PNAs in Rondônia state whose category and use type werealtered, including the consolidation of the illegal occupation of the National Forest that had alreadytaken place. In the other countries the percentages found in the PNAs were less than 10.7% as. Forexample, in the North Commewijne/Marowijne Multiple Management area in Suriname, or the PN AltoFragua-Indiwasi in Colombia, 9.6% of its forest was lost.MDF9. Proportion of deforestation per PNA in AmazoniaMDF8. Evolution of deforestation by sub-basins in Amazonia in the period 2000-2010By Protected AreasThe Protected Natural Areas (PNAs) maintained 78.6% of their areas covered by forests in 2000.In ten years (2000-2010) this area was reduced by 2.1%. As would be expected with the PNAs functioningas conservation units, this rate is lower than that found in unprotected lands where deforestationis more than double (5.6%), and lower too than the regional average (4.5%). This reveals the strongpressure exerted on the area of Amazonia not included in PNAs, which has less forest cover (64.8%compared to 78.6%). Within the PNAs we can observe the same reduction between the 2000-2005 and2005-2010 periods (TDF3 and GDF2). Analyzing the PNA use types, areas for direct use show a loss offorest up to three times as high as those areas for indirect use. This tendency was particularly strong inthe departmental PNAs, which saw a forest loss of 3% over the decade 2000-2010.TDF4. Forest loss in the PNAs of Amazonia in the period 2000-2010. by countryPNA Forest in 2000Deforestation2000-2005 2005-2010 2000-2010Type of use Administrative sphere (km²) (%) (km²) (%) (km²) (%) (km²) (%)Bolívia 100,434 74.7 299 0.3 339 0.3 638 0.6Direct Use Departmental 38,608 65.6 90 0.2 130 0.3 220 0.6Direct Use National 28,990 81.8 141 0.5 128 0.4 269 0.9Direct/Indirect Use National 282 65.1 0 0.1 0.0 0 0.1Indirect Use National 32,554 82.1 67 0.2 82 0.3 149 0.5Brasil 858,447 73.0 10,074 0.9 5,086 0.4 15,161 1.3Direct Use Departmental 280,024 64.0 5,915 2.1 3,288 1.2 9,203 3.3Indirect Use Departmental 92,503 71.6 404 0.4 88 0.1 492 0.5Direct Use National 249,230 85.3 2,356 0.9 1,272 0.5 3,628 1.5Indirect Use National 236,690 74.9 1,400 0.6 437 0.2 1,837 0.8Colombia 76,319 95.7 409 0.5 455 0.6 864 1.1Indirect Use National 76,319 95.7 409 0.5 455 0.6 864 1.1Ecuador 30,424 78.9 138 0.5 131 0.4 268 0.9Indirect Use National 30,424 78.9 138 0.5 131 0.4 268 0.9Guyana 9,081 97.3 46 0.5 18 0.2 65 0.7Direct/Indirect Use National 3,696 99.0 2 0.1 5 0.1 7 0.2Indirect Use National 5,385 96.1 44 0.8 14 0.2 58 1.1Guyane Française 38,396 96.3 52 0.1 67 0.2 118 0.3Direct Use National 15,241 96.1 30 0.2 44 0.3 74 0.5Indirect Use National 23,155 96.5 22 0.1 22 0.1 44 0.2Perú 179,498 95.2 331 0.2 669 0.4 1,000 0.6Direct Use National 73,843 94.5 210 0.3 386 0.5 596 0.8Indirect Use National 72,229 94.5 85 0.1 235 0.3 320 0.4Transitory Use National 33,426 98.7 35 0.1 49 0.1 84 0.3Suriname 18,794 87.2 143 0.8 23 0.1 166 0.9Direct Use National 1,634 80.5 123 7.5 17 1.0 139 8.5Indirect Use National 17,160 87.9 21 0.1 6 0.0 27 0.2Venezuela 149,561 87.3 1,109 0.7 311 0.2 1,421 0.9Indirect Use National 149,561 87.3 1,109 0.7 311 0.2 1,421 0.9* Estimated. See BDF1. Analysis of deforestation in the Andean-Amazonian region.BoliviaIntegrated Management Amboró Direct National 1,302 31 31 4.7Natural AreaRegional Park Yacuma Direct Departmental 2,356 30 46 3.2Area of Watersheds Cumbre Alto Beni Direct Departmental 852 14 5 2.1ProtectionBrasilEnvironmental Protection Rio Pardo Direct Departmental 1,436 307 287 41.3AreaExtractive Reserve Jaci Paraná Direct Departmental 2,102 194 315 24.2Environmental Protection Triunfo do Xingu Direct Departmental 16,833 2,238 1,430 21.8AreaColombiaNatural National Park Alto Fragua-Indiwasi Indirect National 552 28 24 9.6Natural National Park Tinigua Indirect National 2,268 69 100 7.4Natural National Park Sierra de la Macarena Indirect National 6,123 64 133 3.2EcuadorProtection Forest Cerro Sumaco Indirect National 987 30 28 5.9Protection Forest Corazon de Oro Indirect National 363 9 9 5.0Protection Forest El Bermejo Indirect National 109 2 2 3.7GuyanaNational Park Shell Beach Indirect National 405 20 7 6.7National Park Kanuku Mts. Indirect National 3,656 23 5 0.8National Park Extended Kaieteur Indirect National 370 0 0 0.2Guyane FrançaiseArea of SpecialForêt des Sables blancs Indirect National 177 0 3 1.9Ecological Importance de ManaForest Biological Reserve Lucifer Dékou-Dékou Direct National 1,116 9 6 1.3Natural Reserve Kaw-Roura Indirect National 132 1 1 1.1PerúRegional Conservation Choquequirao Direct National 138 0 7 5.2AreaRegional Conservation Cordillera Escalera Direct National 1,513 35 29 4.2AreaProtection Forest Alto Mayo Direct National 1,783 27 35 3.5SurinameMultiple UseManagement AreaNorth Commewijne +MarowijneDirect National 486 49 3 10.7Multiple UseNorth Coronie Direct National 304 18 4 7.3Management AreaMultiple UseNorth Saramacca Direct National 889 52 4 6.3Management AreaVenezuelaNatural Monument Cerro Guanay Indirect National 253 4 9 5.3Natural Monument Cerro Camani Indirect National 103 2 1 3.3National Park Delta del Orinoco Indirect National 3,073 85 4 2.9* Estimated. See BDF1. Analysis of deforestation in the Andean-Amazonian region.By Indigenous TerritoriesIn 2000, 81.4% of the ITs in Amazonia were covered by forest. The deforestation that tookplace over the period 2000-2010 removed 0.9% of the forest cover of the ITs. This figure is muchlower (five times) than the deforestation verified in the region as a whole (4.5%), less than half theaverage for PNAs and almost seven times less than the average of areas outside of the ITs (MDF10and TDF6).Although there was a reduction in deforestation inside ITs – with a rate of 0.5% in the five-yearperiod of 2000-2005 falling to 0.4% in 2005-2010 – the downward trend in these lands was observedto be less than regional level, and less than outside the ITs, where a reduction from 4.3% to 2.0% wasseen. At regional level the officially recognized ITs had less deforestation than the unrecognized lands(TDF6 and GDF4), while at national level, where Bolivia and Perú are the only countries in the region thatpresent both types of IT, recognized and unrecognized – differences were observable between thesecategories. In Bolivia the regional pattern was repeated with recognized ITs losing up to 0.5% of theirforest cover and unrecognized ITs 3.3%. In Perú it was observed that unrecognized ITs have lower percentagerates than recognized lands (0.9 and 2.2% respectively) (TDF7). In relation to ITs per country,the highest deforestation rates were detected in Guyana and Bolivia, followed by Ecuador and Perú,while in national terms, without distinguishing between categories of IT, Guyana showed the highestforest loss (3.9%).Forty-one ITs were found with forest losses higher than 20% of their total cover. Most of these(34) have a total area below 100 km 2 or are located in Perú (26). The IT most affected was Huascayacuin Perú, where deforestation reached 50.5% of its area (TDF8).<strong>RAISG</strong> 56 Amazonia under Pressure – Deforestation Deforestation – Amazonia under Pressure 57 <strong>RAISG</strong>
MDF10. Proportion of deforestation per IT in AmazoniaTDF6. Forest loss in ITs in Amazonia in the period 2000-2010. by type of IT*IT Forest in 2000Deforestation2000-2005 2005-2010 2000-2010Type (km²) (%) (km²) (%) (km²) (%) (km²) (%)IT not officially recognized 391,674 81.2 3,392 0.9 1,960 0.5 5,352 1.4Proposed Territorial Reservation 38,296 98.8 17 0.0 47 0.1 64 0.2Territorial Reservation 33,627 97.2 14 0.0 31 0.1 45 0.1IT officially recognized 1,287.957 80.7 6,189 0.5 4,177 0.3 10,366 0.8Total 1,751.555 81.4 9,612 0.5 6,214 0.4 15,826 0.9Out of IT 3,605.839 64.5 153,636 4.3 70,423 2.0 224,060 6.2* Estimated. See BDF1. Analysis of deforestation in the Andean-Amazonian region.BDF3. Deforestation in the northwest of Colombian AmazoniaThe upper basins of the Guaviare, Caquetá, Putumayo and Vaupés rivers, located in the western part of the ColombianAmazonia, are today covered mainly by pasture, secondary vegetation of human origin and mosaics of pastures and crops.Only a few fragments of forest remain, linking the uplands with the lowlands. Between 2000 and 2005, 86% of the totaldeforested area recorded in Colombian Amazonia was located in these basins (Guaviare 36%, Caquetá 32%, Vaupés 10%and Putumayo 8.2%). Between 2005 and 2010, although the percentage of the total deforested area represented by thesefourbasins was lower (81%), there was a notable increase in deforestation in the upper Caquetá (40%) and a reduction inthe other basins (Guaviare 27%, Putumayo 6%, Vaupés 8.4%).Due to their geographic position, these basins are characterized by a rich and unique landscape that has given thema reputation as one of the areas richest in biodiversity and natural resources in Colombia. The northwestern periphery ofthe Colombian Amazonia comprises a natural bridge for the flow of species between the highlands, the Andean forests,the dense Amazonian forests and the Orinoco savannahs. Its broad diversity has been heavily depleted over the last fewdecades since the region’s resources were subjected to the impacts of hydrocarbon and mineral extraction, developed inboth legal and illegal fashion and placing the integrity of the region’s present-day ecosystem under enormous threat. Deforestationin this northwestern periphery is linked to socioeconomic, historical and environmental factors that determine howthe region has been used. The main causal agents have been the spread of urban areas and highways (Etter et al., 2006;Rincón et al., 2006), the navigability of the large rivers, which serve as channels of communication within the Amazonianforest (Armenteras et al., 2009), demographic growth (Etter et al., 2006), oil exploitation (Martínez & Sánchez, 2007),the expansion of coca cultivation (Dávalos et al., 2011; Armenteras et al., 2009; Etter et al., 2006) and recently mining(Romero & Sarmiento, 2011). These processes have also led to the reduction of the natural forest biomass, contributingto the loss of biodiversity, soil deterioration, alteration of the hydrological cycle, and the low quality of the remaining areas(Romero & Sarmiento, 2011).For thousands of years this region was occupied by diverse indigenous groups and until the end of the 19th century wascovered by natural vegetation (Martínez & Sánchez, 2007). Due to its climatic and health conditions, the Amazon regionwas considered an isolated area, populated solely by small indigenous groups. The first colonial advances from Andeansettlers occurred at the start of the 20th century when various settlements were founded in the foothills of the departmentsof Meta, Caquetá and Putumayo, enticed by the cinchona and rubber trade. Later a second wave of migration occurred inthe 1920s at the government´s initiative, beginning with the construction of roads linking the first settlements and motivatedby the desire to protect national sovereignty.The third wave of migration began at the end of the 1930s and continued until the end of the 1960s. In 1936 the nationalgovernment issued the Agrarian Reform Law (Nº 200) that facilitated the purchase of land in these areas, leading tothe influx of rural populations originally from the south of the Andean region. In the 1940s the problem of movement intothis region was made worse by internal conflict in the country. In 1959, Law 20 was issued with the aim of colonizing6,920 km 2 of forest lands. As a result of this law, three colonization frontiers in the areas around La Mono, Maguaré andValparaíso in Caquetá Department were established and subsidized by the national government.The fourth phase of migration took place in the 1970s, driven by oil exploration in the foothills of the upper Putumayo(Etter et al., 2008). Subsequently, in the 1980s, illegal crops invaded Colombia, converting the country into the world’slargest producer of cocaine. In the first decade of the 21st century, the drug business generated a loss of approximately1,100 km 2 of primary forest in Colombia (UNODC, 2009). On average over this period, 55% of these crops were concentratedin the lowland and montane forests of the Orinoquia region and Amazonia. Around 27% of this total is located in theMeta and Guaviare Departments, 18% in the Putumayo and Caquetá Departments, and 10.4% in the Vichada, Guainía,Vaupés and Amazonas Departments.From the year 2000 onwards, due to the public policies implementedin Colombia, an unprecedented boom in oil drilling and miningbegan across the country. The foothills were not exempt fromthis situation; indeed important areas for oil exploration were locatedin the upper basin of the Putumayo River. In parallel, over the pastdecade factors such as the prices of illegal crops, armed conflict,the absence of the state and the oil and mining boom have beenfundamental processes in stimulating the high level of deforestationfound in this area of the country. (Gaia Amazonas Foundation)ConclusionDeforestation is a process affecting a large portion of Amazonia. Brasil is undoubtedly the countrywith the highest level of forest loss. Nonetheless in the period 2005-2010 the country saw a substantialreduction in deforestation, in contrast to other countries, which showed an accelerating trend, as inthe case of Colombia.The results presented reinforce the important role that the PNAs and ITs have been performing inslowing down and containing forest loss in each country and in Amazonia as a whole. The differencesdetected between the lands included in these two types of territorial units and those outside clearly supportthis role. Hence it is important to develop and implement a deforestation monitoring program that,as well as Brazilian Amazonia, also includes Andean Amazonia and the Guianas. The results presentedin this chapter are the first step in this direction.GDF4. Distribution of forest loss in ITs in Amazonia, by type andperiod (2000-2005 and 2005-2010)TDF7. Forest loss in ITs in Amazonia for the period 2000-2010. by country and type of ITDeforestationIT Forest in 2000Country2000-2005 2005-2010 2000-2010Type (km²) (%) (km²) (%) (km²) (%) (km²) (%)BoliviaIT not officially recognized 26,305 56.7 511 1.9 358 1.3 868 3.3IT officially recognized 64,439 79.9 78 0.1 227 0.4 305 0.5Brasil IT officially recognized 843,254 76.0 3,245 0.4 1,770 0.2 5,014 0.6Colombia IT officially recognized 237,473 94.9 929 0.4 683 0.3 1,612 0.7EcuadorIT not officially recognized 50,185 81.7 446 0.9 387 0.8 833 1.7Territorial Reservation 4,960 89.0 4 0.1 3 0.1 7 0.1Guyana IT officially recognized 21,851 79.3 514 2.4 345 1.5 859 3.9Guyane IT officially recognized 6,691 96.4 8 0.1 5 0.1 13 0.2FrançaiseIT not officially recognized 12,293 94.6 55 0.4 54 0.4 108 0.9PerúProposed Territorial Reservation 38,296 98.8 17 0.0 47 0.1 64 0.2Territorial Reservation 28,667 98.8 10 0.0 27 0.1 37 0.1IT officially recognized 114,249 93.9 1,415 1.2 1,147 1.0 2,562 2.2Suriname IT not officially recognized 50,485 91.3 215 0.4 81 0.2 296 0.6Venezuela IT not officially recognized 252,406 82.4 2,166 0.9 1,081 0.4 3,247 1.3TDF8. The three ITs (with an area over 100 km²) from each country in Amazonia with the largest amountof deforestation in the period 2000-2010*ITDeforestationName Type Area (km²) 2000-2005 (km²) 2005-2010 (km²) % TotalBoliviaGuarayos IT not officially recognized 6,706 390 181 8.5Tich (Chiman) IT not officially recognized 1,190 30 34 5.3Yaminahua Machineri IT not officially recognized 303 3 4 2.6BrasilMaraiwatsede IT officially recognized 1,396 273 106 27.1Awá IT officially recognized 1,044 91 94 17.7Tuwa Apekuokawera IT officially recognized 106 13 1 13.2ColombiaAltamira IT officially recognized 107 6 5 10.0Lagos del Dorado. Lagos IT officially recognized 494 23 14 7.5del Paso y El RemansoInga de Aponte IT officially recognized 130 2 7 6.3EcuadorAvila Viejo IT not officially recognized 109 7 4 9.7Juan Pío Montufar IT not officially recognized 167 7 4 6.3San Francisco IT not officially recognized 100 3 1 4.0GuyanaSt. Cuthberth’s IT officially recognized 200 12 36 23.8Kanapang IT officially recognized 184 38 1 20.9Itabac IT officially recognized 171 25 1 15.0Guyane FrançaiseEtnia Galibi IT officially recognized 179 0 2 1.0Etnia Boni. Émérillons et IT officially recognized 2,693 6 1 0.3WayanaEtnia Arawack IT officially recognized 145 0 0 0.2PerúHuascayacu IT officially recognized 108 19 36 50.5Alto Mayo IT officially recognized 120 10 29 32.8Shimpiyacu IT officially recognized 176 17 25 24.3SurinameSantigron IT not officially recognized 1,441 94 6 7.0Aluku IT not officially recognized 847 4 7 1.3Saramacaners IT not officially recognized 9,199 58 27 0.9VenezuelaEtnia Mapoyo IT not officially recognized 300 10 1 3.7Etnia E’ñapa IT not officially recognized 16,880 164 380 3.2Etnia Yabarana IT not officially recognized 905 19 7 2.9* Estimated. See BDF1. Analysis of deforestation in the Andean-Amazonian region.Deforestation in the region surrounding Calamar, east of theChiribiquete National Natural Park, Guaviare, Colombian Amazonia.© Rodrigo Botero García, 2009<strong>RAISG</strong> 58 Amazonia under Pressure – Deforestation Deforestation – Amazonia under Pressure 59 <strong>RAISG</strong>
CONCLUSIONThe active pressures and threats currently facing Amazonia, evident in thecartographic language used in this publication, are driving enormous changesthere: the forest landscapes, socio-environmental diversity and fresh watersources are being replaced by degraded, savannah zones that are drier andmuch less diverse.The planet’s largest and most complex rainforest – with at least 10,000years of human activities – is fast becoming a space for the extraction and/or production of agroindustrial inputs and non-renewable raw materials(commodities with a low value added) for national and international markets.This impairs its potential for sustainable long-term development and destroys itsinhabitable spaces.This Atlas has demonstrated that there already is an arc of deforestationthat extends from Brasil to Bolivia; areas with great pressure on their aquaticresources, very active exploration and production of oil and gas in the AndeanAmazonia and rapidly growing legal and illegal mining activities in the region’speriphery.The analysis of deforestation shows that between 2000 and 2010 around240,000 km 2 of Amazonian forest were cut down. This is equivalent to twice thearea of Ecuadorian Amazonia or to the entire surface of the United Kingdom.It is clear that, given the threats identified in a growing number ofinfrastructure projects for transport (roads or multimodal routes), along with theoil/gas and mining projects, as much as a half of the current Amazonian forestcould disappear in the near future.It is urgent to further analyze what is happening in the Amazonia,based on the information generated by <strong>RAISG</strong>, in order to identify the futuresituation of issues like: forest carbon capture and storage according to landuses (protected areas, Indigenous Territories and so on); new extractiveeconomic frontiers related to water (hydroelectric plants or redirection of riversto provide irrigation and drinking water); promotion of regional integrationand its implications in terms of infrastructure, energy security and mobilizingpopulations; strategies for adapting to climate change in order to reduce socioenvironmentalvulnerability in mountain rainforest and in the flood plains ofAmazonia.There is also a clear need to adopt other themes from a positive agendalinked to governance (of the environment, forests, water or energy), effectivemeasures for integrated management of basins as part of the adaptationto extreme variability and climate change, good practices and sustainableproduction chains, among others.For this Atlas we were unable to include an analysis of key themes suchas illegal mining, logging and farming due to the lack of quality informationwhich can be visualized on maps for Amazonia as a whole. When these factorsare included, the overall panorama will likely be even more adverse.Pressures in hydrographic basins• All sub-basins have at least one affectation, 45% of them are affected byfive of the analyzed themes, either in the form of pressures or threats• The sub-basins of the Upper Amazonas have the highest number of affectationsfor all themes analyzedMCC1. Summary: number of themes overlapping sub-basinsPressures in PNAs and ITs• The PNAs and ITs curbed the pressures to some extent, but new mechanismsare needed to stop or mitigate the threats faced by them.• Deforestation in the PNAs is lower than the rest of Amazonia, while in theITs it is lower than in the PNAs.• 80% of the PNAs and 95% of the ITs are affected by some of the analyzedthemes. The PNAs most affected are direct use national areas.• 1,634 ITs (66%) and 65 PNAs (11%) are affected by oil drilling.MCC2. Summary: number of themes overlapping PNA• 1,998 ITs (81%) and 346 PNAs (57%) area affected by deforestation.• 570 ITs (23%) and 239 PNAs (41%) are affected by mining.• 29 ANP (5%) and 14 TI (0.6%) are directly affected by hydroelectric plants.Reversing the current conditions of all the river basins, PNAs and ITs is notalways possible. However any effort in this direction should be initiated with amore fine-tuned analysis that identifies management measures, integrated withthe participation of local and institutional actors.MCF3. Summary: number of themes overlapping ITTCC1. Number of sub-basins affected by one or more themes of analysisQuantity of themes analyzedMacro-basin 1 2 3 4 5 6TotalUpper Amazonas 3 8 7 3 13 9 43Middle-Lower Amazonas 3 1 12 12 28Madeira 1 1 2 2 12 9 27Negro 1 3 4 7 15Tocantins 1 9 4 14Orinoco 3 8 1 12Guyanas/Amapá 3 3 3 9Mouth of the Amazonas/Estuary 1 3 4Western Northeast Atlantic 3 1 4Middle Amazonas 1 1Parnaíba 1 1São Francisco 1 1Total of sub-basins 5 16 13 14 72 39 1593.1% 10.1% 8.2% 8.8% 45.3% 24.5% 100.0%TCC2. Number of sub-basins affected by theme of analysisThemesNumber of sub-basins affectedRoads 127Oil and Gas 119Hydroelectric Plants 51Mining 135Fires (Hot Spots) 157Deforestation 137TCC3. Number of PNAs affected by one or more themes of analysisPNA Administrative sphereQuantity of themes analyzedand type of use0 1 2 3 4 5 6TotalDirect Use 78 64 54 77 44 7 0 324Direct/Indirect Use 0 0 1 0 1 0 0 2Indirect Use 35 80 73 48 14 2 0 252Transitory Use 7 0 2 2 1 0 0 12Total 120 144 130 127 60 9 0 59020.3% 24.4% 22.0% 21.5% 10.2% 1.5% 0.0%TCC4. Number of PNAs affected by theme of analysisThemesNumber of PNAs affectedRoads 137Oil and Gas 65Hydroelectric Plants 29Mining 239Fires (Hot Spots) 254Deforestation 346TCC5. Number of ITs affected by one or more themes of analysisIT typesQuantity of themes analyzed0 1 2 3 4 5 6TotalTerritorial Reservation 0 3 2 1 0 0 0 6IT officially recognized 105 311 1,222 274 69 9 0 1,990IT not officially recognized 24 106 229 75 20 4 0 458Proposed Territorial Reservation 0 1 4 1 0 0 0 6Total 129 421 1,457 351 89 13 0 2,4605.2% 17.1% 59.2% 14.3% 3.6% 0.5% 0.0%TCC6. Number of ITs affected by theme of analysisThemesNumber of ITs affectedRoads 310Oil and Gas 1,634Hydroelectric Plants 14Mining 570Fires (Hot Spots) 282Deforestation 1,998<strong>RAISG</strong> 60Amazonia under PressureAmazoniaunder Pressure 61 <strong>RAISG</strong>
MARÍN, S.; MAY, E. 2012. Gold mining in the Amazon: key issues and engangement strategy, 3ª versión no publicada de borrador. Paramaribo, Suriname: WWF Guianas/Living Amazon Initiative.MARTÍNEZ, G.; SÁNCHEZ, E. 2007. Contexto físico natural del sur de la Amazonía. En: RUIZ, S.L. et al (eds.). Diversidad biológica y cultural del sur de la Amazonía colombiana:diagnóstico. Bogotá, Colombia: Corpoamazonia; <strong>Instituto</strong> Humboldt; <strong>Instituto</strong> Sinchi; UAESPNN.MATSUMURA-TUNDISI, T. et al. 1991. Limnology of Samuel Reservoir (Brazil, Rondonia) in the filling phase. Verhandlungen des Internationalen Verein Limnologie 24:p.1428-1487.MELO, M.; BELTRÁN, B.; ORTIZ, P. 2007. Quién decide en la Amazonía ecuatoriana? La superposición de intereses en los territorios ancestrales del Centro Sur de la Amazoníaecuatoriana. Quito, Ecuador: Fundación Pachamama.MME. EPE (Ministério de Minas e Energia. Empresa de Pesquisa Energética). 2010. Plano Decenal de Expansão de Energia 2019. Brasília, Brasil. Disponible en: .MONTEIRO, A. et al. 2011. Boletim Transparência Manejo Florestal Estado do Mato Grosso (agosto de 2009 a julho de 2010). Belém, Brasil: Imazon.MONTEIRO, A. et al. 2011. Boletim Transparência Manejo Florestal Estado do Pará (2009 e 2010). Belém, Brasil: Imazon.MÜLLER, R. et al. 2011. Spatiotemporal modeling of the expansion of mechanized agriculture in the Bolivian lowland forests. Applied Geography 31 (2): 631-640.MÜLLER, R. et al. 2012. Proximate causes of deforestation in the Bolivian lowlands: an analysis of spatial dynamics. Regional Environmental Change 12 (3): 445-459.Disponible en: .MURCIA GARCÍA, U.G. et al. 2009. Monitoreo de los bosques y otras coberturas de la Amazonia colombiana. Bogotá, Colombia: <strong>Instituto</strong> Sinchi.NELLEMANN, C.; INTERPOL Environmental Crime Programme (eds). 2012. Green carbon, black trade: illegal logging, tax fraud and laundering in the worlds tropicalforests. A rapid response assessment. Arendal, Norway: UNEP, GRID-Arendal.NEPSTAD, D. et al. 2001 Road paving, fire regime feedbacks, and the future of Amazon forests. Forest Ecology and Management 154: 395-407.NEPSTAD, D. et al. 2004. Amazon drought and its implications for forest flammability and tree growth: a basin-wide analysis. Global Change Biology 10: 704-717. Disponibleen: .NEPSTAD, D. et al. 2006. Inhibition of Amazon deforestation and fire by parks and indigenous lands. Conservation Biology 20 (1): 65–73.NOBRE, C.A. 2012. Fundamentos científicos das mudanças climáticas. São José dos Campos, Brasil: Rede Clima/INPE.OLSON, S.H. et al. 2010. Deforestation and malaria in Mâncio Lima County, Brazil. Emerging Infectious Diseases 16 (7): 1108-1115. Disponible em: .OTCA. 2010. Agenda estratégica de cooperação amazônica: aprovada na X Reunião de Ministros de Relações Exteriores do TCA. Brasília, Brasil.PACHECO, C., AGUADO, I.; MOLLICONE, D. 2011. Las causas de la deforestación en Venezuela: un estudio retrospectivo. BioLlania 10: 281-292.PALACIO, G. (ed.). 2009. Ecología política de la Amazonía: las profusas y difusas redes de la gobernanza. Bogotá, Colombia: ILSA; Ecofondo; Universidad Nacional deColombia.PDVSA (Petróleos de Venezuela S.A.). 2012. Informe de gestión anual 2011: PDVSA y filiales. Caracas, Venezuela. Disponible en: .PÉREZ-HERNÁNDEZ, R.; LEW, D. 2001. Las clasificaciones e hipótesis biogeográficas para la Guayana Venezolana. Interciencia 26 (9): 373-382.PFAFF, A. et al. 2007. Road investments, spatial spillovers, and deforestation in the brazilian Amazon. Journal of Regional Science 47 (1): 109–123.PINTO, L.F. 2011. Tucuruí: a barrragem da ditadura. Belém, Brasil: Jornal Pessoal.PINTO, L.F. 2012. A Amazônia em questão: Belo Monte, Vale e outros temas. São Paulo, Brasil: B4 Editores.PNUMA; OTCA; CIUP. 2009. GEO Amazonía: perspectivas del medio ambiente en la Amazonía. Panamá: Pnuma; Brasília, Brasil: OTCA. Disponible en: .RAY, D.; NEPSTAD, D.; MOUTINHO, P. 2005. Micrometeorological and canopy controls of fire susceptibility in forested Amazon landscape. Ecological Applications 15: 1664–1678.RINCÓN A. et al. 2006. Modelamiento de presiones sobre la biodiversidad en la Guayana. Revista Internacional de Sostenibilidad, Tecnología y Humanismo 211-244p.Disponible en: .RITTNER, D.; BORGES, A. 2012. Novas hidrelétricas vão alagar área equivalente a dez capitais. Valor Econômico, São Paulo, 26 set., Brasil, p. A4.RIVERO, S. et al. 2009. Pecuária e desmatamento: uma análise das principais causas diretas do desmatamento na Amazônia. Nova Economia 19 (1): 41-66.RODRIGUES, A. et al. 2009. Boom-and-bust development patterns across the Amazon deforestation frontier. Science 324: 1435-1437.RODRÍGUEZ, J.P. et al. (eds.). 2011. Representación digital de las Áreas Naturales Protegidas de Venezuela: Parques Nacionales, Monumentos Naturales, Refugios deFauna, Reservas de Fauna y Reservas de Biósfera. Caracas, Venezuela: Centro de Ecología, IVIC; Total Venezuela, S.A.ROLDÁN, R. 2005. Manual para la formación en derechos indígenas: territorios, recursos naturales y convenios internacionales. Quito, Ecuador: Abya-Yala.ROMERO-RUIZ, M., SARMIENTO, A. 2011. Presiones y amenazas de la Cuenca Amazónica. Bogotá, Colombia: Fundación Gaia Amazonas. Disponible en: .ROSA, I.M.; SOUZA JR., C.; EWERS, R.M. Canges in size of deforested patches in the brazilian Amazon. Conservation Biology 26 (5): 923-937.SALAZAR, L.F.; NOBRE, C.A.; OYAMA, M.D. 2007. Climate change consequences on the biome distribution in tropical South America. Geophysical Research Letters 34, L09708.Disponible en: .SÁNCHEZ-CUERVO, A.M. et al. 2012. Land cover change in Colombia: surprising forest recovery trends between 2001 and 2010. PLoS ONE 7 (8). Disponible en: http://www.plosone.org/article/info%3Adoi%2F10.1371%2Fjournal.pone.0043943SANTOS, M.A. et al. 2007. Mercado e dinâmica local da cadeia produtiva da pecuária de corte na Região Norte. Belém, Brasil: Banco da Amazônia. (Estudos Setoriais, 1).SASAKI, N.; Putz, E. 2009. Critical need for new definitions of ‘forest’ and ‘forest degradation’ in global climate change agreements. Conservation Letter 2: 1-7.SCHNEIDER, R. et al. 2002. Sustainable Amazon: limitations and opportunities for rural development. Washington, USA: World Bank. (World Bank Technical Paper - EnvironmentalSeries, 515).SCHOENE, D. et al. 2007. Definitional issues related to reducing emissions from deforestation in developing countries. Roma, Italia: FAO. (Forests and Climate ChangeWorking Paper, 5).SCHOR, T.; CARNEIRO FILHO, A.; TOLEDO, C. 2008. Fire and economics: understanding the Amazonía’s Fire Arch. En: Proceedings of the second international symposiumon fire economics, planning, and policy: a global view (Córdoba, 19-22 april 2004). Albany: U.S. Department of Agriculture - Forest Service. p. 99-109. Disponible en:.SFB (Serviço Florestal Brasileiro). 2011. Plano Anual de Outorga Florestal – PAOF 2012. Brasília, Brasil.SIERRA, R. (ed.). 1999. Propuesta Preliminar de un sistema de clasificación de vegetación para el Ecuador continental. Quito, Ecuador: Proyecto Inefan/GEF – BIRF yEcoCiencia.SIERRA, R.; CALVA, O.; CEVALLOS, J. 2010. Protocolo del sub-sistema de monitoreo remoto para el plan para la protección de los pueblos indígenas aislados. Quito,Ecuador: Ministerio de Ambiente; Ecociencia.SILVESTRINI, R. A. et al. 2011. Simulating fire regimes in the Amazon in response to climate change and deforestation. Ecological Applications 21: 1573-1590.SOARES, L.C. 1953. Limites meridionais e orientais da área de ocorrência da floresta amazônica em território brasileiro. Revista Brasileira de Geografia 15 (1): 3-122.SOUTHWORTH, J. et al. 2011. Roads as drivers of change: trajectories across the tri-national frontier in map, the Southwestern Amazon. Remote Sensing 3 (5): 1047–1066.SOUZA JR., C. et al. 2004. Avanço des estradas endógenas na Amazônia. Belém, Brasil: Imazon. (Série Amazônia em Foco). Disponible en: . (Consultado: 05 april 2012).SPRACKLEN, D.V.; ARNOLD, S.R.; TAYLOR, C.M. 2012. Observations of increased tropical rainfall preceded by air passage over forests. Nature 489: 282-285. Disponible en:.STEININGER, M.K. et al. 2001. Clearance and fragmentation of tropical deciduous forest in the Tierras Bajas, Santa Cruz, Bolivia. Conservation Biology 15: 856-866.STRAHLER, A. et al. 2006. Global land cover validation: recommendations for evaluation and accuracy assessment of global land cover maps. Luxemburg: EuropeanCommunities. (GOFC-GOLD Report, 25). Disponible en: . SWENSON, J.J. et al.2011. Gold mining in the peruvian Amazon: global prices, deforestation, and mercury imports. PLoS ONE 6 (4). Disponible en: .TRANCOSO, R. et al. 2010 Deforestation and conservation in major watersheds of the brazilian Amazon. Environmental Conservation 36: 277-288.TUNDISI, J. G. 1999. Limnologia no século XXI: perspectivas e desafios. Conferência de abertura do 7º Congresso Brasileiro de Limnologia. São Carlos, Brasil: <strong>Instituto</strong>Internacional de Ecologia.UNIDAD DE PLANEACIÓN MINERO ENERGÉTICA. 2007. Portafolio de proyectos de generación de energía. Bogotá, Colombia: UPME. Disponible en: . (Consultado: 29 julio 2011).UNODC Colombia 2009. Censos de cultivos de coca 2008. Bogotá, Colombia. Disponible en: .UNODC (Oficina de las Naciones Unidas contra la Droga y el Delito). 2011. Monitoreo de cultivos de coca. Gobiernos de Bolivia, Colombia, Ecuador y Perú. 63 p.URRUNAGA, J. et al. 2012. La máquina lavadora: cómo el fraude y la corrupción en el sistema de concesiones están destruyendo el futuro de los bosques de Perú.Washington, USA: EIA (Environmental Investigation Agency). Disponible en: .VAL, A.L.; SANTOS, G.M. (orgs.). 2011. GEEA: Grupo de Estudos Estratégicos Amazônicos. Manaus, Brasil: INPA. (Caderno de Debates, 4). Disponible en: .VALENTIM, J.F.; ANDRADE, C.M. 2009. Tendências e perspectivas da pecuária bovina na Amazônia brasileira. Amazônia: Ciência & Desenvolvimento 4 (8): 7-30.VERDUM, R. 2012. As obras de infraestrutura do PAC e os povos indígenas na Amazônia brasileira. Brasília, Brasil: Inesc. Disponible en: .VERÍSSIMO, A. et al. 1992. Logging impacts and prospects for sustainable forest management in an old amazonian frontier: the case of Paragominas. Forest Ecology andManagement 55: 169-199.VERÍSSIMO, A. et al (orgs.). 2011. Áreas Protegidas na Amazônia brasileira: avanços e desafios. São Paulo, Brasil: <strong>Instituto</strong> <strong>Socioambiental</strong>; Belém, Brasil: Imazon.VIEIRA, I.C.; SILVA, J.M.; TOLEDO, P.M. 2005. Estratégias para evitar a perda de biodiversidade na Amazônia. Estudos Avançados 19 (54): 153-164.VIEIRA, I.C. et al. 2008. Deforestation and threats to the biodiversity of Amazonía. Brazilian Journal of Biology 68 (4): 949-956. Disponible en: .VILLAS-BÔAS, A. (org.). 2012. De olho na Bacia do Xingu. São Paulo: <strong>Instituto</strong> <strong>Socioambiental</strong>. (Cartô Brasil <strong>Socioambiental</strong>, 5).WAY, F. 2012. Guyana & Suriname Oil and Gas Opportunities Promotions Project. Report prepared for Canada’s High Commissioner to Guyana and Ambassador to Suriname.Georgetown, Guyana. Disponible en: .WEINHOLD, D.; REIS, E.J.; Vale, P.M. 2012. Sustainability in the tropics: does a boom in deforestation lead to a bust in development? London: Grantham Research Instituteon Climate Change and the Environment. (Working Paper, 82).ZÚÑIGA, P. (coord.). 2011. Transformaciones en la Amazonía colombiana: retos para un desarrollo sostenible. Bogotá: Fundación Alisos.AbbreviationsSites consultedAndes Agua Amazonía - .Forest Sterwardship Council - .<strong>Instituto</strong> Brasileiro de Geografia e Estatística /Geociências - .<strong>Instituto</strong> de Manejo e Certificação Florestal e Agrícola - .<strong>Instituto</strong> de Planificación y Promoción de Soluciones Energéticas - .Pacto Intersectorial por la madera legal en Colombia - .Projeto TerraClass - .Represas en Amazonia - .Sistema de Información Ambiental Territorial de la Amazonia Colombiana - .Unidades de Conservação na Amazônia Brasileira - .ABT (Bolivia) Autoridad de Fiscalización y Control Social de Bosques y TierraACPC Asociación para la Conservación del Patrimonio de CutivireniACT The Amazon Conservation TeamAIDESEP-CIPTA Asociación Interétnica de Desarrollo de la Selva Peruana - Centro de Información y Planificación TerritorialANA (Perú) Autoridad Nacional del AguaANEEL (Brasil) Agência Nacional de Energia ElétricaANH (Colombia) Agencia Nacional de HidrocarburosANP (Brasil) Agência Nacional do Petróleo, Gás Natural e BiocombustíveisAPA Environmental Protection AreaBDEP Banco de Dados de Exploração e ProduçãoBDF Box of the chapter DeforestationBFI Box of the chapter Fires (Hot Spots)BHP Box of the chapter Hydroelectric PlantsBMN Box of the chapter MiningBNDES Banco Nacional de Desenvolvimento Econômico e SocialBOG Box of the chapter Oil and GasBR BrasilBRD Box of the chapter RoadsCDB Convention on Biological DiversityCEDIA Centro para el Desarrollo del Indígena AmazónicoCEPE Corporación Estatal Petrolera EcuatorianaCEPSA Compañía Española de PetróleosCIDOB Confederación de Pueblos Indígenas del Oriente de BoliviaCO ColombiaCOICA Coordinadora de Organizaciones Indígenas de la Cuenca AmazónicaCONAIE Confederación de Nacionalidades Indígenas del EcuardoCONELEC (Ecuador) Consejo Nacional de ElectricidadCOSIPLAN Consejo Interamericano de Infraestructura y PlaneamentoCPC Centro de Investigación ConjuntaCPE (Bolivia) Constitución Política del EstadoCRO Cordillera Real OrientalDEAL Direction de l’environnement, de l’aménagement et du logementDNPM (Brasil) Departamento Nacional da Produção MineralEC EcuadorECOLEX Corporación de Gestión y Derecho AmbientalECORAE <strong>Instituto</strong> para el Ecodesarrollo Regional AmazónicoEE Ecological StationEMBRAPA Empresa Brasileira de Pesquisa AgropecuáriaESA European Space AgencyFAN Fundación Amigos de la NaturalezaFAO Food and Agriculture Organization of United NationsFC Forest ConcessionsFE State ForestFGA Fundación Gaia AmazonasFLACSO Facultad Latinoamericana de Ciencias SocialesFN National ForestFSC Conselho de Administração FlorestalFUNAI Fundação Nacional do ÍndioGDF Chart of the chapter DeforestationGEF Global Environment FacilityGEG Greenhouse GasGFI Chart of the chapter Fires (Hot Spots)GHP Chart of the chapter Hydroelectric PlantsGIS Geographic Information SystemGMN Chart of the chapter MiningGOG Chart of the chapter Oil and GasGOREL Regional Government of LoretoGRD Chart of the chapter RoadsHydroSHEDS Hydrological data and maps based on Shuttle Elevation Derivatives at multiple ScalesIBAMA <strong>Instituto</strong> Brasileiro de Meio Ambiente e Recursos Naturais RenováveisIBC <strong>Instituto</strong> del Bien ComúnIBGE <strong>Instituto</strong> Brasileiro de Geografia e EstatísticaICMBio <strong>Instituto</strong> Chico Mendes de Conservação da Biodiversidade]IT Indigenous TerritoriesICV <strong>Instituto</strong> Centro de VidaIGAC (Colombia) <strong>Instituto</strong> Geográfico Agustín CodazziIIRSA Integración de la Infraestructura Regional SuramericanaIMAC <strong>Instituto</strong> de Meio Ambiente do AcreIMAZON <strong>Instituto</strong> do Homem e do Meio Ambiente da AmazôniaINCODER <strong>Instituto</strong> Colombiano de Desarrollo RuralIncra (Brasil) <strong>Instituto</strong> Nacional de Colonização e Reforma AgráriaINGEMMET <strong>Instituto</strong> Geológico Minero y MetalúrgicoINPE (Brasil) <strong>Instituto</strong> Nacional de Pesquisas EspaciaisIPAAM <strong>Instituto</strong> de Proteção Ambiental do AmazonasIPHAN (Brasil) <strong>Instituto</strong> do Patrimônio Histórico e Artístico NacionalISA (Brasil) <strong>Instituto</strong> <strong>Socioambiental</strong>IVIC <strong>Instituto</strong> Venezolano de Investigaciones Científicas, Centro de Ecología, Laboratorio de Biología de OrganismosMAE (Ecuador) Ministerio del AmbienteMDF Map of the chapter DeforestationMFI Map of the chapter Fires (Hot Spots)MHP Map of the chapter Hydroelectric PlantsMINAM (Perú) Ministerio del AmbienteMINEM (Perú) Ministerio de Energía y MinasMMN Map of the chapter MiningNOAA National Oceanic and Atmospheric AdministrationMOG Map of the chapter Oil and GasMRD Map of the chapter RoadsMTC (Perú) Ministerio de Transporte y ComunicacionesNARENA (Suriname) Natural Resource and Environmental AssessmentOCEP Oleoducto de Crudos PesadosOIT Organização Internacional do TrabalhoOTCA Organización del Tratado de Cooperación AmazónicaPCH Small Hydroelectric PlantsPDVSA Petróleos de Venezuela S.A.PANE (Ecuador) Patrimonio Nacional de Áreas Naturales del EstadoPE State ParkPE PerúPetroamazonas EP (Ecuador) Petroamazonas Empresa PublicaPETT-Loreto Programa Especial de Titulación de Tierras en LoretoPFS Proyecto Frontera SelvaPI Parque IndígenaPIX Parque Indígena do XinguPMOT Plan Municipal de Ordenamiento TerritorialPN Parque NacionalPNA Protected Natural AreaPPCDAm Plano de Ação para Proteção e Controle do Desmatamento na Amazônia LegalPRODES Projeto Monitoramento da Floresta Amazônica Brasileira por SatélitePROVÍAS NACIONAL (Perú) Proyecto Especial de Infraestructura de Transporte Nacional<strong>RAISG</strong> Amazonian Network of Georeferenced Socio-Environmental InformationRBi Biological ReserveRBiF Forest Biological ReserveRDS Sustainable Development ReserveREx Extractive ReserveRN National ReserveSDS Secretaria de Meio Ambiente e Desenvolvimento Sustentável do AmazonasSERGEOTECMIN (Bolivia) Servicio Nacional de Geología y Técnico de MinasSERNAP (Bolivia) Servicio Nacional de Áreas ProtegidasSH Historical SanctuarySIATAC Sistema de Información Ambiental Territorial de la Amazonía ColombianaSICNA Sistema de Información sobre Comunidades Nativas de la Amazonía PeruanaSIG Sistemas de Informação GeográficaSIMEX Sistema de Monitoreo de la Explotación MadereraSN National SanctuarySRTM Shuttle Radar Topography MissionSTF (Brasil) Superior Tribunal FederalTCO Tierra Comunitaria de OrigenTDF Table of the chapter DeforestationTRD Table of the chapter RoadsTFI Table of the chapter Fires (Hot Spots)THP Table of the chapter Hydroelectric PlantsTIPNIS Territorio Indígena y Parque Nacional Isiboro SécureTMN Table of the chapter MiningTOG Table of the chapter Oil and GasTREES Tropical Resources and Environment Monitoring by SatelliteUHE Hydroelectric UnitsUNDP United Nations Development ProgrammeUNMSM Universidad Nacional Mayor de San MarcosYPFV Yacimientos Petrolíferos Fiscales Bolivianos<strong>RAISG</strong> 64Amazonia under PressureAmazoniaunder Pressure 65 <strong>RAISG</strong>
Xingu River. Pará, Brasil.© Pedro Martinelli/ISA, 2002Savannah close to Santa Helena de Uiarem, Venezuela, border with Brasil.© Félix Grande Bagazgoita, 2008Nasepotiti Village, Panará indigenous people. Mato Grosso, Brasil.© André Villas-Bôas/ISA, 2002Wuarao community, Orinoco Delta. Amacuro Delta. Venezuela.© Federico Bellone, 1999 Sisi-wen Waterfall, Upper Cotingo River, Raposa Serra do Sol Indigenous Land.Roraima, Brasil. © Taylor Nunes, 2007Maloca belonging to ‘isolated’ indigenous people between the Itacoaí andJandiatuba Rivers, on the Brasil-Perú border.© Peetsaa/ Arquivo CGIIRC/Funai, 2011selo FSCSan Rafael Waterfall, Coca River. The latter will be adversely affected by the Coca CodoSinclair Hydroelectric Plant which is being built in Ecuadorian Amazonia with Chineseloans. © Juan Calles, 2010Headwaters of the Upano River, which rises in the Andes and flows into the Amazon.© Rubén Ramírez/Proyecto Andes Agua Amazonía,, 2012Salto do Sapo, Canaima National Park, Venezuela.© Federico Bellone, 1999printed by:Pancrom Indústria Gráfica, São Paulo - Brasilimpression:1.000Forest in the foothills of the Serra da Mocidade National Park, Brasil-Venezuela border.Roraima, Brasil. © Taylor Nunes, 2006Purus River, affluent flowing into the right bank of the Amazonas river. Brasil.© Paulo Santos, 2001Indigenous settlement in the savannah at the base of Mount Roraima, Bolívar state.Venezuela.© Federico Bellone, 1999